Article

Growth of Lactiplantibacillus plantarum BG112 in Batch and Continuous Culture with Camellia sinensis as Prebiotic

by
Óscar Ariel Rojas-Rejón
*,
Carlos Gonzalez-Figueredo
,
Ana Ruth Quintero-Covarrubias
and
Alejandro Saldaña-Jáuregui
Departamento de Procesos Tecnológicos e Industriales, Instituto Tecnológico y de Estudios Superiores de Occidente (ITESO), Periférico Sur Manuel Gómez Morín. 8585, Col. ITESO, San Pedro Tlaquepaque 45604, Mexico
*
Author to whom correspondence should be addressed.
Fermentation 2024, 10(9), 487; https://doi.org/10.3390/fermentation10090487
Submission received: 18 July 2024 / Revised: 12 September 2024 / Accepted: 13 September 2024 / Published: 19 September 2024
(This article belongs to the Section Probiotic Strains and Fermentation)

Abstract

:
This work aimed to study the effect of Camellia sinensis extract (CSExt) as a particular growth promoter of Lactiplantibacillus plantarum (LP) in batch and continuous production processes. Growth conditions were 1% (v/v) inoculum, pHC = 6.5, 1% of dissolved oxygen (D.O.), 37 °C, and 150 rpm in a 0.2 L bioreactor using a commercial MRS broth (de Man, Rogosa, and Sharpe) and 1% (v/v) or 10% (v/v) CSExt according to the experimental design. In batch experiments, the maximum specific growth rate and the affinity constant increased with the increase in CSExt. In continuous culture, biomass production increased significantly with the addition of 1% (w/v) CSExt at 0.15 (1/h). Kinetic parameters adjusted were similar to those reported in the literature. Substrate affinity and the specific growth rate increased significantly in the presence of CSExt in batch and continuous cultures. Based on the results, prebiotics from plant extracts may function as growth promoters in specific physiological stages. This is the first report showing the change in kinetic parameters of a probiotic strain growing in crude plant extracts.

1. Introduction

Lactiplantibacillus plantarum (LP) is a homofermentative and facultative microaerophilic bacteria frequently isolated from fermented milk and animal bowels [1]. LP is a lactic acid-producing bacteria capable of fermenting simple carbohydrates, such as glucose and galactose [2]. LP is of interest to the food industry since it may act as a probiotic and food additive [3]. There is sufficient evidence that lactic acid bacteria play a crucial role in regulating the metabolic processes of the intestinal microbiota [4]. However, the alteration of microbiota diversity and pathogen population can lead to the development of chronic diseases in the host, such as gastrointestinal disorders and infections, inflammatory diseases, and cancer [5,6]. Food products supplemented with live microorganisms have demonstrated the ability to maintain and improve the intestinal microbial balance by mediating an antagonistic effect of pathogenic microorganisms or stimulating the immune system [7]. Recent developments in the field of metabolomics and microbiomics have led to a renewed interest in probiotic production, which includes strains from Bifidobacteria (B. animalis and B. infantis), Lactobacillus (L. acidophilus, L. plantarum, L. rhamnosus, L. casei), and Saccharomyces (Saccharomyces boulardii) families [3,5,8,9,10,11]. On an industrial scale, the economic viability of this bioprocess requires the use of potential and low-cost inputs that specifically help preserve the viability and activity of probiotics [12,13].
Prebiotics are generally non-digestible carbohydrates that act as growth-promoting substances through the fermentation pathways of probiotic bacteria [14]. The term prebiotic is related to a beneficial effect of both the host and selective probiotic bacteria [15]. Plant extracts contain high concentrations of bioactive compounds derived from secondary metabolism. These compounds directly affect human physiologic variables as well as cell metabolism. The substances with reported beneficial effects include terpenoids, phenolics, and diverse alkaloids. Phenolics are considered the main group with special attention in cancer research [16].
Further studies have shown that species such as Camellia sinensis (CS), also known as green tea, contain an important amount of flavonols, catechins, and theaflavins [17]. Green tea extract (CSExt) is an essential source of antioxidants with the capability of scavenging reactive oxygen and nitrogen species, generating a positive effect on human metabolism [18] as well as stimulating microbiome metabolism and interaction [19], since recent studies consider them an excellent source of prebiotics [20,21,22]. Because of these properties and their low cost, green tea leaves represent an attractive input in probiotic cultures, increasing cell viability and biomass concentration. The development of economically viable processes is desirable for microorganism production at an industrial scale whether in batch or continuous production processes. Natural resources and viable processes based on sustainability could be achieved in coupled and simultaneous processes. The mixture and synergy of a probiotic and prebiotic are called “symbiotic”, and this enhances the physiological effects of each component in the human body [23]. For this reason, the study of probiotic growth in culture media enriched with prebiotic sources to increase cell biomass yield and cell viability is of interest.
Although extensive research has been carried out on prebiotics and their interactions between the host and microbiome [7], to date, there is much less information about the specific interactions between non-carbohydrate prebiotics and probiotics involving large bioreactor-scale production [24]. A few efforts have been directed to enhancing probiotic production through the design of novel culture media [25,26,27,28], the optimization of the bioreactor operation conditions [13], and the modification of the bioreactor operation mode [29]. The production of high amounts of biomass and product are desirable in economic and industrial processes, since it allows a reduction in the processing time and production costs [30]. Also, several research groups have been working extensively on improving lactic acid production from lactic acid bacteria (LAB) [31,32] and probiotic biomass [29,30,33], leaving aside cell viability. Currently, there are no data on Lactiplantibacillus plantarum cultures with CSExt as a growth promoter in batch and continuous processes concerning kinetic parameters and kinetic growth models. Since cell viability is essential for the food industry and the development of functional foods [34], it is of interest to study and develop a novel production process based on CSExt as a growth promoter and preserving factor in batch and continuous cultures. The main aim of this study was to investigate the effect of CSExt on growth and lactic acid production in batch and continuous cultures under optimal controlled conditions. Understanding the link between CSExt as a non-carbohydrate prebiotic and the growth of LP in specific physiological states may guide the development of efficient industrial processes with high yields, low cost, and long cell viability.

2. Materials and Methods

2.1. Microorganisms and Growth Conditions

Lactiplantibacillus plantarum BG112 is a food and pharmaceutical strain from SACCO®, Tlajomulco, México. LP cells were grown in 250 mL Erlenmeyer flasks with 50 mL of MRS broth [35] to reactivate lyophilized powder and conduct all experiments. Growth conditions were 37 °C, 150 rpm, pHC = 6.5, 1% of dissolved oxygen, and the pH was controlled (pHC) to 6.5 with NaOH (10 M). The inoculum propagation platform was 24–12–6 h (10% v/v) to obtain cells in the middle of the exponential growth phase.

2.2. Camellia Sinensis Extract

A CSExt infusion was prepared from 1% (w/v) Green Tea Alessa tea, (Salutare, S.A de C.V., Naucalpan, México). To obtain the crude extract, 1 g of the tea leaves was steeped in 100 mL of distilled water at 90 °C for 10 min to ensure optimal extraction of the active compounds. The resulting infusion was then filtered through successive filtration stages, first through a 0.45 µm filter and subsequently through a 0.20 µm filter to remove any particulate matter and ensure sterility. The sterile extract was stored frozen at −4 °C until needed for batch and continuous culture experiments.

2.3. Batch Experiments

LP cultures grew in a fully instrumented stirred tank bioreactor (Applikon, bio My-control, GETINGE, Getinge, Sweden) with a working volume of 0.2 L. Culture conditions remained constant. Batch experiments included two different pulses of CSExt (1% (v/v) and 10% (v/v) of the working volume). The operation time was 24 h, and at different times, samples were taken and kept at 4 °C until further analysis. The determination of cell viability was at the sampling moment.

2.4. Continuous Experiments

The CSExt 1% (v/v) experiment included a continuous culture of LP with an operative volume of 0.15 L and dilution rates from 0.1 to 0.35 (1/h). Two peristaltic pumps synchronized the inflow and outflow to and from the bioreactor system (Masterflex, Metrohm, Barendrecht, Nederland) to maintain a constant volume. At least seven residence times passed until the change in dilution rate to consider the steady state. A pulse of CSExt 1% (v/v) was added at the beginning of each dilution rate, and samples were taken and stored to determine the effect over the cell biomass, glucose consumption, and lactic acid formation.

2.5. Growth and Analyte Determination

Optical density correlated to a dry cell weight curve that quantified cell growth in a microplate reader at 660 nm (Thermo Fisher Scientific, Joensuu, Finland). Centrifugation of samples allowed the recovery of cell biomass pellets for optical density determination and supernatants for determining the concentration of analytes. The determination of soluble analytes (glucose and lactic acid) was performed using the YSI SELECT 2950 biochemistry analyzer (YSI, Yellow Springs, OH, USA).

2.6. Mathematical Model

An unstructured kinetic model based on Monod kinetics [36] in combination with a product inhibition model proposed by Levenspiel [37] described cell growth as follows:
d X d t = μ M A X × S K S + S · 1 P P M A X n · X
where X is the dry cell weight (g/L), t is time (h), µMAX is the maximum specific growth rate (1/h), KS is the substrate affinity (g/L), S is substrate (g/L), P is product (lactic acid) (g/L), PMAX is the maximum inhibitory concentration of product (g/L), and n is toxic power (n = 1).
Glucose consumption was adjusted to biomass growth of LP as follows:
d S d t = 1 Y X S · d X d t
where Y X S is the biomass/substrate yield (g/g).
The Luedeking–Piret model described lactic acid production [38]. It includes a production term associated with growth rate and another term unrelated to growth rate but related to biomass concentration as follows:
d P d t = α · d X d t + β · X
where α is the term associated with growth rate (g/g), and β is the non-growth-associated term, but it is related to the biomass concentration (g/g∙h). Curve fitting with the squared sum of errors between the experimental data and the data obtained from the model allowed the acquisition of the kinetic parameters using MATLAB software (R2019a). Fitting polynomials had a correlation index of R2 > 0.98.

2.7. Improvement Analysis

The relative behavior index [39] helped with the analysis of cell biomass, glucose consumption, and lactic acid formation to evaluate treatments with CSExt. Positive values of the index mean an improvement, whereas negative values identify inhibition in a given treatment compared to that of the control. The relative performance index is represented as follows:
ξ = 0 t f f P t d t 0 t f f c t d t 0 t f f c t d t · 100
where ξ represents either the biomass index (BI), residual glucose index (RGI), or the lactate index (LI), fp(t) is either the time course of biomass production, glucose consumption, or product formation of a given treatment, fc(t) ibidem for the control, and tf is the end time of the batch process.

2.8. Statistical Analyses

ANOVA was conducted with SigmaPlot v14 (Grafiti, Palo Alto, CA, USA) to determine the effect of batch treatments with CSExt compared to the control. All experiments were performed in triplicate.

3. Results

3.1. Batch Cultures

The growth of LP in Man, Rogosa, and Sharpe culture media in a fully instrumented stirred tank bioreactor with CSExt (problem) and without CSExt (control experiment) allowed the acquisition of kinetic parameters, as shown in Table 1. The time course biomass concentration values of control (0% CSExt), 1% CSExt, and 10% CSExt are shown (Figure 1). The lag phase of all cultures was barely perceptible at 2.5 h for all cultures due to the correct inoculum propagation strategy. After the lag phase, all conditions exhibited the exponential growth phase until 9 h of culture and most of the cell biomass produced took place in the first 10 h of culture. The maximum specific growth rates obtained were 0.82 ± 0.01, 1.27 ± 0.04, and 1.95 ± 0.03 for the control, 1% CSExt, and 10% CSExt, respectively. The maximum specific growth rate increased 27 and 137% when LP cultures included CSExt, and as a consequence of the increase in growth rate, the maximum cell biomass concentration increased from 3.57 ± 0.06 g/L to 4.8 ± 0.00 and 6.10 ± 0.01 g/L for 1% and 10% CSExt, respectively.
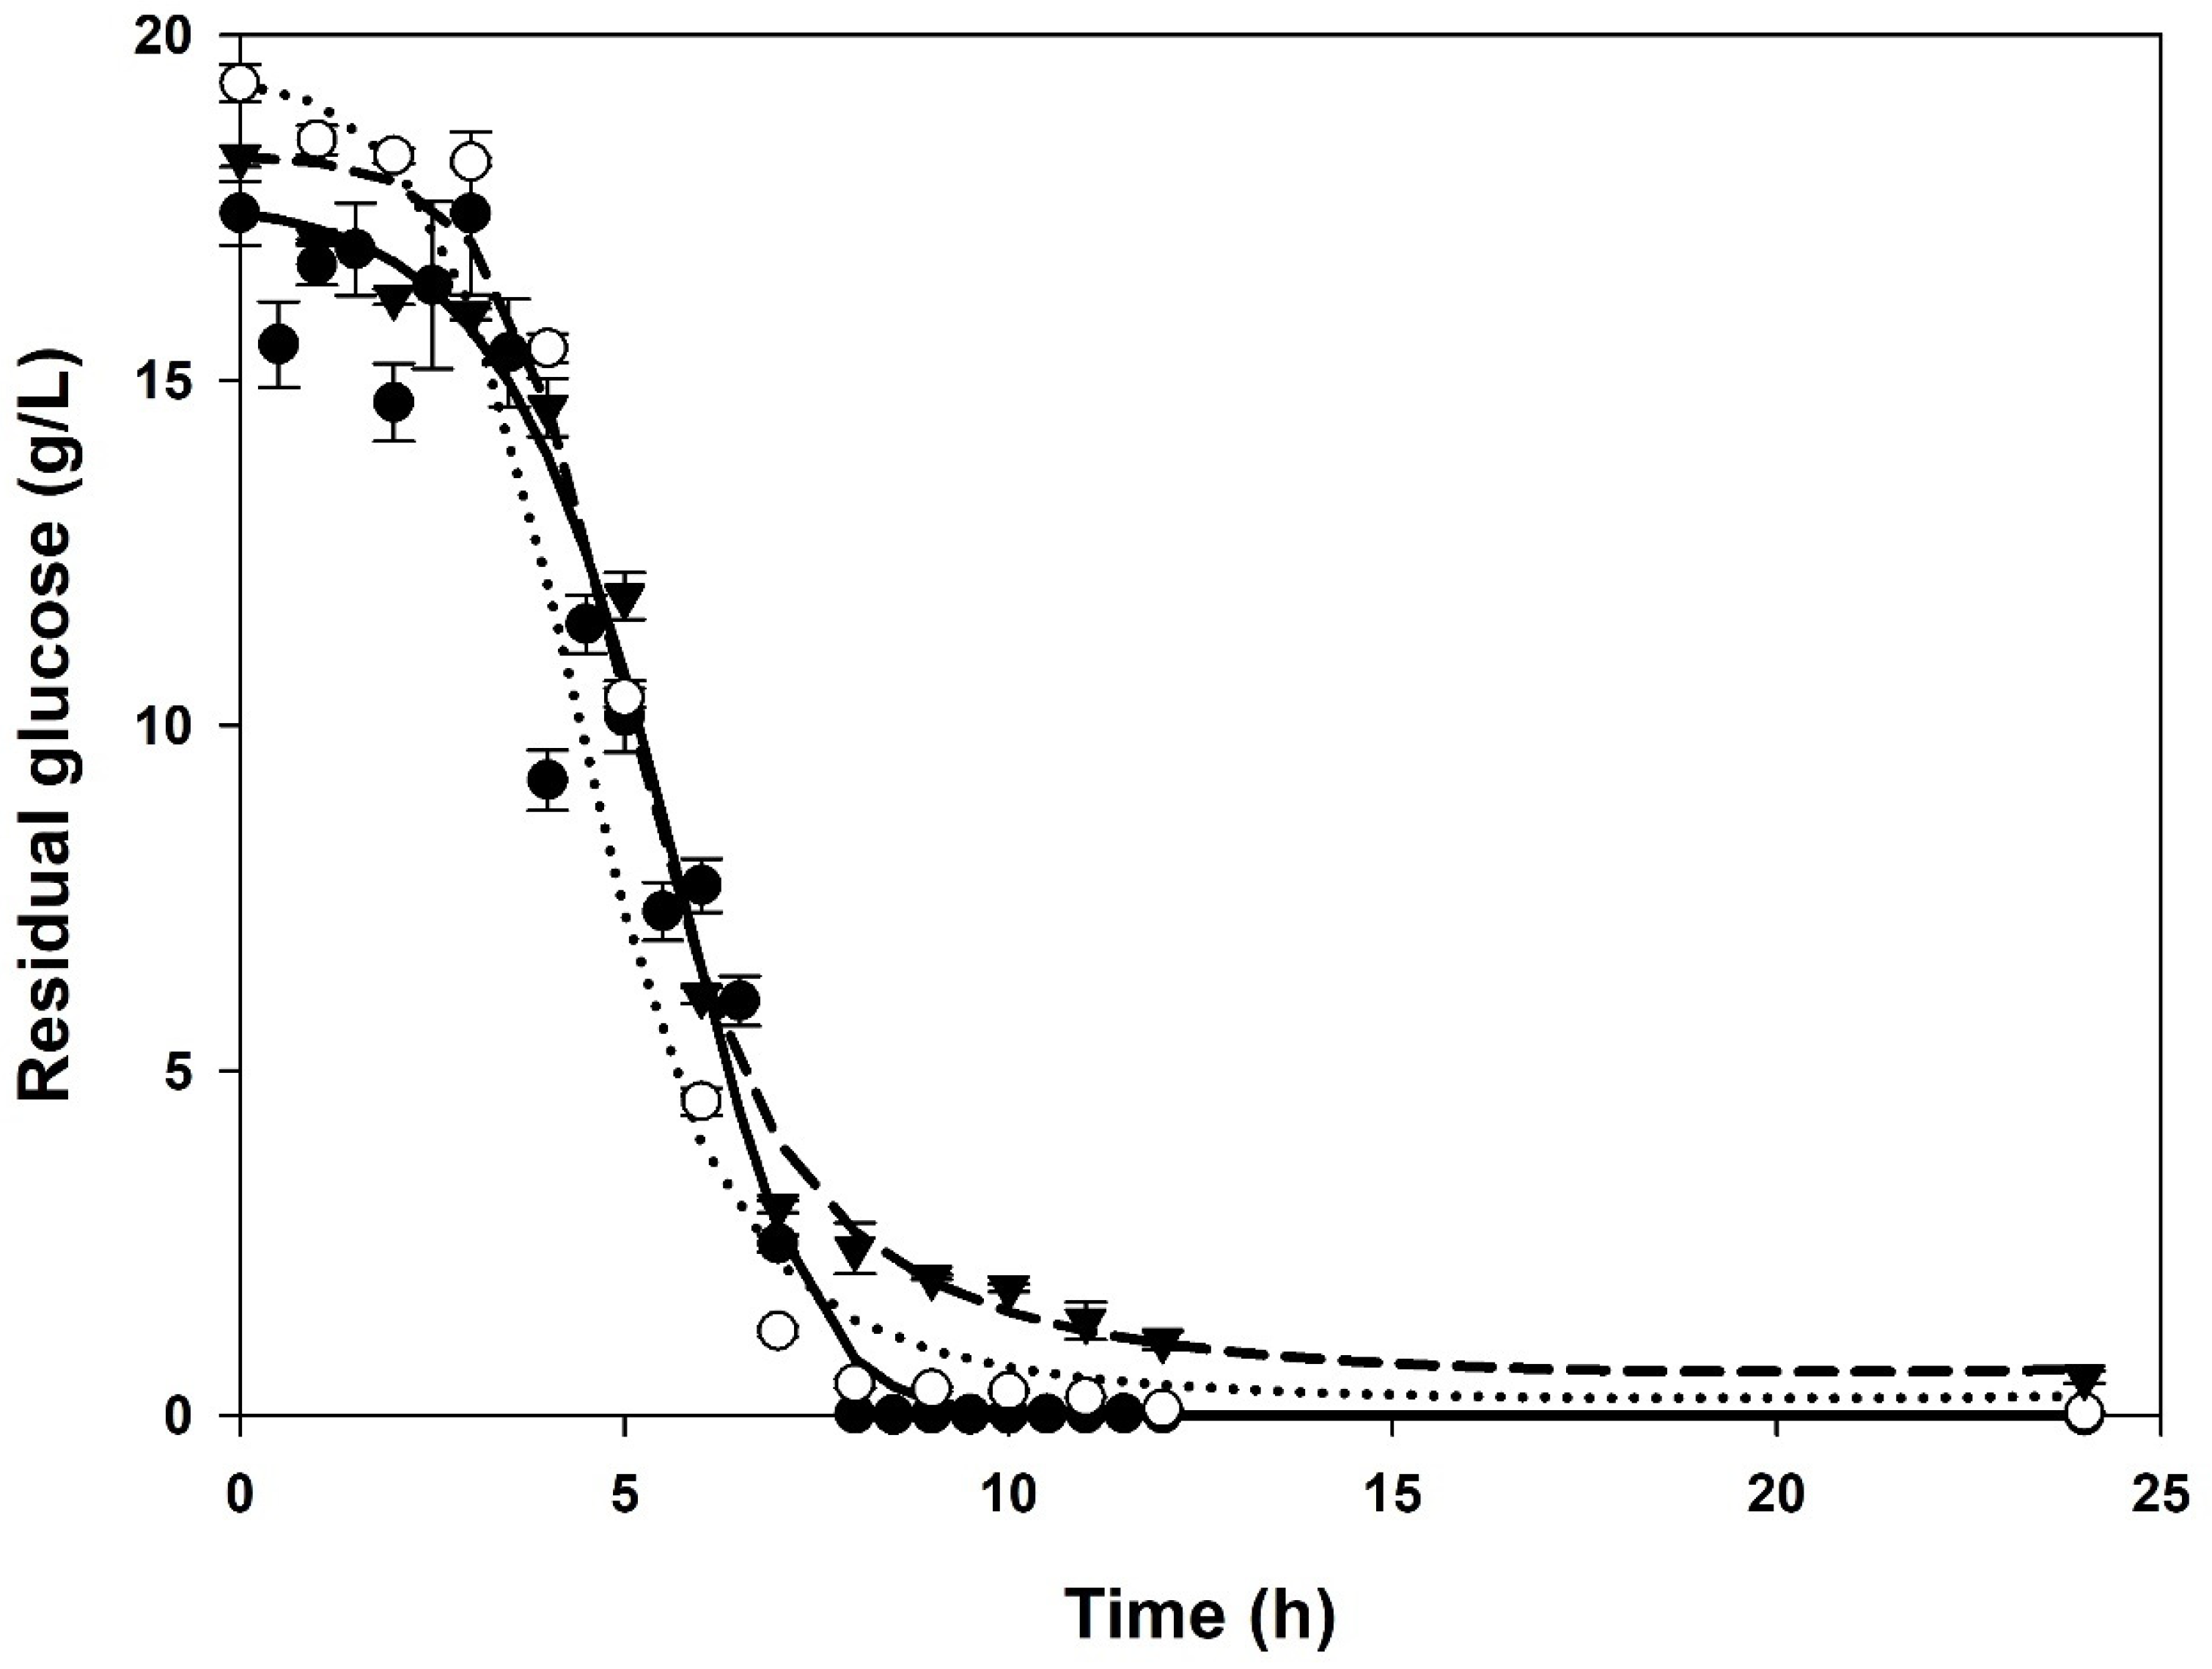
There were no significant statistical differences between the control and treatments (1 and 10% CSExt) regarding the glucose consumption profile. Furthermore, the time course substrate curves did not differ, since only a slight delay with the 10% CSExt is shown in Figure 2. The kinetic analysis demonstrated that the substrate affinity constant (KS) changed with the addition of CSExt from 0.68 ± 0.00 g/L to 2.76 ± 0.12 and 9.89 ± 0.21 g/L for 1 and 10% CSExt, respectively. This change provided information about the possible influence of tea extracts concerning cell growth, since they may enhance the LP metabolic processes at the induction level and provide an additional substrate source. The cell-to-substrate yield also increased with the addition of CSExt from 0.19 ± 0.00 to 0.22 ± 0.01 and 0.32 ± 0.01 for 1% and 10% CSExt, respectively.
The kinetic model described the growth of LP as well as product formation. The time course product formation followed the growth curves, indicating a growth-associated model production. The term related to growth rate (α) from the Luedeking–Piret model changed with CSExt concentration [38]. Practically all the lactic acid was obtained during the growth of LP, since the independent term of the Luedeking–Piret model (β) is negligible. Furthermore, the addition of CSExt did not alter the primary metabolism characteristic of microaerophilic lactic acid bacteria [40].
Moreover, a significant increase in lactic acid production was found, as shown in Figure 3. The maximum lactic acid production increased from 10.42 ± 0.32 g/L to 20.98 ± 0.01 and 19.76 ± 0.00 g/L for 1% and 10% CSExt cultures, representing an increase of at least 100% compared to the control with the same culture media. The lactic acid production was correlated with biomass formation, since it is the end product of the microaerophile growth of LP, and an increase in cell biomass generates a proportional rise in lactic acid concentrations. The maximum lactic acid concentration found in CSExt cultures indicates the redirection of carbon flow to the primary metabolism. The behavior index displayed an increase in cell biomass formation, substrate consumption, and lactic acid production. With the addition of 1% and 10% of CSExt, the cell biomass formation increased by 33% and 69%, respectively, as shown in Table 2.
Concerning substrate consumption and despite the statistical analysis, the behavior index obtained from the numerical integration of time curves indicates an increase in substrate consumption with both CSExt doses. Regarding lactic acid production, the most significant increase was found in the 1% CSExt treatment. The comparison between 1 and 10% showed a negative index, which may indicate a slight metabolism decrease for product formation with the increase in CSExt.

3.2. Continuous Cultures

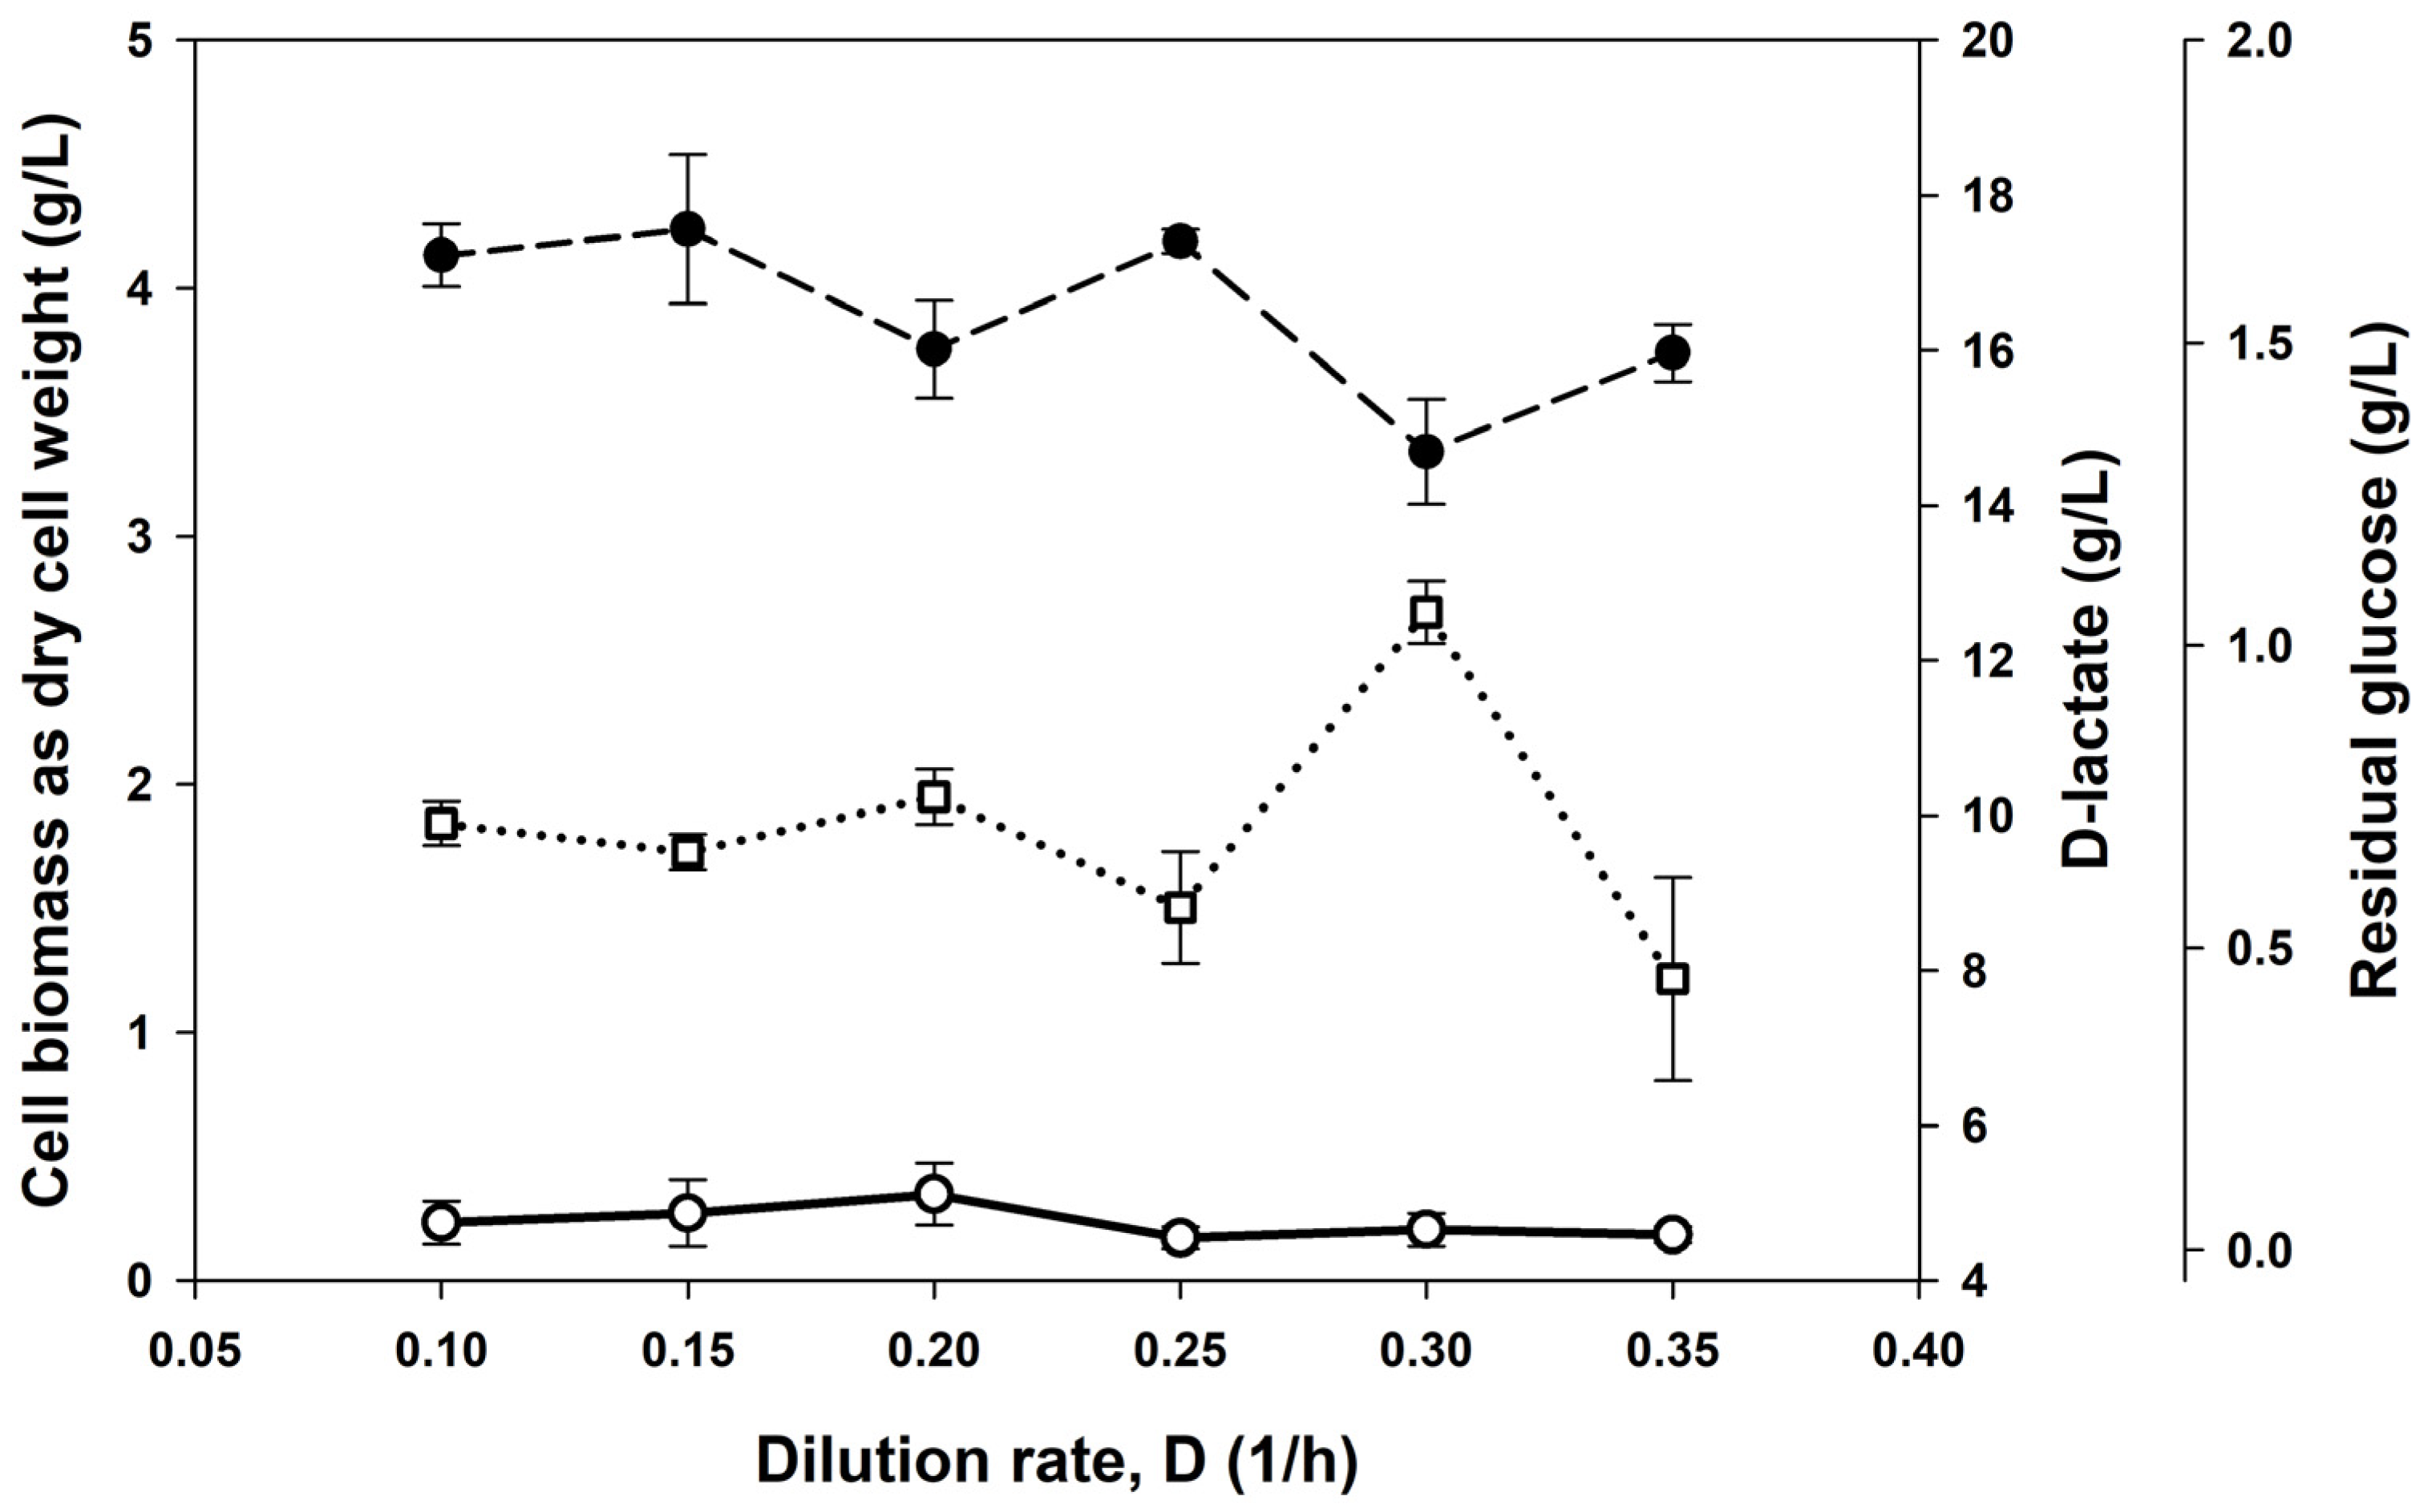
Continuous cultures of Lactiplantibacillus plantarum in MRS culture media as control growth were conducted. The continuous culture of LP in controlled conditions at several dilution rates ranging from 0.10 (1/h) to 0.35 (1/h) is shown in Figure 4. At every dilution rate proposed, we established the metabolic state with a highly selective response to environmental conditions by means of the inflow rate. Th goal was to match the mechanical dilution rate with the specific growth rate. Between each dilution rate, at least seven residence times were allowed before considering that the culture was in a steady state. From this point, samples were taken, and analytes were determined. The cell biomass concentration, lactic acid production, and residual glucose obtained in continuous culture were 3.90 ± 0.34, 9.83 ± 1.60, and 0.05 ± 0.03 g/L, respectively, as shown in Figure 4. Between 0.10 (1/h) and 0.25 (1/h) dilution rates, biomass and lactate formation exhibited a steady behavior. It is worth mentioning that under a steady state and among the dilution rates tested, biomass and lactate concentrations were similar to those observed in batch cultures under control conditions.
When the dilution rate reached 0.30 1/h, a decrease in cell biomass followed by an increase in lactate formation was observed, and no perceptible changes in residual glucose concentration were detected. This could be due to a specific metabolic state where biochemical pathways and carbon flux are directed to lactic acid production instead of biomass formation. Furthermore, the response of the microorganism to a specific change in a steady-state condition evidenced the effect of such a modification over the variable affected, such as a perturbance in biomass and lactate formation.
To comprehensively assess the impact of CSExt on the physiological and metabolic behavior of LP, a series of continuous culture experiments were conducted. The primary goal was to ascertain whether LP engages with prebiotics at minimal dosages, thereby establishing specific metabolic states. Throughout various dilution rates, a 1% (v/v) CSExt pulse was introduced after the culture reached seven residence times ( τ ). This concentration was chosen based on the assumption that it represents the minimum conceivable influence of CSExt as a carbon source, and based on the batch experiments, the concentration was sufficient to enhance the formation of both biomass and lactate.
Observations from batch experiments indicated no discernible contribution of CSExt to the carbon source, as evidenced by the absence of an increase in glucose consumption profiles. However, it was noted that the addition of 1% CSExt in batch experiments led to elevated levels of both biomass and lactic acid production. Consequently, the continuous experiments incorporated the use of 1% CSExt. Upon achieving steady-state conditions after 7 τ , samples were systematically collected at different time points to elucidate the impact of CSExt addition as a pulse on lactic acid production and cell biomass formation.
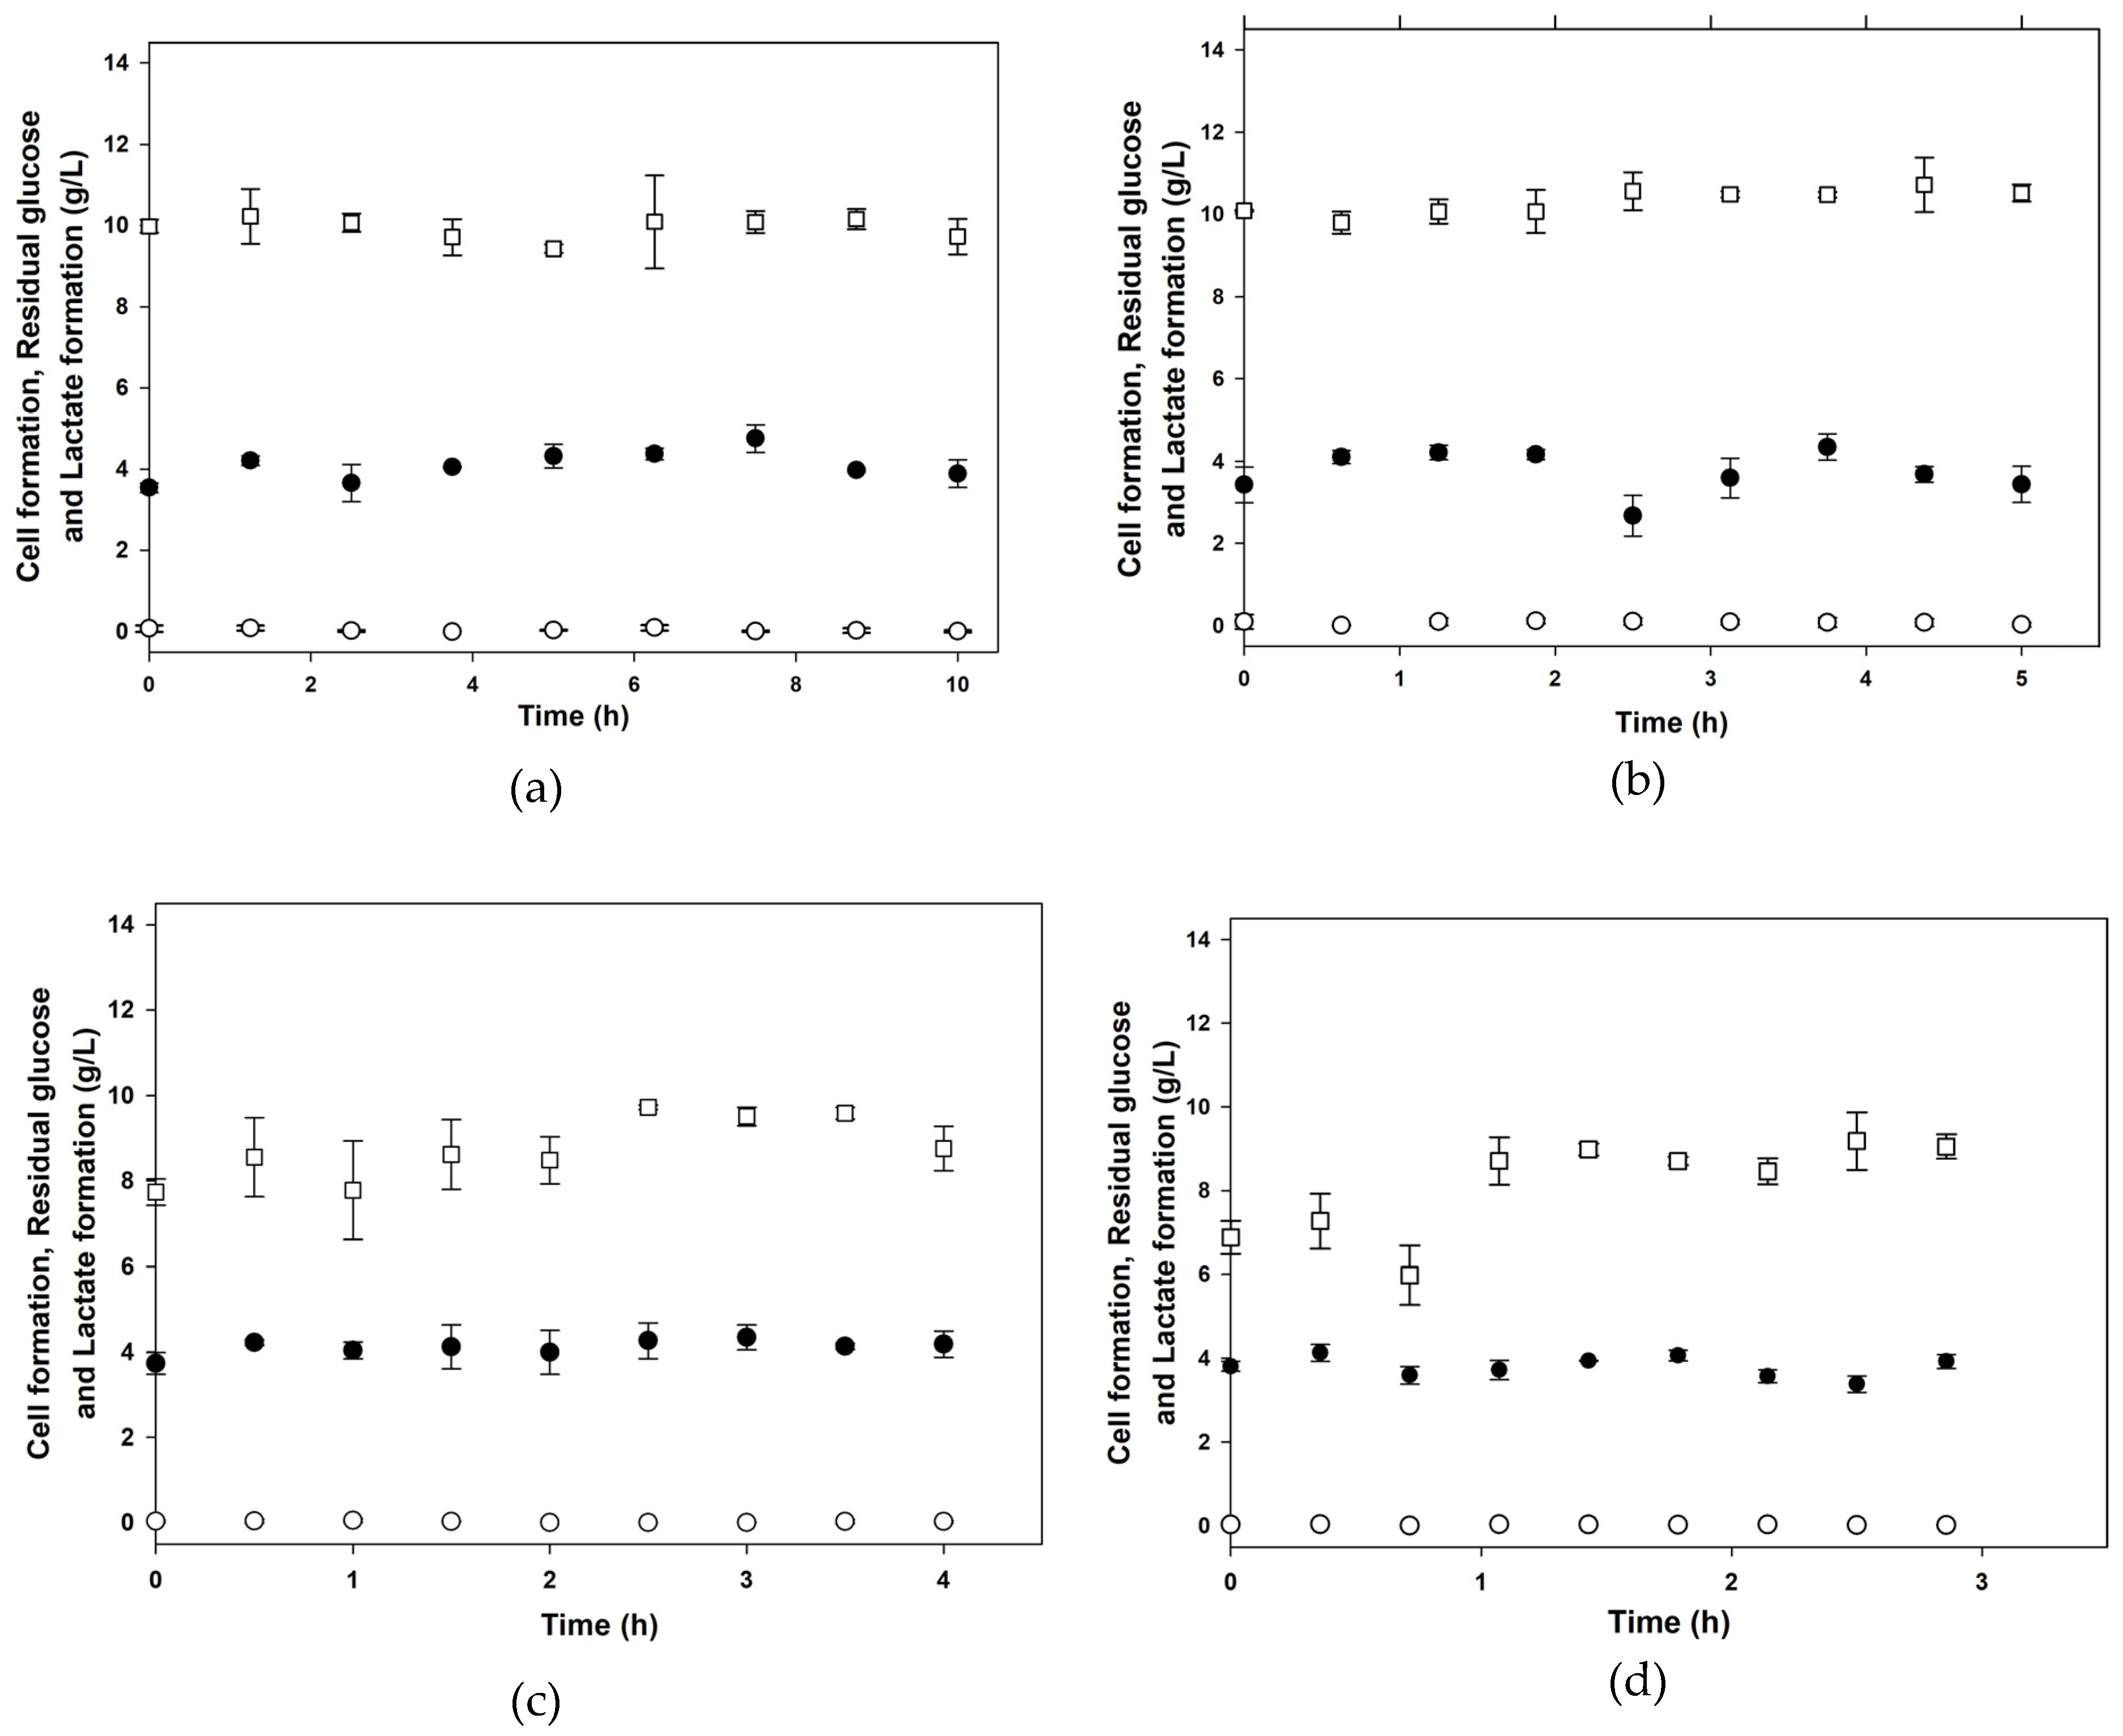
Continuous culture experiments involving CSExt were conducted across a range of mechanical dilution rates (D), from 0.10 1/h to 0.35 1/h, as shown in Figure 5. Across all dilution rates, except at 0.15 1/h, there was no discernible difference between the control and the 1% CSExt, after 7 τ . However, at the 0.15 1/h dilution rate, a notable perturbation in biomass concentration and lactate production was observed following the preset steady-state conditions. To comprehensively analyze this disturbance over time, a series of multiple samples were systematically collected until 7 h had elapsed from the CSExt pulse.
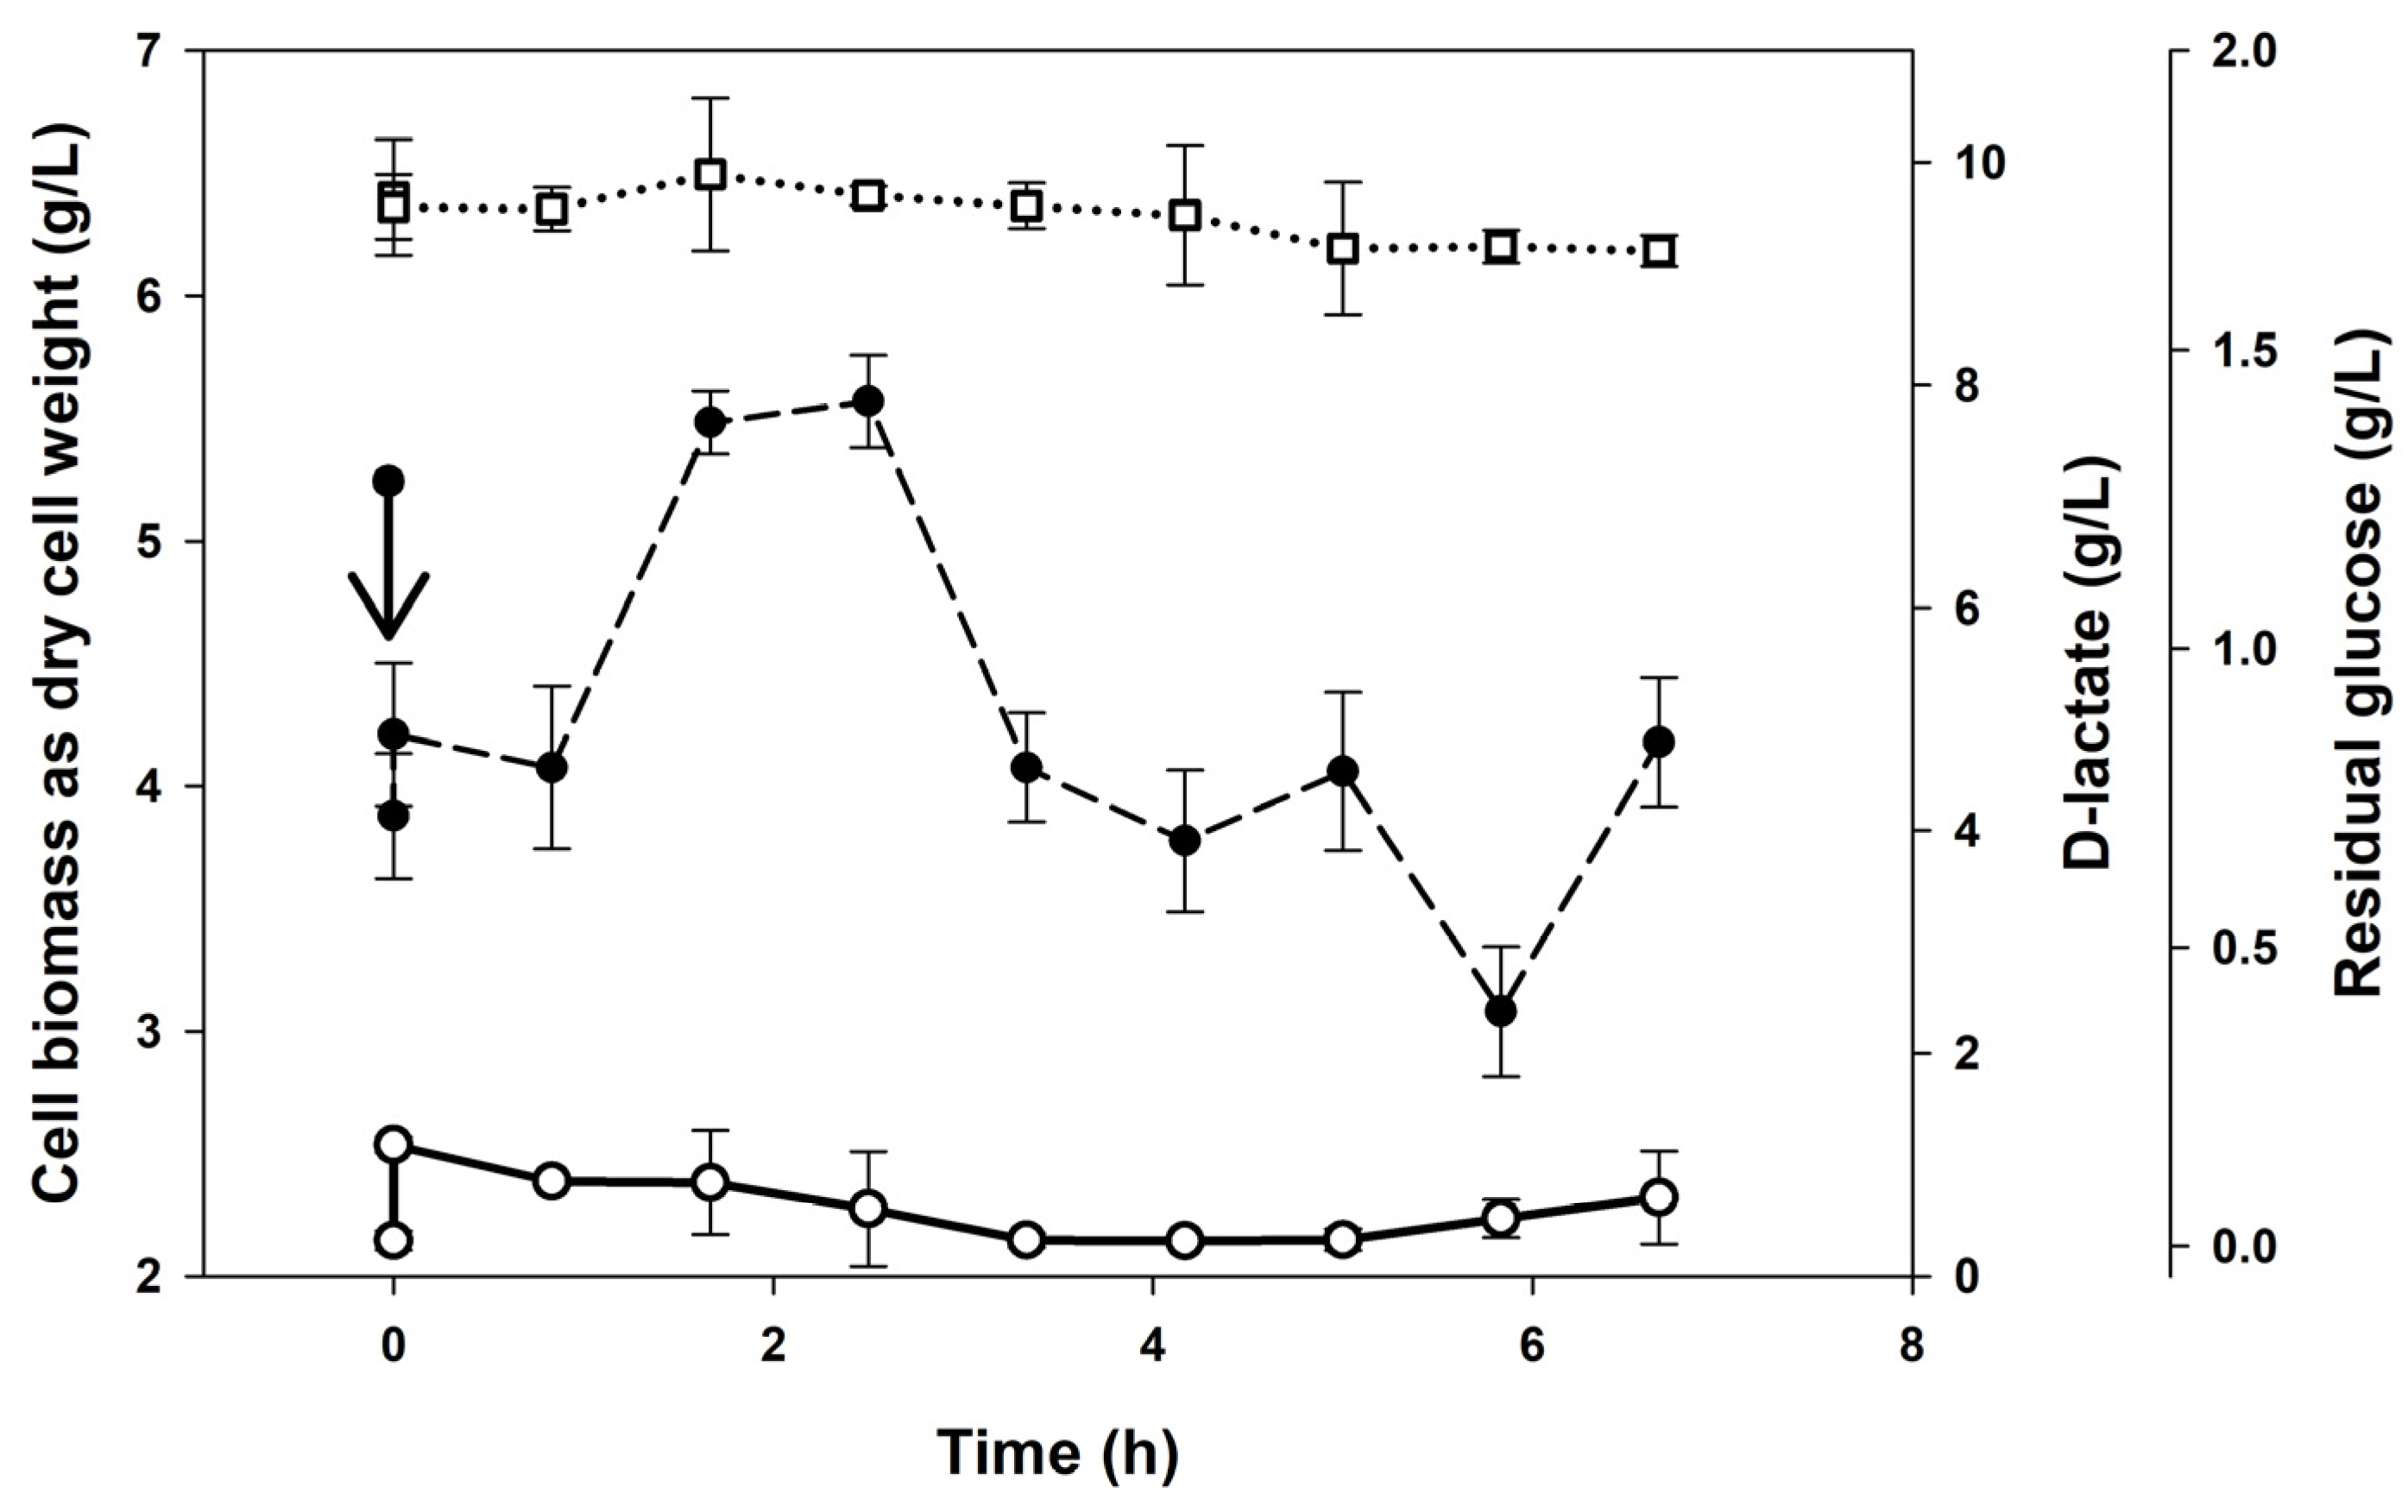
Figure 6 illustrates the culture with 1% (v/v) CSExt at a dilution rate of 0.15 1/h. Within the first 1.5 h of the culture, a distinct increase in biomass formation and a perturbation in lactic acid production were evident. Importantly, it should be noted that despite the addition of 1% CSExt, no increases in glucose or total sugar concentration were observed. The biomass formation increased from 4.07 ± 0.33 g/L to 5.70 ± 0.18 g/L with the introduction of 1% CSExt. Notably, at no other dilution rate did the addition of 1% CSExt elicit either a positive or negative effect.

4. Discussion

Batch experiments were instrumental in acquiring crucial kinetic parameters, which are essential for industrial scale-up and the development of multiple simulations. CSExt pulses demonstrated a consistent increase in both final biomass and product concentration, at least at the two concentrations evaluated, 1% (v/v) and 10% (v/v) CSExt. This aligns with reported kinetic data showing similar cell biomass concentrations and specific growth rates for Lactobacillus casei in a formulated goat milk culture media [29]. The highest biomass productivity, 0.25 g/(L∙h), was achieved with 10% (v/v) CSExt, while the highest lactic acid formation productivity, 0.87 g/(L∙h), was obtained with 1% (v/v) CSExt. Productivities were determined by the ratio of maximum values measured at the end of fermentation. The use of CSExt allowed higher biomass and lactate productivities compared to the one reported for Lactobacillus casei in batch cultures with 50 g/L of lactose as the sole carbon source [29], Lactobacillus amylovorus in batch culture and 20 g/L of glucose [9], and Lactobacillus salivarius in an optimized culture media with 25 g/L [41].
The primary constituents of Camellia sinensis tea leaves are polyphenols, constituting from 25% to 35% (dry basis), while saccharides such as polysaccharides and monosaccharides account for 10% (dry basis) [42]. Notably, phenolics and catechins present in CSExt significantly improved biomass production in batch culture, a finding supported by previous studies on Lactobacillus casei ATCC 393, where growth and viability were enhanced with the addition of green and black tea extracts [43]. However, numerical analyses of the effects of tea extracts during the growth and fermentation of probiotic strains were lacking in these reports. One of the objectives of this study was the kinetic analysis of LP growth with the addition of green tea extract as a growth promoter; however, no data about CSExt composition were available. Recent data indicate the presence of fructo-oligosaccharides (FOS) [44,45,46,47] and phenolic compounds in plant extracts [48], suggesting that the increase in biomass yield could be attributed to the presence of a carbon source metabolizable and incorporable by LP. Subsequent experiments using isolated components from the extract are essential to pinpoint and identify the specific growth-promoting compound.
The term prebiotic has been understood as a non-viable food ingredient which is selectively metabolized by beneficial intestinal bacteria [49]. Nonetheless, ongoing debates persist, with some authors arguing that prebiotics are exclusively non-digestible carbohydrates [50], while others assert that the native microbiota interacts metabolically with polyphenolics [43], transforming polymeric prebiotics into easily absorbable phenolic compounds, generating a beneficial effect on hosts, such as a cancer chemoprevention compound [50].
While batch experiments revealed a positive effect of CSExt on biomass and product formation, the dynamic nature of cellular metabolism, physiology, chemical species, metabolic end products, and environmental growth conditions in classical batch production processes necessitates a detailed analysis. Continuous culture, maintaining a constant metabolic and physiological state in the steady state [51], offers a more stable platform for such analyses [3,52,53]. The application of a specific dilution rate emerges as a strategic approach to enhance product biomass yields or direct metabolism towards biomass formation in industrial-scale processes [54,55]. After examining physiological states at various growth rates (mechanical dilution rates), an abnormal behavior in biomass and lactate production was observed at 0.15 1/h. This finding provides a basis for establishing optimization criteria in batch and fed-batch processes by attempting to maintain this specific growth rate for as long as possible. Comparable results were observed with Clostridium acetobutylicum in continuous culture with cell recycling, where solvent production increased at a specific growth rate [56].
Further research is necessary to elucidate the mechanism and components that promote cell proliferation and increase lactic acid production. It is hypothesized that the high content of phenolic compounds stimulates the cell division cycle at a genetic level and redirects the flow of carbon towards biosynthesis processes. Understanding these mechanisms will enable the development of industrial production processes using Lactiplantibacillus plantarum strains optimized for cell proliferation.

5. Conclusions

These findings underscore that specific biochemical pathways and physiological states, or membrane permeability can be achieved at particular dilution rates in continuous production processes. Our results suggest that Camellia sinensis extract (CSExt) serves as a promising cell growth promoter and lactic acid enhancer [19,43,57,58]. The acquisition of kinetic parameters through several batch cultures facilitates meaningful comparisons. In lactic acid fermentation, CSExt altered the carbon flux of Lactiplantibacillus plantarum metabolism, leading to a substantial increase in both lactic acid and cell biomass. Moreover, continuous culture at specific physiological stages demonstrated that CSExt induced a significant increase in cell biomass concentration. This study stands as the first to report on the kinetic parameters evaluating the effect of plant extract on the growth of a specific strain of Lactiplantibacillus plantarum. The results and strategies outlined here hold potential for application in industrial-scale probiotic production.

Author Contributions

Conceptualization, Ó.A.R.-R.; Formal analysis, Ó.A.R.-R., C.G.-F. and A.S.-J.; Funding acquisition, Ó.A.R.-R.; Investigation, Ó.A.R.-R., A.R.Q.-C. and A.S.-J.; Methodology, Ó.A.R.-R., A.R.Q.-C. and A.S.-J.; Resources, A.R.Q.-C. and A.S.-J.; Software, Ó.A.R.-R.; Supervision, C.G.-F.; Validation, A.S.-J.; Visualization, C.G.-F.; Writing—original draft, Ó.A.R.-R. and A.R.Q.-C.; Writing—review and editing, Ó.A.R.-R. and C.G.-F. All authors have read and agreed to the published version of the manuscript.

Funding

This research was funded by ITESO, grant number FAI2019 and the department of technological and industrial processes (DPTI).

Institutional Review Board Statement

Not applicable.

Informed Consent Statement

Not applicable.

Data Availability Statement

The original contributions presented in the study are included in the article; further inquiries can be directed to the corresponding author.

Acknowledgments

The authors would like to thank the Western Institute of Technology and Higher Education (ITESO) and the department of technological and industrial processes (DPTI) for financing the research activities of the Fermentation and Bioprocess Engineering Research Group (GIFB) through 2017–2019 research funds.

Conflicts of Interest

The authors declare no conflicts of interest.

References

  1. Saarela, M.; Mogensen, G.; Fondén, R.; Mättö, J.; Mattila-Sandholm, T. Probiotic Bacteria: Safety, Functional and Technological Properties. J. Biotechnol. 2000, 84, 197–215. [Google Scholar] [CrossRef]
  2. Hill, M. Probiotics: The Scientific Basis in Gut, 1st ed.; Fuller, R., Ed.; BMJ Publishing Group: Rockville Pike MD, USA, 1993; Volume 34, pp. 863–864. [Google Scholar]
  3. John, R.P.; Nampoothiri, K.M.; Pandey, A. Fermentative Production of Lactic Acid from Biomass: An Overview on Process Developments and Future Perspectives. Appl. Microbiol. Biotechnol. 2007, 74, 524–534. [Google Scholar] [CrossRef]
  4. Kim, S.W.; Park, K.Y.; Kim, B.; Kim, E.; Hyun, C.K. Lactobacillus rhamnosus GG Improves Insulin Sensitivity and Reduces Adiposity in High-Fat Diet-Fed Mice through Enhancement of Adiponectin Production. Biochem. Biophys. Res. Commun. 2013, 431, 258–263. [Google Scholar] [CrossRef]
  5. Azad, M.A.K.; Sarker, M.; Li, T.; Yin, J. Probiotic Species in the Modulation of Gut Microbiota: An Overview. BioMed Res. Int. 2018, 2018, 9478630. [Google Scholar] [CrossRef]
  6. Melgar-Lalanne, G.; Rivera-Espinoza, Y.; Hernández-Sánchez, H. Lactobacillus Plantarum: An Overview with Emphasis in Biochemical and Healthy Properties. In Lactobacillus: Classification, Uses and Health Implications, 1st ed.; Perez-Campos, A., Mena, A.L., Eds.; Nova Publishing: New York, NY, USA, 2012; pp. 1–31. [Google Scholar]
  7. He, M.; Shi, B. Gut Microbiota as a Potential Target of Metabolic Syndrome: The Role of Probiotics and Prebiotics. Cell Biosci. 2017, 7, 54. [Google Scholar] [CrossRef]
  8. Åkerberg, C.; Hofvendahl, K.; Hahn-Hägerdal, B.; Zacchi, G. Modelling the Influence of pH, Temperature, Glucose and Lactic Acid Concentrations on the Kinetics of Lactic Acid Production by Lactococcus lactis Ssp. Lactis ATCC 19435 in Whole-Wheat Flour. Appl. Microbiol. Biotechnol. 1998, 49, 682–690. [Google Scholar] [CrossRef]
  9. Lejeune, R.; Callewaert, R.; Crabbé, K.; De Vuyst, L. Modelling the Growth and Bacteriocin Production by Lactoba-cillus amylovorus DCE 471 in Batch Cultivation. J. Appl. Microbiol. 1998, 84, 159–168. [Google Scholar] [CrossRef]
  10. Ouwehand, A.C.; Sherwin, S.; Sindelar, C.; Smith, A.B.; Stahl, B. Production of Probiotic Bifidobacteria. In The Bifidobacteria and Related Organisms, 1st ed.; Matarelli, P., Biavati, B., Holzapfel, W., Wood, B., Eds.; Academic Press: Cambridge, MA, USA, 2018; pp. 261–269. [Google Scholar]
  11. Cheirsilp, B.; Suksawang, S.; Yeesang, J.; Boonsawang, P. Co-Production of Functional Exopolysaccharides and Lactic Acid by Lactobacillus kefiranofaciens Originated from Fermented Milk, Kefir. J. Food Sci. Technol. 2018, 55, 331–340. [Google Scholar] [CrossRef]
  12. Forssten, S.D.; Sindelar, C.W.; Ouwehand, A.C. Probiotics from an Industrial Perspective. Anaerobe 2011, 17, 410–413. [Google Scholar] [CrossRef]
  13. Brinques, G.B.; Do Carmo Peralba, M.; Ayub, M.A.Z. Optimization of Probiotic and Lactic Acid Production by Lac-tobacillus plantarum in Submerged Bioreactor Systems. J. Ind. Microbiol. Biotechnol. 2010, 37, 205–212. [Google Scholar] [CrossRef]
  14. Gibson, G.R.; Probert, H.M.; Loo, J.V.; Rastall, R.A.; Roberfroid, M.B. Dietary Modulation of the Human Colonic Microbiota: Updating the Concept of Prebiotics. Nutr. Res. Rev. 2004, 17, 259–275. [Google Scholar] [CrossRef]
  15. Dahiya, D.K.; Renuka; Puniya, M.; Shandilya, U.K.; Dhewa, T.; Kumar, N.; Kumar, S.; Puniya, A.K.; Shukla, P. Gut Microbiota Modulation and Its Relationship with Obesity Using Prebiotic Fibers and Probiotics: A Review. Front. Microbiol. 2017, 8. [Google Scholar] [CrossRef]
  16. Megías-Pérez, R.; Shevchuk, A.; Zemedie, Y.; Kuhnert, N. Characterization of Commercial Green Tea Leaves by the Analysis of Low Molecular Weight Carbohydrates and Other Quality Indicators. Food Chem. 2019, 290, 159–167. [Google Scholar] [CrossRef]
  17. Lee, M.K.; Kim, H.W.; Lee, S.H.; Kim, Y.J.; Asamenew, G.; Choi, J.; Lee, J.W.; Jung, H.A.; Yoo, S.M.; Kim, J.B. Characterization of Catechins, Theaflavins, and Flavonols by Leaf Processing Step in Green and Black Teas (Camellia sinensis) Using UPLC-DAD-QToF/MS. Eur. Food Res. Technol. 2019, 245, 997–1010. [Google Scholar] [CrossRef]
  18. Chen, I.J.; Liu, C.Y.; Chiu, J.P.; Hsu, C.H. Therapeutic Effect of High-Dose Green Tea Extract on Weight Reduction: A Randomized, Double-Blind, Placebo-Controlled Clinical Trial. Clin. Nutr. 2016, 35, 592–599. [Google Scholar] [CrossRef]
  19. Li, S.; Gong, G.; Ma, C.; Liu, Z.; Cai, J. Study on the Influence of Tea Extract on Probiotics in Skim Milk: From Pro-biotics Propagation to Metabolite. J. Food Sci. 2016, 81, M1981–M1986. [Google Scholar] [CrossRef]
  20. Liu, Z.; Vincken, J.P.; de Bruijn, W.J.C. Tea Phenolics as Prebiotics. Trends Food Sci. Technol. 2022, 127, 156–168. [Google Scholar] [CrossRef]
  21. Nazzaro, F.; Fratianni, F.; De Feo, V.; Battistelli, A.; Da Cruz, A.G.; Coppola, R. Polyphenols, the New Frontiers of Prebiotics. In Advances in Food and Nutrition Research; Gomes da Cruz, A., Schwinden, E., Almeida, E., da Silva, C., Eds.; Academic Press Inc.: Cambridge, MA, USA, 2020; Volume 94, pp. 35–89. [Google Scholar]
  22. Plamada, D.; Vodnar, D.C. Polyphenols—Gut Microbiota Interrelationship: A Transition to a New Generation of Prebiotics. Nutrients 2022, 14, 137. [Google Scholar] [CrossRef]
  23. Boulangé, C.L.; Neves, A.L.; Chilloux, J.; Nicholson, J.K.; Dumas, M.E. Impact of the Gut Microbiota on Inflamma-tion, Obesity, and Metabolic Disease. Genome Med. 2016, 8, 42. [Google Scholar] [CrossRef]
  24. Gharaei-Fathabad, E.; Eslamifar, M. Isolation and Applications of One Strain of Lactobacillus paraplantarum from Tea Leaves (Camellia sinensis). Am. J. Food Technol. 2011, 6, 429–434. [Google Scholar] [CrossRef]
  25. Salgado, J.M.; Rodríguez, N.; Cortés, S.; Domínguez, J.M. Development of Cost-Effective Media to Increase the Economic Potential for Larger-Scale Bioproduction of Natural Food Additives by Lactobacillus rhamnosus, Debary-omyces Hansenll, and Aspergillus Niger. J. Agric. Food Chem. 2009, 57, 10414–10428. [Google Scholar] [CrossRef]
  26. Trigueros, D.E.G.; Fiorese, M.L.; Kroumov, A.D.; Hinterholz, C.L.; Nadai, B.L.; Assunção, G.M. Medium Optimiza-tion and Kinetics Modeling for the Fermentation of Hydrolyzed Cheese Whey Permeate as a Substrate for Saccha-romyces cerevisiae var. boulardii. Biochem. Eng. J. 2016, 110, 71–83. [Google Scholar] [CrossRef]
  27. Jaramillo, L.; Santos, D.; Borges, E.; Dias, D.; Pereira, N. Low-Cost Effective Culture Medium Optimization for d-Lactic Acid Production by Lactobacillus coryniformis subsp. torquens under Oxygen-Deprived Condition. Ann. Microbiol. 2018, 68, 547–555. [Google Scholar] [CrossRef]
  28. Avonts, L.; Uytven, E.V.; Vuyst, L. De Cell Growth and Bacteriocin Production of Probiotic Lactobacillus Strains in Different Media. Int. Dairy, J. 2004, 14, 947–955. [Google Scholar] [CrossRef]
  29. Aguirre-Ezkauriatza, E.J.; Aguilar-Yáñez, J.M.; Ramírez-Medrano, A.; Alvarez, M.M. Production of Probiotic Biomass (Lactobacillus casei) in Goat Milk Whey: Comparison of Batch, Continuous and Fed-Batch Cultures. Bioresour. Technol. 2010, 101, 2837–2844. [Google Scholar] [CrossRef]
  30. Schiraldi, C.; Adduci, V.; Valli, V.; Maresca, C.; Giuliano, M.; Lamberti, M.; Cartenì, M.; De Rosa, M. High Cell Density Cultivation of Probiotics and Lactic Acid Production. Biotechnol. Bioeng. 2003, 82, 213–222. [Google Scholar] [CrossRef]
  31. Castillo Martinez, F.A.; Balciunas, E.M.; Salgado, J.M.; Domínguez González, J.M.; Converti, A.; Oliveira, R.P.d.S. Lactic Acid Properties, Applications and Production: A Review. Trends Food Sci. Technol. 2013, 30, 70–83. [Google Scholar] [CrossRef]
  32. Ghaffar, T.; Irshad, M.; Anwar, Z.; Aqil, T.; Zulifqar, Z.; Tariq, A.; Kamran, M.; Ehsan, N.; Mehmood, S. Recent Trends in Lactic Acid Biotechnology: A Brief Review on Production to Purification. J. Radiat. Res. Appl. Sci. 2014, 7, 222–229. [Google Scholar] [CrossRef]
  33. Berry, A.R.; Franco, C.M.M.; Zhang, W.; Middelberg, A.P.J. Growth and Lactic Acid Production in Batch Culture of Lactobacillus rhamnosus in a Defined Medium. Biotechnol. Lett. 1999, 21, 163–167. [Google Scholar] [CrossRef]
  34. Tripathi, M.K.; Giri, S.K. Probiotic Functional Foods: Survival of Probiotics during Processing and Storage. Journal of Functional Foods 2014, 9, 225–241. [Google Scholar] [CrossRef]
  35. De Man, J.C.; Rogosa, M.; Sharpe, M.E. Medium for the Cultivation of Lactobacilli. J. Appl. Bacteriol. 1960, 23, 130–135. [Google Scholar] [CrossRef]
  36. Monod, J. The Growth of Bacterial Cultures. Annu. Rev. Microbiol. 1949, 3, 371–394. [Google Scholar] [CrossRef]
  37. Levenspiel, O. The Monod Equation: A Revisit and a Generalization to Product Inhibition Situations. Biotechnol. Bioeng. 1980, 22, 1671–1687. [Google Scholar] [CrossRef]
  38. Luedeking, R.; Piret, E.L. Kinetic Study of the Lactic Acid Fermentation. Batch Process at Controlled pH. Biotechnol. Bioeng. 2000, 67, 636–644. [Google Scholar] [CrossRef]
  39. Rojas-Rejón, O.A.; Poggi-Varaldo, H.M.; Ramos-Valdivia, A.C.; Martínez-Jiménez, A.; Cristiani-Urbina, E.; De La Torre Martínez, M.; Ponce-Noyola, T. Production of Cellulases and Xylanases under Catabolic Repression Conditions from Mutant PR-22 of Cellulomonas flavigena. J. Ind. Microbiol. Biotechnol. 2011, 38, 257–264. [Google Scholar] [CrossRef]
  40. Fu, W.; Mathews, A.P. Lactic Acid Production from Lactose by Lactobacillus plantarum: Kinetic Model and Effects of pH, Substrate, and Oxygen. Biochem. Eng. J. 1999, 3, 163–170. [Google Scholar] [CrossRef]
  41. Malek, R.A.; Hamdan, S.; Enshasy, H.a.E.; Othman, N.Z. Production of Lactobacillus salivarius, a New Probiotic Strain Isolated from Human Breast Milk, in Semi-Industrial Scale and Studies on Its Functional Characterization. Appl. Microbiol. Microb. Biotechnol. 2010, 2, 1196–1204. [Google Scholar]
  42. Chaturvedula, V.S.P.; Prakash, I. The Aroma, Taste, Color and Bioactive Constituents of Tea. J. Med. Plants Res. 2011, 5, 2110–2124. [Google Scholar]
  43. Vodnar, D.C.; Ranga, F.; Pop, O.; Socaciu, C. Catechin-Rich Tea Extracts Improve the Lactobacillus casei Growth During Lactic fermentation. Bull. Univ. Agric. Sci. Vet. Med. Cluj-Napoca–Agric. 2012, 69, 447–453. [Google Scholar] [CrossRef]
  44. Bergillos-Meca, T.; Costabile, A.; Walton, G.; Moreno-Montoro, M.; Ruiz-Bravo, A.; Ruiz-López, M.D. In Vitro Evaluation of the Fermentation Properties and Potential Probiotic Activity of Lactobacillus plantarum C4 in Batch Culture Systems. LWT–Food Sci. Technol. 2015, 60, 420–426. [Google Scholar] [CrossRef]
  45. Rossi, M.; Corradini, C.; Amaretti, A.; Nicolini, M.; Pompei, A.; Zanoni, S.; Matteuzzi, D. Fermentation of Fruc-tooligosaccharides and Inulin by Bifidobacteria: A Comparative Study of Pure and Fecal Cultures. Appl. Environ. Microbiol. 2005, 71, 6150–6158. [Google Scholar] [CrossRef]
  46. Akalin, A.S.; Erişir, D. Effects of Inulin and Oligofructose on the Rheological Characteristics and Probiotic Culture Survival in Low-Fat Probiotic Ice Cream. J. Food Sci. 2008, 73, M184–M188. [Google Scholar] [CrossRef]
  47. Axling, U.; Olsson, C.; Xu, J.; Fernandez, C.; Larsson, S.; Ström, K.; Ahrné, S.; Holm, C.; Molin, G.; Berger, K. Green Tea Powder and Lactobacillus plantarum Affect Gut Microbiota, Lipid Metabolism and Inflammation in High-Fat Fed C57BL/6J Mice. Nutr. Metab. 2012, 9, 105. [Google Scholar] [CrossRef]
  48. Campos, D.; Betalleluz-Pallardel, I.; Chirinos, R.; Aguilar-Galvez, A.; Noratto, G.; Pedreschi, R. Prebiotic Effects of Yacon (Smallanthus Sonchifolius Poepp. & Endl), a Source of Fructooligosaccharides and Phenolic Compounds with Antioxidant Activity. Food Chem. 2012, 135, 1592–1599. [Google Scholar] [CrossRef]
  49. Panesar, P.S.; Bali, V. Prebiotics. In Encyclopedia of Food and Health, 1st ed.; Caballero, B., Finglas, P., Toldrá, F., Eds.; Academic Press: Cambridge, MA, USA, 2016; Volume 18, pp. 464–471. [Google Scholar]
  50. Slavin, J. Fiber and Prebiotics: Mechanisms and Health Benefits. Nutrients 2013, 5, 1417–1435. [Google Scholar] [CrossRef]
  51. Rinker, K.D.; Han, C.J.; Kelly, R.M. Continuous Culture as a Tool for Investigating the Growth Physiology of Het-erotrophic Hyperthermophiles and Extreme Thermoacidophiles. J. Appl. Microbiol. Symp. Suppl. 1999, 85, 118–127. [Google Scholar] [CrossRef]
  52. Herbert, B.Y.D.; Elsworth, R. The Continuous Culture of Bacteria; A Theoretical and Experimental Study. Gen. Microbiol. 1956, 601–622. [Google Scholar] [CrossRef]
  53. Hoskisson, P.A.; Hobbs, G. Continuous Culture--Making a Comeback? Microbiology. 2005, 151, 3153–3159. [Google Scholar] [CrossRef]
  54. Vees, C.A.; Neuendorf, C.S.; Pflügl, S. Towards Continuous Industrial Bioprocessing with Solventogenic and Acetogenic Clostridia: Challenges, Progress and Perspectives. J. Ind. Microbiol. Biotechnol. 2020, 47, 753–757. [Google Scholar] [CrossRef]
  55. Yasemi, M.; Jolicoeur, M. Modelling Cell Metabolism: A Review on Constraint-Based Steady-State and Kinetic Ap-proaches. Processes 2021, 9, 322. [Google Scholar] [CrossRef]
  56. Afschar, A.S.; Biebl, H.; Schaller, K.; Schügerl, K. Production of Acetone and Butanol by Clostridium acetobutylicum in Continuous Culture with Cell Recycle. Appl. Microbiol. Biotechnol. 1985, 22, 394–398. [Google Scholar] [CrossRef]
  57. Marhamatizadeh, M.H.; Ehsandoost, E.; Gholami, P. The Influence of Green Tea (Camellia sinensis L.) Extract on Characteristic of Probiotic Bacteria in Milk and Yoghurt during Fermentation and Refrigerated Storage. Int. J. Farming Allied Sci. 2013, 2, 599–606. [Google Scholar]
  58. Jaziri, I.; Ben Slama, M.; Mhadhbi, H.; Urdaci, M.C.; Hamdi, M. Effect of Green and Black Teas (Camellia sinensis L.) on the Characteristic Microflora of Yogurt during Fermentation and Refrigerated Storage. Food Chem. 2009, 112, 614–620. [Google Scholar] [CrossRef]
Figure 1. Growth of L. plantarum under control (●), 1% v/v of CSExt (○), and 10% v/v of CSExt (▼). Growth curves were adjusted according to Monod with product inhibition (Section 2.6) for control (-), 1% v/v of CSExt (…), and 10% v/v of CSExt (--).
Fermentation 10 00487 g001
Figure 2. Residual glucose concentration of L. plantarum cultures under control (●), 1% v/v of CSExt (○), and 10% v/v of CSExt (▼). Glucose consumption curves were adjusted according to Monod with product inhibition (Section 2.6) for control (-), 1% v/v of CSExt (…), and 10% v/v of CSExt (--).
Fermentation 10 00487 g002
Figure 3. D-lactate production by L. plantarum cultures under control (●), 1% v/v of CSExt (○), and 10% v/v of CSExt (▼). D-lactate adjusted curves were obtained according to Monod with product inhibition (Section 2.6) for control (-), 1% v/v of CSExt (…), and 10% v/v of CSExt (--).
Fermentation 10 00487 g003
Figure 4. Continuous culture of L. plantarum from 0.10 to 0.35 (1/h) under control conditions. Cell biomass (--●--), D-lactate formation (⋅⋅□⋅⋅), residual glucose (−○−).
Fermentation 10 00487 g004
Figure 5. Continuous culture of L. plantarum pulse CSExt 1% (v/v) at 0 h (steady state): (a) D = 0.10 1/h, (b) D = 0.20 1/h, (c) D = 0.25 1/h, and (d) D = 0.35 1/h. Cell biomass (●), D-lactate formation (□), residual glucose (○).
Fermentation 10 00487 g005
Figure 6. Continuous culture of L. plantarum with 1% (v/v) CSExt pulse at steady state and a dilution rate of 0.15 (1/h). Cell biomass (--●--), D-lactate formation (⋅⋅□⋅⋅), residual glucose (−○−).
Fermentation 10 00487 g006
Table 1. Kinetic parameters of L. plantarum in batch cultures.
XMAX 1
(g/L)
PMAX 2
(g/L)
µMAX
(1/h)
KS
(g/L)
YX/S
(g/g)
α
(g/g)
β
(g/(g∙h))
Control3.57 ± 0.0610.42 ± 0.320.82 ± 0.010.68 ± 0.000.19 ± 0.002.33 ± 0.010.05 ± 0.00
1% (v/v)4.80 ± 0.0020.98 ± 0.011.27 ± 0.042.76 ± 0.120.22 ± 0.014.60 ± 0.030.00 ± 0.00
10% (v/v)6.10 ± 0.0119.76 ± 0.001.95 ± 0.039.89 ± 0.210.32 ± 0.013.11 ± 0.040.01 ± 0.00
1 Maximum biomass concentration. 2 Maximum lactate concentration.
Table 2. Behavior index of CSExt in batch cultures, percent of improvement (%).
CSExtCell Biomass
Formation
Substrate
Consumption
D-Lactate
Production
1% (v/v) vs. control33.66 ± 1.053.93 ± 0.18111.56 ± 2.53
10% (v/v) vs. control69.13 ± 2.0122.85 ± 1.1089.39 ± 0.68
10% (v/v) vs. 1% (v/v)26.54 ± 2.5418.20 ± 0.98−11.27 ± 0.45
Disclaimer/Publisher’s Note: The statements, opinions and data contained in all publications are solely those of the individual author(s) and contributor(s) and not of MDPI and/or the editor(s). MDPI and/or the editor(s) disclaim responsibility for any injury to people or property resulting from any ideas, methods, instructions or products referred to in the content.