Abstract
Climate change is having a significant impact on vine physiology and grape composition, leading to notable alterations in wine quality, such as reduced acidity, increased ethanol content, and higher pH levels. These effects are particularly problematic in arid and semi-arid regions, such as Mediterranean areas, where high summer temperatures and low rainfall accelerate the degradation of organic acids in grapes. As a result, wines produced under these conditions often lack the acidity required to preserve their freshness and enological quality. This study evaluated the effect of must acidification using cation-exchange resins on the composition and quality of red wines made from the Monastrell variety, comparing them with wines acidified using tartaric acid to reach the same target pH. The results showed that treating a portion of the must (20% and 30%) with cation-exchange resins significantly reduced wine pH values and increased total acidity compared to the control wine. A similar result was observed in wines acidified with tartaric acid. However, as an additional effect, the treatment with resin more markedly reduced the concentration of pro-oxidant metal cations such as iron, copper, and manganese, contributing to lower values of volatile acidity and a greater stability against oxidation of phenolic compounds. Must acidification with both methods improved wine color quality by increasing color intensity and decreasing hue values. Although no significant differences were found in the total concentration of phenolic compounds, variations were detected in their compositional profile. Furthermore, the acidification also affected the concentration and composition of aromatic compounds in the final wine. Sensory analysis revealed that the treated wines—particularly those made with must acidified using cation-exchange resins—exhibited greater aromatic intensity, more pronounced fruity notes, and reduced astringency, resulting in a fresher mouthfeel. In conclusion, must treatment with cation-exchange resins appears to be a low-cost good alternative compared tartaric acid addition for reducing pH and increasing acidity in Monastrell red wines, thereby enhancing their quality in winegrowing regions with arid or semi-arid climates.
1. Introduction
In recent years, climate change has increasingly affected global viticulture, altering grape composition and, consequently, wine quality. The most notable changes include reduced acidity, increased alcohol content, and higher pH levels [1]. These effects are particularly problematic in arid and semi-arid regions, such as the Region of Murcia, where they negatively impact wine balance, freshness, and aging potential [2]. Faced with this scenario, wineries must make a critical decision: to harvest early, when sugar levels are low and pH is optimal but phenolic and aromatic maturity is insufficient; or to delay harvest to achieve full phenolic ripeness at the expense of excessive alcohol content and elevated pH. As such, identifying winemaking strategies to mitigate this imbalance caused by climate change is of great interest to the wine industry.
Acidity and pH play a crucial role in red wine production, influencing both microbial stability and physicochemical properties [3]. pH determines the equilibrium of sulfur dioxide (SO2), directly affecting the proportion of free and molecular SO2 [4]. Molecular SO2 levels between 0.6 and 0.8 mg/L are considered necessary to ensure microbiological stability in dry wines [5,6]. However, wines with higher pH require increased molecular SO2 concentrations to achieve the same level of protection, potentially exceeding legal limits for dry red wines, such as the 150 mg/L threshold established in Spain [7]. Moreover, pH and acidity are key factors in the solubility and stability of tartrate salts, and also influence wine color by modulating anthocyanin equilibrium [8,9] and promoting pigment condensation and polymerization [10]. Overall, both titratable acidity and pH significantly affect sensory perception and organoleptic balance, playing a critical role in wine stability and quality [6].
Given the critical importance of pH in determining wine quality, various techniques have been developed to increase acidity and reduce pH, including chemical, microbiological, physical, and physicochemical methods [11]. Traditional winemaking practices include: (i) blending with musts or wines with higher acidity [12]; (ii) microbial acidification in wine using Saccharomyces or non-Saccharomyces yeasts in must, which are capable of producing malic or succinic acid [13]. For instance, some Saccharomyces cerevisiae strains have been reported to produce moderate amounts of succinic acid [11], whereas non-Saccharomyces species such as Schizosaccharomyces pombe and Lachancea thermotolerans can significantly contribute to acidification. Lachancea thermotolerans, in particular, is nowadays widely employed in winemaking to acidify must or wine through the production of L-lactic acid, thereby enhancing freshness and microbial stability [11,13]; and (iii) chemical acidification in must or wine with the addition of lactic, malic, or tartaric acid [11]. Although malic and lactic acids are also permitted for acidification, their impact on pH reduction is more limited than tartaric acid due to their higher pKa values (malic acid pKa1 = 3.40; lactic acid pKa = 3.86 vs. tartaric acid pKa1 = 2.98). At equivalent molar concentrations, they produce a smaller shift in hydrogen ion activity and therefore less pH decrease. Furthermore, tartaric acid is the main natural acid in grapes and wine and remains stable during aging, making it the most widely used acidifying agent in warm-climate winemaking. For these reasons, the present study focused on comparing tartaric acid addition with cation-exchange resin treatment, rather than including malic or lactic acids.
The International Organization of Vine and Wine [14] approved two key technological approaches for acidity regulation: (i) electromembrane systems derived from electrodialysis, mainly used for tartrate stabilization [15]; and (ii) ion exchange systems using cation-exchange resins to acidify musts and wines [6,16]. The OIV also limits acidification practices, establishing that total acidity cannot be increased by more than 54 meq/L, equivalent to 4 g/L of tartaric acid [14].
Cation-exchange resins are sulfonated styrene-divinylbenzene copolymers functionalized with sulfonic groups (-SO3H), which facilitate the exchange of cations such as K+ and Ca2+ for H+ ions, thereby increasing total acidity and reducing pH in must or wine [6,14]. In addition to enhancing tartrate stability by reducing the risk of salt precipitation, this process also removes metal cations like iron (Fe) and copper (Cu), which form complexes with organic acids [16]. Reducing redox-active metals contributes to improved oxidative stability. However, cation concentrations also affect alcoholic fermentation and, consequently, the wine’s aromatic composition. According to Walker et al. [17], some metal ions influence yeast growth and metabolism, affecting sugar-to-ethanol conversion rates, yeast biomass, cell viability, stress tolerance, foam production, and flocculation. Thus, magnesium is the prime candidate for a yeast stress-protectant in fermentation processes, while copper increases yeast stress during fermentation. Therefore, the use of these resins provides an accurate and efficient means of pH adjustment, reducing the need for direct acid additions. Typically, only a portion of the must or wine (5–30%) is treated with resins and then blended back into the main batch [18] and the treatment must not lower the wine’s pH below 3.0 and the decrease in pH should not exceed 0.3 pH units [14].
Several studies have assessed the application of cation-exchange resins in must and wine, and their impact on wine composition and quality [15,17,18,19]. This technology has proven effective for pH adjustment and for improving both tartrate and oxidative stability in red wines [20]. Although it has a limited impact on phenolic content, slight reductions in anthocyanin and tannin levels have been reported when is applied in wine [17]. Nevertheless, in Syrah red wines, this method has been associated with improved color attributes, including lower hue and higher color intensity [17].
To our knowledge, no previous studies have explored the application of cation-exchange resins in musts intended for the production of Monastrell red wine. Monastrell is a late-ripening variety with a long vegetative cycle, primarily grown in regions where climate change and elevated temperatures hinder phenolic maturation. This often necessitates delayed harvests, resulting in musts with high soluble solids and elevated pH levels. As a result, substantial additions of tartaric acid are commonly required during vinification, which increase the risk of tartaric salt precipitation and moreover, an intervention constrained by legal limits, so that the net accumulated increase should not exceed 4 g/L in tartaric acid [14]. Therefore, this study aims to evaluate the impact of must treatment with cation-exchange resins, a low-cost acidification method and with less risk the tartaric salt precipitation compared to traditional acidification using tartaric acid, on the composition and quality of Monastrell red wines. The wines from the cation-exchange treated musts were compared with those wines elaborated with musts adjusted to the same pH using tartaric acid, as well as with control wines made from untreated musts, to assess the potential of this physical approach as a more viable alternative for improving wine quality in warm-climate regions.
2. Materials and Methods
2.1. Vineyard Site and Grape Samples
A total of 500 kg of Monastrell red grapes were harvested at a maturity level of 14 ºBaumé from a vineyard located in the Aceniche Valley, within the Bullas Designation of Origin (D.O.), Murcia Region, Spain. The Monastrell vines, planted in 1990, are spaced at 2.5 × 3.0 m, resulting in a planting density of 1333 vines per hectare. The vineyard is situated at 850 m above sea level and is characterized by hot summers and very cold winters, with occasional snowfall. The average annual temperature is 15.9 °C, and total annual precipitation is 336 mm. The vines are bush-trained (gobelet system) and cultivated under dryland conditions, relying exclusively on natural rainfall without irrigation.
2.2. Vinifications
At harvest, the Monastrell grape must presented 27.2 ± 0.1 °Brix, a pH of 3.85 ± 0.01, and a titratable acidity of 5.53 ± 0.05 g/L (expressed as tartaric acid equivalents). These values correspond to grapes at advanced technological maturity, characterized by high sugar content and high pH, conditions typical of warm-climate viticulture and representative of the enological challenges addressed in this study. From the total harvested grapes, 20% was separated, destemmed, and crushed to obtain 50 L of must intended for acidification treatment with resins. Acidification was carried out using a semi-industrial-scale cation-exchange unit Freek+, provided by Agrovin S.A. (Alcázar de San Juan, Ciudad Real, Spain), operating at a flow rate of 150 L/h. Prior to treatment, the must was clarified by adding pectolytic enzymes (Enozym Lux, 3 mL/hL) to reduce turbidity to below 70 NTU. Subsequently, the acidified must replaced 20% and 30% of the untreated must volume in the respective vinifications (Freek 20 and Freek30). Additionally, two vinifications were performed with tartaric acid additions to adjust the titratable pH to the same levels as in the treatments with 20% and 30% acidified must (Tartaric 20 and 30, respectively). A control vinification was conducted without must substitution or pH adjustment.
All vinifications were carried out in triplicate in 25 L tanks. Maceration lasted seven days. At the end of maceration, the wines were pressed, and the wine obtained from pressing was mixed with the free-run wine. All wines were stored at room temperature (23 ± 2 °C) until the completion of alcoholic fermentation. Once fermentation was complete, the wines were sulfited, racked, and finally bottled. Analytical determinations were performed one month after bottling.
2.3. Analytical Determinations
2.3.1. Physicochemical Parameters
The wines were characterized by determining alcohol content, pH, and total acidity following the methods established by the European Community [21].
2.3.2. Spectrophotometric Analysis
Chromatic parameters were evaluated using a UV/Visible spectrophotometer (Helios Alpha Thermo Spectronic, Cambridge, UK). Wine color intensity (CI) was determined as the sum of absorbance at 420 nm, 520 nm, and 620 nm, according to Glories [22]. Total and polymeric anthocyanin concentrations were measured following the method of Ho et al. [23]. The total phenolic index (TPI) was calculated from absorbance at 280 nm, as described by Ribéreau-Gayon et al. [6]. Total tannins were determined using the methylcellulose precipitation method described by Smith [24].
2.3.3. Proanthocyanidins Determination by HPLC
Total proanthocyanidins concentration and composition (mean degree of polymerization, percentage of galloylation, and percentage of (-)-epigallocatechin) were determined using the phloroglucinolysis method under the conditions described by Busse-Valverde et al. [25]. The concentration and composition of tannins were calculated by subtracting the concentration of free monomeric flavan-3-ols from the total terminal subunits determined by the phloroglucinol method. The analysis was performed using a Waters 2695 HPLC system (Waters, Milford, MA, USA) coupled to a diode array detector (Waters 2996, MA, USA) and an Atlantis dC18 column (250 × 4.6 mm, 5 μm) protected by a guard column of the same material (20 × 4.6 mm, 5 μm). The injection volume was 10 μL. Solvent B consisted of a water/formic acid mixture (98:2, v/v), with a constant flow rate of 0.8 mL/min and column oven temperature set at 30 °C. Elution conditions were as follows: 100% solvent A for 5 min, followed by a linear gradient from 100% to 90% solvent A over 30 min, and from 90% to 80% solvent A over an additional 30 min, ending with a column wash and re-equilibration phase. The percentage of galloylation was calculated as the molar proportion of galloylated subunits (expressed as (-)-epicatechin gallate) relative to the total molar concentration of all terminal and extension units released after phloroglucinolysis. Values were expressed as a percentage of total proanthocyanidin subunits.
2.3.4. Determination of Anthocyanins and Vitisins by HPLC
The separation of anthocyanins and vitisins in wine was performed using a Waters Acquity Arc liquid chromatograph (Waters, Milford, MA, USA) equipped with a Waters 2998 diode array detector (Waters, Milford, MA, USA), following the methodology described by Martínez-Moreno and Bautista-Ortín [26]. A Poroshell 120 EC-C18 core-shell column (150 × 2.1 mm, 2.7 μm, Agilent Technologies, Santa Clara, CA, USA) was used. The mobile phase consisted of 1% formic acid in water (solvent A) and 1% formic acid in a 1:1 (v/v) methanol:acetonitrile mixture (solvent B). The elution gradient started with 100% solvent A for 2 min, followed by a linear increase from 0% to 15% solvent B over 33 min, from 15% to 21% over 15 min, and from 21% to 30% over 20 min, finishing with a column wash and re-equilibration phase. The column oven temperature was maintained at 55 °C, the flow rate was 0.3 mL/min, and the injection volume was 5 μL. Compound identification and quantification were carried out at 520 nm, using malvidin-3-glucoside chloride as an external standard.
2.3.5. Determination of Volatile Compounds
For the analysis of volatile compounds in Monastrell wines, 10 mL of wine was added to a 30 mL glass vial. Four grams of sodium chloride (NaCl) and 25 μL of an internal standard (2-octanol, Sigma-Aldrich, Darmstadt, Germany) were added to the same vial, which was then sealed tightly with a PTFE-coated cap. The solution was homogenized using a vortex mixer (IKA, Königswinter, Germany). The analysis of volatile compounds was performed using gas chromatography coupled to mass spectrometry (GC-MS), with a HP 5890 GC system coupled to an HP 5972 quadrupole mass spectrometer (Agilent Technologies, Palo Alto, CA, USA). A 2 μL extract was injected in split mode (1:100). Separation was carried out using an HP InnoWax capillary column (50 m × 0.32 mm, 0.25 μm, Agilent). The injector temperature was set at 40 °C for 5 min. The detector operated in electron impact mode (70 eV) with a mass acquisition range (m/z) from 50 to 200 amu. Peak identification was performed by comparing the mass spectra with those in the Wiley 6.0 spectral library (Chichester, UK) and with retention indices calculated based on values published in the literature. Semiquantitative data were obtained by calculating the relative peak area (total ion signal or fragment signal for coeluted compounds) relative to the internal standard.
2.3.6. Analysis of Metals and Trace Elements by ICP-MS
Metals and trace elements were determined by inductively coupled plasma mass spectrometry (ICP-MS). Wine samples were previously diluted 1:10 (v/v) with 2% (v/v) nitric acid. The analysis was carried out using an Agilent 7900 instrument (Agilent, Tokyo, Japan), equipped with a MicroMist nebulizer and a Scott-type double-pass nebulization chamber with continuous nebulization. Operating conditions were as follows: nebulizer gas flow at 1.05 L/min, auxiliary gas flow at 0.9 L/min, plasma gas flow at 15 L/min, and ICP RF power at 1500 W. Calibration curves were established up to 100 mg/L for K, Mg, Na, and Ca, and up to 1 mg/L for elements present at lower concentrations such as Fe, Cu, Mn, and Zn.
2.3.7. Sensory Analysis
The wines were evaluated using a descriptive sensory analysis approach. Prior to evaluation, the samples from the three replicates of each treatment were combined to obtain a representative sample and minimize variability between replicates. The sensory panel consisted of 12 trained panelists with extensive experience in wine sensory analysis. The sensory evaluation study followed the recommendations of the Declaration of Helsinki and strictly adhered to the guidelines of the research ethics committee of the University of Murcia for the sensory analysis of food with trained panels. Participants gave their informed consent through the statement “I am aware that my answers are confidential and I agree to participate in this study as a trained panellist” where an affirmative answer was required to enter the tasting panel. In addition, sensory analysis was performed following the guidelines established in UNE-ISO 6658:2019 [27] and UNE-ISO 4121:2006t, [28] which define the general methodology for sensory testing and the procedures for assessing the intensity of sensory attributes. Forty milliliters of wine were served coded with three-digit numbers in standard tasting glasses. Unsalted crackers and fresh water were provided for palate cleansing between samples. Evaluations took place in a standardized tasting room with individual booths illuminated by white light, at a controlled temperature of 20 ± 1 °C, free of odors, noise, and distractions. The panel worked with the lexicon previously described by Pérez Mendoza et al. [29], assessing the following attributes: color intensity, hue, aroma intensity, aroma quality, flavor quality, persistence, harmony, astringency, acidity, ripe fruit, fresh fruit, and herbaceous. A numerical scale from 0 to 10 was used for evaluation (0 = none, 10 = extremely, with 0.5 increments). The panel conducted 4 training sessions on the descriptors and scales of the lexicon and, after 1 validation session, began the analysis of the samples. All samples were evaluated in triplicate.
2.4. Statistical Analysis
Statistical analysis was performed using Statgraphics Centurion 16.3 software (Statpoint Technologies, Inc., The Plains, VA, USA). Physicochemical parameters, phenolic and volatile compounds, and sensory data were analyzed by analysis of variance (ANOVA) with a significance level of p ≤ 0.05. Differences between means were assessed using the least significant difference (LSD) test.
3. Results and Discussion
3.1. Physicochemical Parameters of the Wines
The results of the physicochemical parameters (Table 1) showed that replacing 20% and 30% of the must with must acidified by cation-exchange resin, after grape crushing and destemming, significantly lowered the wine pH values from 3.83 in the control wine to 3.65 and 3.52, respectively. This acidification increased the total acidity by 4.9% and 10.4%, respectively. A similar trend was observed in wines whose must was acidified by the addition of tartaric acid. No significant differences were found between the pH and acidity values of wines with 20% resin-acidified must (Freek 20) and those with tartaric acid addition (Tartaric 20), nor between wines with 30% resin-acidified must (Freek 30) and tartaric acid (Tartaric 30). It is worth noting that other acids, such as malic and lactic acids, are permitted for wine acidification. However, their dissociation constants are higher than that of tartaric acid. This limited pH-lowering capacity, combined with the fact that malic acid is susceptible to degradation via malolactic fermentation and lactic acid is not naturally predominant in grapes, makes them less effective alternatives in warm-climate viticulture where substantial pH correction is often required.

Table 1.
Physicochemical characteristics of Monastrell red wines.
Alcohol content was similar across all wines, while volatile acidity was significantly lower in wines made from acidified musts, both resin-treated (Freek 20 and Freek 30) and tartaric acid acidified, compared to the control wine. This reduction may be associated with the decreased pH, which exerts an antimicrobial effect, possibly reducing acetic acid production. Wines treated with tartaric acid exhibited intermediate volatile acidity values between control wines and those from the resin-exchange treatment, which could be related to a higher metal content in these wines compared to those acidified with ion-exchange resin (Table 2). This difference in metal composition may influence significantly the progress and efficiency of fermentation producing certain fewer desirable metabolites [17]. Thus, Ferreira et al. [30] reported an increase in volatile acidity values in wines fermented with different commercial yeasts in the presence of copper residues due to a slower fermentation. Therefore, a lower presence of copper, along with other metals in wines from must treated with cation exchange resin, could justify the lower volatile acidity values found in these wines.
Table 2.
Concentration of mineral elements in Monastrell wines (mg/L).
3.2. Minerals Present in the Wine
The concentration of most metals analyzed in the wines (Table 2) decreased following the addition of tartaric acid and, to a greater extent, with the replacement of must acidified by cation-exchange resin, especially at higher substitution levels. These results highlight that treating must with cation-exchange resins to reduce wine pH is also effective in lowering ions that catalyze oxidation reactions in wine, such as Fe, Cu, and Mn. Similarly, Ponce et al. [18] and Benítez et al. [31] observed reduced metal content and improved oxidative stability in wines treated with such resins to lower pH.
Among all the cations present in wine, potassium (K+) is of particular importance due to its strong tendency to form insoluble salts with tartaric acid, which can lead to the formation of crystals in the bottle. In this study, potassium levels were reduced by 20% and 28% in wines which musts were treated with 20% and 30% tartaric acid addition, respectively. This is due to the interaction of the bitartrate anion (the conjugate base of tartaric acid) with K+ in the wine to form potassium bitartrate, the main source of crystalline deposits found during winemaking [32]. In resin-treated wines (Freek 20 and Freek 30), K reduction was 10.4% and 27.8%, respectively, as K+ was exchanged for H+ when the must passed through the resins. This reduces the risk of tartaric salt formation that precipitates in the bottle bottom, which often causes consumer rejection [33].
The decrease in potassium during the final fermentation stages is attributed to potassium bitartrate precipitation, which is less soluble in the presence of ethanol and may contribute to pH and acidity changes [32]. The observed increases in calcium (Ca) levels with the different treatments may be associated with the pH values achieved, since low pH increases the solubility of calcium tartrate salts, preventing their precipitation [34], unlike the control wine, which, with higher pH values, favors the precipitation of this salt, reducing the wine’s calcium content. Furthermore, it should be noted that the addition of tartaric acid in winemaking can increase calcium content, since this mineral is present in this oenological product in low amounts (below 200 mg/kg). Calcium levels ranged between 49.18 and 60.01 mg/L, below those associated with tartrate instability, reported between 70 and 100 mg/L [35]. Moreover, low pH values, such as those achieved with tartaric acid and acidified must, favor the equilibrium toward protonated and monovalent tartrate forms rather than the divalent form required for calcium tartrate formation [36]. Finally, trace amounts of iron (Fe) (below 10 mg/kg) and even manganese (Mn) in the enological tartaric acid may explain the observed increases of these metals in tartaric acid treated wines, especially at higher doses.
3.3. Chromatic Parameters and Phenolic Compounds of the Wines by Spectrophotometry
Table 3 shows the results for chromatic parameters and phenolic compound content in the different wines. No significant differences were observed among treatments for total anthocyanin concentration or total tannins determined by methylcellulose precipitation. Wines in which part of the must was replaced by acidified must (Freek 20 and Freek 30) showed significantly higher color intensity and significantly lower hue values, resulting in a more purple color—attributes positively valued in quality red wines. Similar results were observed for Tartaric 30 wine, while the addition of a lower amount of tartaric acid to musts produced a chromatic profile more similar to the untreated control wine. The control wine exhibited the highest content of SO2-resistant pigments (AP), followed by the tartaric acid-treated wines, while the lowest values were found in wines treated with resin-acidified must. Numerous studies have examined the effect of various enological techniques on the phenolic extraction dynamics during maceration [26,37,38]. However, less information is available on the effect of pH on the diffusion of these compounds from grape to must-wine during maceration, possibly due to its complexity, which is influenced by multiple factors, including the chemical composition of the medium, that regulates phenolic compound solubility and extractability. Forino et al. [39] reported a decrease in anthocyanin extraction when the medium’s pH increased from 3.2 to 3.5, with no differences observed between 3.5 and 3.7. They also reported an increase in short-chain polymeric pigments with increasing pH, without the same trend for larger polymeric pigments. Regarding tannins, they observed a slight increase in concentration with rising pH, though not significant compared to the control. On the contrary, Gambuti et al. [40] found that the formation of polymeric pigments was enhanced in wines obtained through the maceration of grapes at higher pH, being this effect significant after the end of alcoholic fermentation. Moreover, these same authors reported that the later the acidification was performed (week after the end of the fermentation maceration process), a higher production of these long compounds and new pigments occurred over time, suggesting that the acidification effect in the stable pigment formation is stronger when pH is decreased after the end of fermentation. The pH reduction in Tartaric 30, Freek 20, and Freek 30 wines increased anthocyanin participation at 520 nm (red component), explaining the higher color intensity values. Under these acidic conditions, more anthocyanins exist in the flavylium cation form, favoring self-association or copigmentation reactions with other organic compounds, mainly flavonoids and phenolic acids [41]. Copigments are responsible for hyperchromic changes, resulting in higher absorbance, and bathochromic shifts, producing reddish-purple hues [9]. This behavior was not observed in the wine treated with the lower tartaric acid dose (Tartaric 20), which showed higher hue values despite a pH similar to Freek 20. This may be due to greater oxidative evolution of phenolic compounds, related to higher Fe, Cu, Mn, and Zn content. Dong et al. [42] reported that the direct reaction between oxygen and phenolics is slow or negligible in acidic media, while transition metals like Fe can alter reaction pathways, lowering free energy requirements and increasing reaction rates. Previous studies indicated that resin treatment in finished wines can affect red wine color due to reductions in monoglucoside anthocyanins content due to adsorptions in the resin [43]. The same effect was reported for tannins [16], although in the case of tannins, this may be due to a dilution effect from washing water retained in the column rather than resin adsorption as with anthocyanins. These findings suggest that to avoid changes in phenolic content and negative effects on red wine color, it is preferable to treat must with resin—due to its lower phenolic content, as in this study—rather than treating the wine itself.
Table 3.
Color parameters and phenolic compounds of wines measured by spectrophotometry.
3.4. Composition of Tannins, Anthocyanins, and Vitisins in Wines by HPLC
The results for depolymerizable tannins measured by the phloroglucinolysis method are shown in Table 4. Both tartaric acid addition and must treatment with cation exchange resins did not significantly affect total tannin concentration compared to the control wine. The control wine and the wine treated with 30% resin acidified must (Freek 30) showed the lowest mean degree of polymerization values, with no significant differences between them. In contrast, wines acidified with tartaric acid exhibited the highest values for this parameter. Interestingly, lower percentages of the (-)-epigallocatechin subunit were found in the tannins of the control wine, while the highest values appeared in the wine with the highest substitution of acidified must, with intermediate values in the other wines.
Table 4.
Concentration and composition of proanthocyanidins in Monastrell wines.
These results indicate that pH influences the extraction and structural composition of tannins from skins and seeds. Specifically, a lower pH can favor the extraction of higher molecular weight tannins rich in (-)-epigallocatechin units, which are generally associated with a softer astringency [39]. In this regard, the greater pH decrease observed in the Freek 30 treatment also promotes higher extraction of lower molecular weight tannins from seeds, which are richer in (-)-epicatechin-3-O-gallate. Additionally, under acidic conditions, proanthocyanidins can undergo depolymerization through acid-catalyzed formation of carbocations, which are reactive intermediates capable of undergoing nucleophilic attack by other flavan-3-ol units, thereby promoting re-polymerization [44]. This process can lead to an increase in the mean degree of polymerization (mDP) in some acidified wines. Therefore, although total tannin concentration was similar across all wines, differences in their structural composition may influence organoleptic sensations, as higher molecular weights and greater galloylation percentages increase astringency and bitterness, whereas a higher presence of (-)-epigallocatechin units may reduce these sensations [12,45].
3.5. Anthocyanin Concentration and Composition by HPLC
When anthocyanin concentration and composition were measured by HPLC (Table 5), significant differences were observed between the treatments and the control wine. The control wine showed lower total and free anthocyanin values but had the highest levels of polymeric anthocyanins and vitisins, with no significant differences in these compounds compared to the Tartaric 20 wine. In the treated wines, regarding free anthocyanins, Tartaric 30 wine showed the lowest values, not significantly different from Freek 20 wine, while Freek 30 wine exhibited lower vitisin formation. Additionally, Freek 30 wine had the lowest concentration of polymeric anthocyanins, followed by Freek 20, whereas wines with tartaric acid addition displayed higher values without differences between them.
Table 5.
Phenolic compounds of Monastrell wines measured by HPLC.
These results clearly indicate a slowing of the wine’s evolutionary process with decreasing pH. Gambuti et al. [40] reported increased polymeric pigment formation and vitisins in wines from macerated grapes as pH increased, which are of great relevance by their contribution to the stability of the wine color. Other authors also observed a greater decrease in acetaldehyde content with increasing pH, since it is rapidly consumed in flavanol reactions [46]. Furthermore, the lower presence of Fe, Cu, and Mn—particularly in Freek 30 wines, followed by Freek 20, and Cu in tartaric acid-treated wines—elements indirectly involved in transforming anthocyanins into more stable pigments through various reactions, such as aldehyde-mediated tannin condensation and cycloaddition reactions leading to pyranoanthocyanins [25,47], and hydroxyl radical formation in the Fenton reaction [48], may explain the reduced formation of these pigments in treated wines.
3.6. Volatile Compounds
Table 6 presents the concentrations of 31 aromatic compounds identified in the different wines, categorized into five aromatic families: alcohols, esters, terpenes, acids, and ketones/aldehydes. The control wine exhibited the highest total concentration of volatile compounds, followed by treatments with lower pH values (Tartaric 30 and Freek 30). Within the higher alcohol family, the control wine showed the highest concentration, and no significant differences were observed among treated wines. The concentration of 1-hexanol increased in all treated wines, although this increase was not significant in Freek 30 compared to the control. 3-Methylthio-1-propanol increased in tartaric acid-acidified wines, while phenylethyl alcohol significantly increased in the lower pH wines relative to the control. The increases in 1-hexanol and phenylethyl alcohol can enhance herbaceous and floral notes, respectively [49]. Regarding esters, Freek 30 wine showed the highest concentration, likely due to its higher content of ethyl hexanoate, which imparts pineapple and banana aromas. Other acidified wines (Tartaric 20 and 30, and Freek 20) also showed increases in total ester concentration compared to the control. Esters are responsible for a wide range of fruity aromas [50], resulting in a more fruity organoleptic profile for acidified wines than for the control. The work carried out by Tian et al. [51] also reported that low-pH fermentations were beneficial for the formation of esters and higher alcohols, finding the highest values of phenylethyl alcohol and ethyl hexanoate content among other compounds in the lowest pH wines. Freek 30 also presented the highest concentration of terpenes, including linalool and nerolidol, known for their floral and citrus aromas [52]. Tartaric 20, Freek 20, and the control wines showed the lowest terpene concentrations. A possible explanation for the result was that more aroma precursors are released hydrolytically from the grape berries during alcoholic fermentation under high acidity conditions since juice fermented at low pH had a better flavor [53]. The ketone, dihydro-5-pentyl-2(3H)-furanone, also known as γ-nonalactone, with a coco and milky notes, was not affected by acidification. Previous studies carried out by Lasanta et al. [16] using cation-exchange resins in finished wines found no significant differences in most aromatic compounds between control and acidified red wines. These authors reported that the only compounds showing significant differences and surpassing their odor thresholds were four esters associated with fruity and red fruit aromas: ethyl 2-methylbutyrate and ethyl 4-methylpentanoate in all acidified wines, and ethyl octanoate and phenylethyl acetate in wines with lower pH (3.3). Other studies have reported reduced aromatic compound concentrations in wines treated with cationic resins applied to finished wines [18,31,54,55].
Table 6.
Concentrations of volatile compounds in Monastrell wines.
3.7. Sensory Profile of Monastrell Wines
The results of the descriptive sensory analysis for each of the evaluated wines are shown in Figure 1. Among the 12 assessed attributes, statistically significant differences were found in four: fresh fruit, aromatic intensity, acidity, and astringency.
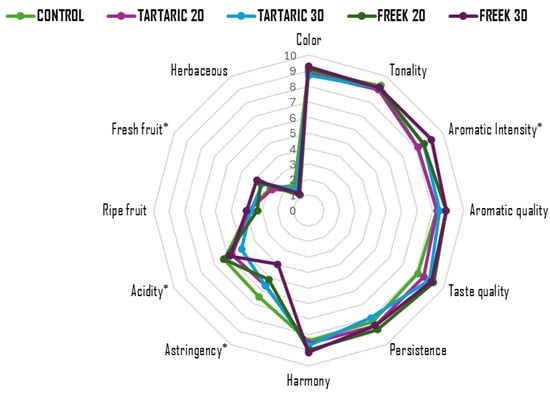
Figure 1.
Sensory analysis of acidified Monastrell wines assessed by a trained panel after bottling. * indicates significant differences among treatments (p > 0.05).
Wine acidification led to an increase in the sensory perception of fresh fruit, acidity, and overall aromatic intensity, except for the wine acidified with 20% tartaric acid. This response was directly related to the degree of acidification applied, with higher values observed in wines where 30% of the must was replaced. Regarding astringency, an inverse trend was observed: the greater the must acidification, the lower the perception of astringency, with Freek30 being the least astringent wine. Previous studies by Fontoin et al. [56] and Payne et al. [57], unlike the present work, associated increased acidity in wines with higher perceived astringency, a descriptor also correlated with elevated mineral content in wines, particularly potassium (K), calcium (Ca), and magnesium (Mg) [58]. These findings do not align with those obtained in this study, which may be due to a higher (-)-epigallocatechin content in the tannin structure of the acidified wines, potentially reducing astringency perception [45], as well as to lower mineral content.
The results also demonstrated that the must acidification applied in this study, either by ion exchange or direct tartaric acid addition, did not cause significant changes in the sensory perception of color, hue, aromatic and gustatory quality, ripe fruit, persistence, or herbaceous aroma. Lasanta et al. [16] reported higher scores for color and taste intensity in wines with lower pH resulting from ion exchange treatment. However, these wines received lower scores for aroma quality and intensity—likely due to a reduced concentration of fruity esters—although the wine with the lowest pH was the most appreciated in terms of overall quality. In the study by Ibeas et al. [54], red wines with a pH reduction of 0.03 (initial pH 3.55) showed no significant sensory differences compared to the control wine. However, wines with pH reductions of 0.1—0.16—0.19 and 1.09 were perceived as less balanced, with lower body, reduced intensity, and less persistence on the palate than the control.
4. Conclusions
The results of this experimental study showed that partial substitution of Monastrell grape must with acidified must (20% and 30%) using cation exchange resins, as well as the application of tartaric acid after the crushing and destemming stages, significantly reduced pH values and increased total acidity compared to the control wine. Acidified must did not significantly affect the total concentration of phenolic compounds, but did modify anthocyanins and tannins composition. Specifically, partial substitution of acidified must produce a lower formation of high-molecular-weight polymeric pigments and vitisins, which play a key role in color stability. Both methods of acidification also increased the proportion of (-)-epigallocatechin subunits in tannins and improved color quality by increasing chromatic intensity and decreasing hue values. Additionally, resin application more markedly reduced the concentration of pro-oxidant metal cations such as iron, copper, and manganese, contributing to lower values of volatile acidity and a greater stability against oxidation of phenolic compounds. Although the reduction in pH led to a general decrease in aromatic compound concentrations compared to the control, the 30% substitution with acidified must significantly increase the content of fruity esters and floral terpenes, suggesting a more expressive aromatic profile. This was confirmed by sensory analysis, in which these wines were perceived as more aromatic, with stronger fruity notes. All treated wines also exhibited reduced astringency, particularly the Freek30 wine, which was described as fresher on the palate. These findings support the use of cation exchange resins as a cost-effective and viable technological strategy, offering an alternative to direct tartaric acid addition for improving red wine quality—particularly relevant in the context of climate change and in arid and semi-arid regions where acidity loss is increasingly common. Nevertheless, further studies are necessary to evaluate the long-term evolution of phenolic and aromatic compounds in these wines.
Author Contributions
Conceptualization, E.G.-P., R.J.-F., and A.B.B.-O.; methodology, A.M.-M. and A.L.P.-M.; software, A.M.-M. and A.L.P.-M.; validation, A.L.P.-M. and A.M.-M.; formal analysis, A.M.-M. and A.L.P.-M.; investigation, A.M.-M. and A.B.B.-O.; resources, A.M.-M. and A.B.B.-O.; data curation, A.M.-M., A.L.P.-M., and A.B.B.-O.; writing—original draft preparation, A.M.-M. and A.B.B.-O.; writing—review and editing, A.M.-M. and P.S.-B.; visualization, A.M.-M.; supervision, E.G.-P., R.J.-F., A.M.-M. and A.B.B.-O.; project administration, E.G.-P.; funding acquisition, E.G.-P. and A.B.B.-O. All authors have read and agreed to the published version of the manuscript.
Funding
This research received no external funding.
Institutional Review Board Statement
The study was conducted in accordance with the Declaration of Helsinki. Ethical review and approval were waived for this study due to and strictly adheres to the University of Murcia research ethics committee guidelines for sensory analysis of food with trained panels and European and Spanish normative guidelines about Food Safety.
Informed Consent Statement
Informed consent was obtained from all subjects involved in the sensory analysis.
Data Availability Statement
The original contributions presented in this study are included in the article. Further inquiries can be directed to the corresponding author.
Acknowledgments
Paola Sánchez-Bravo was funded by the grant JDC2023-052478-I funded by MCIU/AEI/10.13039/501100011033 and FSE+.
Conflicts of Interest
Ricardo Jurado-Fuentes was employed by AGROVIN S.A., the company that owns the cation-exchange equipment. The remaining authors declare that the research was conducted without any commercial or financial relationships that could be perceived as a potential conflict of interest.
References
- Just-Borràs, A.; Pons-Mercadé, P.; Gombau, J.; Giménez, P.; Vilomara, G.; Conde, M.; Cantos, A.; Canals, J.M.; Zamora, F. Effects of using cationic exchange for reducing ph on the composition and quality of sparkling wine (cava). OENO One 2022, 56, 179–192. [Google Scholar] [CrossRef]
- Sweetman, C.; Sadras, V.O.; Hancock, R.D.; Soole, K.L.; Ford, C.M. Metabolic effects of elevated temperature on organic acid degradation in ripening vitis vinifera fruit. J. Exp. Bot. 2014, 65, 5975–5988. [Google Scholar] [CrossRef]
- Boulton, R. The relationships between total acidity, titratable acidity and ph in wine. Am. J. Enol. Vitic. 1980, 31, 76–80. [Google Scholar] [CrossRef]
- Lafon-Lafourcade, S.; Peynaud, E. Sur l’action antibactérienne de l’anhydride sulfureux sous forme libre et sous forme combinée. OENO One 2016, 8, 187–203. [Google Scholar] [CrossRef]
- Boulton, R.B.; Singleton, V.L.; Bisson, L.F.; Kunkee, E.R. Principles and Practices of Winemaking; Hall, C., Ed.; Springer: New York, NY, USA, 1996; pp. 145–150. [Google Scholar]
- Ribéreau-Gayon, P.; Dubourdieu, D.; Donèche, B.; Lonvaud, A. Handbook of Enology: The Microbiology of Wine and Vinifications, Volume 1, 2nd ed.; John Wiley & Sons: West Sussex, UK, 2005; Volume 44, pp. 481–497. [Google Scholar]
- European Parliament and Council of the European Union. Council Regulation (ec) no 1234/2007 of 22 October 2007 establishing a common organisation of agricultural markets and on specific provisions for certain agricultural products (single cmo regulation). Off. J. Eur. Union 2007, l299, 1–149. [Google Scholar]
- Berg, H.W. Stabilisation des anthocyanes. Comportement de la couleur dans les vins rouges. Ann. Technol. Agric. 1963, 12, 247–259. [Google Scholar]
- Boulton, R. The copigmentation of anthocyanins and its role in the color of red wine: A critical review. Am. J. Enol. Vitic. 2001, 52, 67–87. [Google Scholar] [CrossRef]
- Sheridan, M.K.; Elias, R.J. Reaction of acetaldehyde with wine flavonoids in the presence of sulfur dioxide. J. Agric. Food Chem. 2016, 64, 8615–8624. [Google Scholar] [CrossRef]
- Morata, A. (Ed.) Red Wine Technology; Academic Press: London, UK, 2018. [Google Scholar]
- Martínez-Moreno, A.; Martínez-Pérez, P.; Bautista-Ortín, A.B.; Gómez-Plaza, E. Use of unripe grape wine as a tool for reducing alcohol content and improving the quality and oenological characteristics of red wines. OENO One 2023, 57, 109–119. [Google Scholar] [CrossRef]
- Benito, Á.; Calderón, F.; Benito, S. Mixed alcoholic fermentation of Schizosaccharomyces pombe and Lachancea thermotolerans and its influence on mannose-containing polysaccharides wine composition. AMB Express 2019, 9, 17. [Google Scholar] [CrossRef]
- International Organization of Vine and Wine (IOV). International Code of Oenological Practices, ICOP. ISBN : 978-2-85038-106-5. 2022. Available online: https://www.oiv.int/sites/default/files/publication/2025-04/CPO%202025%20EN.pdf (accessed on 10 June 2025).
- Lasanta, C.; Gómez, J. Tartrate stabilization of wines. Trends Food Sci. Technol. 2012, 28, 52–59. [Google Scholar] [CrossRef]
- Lasanta, C.; Caro, I.; Pérez, L. The influence of cation exchange treatment on the final characteristics of red wines. Food Chem. 2013, 138, 1072–1078. [Google Scholar] [CrossRef]
- Walker, T.; Morris, J.; Threlfall, R.; Main, G. Quality, sensory and cost comparison for ph reduction of syrah wine using ion exchange or tartaric acid. J. Food Qual. 2004, 27, 483–496. [Google Scholar] [CrossRef]
- Ponce, F.; Mirabal-Gallardo, Y.; Versari, A.; Gleisner, F.L. The use of cation exchange resins in wines: Effects on ph, tartrate stability, and metal content. Cienc. Investig. Agrar. Rev. Latinoam. Cienc. Agric. 2018, 45, 82–92. [Google Scholar] [CrossRef]
- Mislata, A.M.; Puxeu, M.; Nart, E.; de Lamo, S.; Ferrer-Gallego, R. Preliminary study of the effect of cation-exchange resin treatment on the aging of tempranillo red wines. LWT 2021, 138, 110669. [Google Scholar] [CrossRef]
- Payan, C.; Gancel, A.-L.; Jourdes, M.; Christmann, M.; Teissedre, P.-L. Wine acidification methods: A review. OENO One 2023, 57, 113–126. [Google Scholar] [CrossRef]
- EEC Commission Regulation. No. 2676/90 determining community methods for the analysis of wines. Off. J. Eur. Communities 1990, L272, 1–192. [Google Scholar]
- Glories, Y. La couleur des vins rouges. Lre partie: Les équilibres des anthocyanes et des tanins. OENO One 1984, 18, 195–217. [Google Scholar] [CrossRef]
- Ho, P.; Silva, M.d.C.M.; Hogg, T.A. Changes in colour and phenolic composition during the early stages of maturation of port in wood, stainless steel and glass. J. Sci. Food Agric. 2001, 81, 1269–1280. [Google Scholar] [CrossRef]
- Smith, P.A. Precipitation of tannin with methyl cellulose allows tannin quantification in grape and wine samples: Technical review. AWRI 2005, 158, 3–7. [Google Scholar]
- Busse-Valverde, N.; Gómez-Plaza, E.; López-Roca, J.M.; Gil-Muñoz, R.; Fernández-Fernández, J.I.; Bautista-Ortín, A.B. Effect of different enological practices on skin and seed proanthocyanidins in three varietal wines. J. Agric. Food Chem. 2010, 58, 11333–11339. [Google Scholar] [CrossRef]
- Martínez-Moreno, A.; Bautista-Ortín, A.B. Evolution and impact of extended pomace maceration in red wines: Chromatic, phenolic and sensory perception. LWT 2025, 225, 117934. [Google Scholar] [CrossRef]
- UNE-ISO 6658:2019; Sensory Analysis—Methodology—General Guidance. ISO: Geneva, Switzerland, 2019. Available online: https://www.une.org/encuentra-tu-norma/busca-tu-norma/norma?c=N0061499 (accessed on 10 July 2025).
- UNE-ISO 4121:2006; Sensory Analysis—Guidelines for the Use of Quantitative Response Scales (ISO 4121:2003). ISO: Geneva, Switzerland, 2006. Available online: https://www.une.org/encuentra-tu-norma/busca-tu-norma/norma?c=N0037445 (accessed on 10 July 2025).
- Pérez Mendoza, A.L.; Martínez-Moreno, A.; Gómez-Plaza, E.; Bautista-Ortín, B. Balancing phenolic maturity and alcohol content: The impact of seed removal on red wines. OENO One 2025, 59. [Google Scholar] [CrossRef]
- Ferreira, J.; Toit, M.D.; Toit, W.J.D. The effects of copper and high sugar concentrations on growth, fermentation efficiency and volatile acidity production of different commercial wine yeast strains. Aust. J. Grape Wine Res. 2006, 12, 50–56. [Google Scholar] [CrossRef]
- Benítez, P.; Castro, R.; Barroso, C.G. Removal of iron, copper and manganese from white wines through ion exchange techniques: Effects on their organoleptic characteristics and susceptibility to browning. Anal. Chim. Acta 2002, 458, 197–202. [Google Scholar] [CrossRef]
- Boulton, R. Red wines. In Fermented Beverage Production; Lea, A.G.H., Piggott, J.R., Eds.; Springer: Boston, MA, USA, 1995; pp. 121–158. [Google Scholar]
- Cosme, F.; Filipe-Ribeiro, L.; Nunes, F.M. Wine stabilisation: An overview of defects and treatments. In Chemistry and Biochemistry of Winemaking, Wine Stabilization and Aging; Cosme, F.M., Nunes, F., Filipe-Ribeiro, L., Eds.; IntechOpen: Rijeka, Croatia, 2021. [Google Scholar]
- McKinnon, A.J.; Scollary, G.R.; Solomon, D.H.; Williams, P.J. The mechanism of precipitation of calcium l(+)-tartrate in a model wine solution. Colloids A 1994, 82, 225–235. [Google Scholar] [CrossRef]
- Ribéreau-Gayon, P.; Glories, Y.; Maujean, A.; Dubourdieu, D. Handbook of Enology. The Chemistry of Wine Stabilisation and Treatments, 2nd ed.; John Wiley & Sons: Chichester, UK, 2006; Volume 2. [Google Scholar]
- Waterhouse, A.L.; Sacks, G.L.; Jeffery, D.W. Understanding Wine Chemistry; John Wiley & Sons: West Sussex, UK, 2016. [Google Scholar]
- Bautista-Ortín, A.B.; Martínez-Cutillas, A.; Ros-García, J.M.; López-Roca, J.M.; Gómez-Plaza, E. Improving colour extraction and stability in red wines: The use of maceration enzymes and enological tannins. Int. J. Food Sci. Technol. 2005, 40, 867–878. [Google Scholar] [CrossRef]
- Casassa, L.F.; Harbertson, J.F. Extraction, evolution, and sensory impact of phenolic compounds during red wine maceration. Annu. Rev. Food Sci. Technol. 2014, 5, 83–109. [Google Scholar] [CrossRef]
- Forino, M.; Picariello, L.; Rinaldi, A.; Moio, L.; Gambuti, A. How must ph affects the level of red wine phenols. LWT 2020, 129, 109546. [Google Scholar] [CrossRef]
- Gambuti, A.; Picariello, L.; Forino, M.; Errichiello, F.; Guerriero, A.; Moio, L. How the management of ph during winemaking affects acetaldehyde, polymeric pigments and color evolution of red wine. Appl. Sci. 2022, 12, 2555. [Google Scholar] [CrossRef]
- González-Manzano, S.; Santos-Buelga, C.; Dueñas, M.; Rivas-Gonzalo, J.C.; Escribano-Bailón, T. Colour implications of self-association processes of wine anthocyanins. Eur. Food Res. Technol. 2008, 226, 483–490. [Google Scholar] [CrossRef]
- Dong, Y.; Li, B.; Lu, F. Physical Chemistry; Scientific Publishing Company: Beijing, China, 2001. [Google Scholar]
- Mira, L.; Fernandez, M.T.; Santos, M.; Rocha, R.; Florêncio, M.H.; Jennings, K.R. Interactions of flavonoids with iron and copper ions: A mechanism for their antioxidant activity. Free Radic. Res. 2002, 36, 1199–1208. [Google Scholar] [CrossRef]
- Kontoudakis, N.; González, E.; Gil, M.; Esteruelas, M.; Fort, F.; Canals, J.M.; Zamora, F. Influence of wine pH on changes in color and polyphenol composition induced by micro-oxygenation. J. Agric. Food Chem. 2011, 59, 1974–1984. [Google Scholar] [CrossRef]
- Vidal, S.; Francis, L.; Guyot, S.; Marnet, N.; Kwiatkowski, M.; Gawel, R.; Cheynier, V.; Waters, E.J. The mouth-feel properties of grape and apple proanthocyanidins in a wine-like medium. J. Sci. Food Agric. 2003, 83, 564–573. [Google Scholar] [CrossRef]
- Peterson, A.L.; Waterhouse, A.L. 1h nmr: A novel approach to determining the thermodynamic properties of acetaldehyde condensation reactions with glycerol, (+)-catechin, and glutathione in model wine. J. Agric. Food Chem. 2016, 64, 6869–6878. [Google Scholar] [CrossRef] [PubMed]
- Oliveira, C.M.; Ferreira, A.C.S.; De Freitas, V.; Silva, A.M.S. Oxidation mechanisms occurring in wines. Food Res. Int. 2011, 44, 1115–1126. [Google Scholar] [CrossRef]
- Danilewicz, J.C. Mechanism of autoxidation of polyphenols and participation of sulfite in wine: Key role of iron. Am. J. Enol. Vitic. 2011, 62, 319–328. [Google Scholar] [CrossRef]
- Vilanova, M.; Genisheva, Z.; Graña, M.; Oliveira, J.M. Determination of odorants in varietal wines from international grape cultivars (Vitis vinifera) grown in nw spain. S. Afr. J. Enol. Vitic. 2013, 34, 212–222. [Google Scholar] [CrossRef]
- Martínez-Moreno, A.; Toledo-Gil, R.; Bautista-Ortin, A.B.; Gómez-Plaza, E.; Yuste, J.E.; Vallejo, F. Exploring the impact of extended maceration on the volatile compounds and sensory profile of monastrell red wine. Fermentation 2024, 10, 343. [Google Scholar] [CrossRef]
- Tian, H.; Xiong, J.; Sun, J.; Du, F.; Xu, G.; Yu, H.; Chen, C.; Lou, X. Dynamic transformation in flavor during hawthorn wine fermentation: Sensory properties and profiles of nonvolatile and volatile aroma compounds coupled with multivariate analysis. Food Chem. 2024, 456, 139982. [Google Scholar] [CrossRef]
- Chigo-Hernandez, M.M.; Tomasino, E. Aroma perception of limonene, linalool and α-terpineol combinations in pinot gris wine. Foods 2023, 12, 2389. [Google Scholar] [CrossRef]
- Jackson, R.S. Wine Science: Principles and Applications; Academic Press: London, UK, 2008. [Google Scholar]
- Ibeas, V.; Correia, A.C.; Jordão, A.M. Wine tartrate stabilization by different levels of cation exchange resin treatments: Impact on chemical composition, phenolic profile and organoleptic properties of red wines. Food Res. Int. 2015, 69, 364–372. [Google Scholar] [CrossRef]
- Walker, T.; Morris, J.; Threlfall, R.; Main, G. Ph modification of cynthiana wine using cationic exchange. J. Agric. Food Chem. 2002, 50, 6346–6352. [Google Scholar] [CrossRef]
- Fontoin, H.; Saucier, C.; Teissedre, P.-L.; Glories, Y. Effect of ph, ethanol and acidity on astringency and bitterness of grape seed tannin oligomers in model wine solution. Food Qual. Prefer. 2008, 19, 286–291. [Google Scholar] [CrossRef]
- Payne, C.; Bowyer, P.K.; Herderich, M.; Bastian, S.E.P. Interaction of astringent grape seed procyanidins with oral epithelial cells. Food Chem. 2009, 115, 551–557. [Google Scholar] [CrossRef]
- Issa-Issa, H.; Lipan, L.; Cano-Lamadrid, M.; Nemś, A.; Corell, M.; Calatayud-García, P.; Carbonell-Barrachina, Á.A.; López-Lluch, D. Effect of aging vessel (clay-tinaja versus oak barrel) on the volatile composition, descriptive sensory profile, and consumer acceptance of red wine. Beverages 2021, 7, 35. [Google Scholar] [CrossRef]

Disclaimer/Publisher’s Note: The statements, opinions and data contained in all publications are solely those of the individual author(s) and contributor(s) and not of MDPI and/or the editor(s). MDPI and/or the editor(s) disclaim responsibility for any injury to people or property resulting from any ideas, methods, instructions or products referred to in the content. |
© 2025 by the authors. Licensee MDPI, Basel, Switzerland. This article is an open access article distributed under the terms and conditions of the Creative Commons Attribution (CC BY) license (https://creativecommons.org/licenses/by/4.0/).