Article

The Effect of Microbial Transglutaminase on the Viscosity and Protein Network of Kefir Made from Cow, Goat, or Donkey Milk

1
Department of Food Hygiene, University of Veterinary Medicine Budapest, István u. 2, H-1078 Budapest, Hungary
2
Department of Livestocks Product and Food Preservation Technology, Institute of Food Science and Technology, Hungarian University of Agriculture and Life Sciences, Ménesi út 43-45, H-1118 Budapest, Hungary
*
Author to whom correspondence should be addressed.
Fermentation 2021, 7(4), 214; https://doi.org/10.3390/fermentation7040214
Submission received: 30 August 2021 / Revised: 25 September 2021 / Accepted: 29 September 2021 / Published: 1 October 2021
(This article belongs to the Special Issue Fermented Foods and Microbes Related to Health)

Abstract

:
In this study, we aim to decrease the fermentation time and to produce low-fat set-type kefir with adequate textural properties using microbial transglutaminase without inactivation. In addition, we reveal the effect of microbial transglutaminase, during and after fermentation, on kefir made with cow, goat, or donkey milk, which is a novel approach. Fermentation is followed by continuous pH and viscosity measurements; the final product is characterized by dry matter content, whey separation, protein pattern, and viscosity parameters, as well as gel firmness. The results show that already 0.5 U/g protein dosage of MTGase decreases pH levels independent of milk type, but MTGase does not influence the kinetics of fermentation. Apparent viscosity could be measured from different stages of fermentation depending on milk type (cow milk, 6 h; goat milk, 8 h; and donkey milk, 9 h). The final product characteristics show that the higher the casein ratio of the applied milk, the better the viscosity and gel firmness of the kefir due to the high reaction affinity of MTGase.

1. Introduction

To reach optimal taste and texture properties, kefir fermentation lasts approximately 18–24 h at 25–27 °C, based on the scientific literature [1,2]. Nowadays, this is considered to be a time-consuming effort; more than two shifts of stable and concise human work are essential. Furthermore, scientists have tended to shift product development to low fat alternatives, which agrees with marketing strategies that try to follow a low-calorie diet due to less physical activity. This tendency is also visible in fermented dairy studies that have demonstrated good textural properties even with low-fat cow milk for yoghurt [3,4,5,6] and for kefir [1,7,8]. Dairy studies in the field have applied texture modifiers such as xanthan [9] or, in most cases, microbial transglutaminase [1,2,7,8,10,11], which are well-known, in the food industry, for their protein crosslinking action [12]. However, in most cases, studies have inactivated microbial transglutaminase (MTGase, E.C. 2.3.2.13) at 80–85 °C for 1 min to avoid the development of pudding-like textures [1,3,4,7], which results in extra heat treatment costs and time loss due to the time needed to cool milk back to the inoculation temperature (25–43 °C), according to the fermented dairy product. In addition to these, published studies with kefir fermentation exist only for cow milk at low-fat levels [1,7,8].
Our research aimed to analyze the final low-fat kefir product and the kinetics of fermentation, both without inactivation of MTGase. Furthermore, we investigated the effect of MTGase with cow milk, as well as goat and donkey milk. Our final aim was to find the shortest fermentation time which enabled low-fat kefir products with appropriate textural properties.

2. Materials and Methods

2.1. Kefir Production Procedure

Low-fat set-type kefir was fermented from 3 different UHT heat-treated milk types: cow milk from a large-sized dairy plant (Alföldi Tej Ltd., Székesfehérvár, Hungary); goat milk from a middle-sized dairy plant (Girau, Arborea, Italy), and donkey milk (fat 1.02 ± 0.14, protein 3.45 ± 0.01) provided by a middle-sized dairy plant (Virágoskút Ltd., Balmazújváros, Hungary). The 3 applied milk types were analyzed using a Lactoscan MCC WS (Mikotronic Ltd., Tsentar, Bulgaria) to determine fat, protein, lactose, and solid nonfat (SNF) contents.
The Activa YG (enzyme activity 113 U/g) commercial preparation of MTGase was kindly provided by Barentz Hungary Ltd., the Hungarian distributor of Ajinomoto GmbH (Hamburg, Germany). Three different enzyme dosages (0.5, 1, and 1.5 U/g protein) were used for manufacturing the low-fat set-type kefir, in addition to a control kefir (without enzyme addition). Therefore, altogether, 4 different kefir/milk types were made for one experiment that was repeated three times.
The kefir starter culture, mainly consisting of mesophilic lactic acid bacteria (Lactococcus lactis, Leuconostoc mesenteroides) and yeasts (Debaryomyces hansenii, Candida Colliculosa), was kindly provided by BiaRia Ltd. (Hungary).
The kefir milk was tempered to 26 °C, and inoculated with 0.8 m/v% kefir starter culture and commercial enzyme preparation (Activa YG), simultaneously. The enzyme was not inactivated, consistent with common practice in the Hungarian food industry, due to the high cost of extra heat treatment. Then, the inoculated and partially enzyme-treated milk types were distributed in 250 mL PP plastic containers and incubated at 26 °C. The fermentation time differed according to milk type: cow milk 10 h, goat and donkey milk 11 h (see also Figure 1a–c). The kinetics of fermentation was followed by pH and rheological measurements. Fermentation was already stopped at pH 4.90 ± 0.05 to avoid over acidification during the time needed to cool down the kefir from 26 to 3 °C. The set-type kefir samples were kept in an industrial refrigerator at 3 ± 1 °C overnight for aging and checked for final pH (cow kefir 4.67 ± 0.05, goat kefir 4.60 ± 0.21, and donkey kefir 4.64 ± 0.10), and then used for further analysis. The analyses of different rheological properties during and after fermentation were done from designated, separate containers. All data presented in this study are the results of 5 independent trials with all milk types.

2.2. Monitoring Lactic Acid Fermentation

The lactic acid fermentation was monitored with simultaneous pH and apparent viscosity measurements at fermentation temperature (26 °C) every 2 h, until a pH of 4.8 was reached. The pH was measured every 2 h with a Testo 206 portable pH meter (Testo AG., Titisee-Neustadt, Germany). The rheological measurements were performed with a Rheomat 115 (Contraves, Switzerland) rotational viscometer, in duplicate. From separate containers, 100 g of each kefir sample was weighed and put into the stainless-steel cylindrical container of the viscosimeter for measurement. The apparent viscosity was calculated according to a previous study [13].

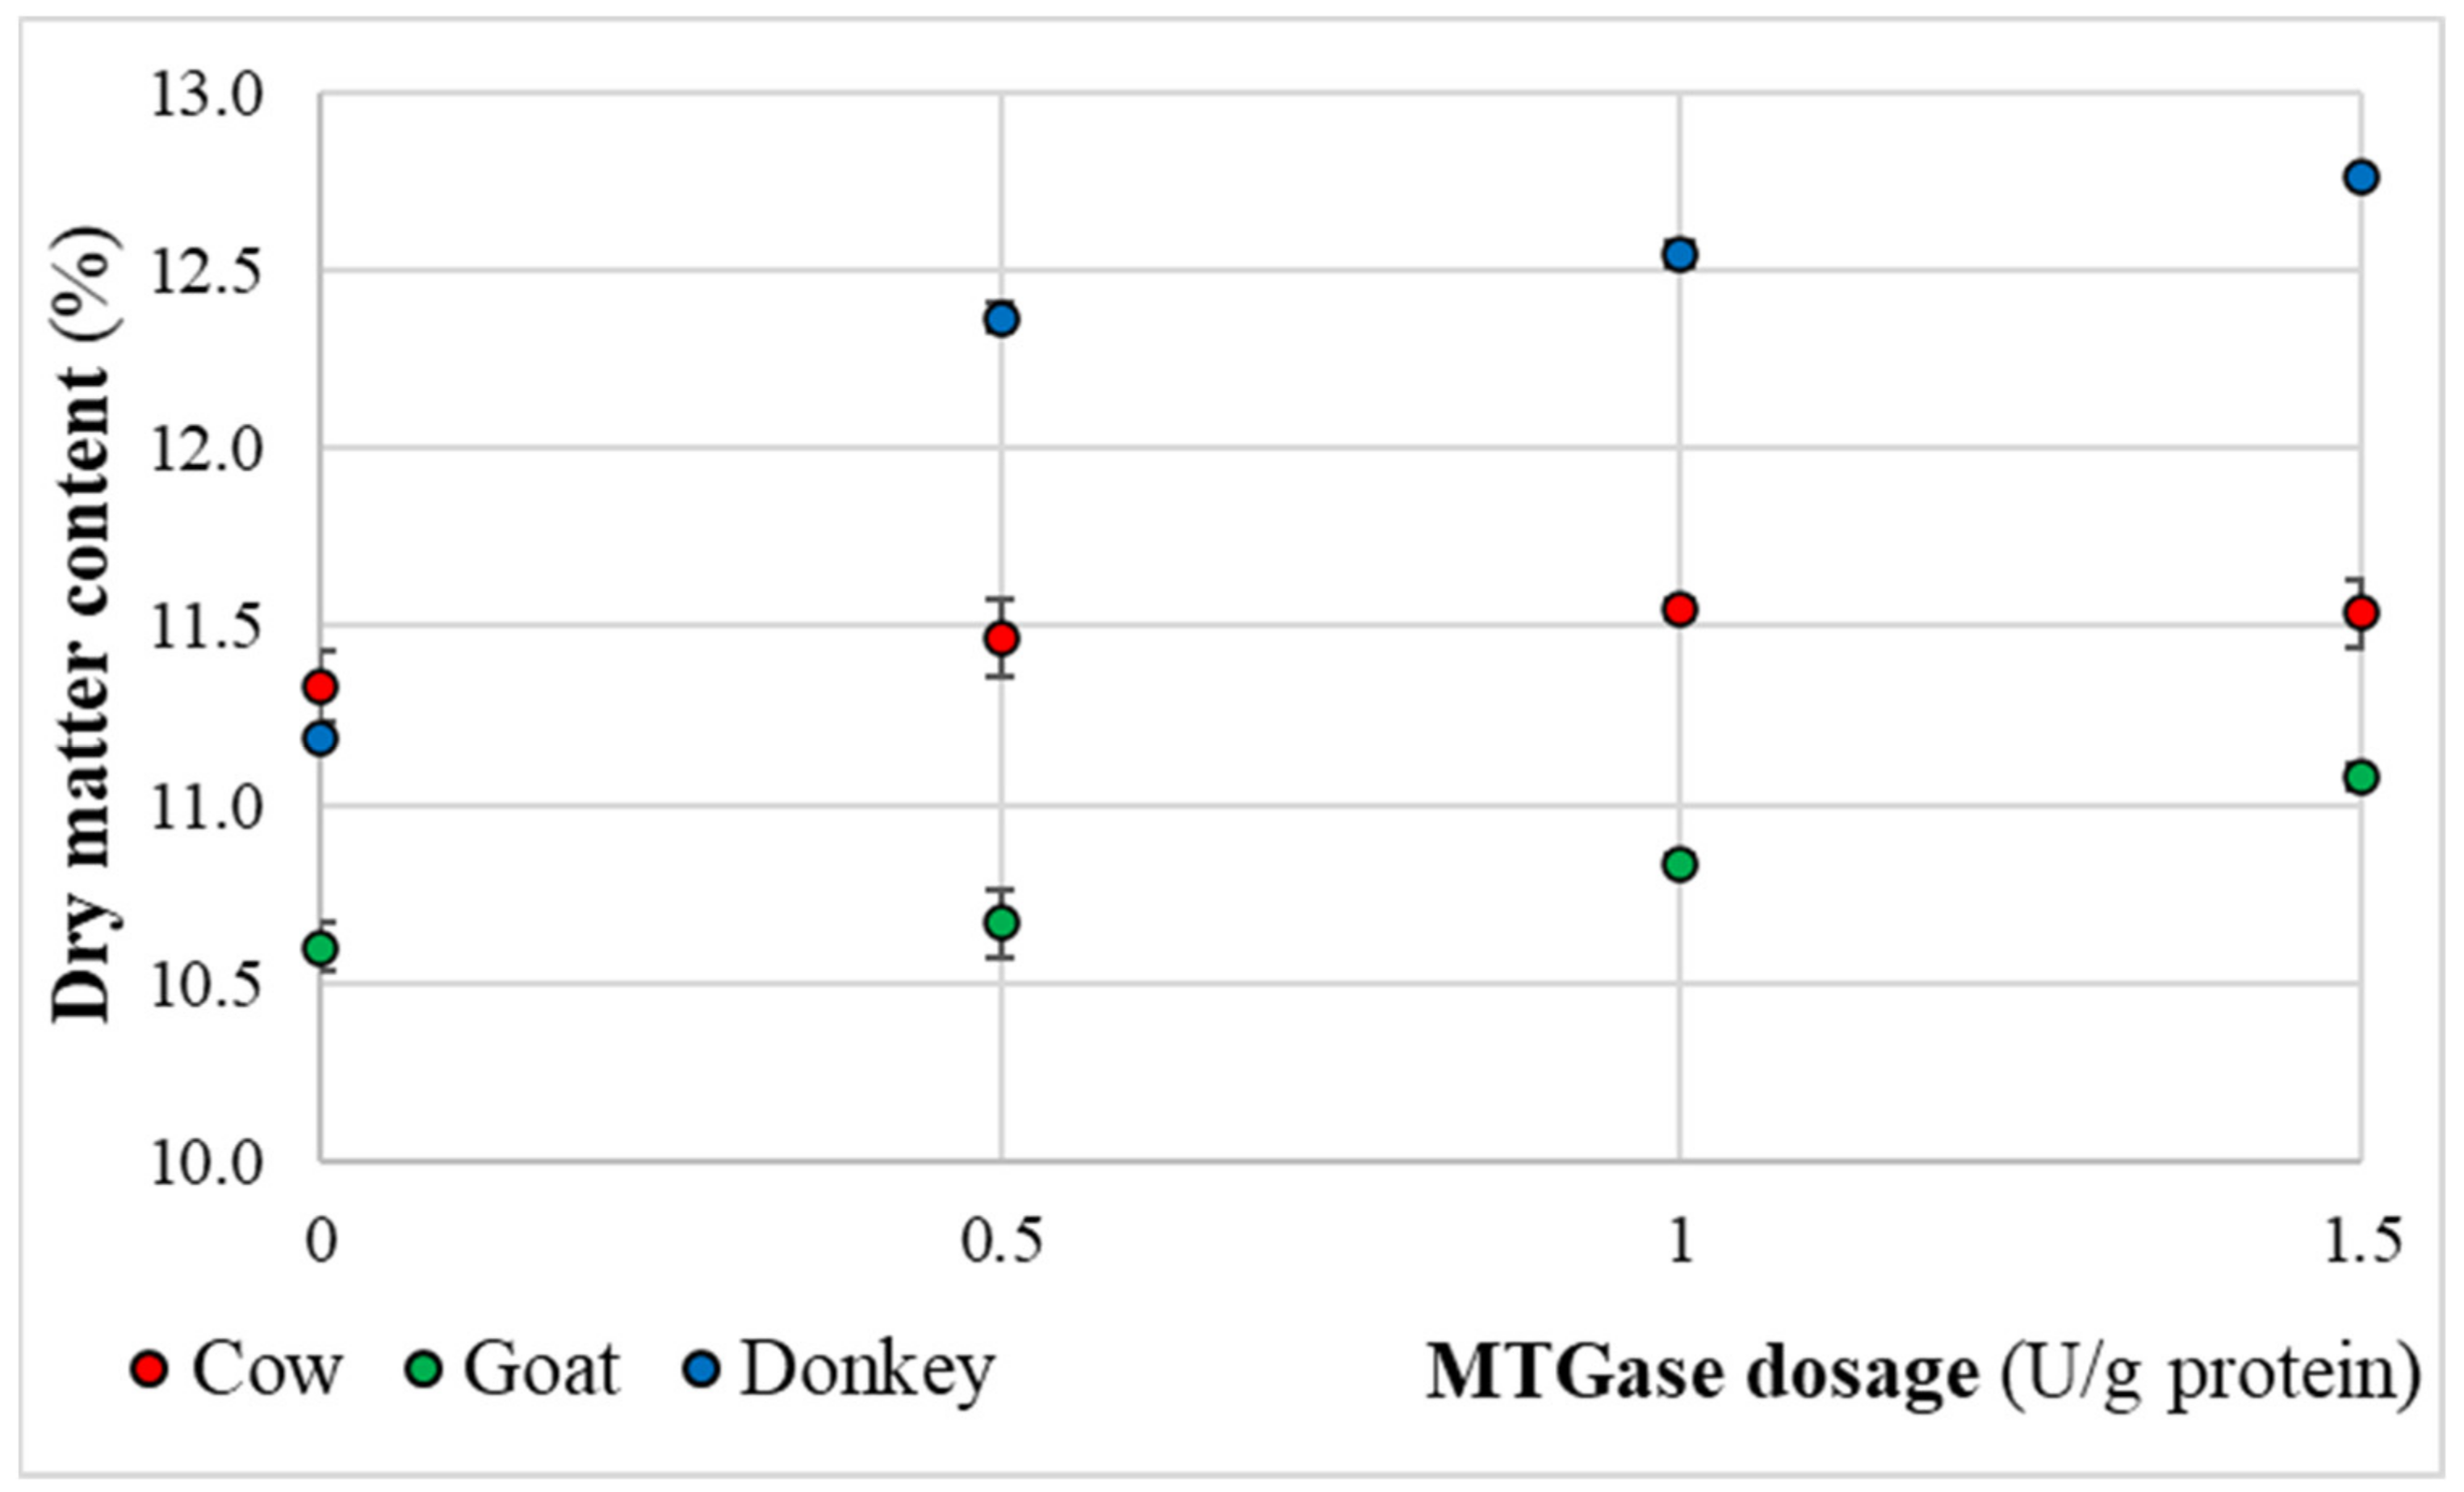
2.3. Dry Matter Content Measurements of the Final Kefir Products

The dry matter (DM) content was determined with an MB 160 moisture analyzer (VWR, Debrecen, Hungary) at 105 °C until constant weight (weight loss ˂ 0.1%/min). All samples were analyzed in triplicate.

2.4. Syneresis-Whey Separation Measurements

The set-type kefirs (50 mL) were centrifuged (6000 rpm, 10 min, 10 °C) with a Beckman J2–21 centrifuge and the separated whey was measured. The results of whey loss were calculated to milliliters of whey separated from 100 mL kefir.

2.5. SDS-PAGE Analysis of the Final Kefir Products

Handcast gels 4–15% (w/v) (acrylamide/bis-acrylamide, 83 mm × 73 mm × 1.0 mm) were used for the electrophoresis and a vertical system was applied during the measurement (Bio-Rad mini-Protean Tetra System, Bio-Rad, Hercules, CA, USA). The protein sizes in the samples were monitored using SDS-PAGE. The range of molecular standard (Precision Plus Protein All Blue Standards, Bio-Rad, Hercules, CA, USA) was 250–10 kDa. The sample extracts were prepared by dilution with the sample buffer (2 × Laemmli sample buffer and 2-mercaptoethanol, Bio-Rad, Hercules, CA, USA). In the case of the cow, goat, and donkey samples 10-fold dilutions were used. The mixture was heated at 100 °C for 2 min. From the dilutions, 5 μL of protein solutions were loaded into the wells and run for 45 min at 200 V. The gels were stained for 30 min with 0.2% Coomassie brilliant blue (R-250, Bio-Rad). The stained gel images were captured using a Gel Doc XR+ System (Bio-Rad). The identification and the densities of the bands were quantified by using Quantity One and Image Lab 6.1 software programs (Bio-Rad, Hercules, CA, USA).

2.6. Gel Firmness Measurements of the Final Kefir Products

The gel structure of the produced set-type kefir was measured with a TA.XTplus (Stable Micro Systems, Great Britain) texture analyzer. The samples were tempered in their original PP containers to 10 °C, and analyzed with a 35 mm diameter cylinder probe, applying 0.5 mm/sec measurement speed. The gel strength was the force recorded at the maximum penetration depth (10 mm). The evaluation of data was performed with the software of the Texture Exponent 32 instrument.

2.7. Rheological Measurements of the Final Kefir Products

For the analyses of the rheological properties of the final kefir samples, 15 mL samples from the designated containers were placed in the sample holder of an Anton Paar (France) MCR 92 rheometer. The shear stress values of the samples were investigated using a CC27 system between 10 and 1000 1/s shear rate, similar to [14], at 15 °C. The Herschel–Bulkley model was used to analyze the flow curves (shear rate-shear stress diagrams). This model was used to describe the rheological properties of samples at 15 °C. Most of the R2 values of the fitted model were higher than 0.99.

2.8. Statistical Analysis

Analysis of variance (ANOVA) along with post hoc tests (Tukey HSD and LSD) were used to compare the variables of pH, dry matter, whey retention, and Herschel–Bulkley model parameters. The effects of enzyme treatment and milk type were analyzed for the mentioned parameters. The data analysis was carried out by SPSS Statistics software 22 (IBM Corp., Armonk, NY, USA).

3. Results

3.1. Analysis and Comparison of the Applied Milk Types for Kefir Production

The chemical composition of the three applied milk types are summarized in Table 1.
In this study, we aimed to have standard low-fat milk in all the applied milk types to show the texture enhancement and whey retention ability of MTGase at these reduced fat levels. This is also important due to the growing consumer demand, mainly in the USA, for fermented foods with reduced fat level [15]. Donkey milk was significantly different from cow and goat milk, in all the analyzed parameters. The main difference was that goat milk was albumin milk with a very low-level casein fraction.

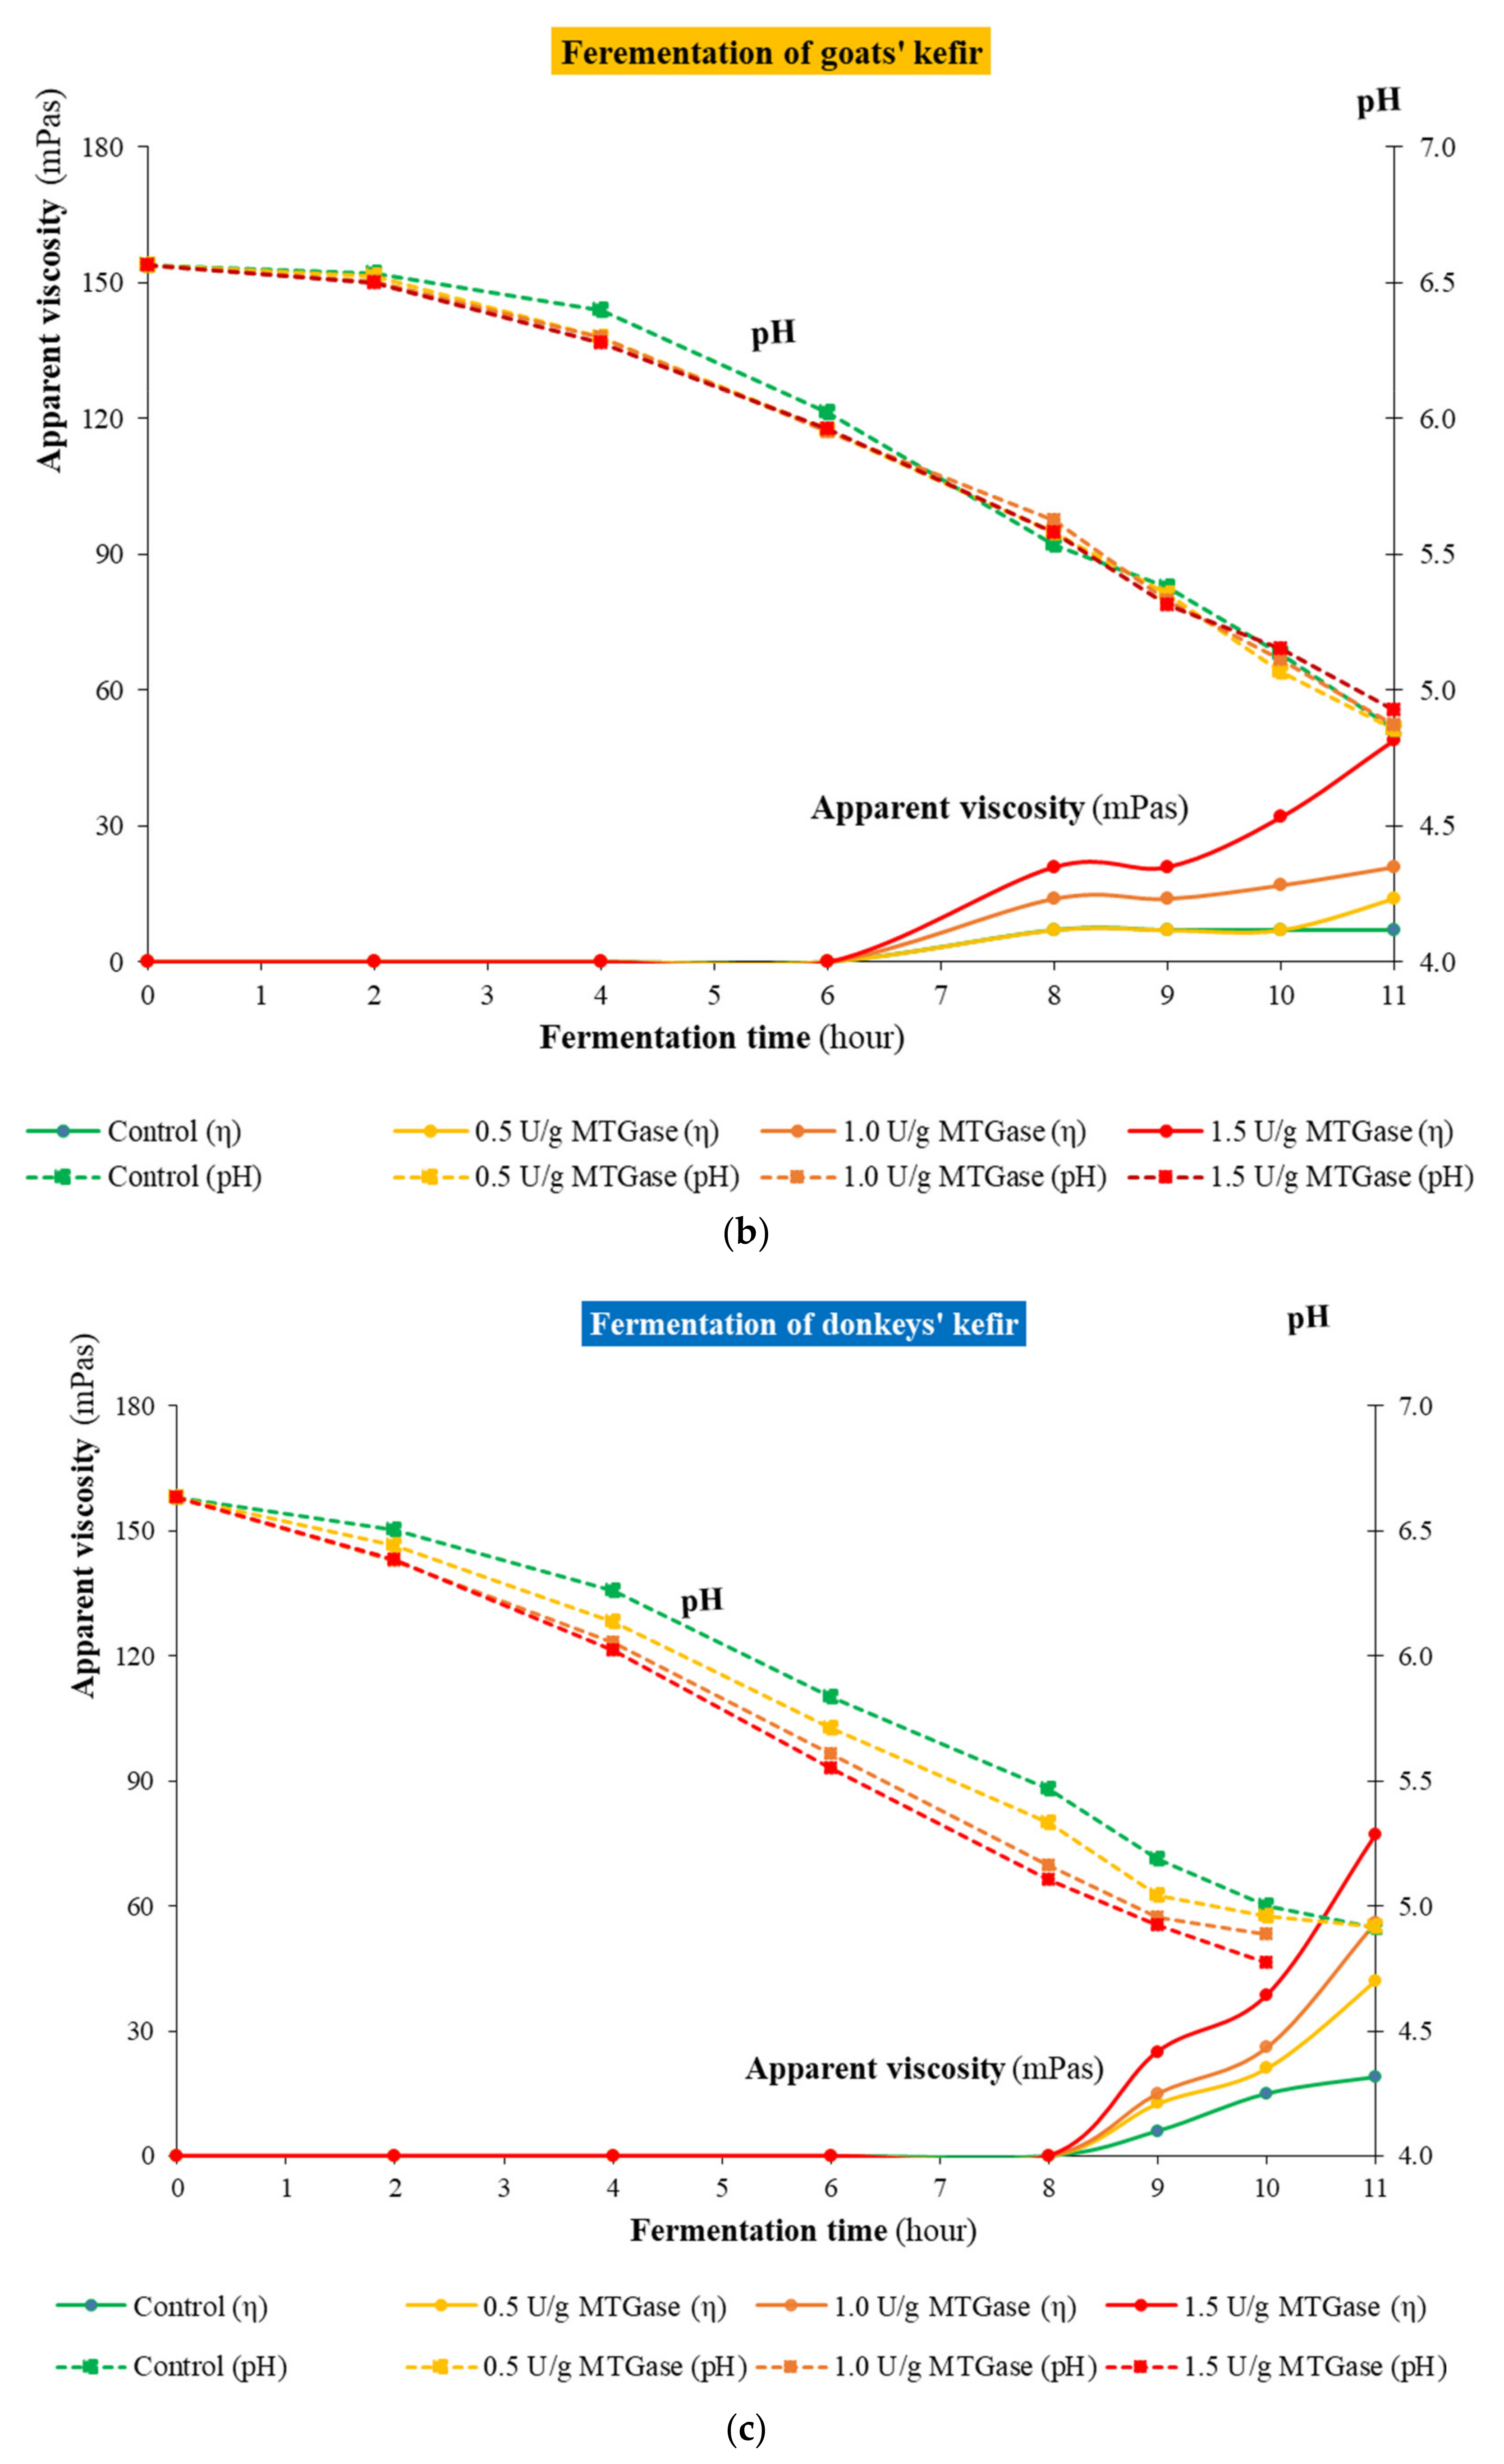
3.2. Kinetics of Kefir Fermentation

The fermentation process of kefir was followed by pH and viscosity measurements every 2 h, as shown in Figure 1a–c.
MTGase enzyme lowers the pH values (only until 0.5 U/g protein) of cow and donkey milk, however, goat milk was not affected. The application of MTGase during fermentation caused higher apparent viscosity, than control samples, which was found for all milk types. The statistical analysis revealed that the final pH of the kefir, for all milk types, differed significantly (p = 0.05) depending on the enzyme addition. It is recognized that cow milk, as casein milk, has the highest apparent viscosity values, which is reflected by a high substrate affinity to MTGase, as has been reported earlier (Ajinomoto 1998), whereas goat and donkey milk, which are mainly comprised of albumin proteins, have relatively low crosslinking activity with MTGase. The fermentation time needed was the fastest as compared with previous studies that achieved 18 h [1] and 24 h [8] fermentation times, both at 25 °C temperature with cow and soy milk, respectively. This was possible due to the lactic acid bacteria and yeast colonies of the kefir starter culture and the applied dosage (0.8 m/v%).

3.3. Physical-Chemical Quality Characteristics of the Final Kefir Products

The results of the dry matter content for the final kefir products, using three different milk types, are shown on Figure 2.
The dry matter contents of the control cow and donkey kefirs were non-significantly different due to their similar protein levels (cow milk protein level 3.29 ± 0.08 and donkey milk protein level 3.45 ± 0.01), but kefir made from goat milk had significantly (p = 0.05) lower dry matter content than that of the other milk types. The use of MTGase resulted in significantly (p = 0.05) higher dry matter content in donkey kefir at all applied enzyme dosages.
The effect of MTGase on whey retention (also known as syneresis) is shown in Figure 3.
Microbial transglutaminase is also preferred due to its whey retention ability, which has been proven by a previous kefir study during storage of low-fat cow kefir [7]. However, in our study, syneresis was not significantly (p = 0.05) influenced by the use of MTGase in the case of cow kefir. These results were consistent for all enzyme dosages and milk types during six independent trials (two measurements/trial); therefore, it can be concluded that the lower the fat level of the applied milk, the less effective MTGase is, in the case of set-type kefir products. This was also clearly reflected by results of kefir made with donkey milk (fat 1.02 ± 0.014) as compared with cow milk (1.26 ± 0.17) or goat milk (1.34 ± 0.02), both of which resulted in less whey loss (see on Figure 3) due to their higher initial milk fat level.

3.4. Protein Patterns of the Kefirs Based on Gel Electrophoresis

Figure 4 shows the results of the SDS-PAGE analysis of the kefirs made from three different milk types.
The proteins contained in the kefir samples prepared with and without m-TG were analyzed by means of SDS-PAGE. The first column is the molecular standard, which makes the identification of proteins possible from 250 to 10 kDa. The whey protein fraction in bovine milk is dominated by β-lactoglobulin (β-lg), which accounts for ∼50% of the total whey protein, and α-lactalbumin (α-lac) comprises 20% of the total whey protein [16]. In parallel, we found that proteins were detectable during molecular weight separation at the molecular weights of typical milk proteins. Caseins (αS1-CN, β-CN, and κ-CN) range from 23 to 29 kDa, β-lactoglobulin (β-LG) at ~16 kDa, and α-lactalbumin (α-LA) variants from 11 to 12 kDa. In the case of cow, goat, and donkey kefir samples treated with transglutaminase, we were able to detect clearly visible transglutaminase in some of the examined samples. Bands of the enzyme were detectable at ~38 kDa in the samples. However, it can be seen that the m-TG bands with the highest intensity were observed in the case of cow and donkey kefirs in the 0.5, 1, and 1.5 U/g protein samples.

3.5. Gel Firmness of the Final Kefir Products

Gel firmness or gel strength represents the hardness of kefir curd, and therefore the quality of the set-type fermented dairy products. The results of the set-type kefir gels are presented on Figure 5.
According to our study, application of MTGase increased the gel firmness but only in the case of low-fat kefir made from cow milk. This is reflected by the significantly higher apparent viscosity values described and discussed earlier. The obtained results are the averages of six independent trials (six measurement/trial). Probably, the difference in gel firmness is mostly due to the high casein/whey protein ratio of cow milk (casein protein 86% and whey protein 14%), which are highly reactive with MTGase. However, goat milk has a casein/whey protein ratio (81:19) that is similar to that of cow milk [17], but it has a lower concentration of αs1-casein, which is the main substrate of MTGase. Donkey milk is albumin milk with very low casein fraction (casein protein 47% and whey protein 53%) [18] and a subsequent amount of α-lactalbumin that has very low reaction ability with MTGase [19], which is also reflected in the experienced gel firmness values.

3.6. Rheological Characterization of the Final Kefir Products

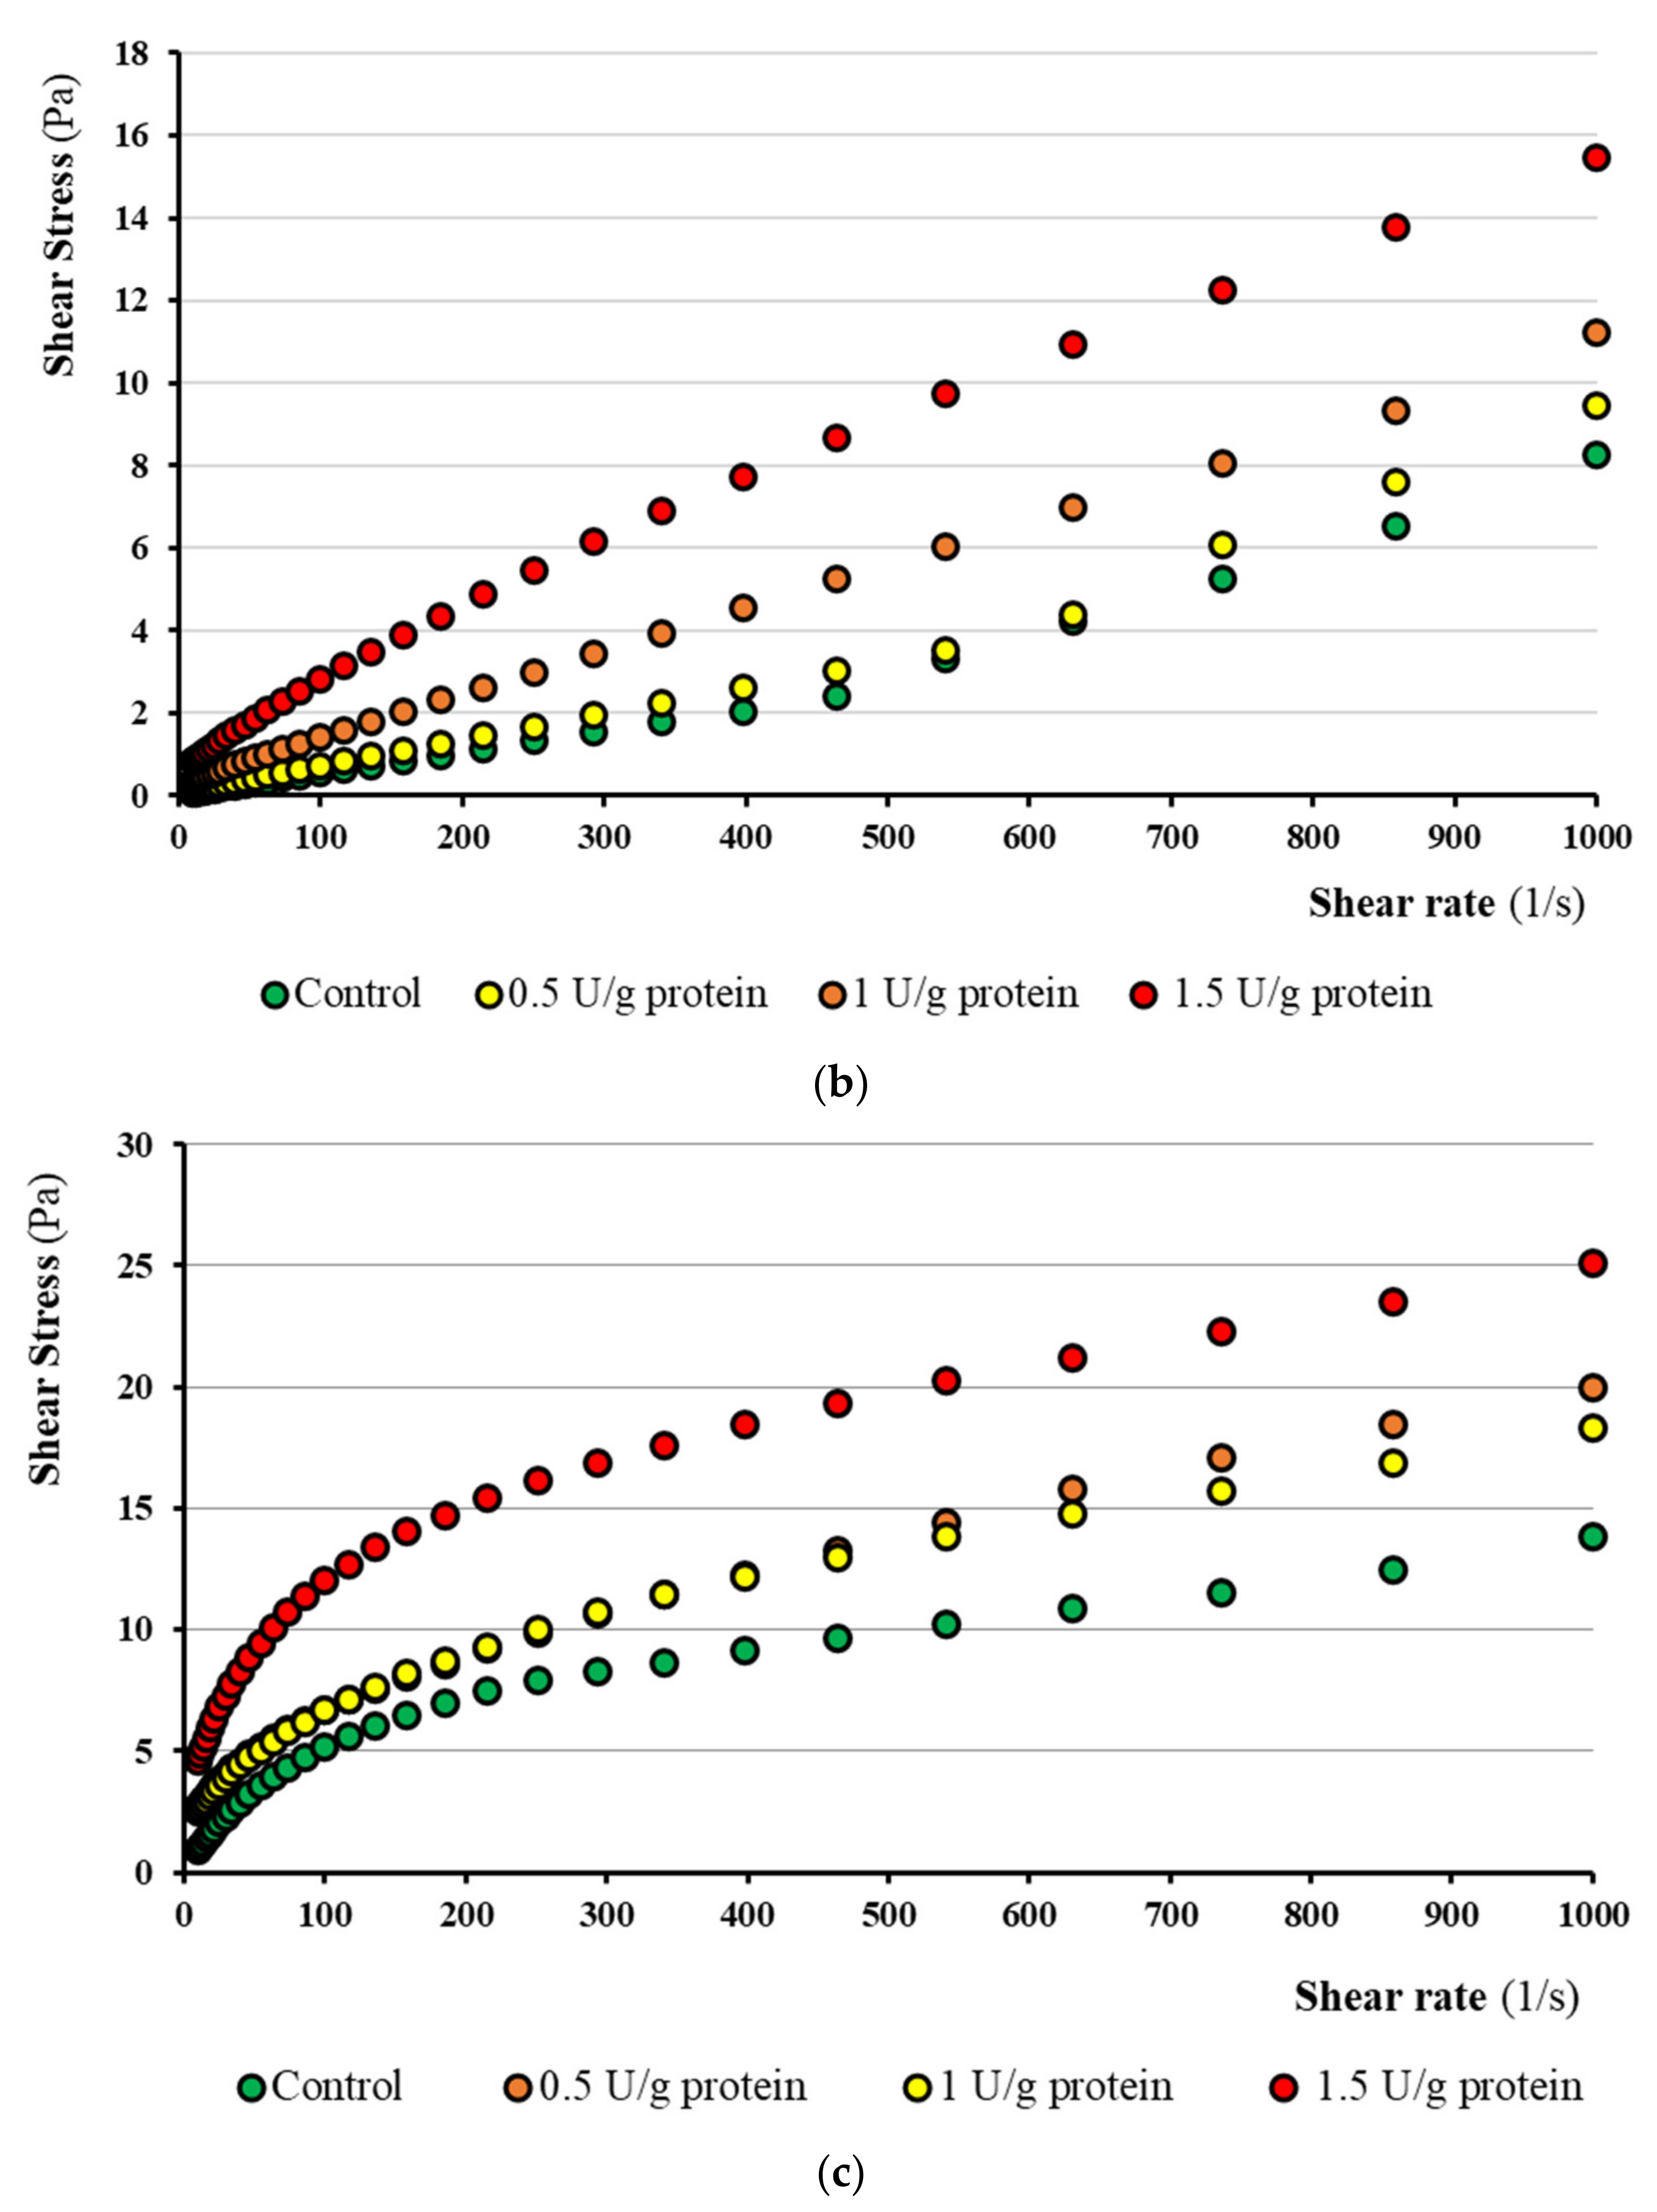
3.6.1. Rheological Flow Curves

Figure 6 shows the flow curves of the kefir samples made from different milks with different MTGase concentrations. The samples from cow milk with 1 and 1.5 U/g protein MTGase concentrations have a very specific flow behavior in the initial shear rates (between 10 and 40 1/s).
This may be explained by the breaking of kefir curd caused by spinning of the measuring head. A similar flow behavior was reported by [20] in the case of HHP-treated liquid egg white. In the case of kefir made from goat milk, an almost Newtonian fluid behavior is represented in Figure 6b. The higher the MTGase concentration used, the higher the shear stress value measured. The shear stress of the kefir samples made from goat milk are MTGase concentration dependent. The higher the MTGase concentration used, the higher the shear stress value measured. The kefir from goat milk had the lowest shear stress value which showed that its curd was the thinnest as compared with all the investigated samples. In contrast, the samples made from donkey milk had pseudoplastic (shear thickener) flow behavior, which is shown in Figure 6c). The lowest shear stress value was measured for the control sample and the highest shear stress value was measured in the case of 1.5 U/g protein MTGase concentrations. A study by [10] reported similar results in the case of kefirs made from cow milk with different MTGase concentrations. It was found that a higher MTGase concentration increased the viscosity of samples. In our results, this was demonstrated not only in the case of cow milk samples but also in the case of goat and donkey milk samples.

3.6.2. Herschel–Bulkley Model

Table 2 summarizes the calculated τ0 values of the kefir samples using the Herschel–Bulkley model. Cow milk samples have an increasing tendency with increasing MTGase concentration.
The increasing tendency may be clarified by the higher initial shear stress values measured (when the spinning of the measuring head was breaking the curd). The samples from donkey milk have a similar increasing tendency, although statistically significant only in the case of the 1.5 U/g protein concentration. The τ0 values of kefir samples made from goat milk show a decreasing tendency with higher MTGase concentration, which is statistically significant, even in the case of 0.5 U/g protein MTGase concentration.
Table 3 represents the consistency values of samples from the calculated Herschel–Bulkley models. The samples made from all milk types show an increasing tendency in calculated consistency, i.e., the higher the enzyme concentration used, the higher the C values calculated.
An increasing tendency is visible in shear stress values as well (Figure 6a–c). A slightly increasing tendency is found in the case of samples made from goat milk, but only 1 and 1.5 U/g protein MTGase concentrations were found to be statistically significant. Although the consistency value of donkey kefir was slightly decrease by using 0.5 U/g protein MTGase concentration, 1 and 1.5 U/g protein concentrations increased the consistency as compared with the control sample. The most consistent kefir sample was made from cow milk applying an enzyme concentration of 1.5 U/g protein MTGase, which was well represented by the shear stress values (Figure 6a). Similar to our results, a study by [9] found that the addition of MTGase increased the consistency of kefir drinks made from cow milk. In addition, Persian gum has been shown to improve the consistency and viscosity of kefir samples [2]; therefore, the consistency of kefirs made from goat and donkey milk with MTGase may also be improved by the addition of Persian gum.

4. Discussion

The kinetics of pH decreasing during fermentation was mainly influenced by the milk type applied for the given kefir production. This reflects the importance of selecting an adequate kefir starter culture according to the milk type used for kefir production. In the cases of kefir made from goat or donkey milk, the fermentation lasted 11 h, which was 1 h longer than that from cow milk. The applied kefir culture and dosage resulted in 8–14 h less fermentation time in the case of cow kefir as compared with previous studies, which also highlights the possibility of producing low-fat set-type kefir with less manufacturing time and cost. Gel electrophoresis showed detectable difference in the protein patterns of cow and goat milk treated with MTGase. Whey retention was improved by MTGase according to the fat levels of the applied milk types, which was the most obvious in donkey kefir. The rheological measurements revealed the importance of the casein ratio in the milk used for kefir fermentation, since cow milk with a high casein content could be crosslinked with MTGase, and therefore reached a high viscosity level during the fermentation as well as in the final product. Our study revealed that MTGase is only effective if low-fat set-type kefir is made from cows’ milk. In the case of goat and donkey milk, other texture modifiers are also highly recommended at low-fat level.

Author Contributions

Conceptualization, L.D.; methodology, L.D., A.T., and B.C.; formal analysis, L.D., A.T., B.C., A.S., and M.H.; investigation, L.D., A.T., B.C., A.S. and M.H.; resources, K.P.-H., and P.L.; writing—original draft preparation and review and editing, L.D., A.T., and B.C. All authors have read and agreed to the published version of the manuscript.

Funding

This research received no external funding.

Institutional Review Board Statement

Not applicable.

Informed Consent Statement

Not applicable.

Acknowledgments

We would like to express our profound gratitude to Barentz Hungary Ltd. for providing us with the commercial microbial transglutaminase enzyme preparation used in this study. We wish to thank BiaRia Hungary for providing us with the applied kefir starter culture.

Conflicts of Interest

The authors declare no conflict of interest.

References

  1. Temiz, H.; Dağyıldız, K. Effects of Microbial Transglutaminase on Physicochemical, Microbial and Sensorial Properties of Kefir Produced by Using Mixture Cow’s and Soymilk. Korean J. Food Sci. Anim. Resour. 2017, 37, 606–616. [Google Scholar] [CrossRef] [PubMed] [Green Version]
  2. Beirami-Serizkani, F.; Hojjati, M.; Jooyandeh, H. The effect of microbial transglutaminase enzyme and Persian gum on the characteristics of traditional kefir drink. Int. Dairy J. 2021, 112, 104843. [Google Scholar] [CrossRef]
  3. Bönisch, M.P.; Huss, M.; Weitl, K.; Kulozik, U. Transglutaminase cross-linking of milk proteins and impact on yoghurt gel properties. Int. Dairy J. 2007, 17, 1360–1371. [Google Scholar] [CrossRef]
  4. Guyot, C.; Kulozik, U. Effect of transglutaminase-treated milk powders on the properties of skim milk yoghurt. Int. Dairy J. 2011, 21, 628–635. [Google Scholar] [CrossRef]
  5. Romeih, E.A.; Abdel-Hamid, M.; Awad, A.A. The addition of buttermilk powder and transglutaminase improves textural and organoleptic properties of fat-free buffalo yoghurt. Dairy Sci. Technol. 2014, 94, 297–309. [Google Scholar] [CrossRef] [Green Version]
  6. Pakseresht, S.; Mazaheri Tehrani, M.; Razavi, S.M.A. Optimization of low-fat set-type yoghurt: Effect of altered whey protein to casein ratio, fat content and microbial transglutaminase on rheological and sensorial properties. J. Food Sci. Technol. 2017, 54, 2351–2360. [Google Scholar] [CrossRef] [PubMed]
  7. Wróblewska, B.; Kołakowski, P.; Pawlikowska, K.; Troszyńska, A.; Kaliszewska, A. Influence of the addition of transglutaminase on the immunoreactivit of milk proteins and sensory quality of kefir. Food Hydrocoll. 2009, 23, 2434–2445. [Google Scholar] [CrossRef]
  8. Beirami-Serizkani, F.; Hojjati, M.; Jooyandeh, H. Influence of the addition of transglutaminase on the immunoreactivity of milk proteins and sensory quality of kefir. In Proceedings of the 4th International Student Bioltechnology Congress, Tehran, Iran, 25–27 February 2019; Volume 23, pp. 238–239. [Google Scholar]
  9. Sabooni, P.; Pourahmad, R.; Adeli, H.R.M. Improvement of viability of probiotic bacteria, organoleptic qualities and physical characteristics in kefir using transglutaminase and xanthan. Acta Sci. Pol. Technol. Aliment. 2018, 17, 141–148. [Google Scholar] [CrossRef]
  10. Setyawardani, T.; Sumarmono, J.; Rahardjo, A.H.D.; Widayaka, K.; Santosa, R.S. Texture Profile and Sensory Characteristics of Kefir with Colostrum Addition. IOP Conf. Ser. Earth Environ. Sci. 2019, 372, 012036. [Google Scholar] [CrossRef]
  11. Baranowska, M.; Staniewski, B.; Bohdziewicz, K. Effect of transglutaminase on selected properties of kefir. Milchwissenschaft 2012, 67, 424–427. [Google Scholar]
  12. Kieliszek, M.; Misiewicz, A. Microbial transglutaminase and its application in the food industry. A Review. Folia Microbiol. 2014, 59, 241–250. [Google Scholar] [CrossRef] [PubMed] [Green Version]
  13. Darnay, L.; Len, A.; Koncz, Á.; Friedrich, L. Small angle neutron scattering study of nanostructural changes in microbial transglutaminase-treated low-fat yogurt during fermentation. Food Sci. Biotechnol. 2015, 24, 2125–2128. [Google Scholar] [CrossRef]
  14. Hidas, K.I.; Németh, C.; Le Nguyen, P.F.; Visy, A.; Tóth, A.; Barkó, A.; Friedrich, L.; Nagy, A.; Nyulas-Zeke, I.C. Effect of cryogenic freezing on the rheological and calorimetric properties of pasteurized liquid egg yolk. Czech J. Food Sci. 2021, 2021. 39, 181–188. [Google Scholar] [CrossRef]
  15. Astrup, A.; Rica, N.; Geiker, W.; Magkos, F. Effects of Full-Fat and Fermented Dairy Products on Cardiometabolic Disease: Food Is More Than the Sum of Its Parts. Adv. Nutr. 2019, 10, 924S–930S. [Google Scholar] [CrossRef] [PubMed]
  16. Crowley, S.V.; Dowling, A.P.; Caldeo, V.; Kelly, A.L.; O’Mahony, J.A. Impact of α-lactalbumin:β-lactoglobulin ratio on the heat stability of model infant milk formula protein systems. Food Chem. 2016, 194, 184–190. [Google Scholar] [CrossRef] [PubMed]
  17. Mati, A.; Senoussi-Ghezali, C.; Si Ahmed Zennia, S.; Almi-Sebbane, D.; El-Hatmi, H.; Girardet, J.-M. Dromedary camel milk proteins, a source of peptides having biological activities–A review. Int. Dairy J. 2017, 73, 25–37. [Google Scholar] [CrossRef]
  18. Vincenzetti, S.; Pucciarelli, S.; Polzonetti, V.; Polidori, P. Role of proteins and of some bioactive peptides on the nutritional quality of donkey milk and their impact on human health. Beverages 2017, 3, 34. [Google Scholar] [CrossRef]
  19. AJINOMOTO: ACTIVA General Information–Transglutaminase Basics. 1998. Available online: http://docplayer.net/20711824-Activa-general-information.html (accessed on 22 August 2021).
  20. Németh, C.; Tóth, A.; Hidas, K.I.; Surányi, J.; Friedrich, L. HHP treatment of liquid egg products. J. Phys. Conf. Ser. 2020, 1609, 012012. [Google Scholar] [CrossRef]
Figure 1. Kinetics of kefir fermentation: (a) cow milk kefir at different MTGase dosages; (b) goat milk kefir at different MTGase dosages; (c) donkey milk kefir at different MTGase dosages.
Fermentation 07 00214 g001aFermentation 07 00214 g001b
Figure 2. Dry matter content of the set-type kefir products made from different milk types (cow, goat, or donkey milk) and MTGase dosages (0–1.5 U/g protein).
Fermentation 07 00214 g002
Figure 3. Syneresis of the set-type kefir products made from athe different milk types (cow, goat, or donkey milk) and MTGase dosages (0–1.5 U/g protein).
Fermentation 07 00214 g003
Figure 4. Results of SDS-PAGE of untreated and m-TG treated cow, goat, and donkey kefir: (1) Molecular standard; (25) control (2), cow kefir with 0.5 U/g protein MTGase (3), cow kefir with 1 U/g protein MTGase (4), cow kefir with 1.5 U/g protein MTGase (5); (69) control (6), goat kefir with 0.5 U/g protein MTGase (7), goat kefir with 1 U/g protein MTGase (8), goat kefir with 1.5 U/g protein MTGase (9); (1013) control (10), donkey kefir with 0.5 U/g protein MTGase (11), donkey kefir with 1 U/g protein MTGase (12), donkey kefir with 1.5 U/g protein MTGase (13).
Fermentation 07 00214 g004
Figure 5. Effect of MTGase on the gel firmness of kefir made from cow, goat, or donkey milk.
Fermentation 07 00214 g005
Figure 6. (a) Flow curves of the kefir samples made from cow milk; (b) flow curves of the kefir samples made from goat milk; (c) flow curves of kefir samples made from donkey milk.
Fermentation 07 00214 g006aFermentation 07 00214 g006b
Table 1. Chemical composition of the three applied milk types for kefir production.
Chemical CompositionCowGoatDonkey
Fat (%)1.26 ± 0.171.34 ± 0.021.02 ± 0.14 *
Protein (%)3.29 ± 0.083.14 ± 0.14 3.45 ± 0.01 *
Lactose (%)4.90 ± 0.124.65 ± 0.185.23 ± 0.02 *
Solid nonfat (%)8.92 ± 0.228.45 ± 0.339.50 ± 0.03 *
pH 6.64 ± 0.046.56 ± 0.027.14 ± 0.05 *
Stars indicate significant statistical differences (p ˂ 0.05) from the values of the same row.
Table 2. Calculated τ0 values of the kefir samples using the Herschel–Bulkley model (significant difference to control (p = 0.05), A Tukey HSD and B LSD).
τ0 (Pa)CowGoatDonkey
Control0.94 ± 0.041.44 ± 0.040.00 ± 0.00
0.5 U/g protein0.34 ± 0.01 AB1.42 ± 0.04 AB0.00 ± 0.00
1 U/g protein13.82 ± 0.52 AB0.40 ± 0.01 AB0.01 ± 0.00
1.5 U/g protein19.66 ± 1.22 AB0.30 ± 0.01 AB1.36 ± 0.03 AB
Table 3. Calculated C (consistency) values of the kefir samples using the Herschel–Bulkley model (significant difference to control (p = 0.05), A Tukey HSD and B LSD).
C (Pas)CowGoatDonkey
Control0.22 ± 0.030.00 ± 0.000.06 ± 0.00
0.5 U/g protein1.38 ± 0.01 AB0.00 ± 0.000.05 ± 0.00 AB
1 U/g protein2.69 ± 0.06 AB0.01 ± 0.00 B0.89 ± 0.02 AB
1.5 U/g protein4.27 ± 0.07 AB0.06 ± 0.00 AB2.31 ± 0.00 AB
Publisher’s Note: MDPI stays neutral with regard to jurisdictional claims in published maps and institutional affiliations.

