Article

Microstructural, Volatile Compounds, Microbiological and Organoleptical Characteristics of Low-Fat Buffalo Milk Yogurt Enriched with Whey Protein Concentrate and Ca-Caseinate during Cold Storage

1
Department of Food Science and Human Nutrition, College of Agriculture and Veterinary Medicine, Qassim University, Buraydah 51452, Saudi Arabia
2
Department of Food Technology, Faculty of Agriculture, Benha University, Moshtohor 13736, Egypt
3
Department of Biochemistry, Faculty of Agriculture, Benha University, Moshtohor 13736, Egypt
4
Department of Dairy Science, Faculty of Agriculture, Benha University, Moshtohor 13736, Egypt
*
Author to whom correspondence should be addressed.
Fermentation 2021, 7(4), 250; https://doi.org/10.3390/fermentation7040250
Submission received: 5 September 2021 / Revised: 26 October 2021 / Accepted: 29 October 2021 / Published: 31 October 2021
(This article belongs to the Section Fermentation for Food and Beverages)

Abstract

:
Yogurt is a popular fermented milk product across the world. Structure, taste, and odor characteristics are created by fermenting yogurt with diverse ingredients and lactic acid bacteria (LAB), which contribute the most to the acceptance and quality of yogurt. In this study, low-fat buffalo milk yogurts (LFBY) were produced with the enrichment of 1% (w/w) whey protein concentrate (WPC) and Ca-caseinate (Ca-CN). Yogurts were analyzed based on microstructural, microbiological, organoleptical properties; volatile compounds (solid-phase microextraction method associated with gas chromatography-mass spectrometry) during cold storage for 21 days. Yogurts enriched with WPC and Ca-CN had higher total solids, total protein contents, and pH values. A total of 36 volatile components were identified in all produced yogurts. Acetic acid, butanoic acid, acetaldehyde, acetoin, 2,3-butanedione, ethanol, and 1-heptanol were found in significant amounts and mainly contributed to organoleptical properties. Interestingly, the focused volatile compounds that improve taste and odor were higher in LFBY+WPC yogurt than in plain LFBY or LFBY+Ca-CN yogurt. The Streptococcus thermophilus and Lactobacillus delbrueckii subsp. bulgaricus viable counts were higher in LFBY+WPC yogurt than plain LFBY or/and LFBY+Ca-CN. Conclusively, yogurt enriched with 1% WPC exhibited the best organoleptical properties and volatile component concentrations. The microstructure of the LFBY with WPC was less compact and dense, and regular, with tiny pores and long and individualized casein filaments than the other treatments. The microstructure of the Ca-CN samples caused a compact structure and coarse than in the control yogurt.

1. Introduction

Yogurt has been increasingly accepted as a fermented dairy product in the diet planning for different communities. Cow, camel, and buffalo milks can be used individually or in combinations for yogurt production [1]. Buffalo milk (BM) has a higher fat and total solids (TS) level than cow milk [2]. Low-fat yogurt is the most popular among these dairies, but it may have flavor, aroma, and texture challenges due to its low-fat content [3]. In general, the flavor is an important impact on quality. Many ingredients have been applied to improve the organoleptic, chemical, textural, and nutritional characteristics of yogurt and other fermented milk products such as whey protein concentrate (WPC), Ca-caseinate (Ca-CN), and starter strains [1,3,4]. These ingredients contribute an essential role in people’s diet with proven beneficial effects on human health [5]. However, the addition of Na-caseinate (Na-CN), WPC, and other solid milk powders gained popularity due to their functional, nutritional, and/or low-cost qualities [4,6]. Many studies have been conducted on the properties of powdered whey protein products with high protein levels [i.e., WPC or whey protein isolate (WPI)] in infant formulations [7].
Flavor compounds are considered one of the increasingly essential properties measuring consumers’ acceptance of dairy products [8]. The typical flavor and aroma of yogurts directly contribute to flavor compounds, including diacetyl, acetaldehyde, acetoin, and acetone [9]. In general, the production of flavor compounds is affected by the protein type of yogurts [10] and the bacterial type levels in mixed strain culture [11]. In a previous study, most flavor compounds were lower in yogurts enriched with caseinate [10]. Furthermore, few authors have demonstrated the effect of protein type on both aroma release characteristics and the structure of the yogurt complex matrix [10]. Gas chromatography (GC) methods have been increasingly applied in analyzing the volatile compounds of food and dairy products [12]. Several methods have been used to identify and quantify flavor compounds in various dairy products [12,13].
Enrichment of yogurt with various dry dairy materials may change the proteolytic activities of yogurt starters because of various concentrations and fractions of proteins in yogurt products [14,15]. The peptides, peptones, and amino acids partially lead to the production of volatile (aroma and taste) compounds by reacting chemicals that produce volatile compounds in yogurt [9,16,17]. In a previous study, Isleten and Karagul-Yuceer [18] enriched nonfat yogurt by Na-CN, texture improver, and WPI to give better organoleptic and physical characteristics. WPI improved the physical characteristics of nonfat yogurt, which may be due to the lowest syneresis and the excellent viscosity. In addition, these authors observed that nonfat yogurt enriched by Na-CN was the most preferred treatment by consumers [19]. In the same context, Akalın et al. [19] showed that milk enrichment by 2% of Na-CN and Ca-CN gave better physical properties to probiotic yogurt produced by Bifidobacterium lactis Bb12. Actually, yogurt is usually prepared using milk and lactic acid bacteria (LAB) starter cultures, including Lb. delbrueckii subsp. bulgaricus and Str. thermophilus without other additives [17]. LAB is an industrially important group of bacteria used in the fermented food industry, especially in the manufacture of yogurt. The primary functions of starter LAB strains are to form lactic acid contributed to the gel production in yogurt. In addition, LBA contributes an essential role in producing typical yogurt aroma and taste [20].
Gel production is one of the main characterizations in yogurt manufacture. Yogurt structures obtain casein aggregation by pH dropping and disulfide bonding between κ-casein (κ-CN) and denatured whey proteins [19,21]. Protein supplementation and heat treatment are the most important treatments that determine yogurt’s microstructure and textural properties [22,23,24]. The effects of TS content and protein are sometimes challenging to study separately, as the two variables cannot be modified independently [25]. Tamime and Robinson [9] observed that according to the protein and TS levels, the most significant change in body and texture was ranged from 0.3 to 2.0 and 12 to 14 g 100 g−1, respectively, in yogurt samples. The relative and natural proportions of the various proteins in the dry matter significantly affect the body and texture of the final product [26].
In this study, due to functional characteristics in enhancing chemical, physical and sensory attributes, Ca-CN and WPC were applied to produce LFBY, whereas WPC and Ca-CN have been used as enrichment materials. The current research aimed to study the effects of Ca-CN and WPC on the microstructural, volatile compounds concentration, organoleptical attributes, and microbiological properties of prepared LFBY during cold storage.

2. Materials and Methods

2.1. Materials

Buffalo milk is provided by herds of the Faculty of Agriculture, Benha University, Egypt. Freeze-dried yogurt starter (YO-MIX 572, Danisco-DuPont Group, Copenhagen, Denmark) containing Lactobacillus (Lb.) delbrueckii spp. bulgaricus and Streptococcus (Str.) thermophilus (CH-1, commercial freeze-dried DVS mixed bacterial starters) as yogurt starters were purchased from Chr. Hansen Laboratory, Copenhagen, Denmark. Lacma Company, 00-838 Warsaw, Poland, provided WPC (79.50% proteins based on dry weight). Ca-CN (80.00% proteins based on dry weight) was obtained from New Zealand Milk Products (Wellington, New Zealand). High purity standard volatile compounds, chemicals, solvents, and reagents (analytical grade) were provided by Sigma, USA: hydroxyacetic acid, acetic acid, butanoic acid, pentanoic acid, hexanoic acid, heptanoic acid, benzoic acid, octanoic acid, n-decanoic acid, acetaldehyde, pentanal, hexanal, heptanal, benzaldehyde, 2-methylundecanal, nonanal, 2,3-butanedione, 2-pentanone, 3-methyl-2-butanone, acetoin, methyl isobutyl ketone, 4-methyl-2-hexanone, 2-heptanone, acetophenone, 2-nonanone, 2-undecanone, ethanol, propylene glycol, 3-methyl-2-pentanol, 1-hexanol, 3-methyl-2-hexanol, 1-heptanol, 3-methyl-1-hexanol, 2-nonanol, formic acid ethenyl ester, acetic acid ethenyl ester, δ-nonalactone, heptane, toluene, o-xylene, and p-xylene. The U.S.A. provided the solid-phase microextraction (SPME) fibers from Supelco Inc. (Bellefonte, PA, USA).

2.2. Preparation of Yogurt Starter

Freeze-dried yogurt starter was activated using reconstituted skim milk medium (RSM (10% w/w), Oxoid, Basingstoke, UK) as follows: 200 mL of sterilized RSM were inoculated with starter, and the cultures were incubated at 42 °C for 24 h. Lastly, this starter reactivated into 200 mL of LBM and incubated at 42 °C for 24 h. These inoculations were carried out to achieve a final level of nearly 2 × 10⁸ CFU/g.

2.3. Yogurt Manufacture

In this case, 9 liters of raw BM were standardized to 1.2% fat and divided into three stainless steel containers (3 L each treatment). All ingredients were added as follows: LFBY: control (without additives), LFBY + 1% WPC (1% WPC, w:w), and LFBY + 1% Ca-CN (1% Ca-CN, w:w) to reach 13% TS. The ingredients (powders and milk) were stirred at room temperature for 5 min using a blender. Each treatment was blended thoroughly with a mixer to obtain a homogenous mixture and heated to 85 °C for 15 min. The mixtures were rapidly cooled to 47 °C (ice water bath). An activated yogurt starter was added at a level recommended by the yogurt manufacturer (2%, w:w). The inoculated milks were poured into 100 g plastic cups with lids and were incubated at 42 °C until the pH reached 4.7. Incubation times were ended when the pH lowed to this point. All LFBY treatments were removed from the incubator and kept at 5 °C until use [4]. Analyses of samples were determined on days 1, 7, 14, and 21 of storage under 5 °C. The results obtained in this study represented means values of three replicate experiments (3 batches) in which all analyses were carried out in triplicate. Initial experiments were previously carried out using different levels of WPC and Ca-CN in LFBY production. These experiments found that the best level of WPC was 1% (w/w) and Ca-CN was 1% (w/w) in these yogurts with performing some analyses including pH value, water holding capacity (WHC), and organoleptical attributes.

2.4. Physicochemical Analysis

The TS content was determined by drying 2 to 3 g at 105 °C until constant weight [27] using an air oven (Thermalize Scientific, MG Scientific, B01FW6M7PW, Oregon, USA). Total nitrogen (TN) and fat contents were determined by the official Kjeldahl method according to IDF [28] and the official Gerber method according to IDF [29], respectively. The titratable acidity content was determined using the method reported by ISO (2010). The pH value was measured by a pH meter (JENCO Model 1671, San Diego, CA, USA). Tyrosine content was colorimetrically measured by the spectrophotometer (Shimadzu UV mini1240, Tokyo, Japan) at 650 nm [30]. Tyrosine value was calculated as milligrams of tyrosine per gram (mg g−1) of the yogurt sample.

2.5. Microbiological Examination

Lb. delbrueckii subsp. bulgaricus and Str. thermophilus viable counts were examined by the standard plate count method to determine viable cells as a typical method. In this case, 10 grams of each sample was suspended in 90 mL of sterile peptone water (Merck, 0.1%; Darmstadt, Germany), then serially diluted. The diluted sample (1 mL) was inoculated on a selective medium for bacteria. M17 agar was applied for the streptococci viable count in samples and was incubated at 37 °C for 48 h. MRS agar (pH 5.4 by glacial acetic acid, Merck) was applied to the count of Lb. delbrueckii subsp. bulgaricus then incubated at 37 °C for 72 h in an anaerobic jar by anaerobic kits [31]. Coliform group and yeasts and molds viable counts were enumerated using the method described by Wehr and Frank [32] and IDF [33], respectively. The data were expressed as logarithm colony forming units per gram (log10 CFU g−1) of the yogurt sample.

2.6. Identification and Quantification of Volatile Compounds

All extractions were carried out using divinylbenzene/carboxen/polydimethylsiloxane fibers (50/30 µm). The SPME fibers were obtained by Supelco Inc. (Bellefonte, PA, USA). Here, 5 mL of each treatment of the yogurts were put into glass vials (15 mL, Supelco Inc.) with micro-mixing bars and then stirred at 55 °C for 60 min to allow the yogurt samples to reach equilibrium. The SPME fibers were inserted into the injection port of the Agilent 7890B gas chromatograph (Agilent Technologies Inc., Palo Alto, CA, USA), held for 5 min, and then inserted into the vial and be exposed in the headspace for 60 min at 55 °C. After absorbing the volatile components, the fibers were inserted into the gas chromatography-mass spectrometry (GC-MS) injector port for desorption at 270 °C for 3 min to desorbs volatile components into the GC. Volatile constituents of the yogurts were identified using a 7890B GC equipped by a 5977A mass selective detector (Agilent Technologies Inc.). Volatile components absorbed onto the fiber were passed through an HP-5MS column (0.25 mm inside diameter, 30 m length, 0.25 µm film thicknesses: Agilent Technologies Inc.) by helium (as the carrier gas) at 1 mL min−1. The GC temperature was kept at 35 °C for 5 min, then gradually increased to 140 °C at a ratio of 4 °C min−1 for 5 min, and lastly steadily increased to 250 °C 5 min−1 at a ratio of 10 °C min−1. The transfer line temperatures were set to 250 °C. The mass detectors were carried out at 150 °C in electron impact mode at a voltage (70 eV) and an ion source temperature (230 °C). Mass spectra of all samples were recorded by a mass range from 40 to 400 m/z, by 5 scans and no solvent delay [34]. Furthermore, volatile compounds were identified according to a standard database and comparing the mass spectra with those in the Library of MS profiles. The retention indices (RI) of isolated compounds were calculated by the methodology mentioned by Dan et al. [35]. All volatile compounds were used as standards to confirm the identifications. The data were expressed as milligrams of volatile compound per 100 g of yogurt (mg 100 g−1).

2.7. Organoleptical Attributes

The organoleptical attributes of LFBY treatments were evaluated according to Mehanna et al. [36]. In this case, 20 trained panelists from the academic staff and post-students of the Dairy Science Department (Faculty of Agriculture, Benha University, Egypt) were asked to judge the flavor (50 points), body and texture (40 points), appearance (10 points), and total acceptability (100 points) of yogurt samples. Each treatment was presented to each panelist at 20 °C for unbiased evaluation of the organoleptical characteristics.

2.8. Water Holding Capacity

The WHC of LFBY samples was analyzed according to the method of Guzmán-González et al. [37]. 20 g of LFBY sample (Y) was centrifuged at 483× g for 10 min undercooling (5 °C). After centrifugation, whey (W) was removed and weighed, then WHC was determined as follows:
WHC % = [(Y − W)/Y] ∗ 100

2.9. Microstructure Properties

Microstructure properties of treatments were determined using scanning electron microscopy (SEM) at National Research Centre, Giza, Egypt. Samples of yogurt were prepared as described by Jaya [22] as follows: The samples were fixed on an iron stub and then made electrically conductive by coating it (in a vacuum chamber) with a thin layer of gold for 40 s. The moisture of samples was entirely removed by placing the samples in an air-tight desiccator containing silica gel. The weight of samples was periodically determined until constant weight to confirm the complete removal of moisture. At least four images of typical structures were recorded using SEM (FEI company, Eindhoven, The Netherlands) model quanta 250 FEG (field emission gun) attached with EDX unit (energy dispersive X-ray analyses). The images were taken at an excitation voltage of 20 K.V., at different magnifications varying from 3000 to 6000 and working distance varying from 11.7–13.6 mm.

2.10. Statistical Analysis

Results corresponding to yogurt treatments determined during storage periods were subjected to ANOVA, and where statistical variances were reported, control treatment and yogurt treatments enriched with WPC and Ca-CN were analyzed by Duncan’s test. Variances were considered significant at p < 0.05. Statistical analyses of three separate experiments were applied, and analyses were determined in triplicate. Data analysis was carried out using PROC GLM in SAS (2002) and expressed as the mean and standard error (Means ± SE). Quantitative PCR datasets were analyzed using PROC GLM of SAS [38]. The applied static model is as follows:
Yij = µ + Ti+ Eij
where: Yij is the dependent variable, µ: overall mean, Ti: treatment effect (i = 1, …7), Eij: residual standard error.

3. Results

3.1. Physicochemical Properties

The physicochemical characteristics of LFBY enhanced with WPC and Ca-CN during storage are shown in Table 1. The yogurt enriched with WPC and Ca-CN had higher levels of TS and protein than LFBY during the cold storage (p < 0.05). The high contents of protein, TS in WPC and Ca-CN powders increased these nutrients in the produced yogurt. The results observed that the TS varied from 13.03 ± 0.16 to 14.00 ± 0.33% in all treatments during storage. Protein levels ranged from 3.97 ± 0.04 to 4.44 ± 0.08% in all treatments. On the contrary, no significant difference was found in the fat content during storage. Fat content varied from 1.46 ± 0.00 to 1.47 ± 0.03% in all treatments. Titratable acidity content ranged from0.70 ± 0.01 to 0.72 ± 0.01% in 1-day of all samples and significantly increased during cold storage in all treatments. No remarkable change in the pH value in prepared yogurts on day 1. However, the pH value was dropped with increasing cold storage up to day 21 in all yogurts. On day 1, pH levels ranged from 4.54 ± 0.16 to 4.55 ± 0.21 in all groups. On day 21, pH levels ranged from 3.21 ± 0.18 to 3.97 ± 0.15 in all groups. The pH values were higher in the treatments enriched with WPC and Ca-CN than LFBY, which could be related to the high buffering capacity of Ca-CN and WPC.

3.2. Tyrosine Value

In the current study, tyrosine contents were below that threshold level in all yogurt treatments. Yogurt treatments were significant for tyrosine levels during cold storage (Table 2). Generally, tyrosine levels increased in all treatments until day 14, then decreased slower in the yogurt enriched with WPC and Ca-CN. The tyrosine levels were less than 0.5 mg g−1 in all yogurt samples during storage. On day 1, tyrosine contents varied from 0.209 ± 0.00 to 0.287 ± 0.01 mg g−1 in all treatments. On day 21, tyrosine ranged from 0.300 ± 0.00 to 0.379 ± 0.01 mg g−1 in all treatments. The lowest level of tyrosine was observed in control yogurt during cold storage. Moreover, tyrosine levels were significantly more significant in the yogurt enriched with Ca-CN than in the yogurt enriched with WPC during the storage period.

3.3. Volatile Compounds

3.3.1. Volatile Acids and Aldehyde Compounds

Volatile acids and aldehyde compounds of LFBY treatments are very diverse and have an impact on flavor properties. Data of volatile acids and aldehyde compounds for all samples are shown in Table 3. Eight acid compounds were detected in the volatile extract for different samples (Table 3). Acid compounds levels in all treatments were presented a significant change during storage. In LFBY + 1% WPC and LFBY + 1% Ca-CN treatments, acetic acid, hexanoic acid, and heptanoic acid levels reached higher contents than LFBY treatment (p < 0.05) during cold storage.
The most elevated acetic acid, hexanoic acid, and heptanoic acid levels were detected in LFBY + 1% WPC after 21 days. On day 1, acetic acid, hexanoic acid, and heptanoic acid levels ranged from 6.22 ± 0.01 to 7.99 ± 0.09, 4.99 ± 0.06 to 5.02 ± 0.04 and 0.21 ± 0.07 to 0.24 ± 0.01 mg 100 g−1, respectively, in all treatments. At day 21, acetic acid, hexanoic acid, and heptanoic acid levels ranged from 16.23 ± 0.00 to 20.18 ± 0.08, 9.23 ± 0.08 to 11.12 ± 0.07 and 1.16 ± 0.05 to 2.89 ± 0.04 mg 100 g−1, respectively, in all treatments. Seven aldehyde compounds were observed in all treatments (Table 3). Acetaldehyde was significantly affected by WPC in the present study. In LFBY + 1% WPC and LFBY + 1% Ca-CN treatments, acetaldehyde levels reached higher contents than LFBY treatment (p < 0.05) during day one. The highest levels of acetaldehyde were in the LFBY + 1% WPC treatment. On day 1, acetaldehyde levels varied from 20.08 ± 0.21 to 21.83 ± 0.20 mg 100 g−1 in all treatments. The highest pentanal, hexanal, and benzaldehyde levels were in yogurts enriched with WPC and Ca-CN, whereas the lowest ones were detected in the control yogurt. Heptanal was not significantly affected by WPC and Ca-CN but was increased on day 21.

3.3.2. Volatile Ketone and Alcohol Compounds

Table 4 shows the volatile ketone and alcohol compounds of all treatments. Nine ketones were observed in all yogurt treatments. The value of 2-pentanone ranged from 0.22 ± 0.02 to 3.29 ± 0.08 mg 100 g−1 in all treatments during storage. The highest levels of 2,3-butanedione and 2-pentanone were detected in yogurt enriched with WPC, but the lowest levels were observed in the control yogurt. Acetoin, 4-methyl-2-hexanone, and 2-heptanone levels of all treatments represented significant changes during storage. 2-Heptanone levels of all treatments varied from 18.22 ± 0.21 to 29.32 ± 0.32 mg 100 g−1 during storage. The highest levels of acetoin, 4-methyl-2-hexanone, and 2-heptanone were detected in yogurt enriched with WPC. The other ketone compounds were not significantly recorded in all treatments.
The major ketones were acetoin, 2-heptanone, and 2-nonanone in yogurts on day one. The level of 2-nonanone ranged from 6.97 ± 0.09 to 10.07 ± 0.11 mg 100 g−1 in all treatments during storage. Five alcohol compounds were detected in all treatments (Table 4). Levels of ethanol significantly increased during cold storage. Ethanol value varied from 4.23 ± 0.07 to 6.98 ± 0.11 mg 100 g−1 in all treatments during storage. Levels of ethanol were higher in yogurt enriched with WPC compared with the other treatments during storage. 3-methyl-2-pentanol was higher in yogurt enriched with WPC than control and Ca-CN yogurt samples during storage. 1-hexanol and 1-heptanol levels were higher in yogurt enriched with WPC and Ca-CN. But, control yogurt was lower in 1-hexanol and 1-heptanol levels during storage. Levels of 1-hexanol, and 1-heptanol were not significantly recorded between yogurts with WPC and Ca-CN during storage. 1-hexanol content ranged from 0.81 ± 0.03 to 2.34 ± 0.06 mg 100 g−1 in all treatments during storage. 2-nonanol levels were significantly increased during storage periods. On the other hand, 2-nonanol levels were not significantly recorded between all yogurt treatments. The content of 2-nonanol varied from 0.30 ± 0.02 to 1.02 ± 0.07 mg 100 g−1 in all treatments during storage.

3.3.3. Volatile Ester and Hydrocarbon Compounds

Table 5 shows the volatile ester and hydrocarbon compounds in all treatments. Three ester compounds were found in yogurt samples during cold storage. Levels of formic acid ethynyl ester were higher in yogurt enriched with WPC after 21 days. The other compounds were not significantly detected between all treatments. A total of 4 volatile hydrocarbon compounds were detected in yogurt samples (Table 5). The level of these hydrocarbon compounds was low in all treatments.

3.4. Microbiological Characteristics

Figure 1 shows Str. thermophilus and Lb. delbrueckii ssp. bulgaricus viable counts for all treatments during storage. Supplements of LFBY with WPC and Ca-CN presented changes in the mean of Str. thermophilus and Lb. delbrueckii ssp. bulgaricus viable counts (p < 0.05) during storage. On day 1, Str. thermophilus levels ranged from 8.10 ± 0.15 to 8.41 ± 0.24 log10 CFU g−1 in all treatments. These levels decreased gradually during storage and reached from 5.02 ± 0.15 to 6.10 ± 0.17 log10 CFU g−1 until 21 days in all treatments. Samples with WPC and Ca-CN had a higher count of Str. thermophilus and Lb. delbrueckii ssp. bulgaricus than the control yogurt during storage. The count of streptococci decreased until 21 days of different samples. Yogurt enriched with WPC and Ca-CN had a significant effect on the viable counts of Lb. delbrueckii ssp. bulgaricus during storage. On day one, the viable counts of Lb. delbrueckii ssp. bulgaricus ranged from 8.31 ± 0.12 to 8.68 ± 0.23 log10 CFU g−1, increasing after 7 days then slightly decreased after 14 and 21 days. The highest Str. thermophilus and Lb. delbrueckii subsp. bulgaricus viable counts have been detected in LFBY + 1% WPC treatment. On the other hand, yeasts, molds, and coliform were not detected in all samples during storage.

3.5. Water Holding Capacity

Supplements of LFBY with WPC and Ca-CN affected the WHC during storage (Figure 2). WPC value varied from 53.54 ± 1.10 to 67.31 ± 1.50% of all treatments on day 1. After 21 days, WPC ranged from 45.01 ± 1.78 to 60.01 ± 2.10% in all samples. Yogurt enriched by WPC had higher WHC than the yogurt enriched by Ca-CN or control yogurt. The lowest WHC levels were detected in control yogurt. The WHC significantly decreased during cold storage up to 21 days of all yogurt samples.

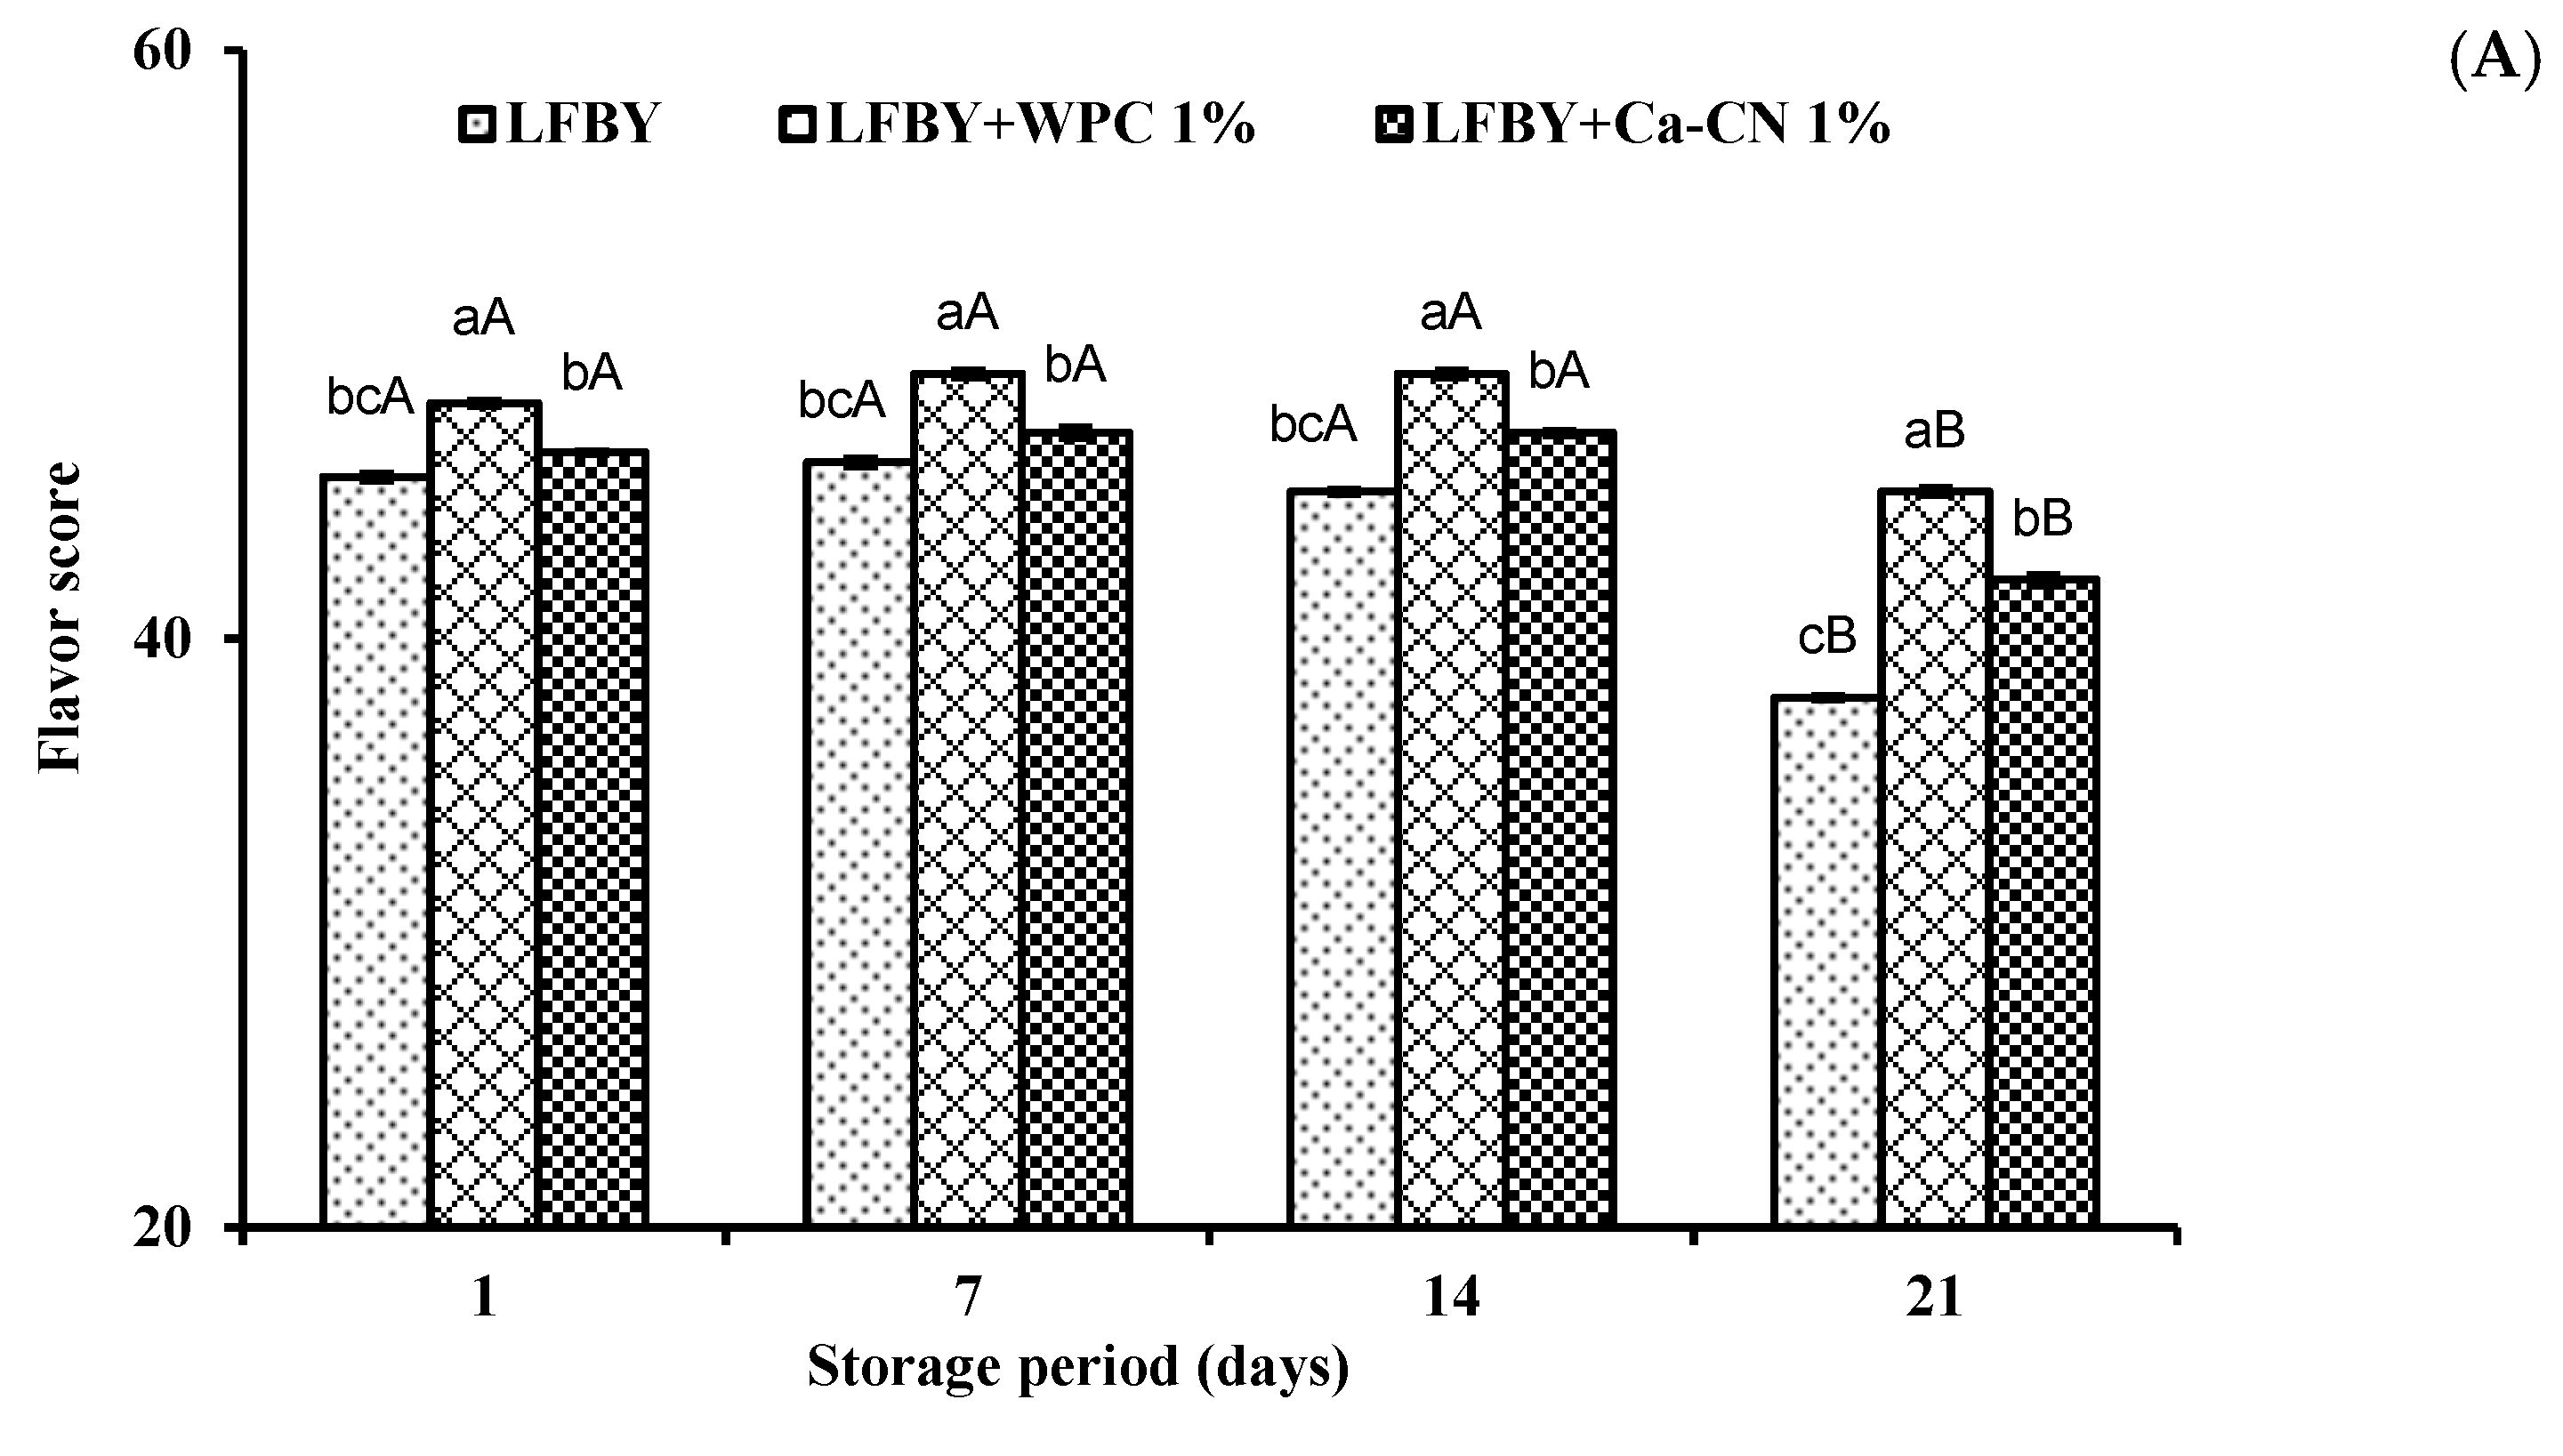
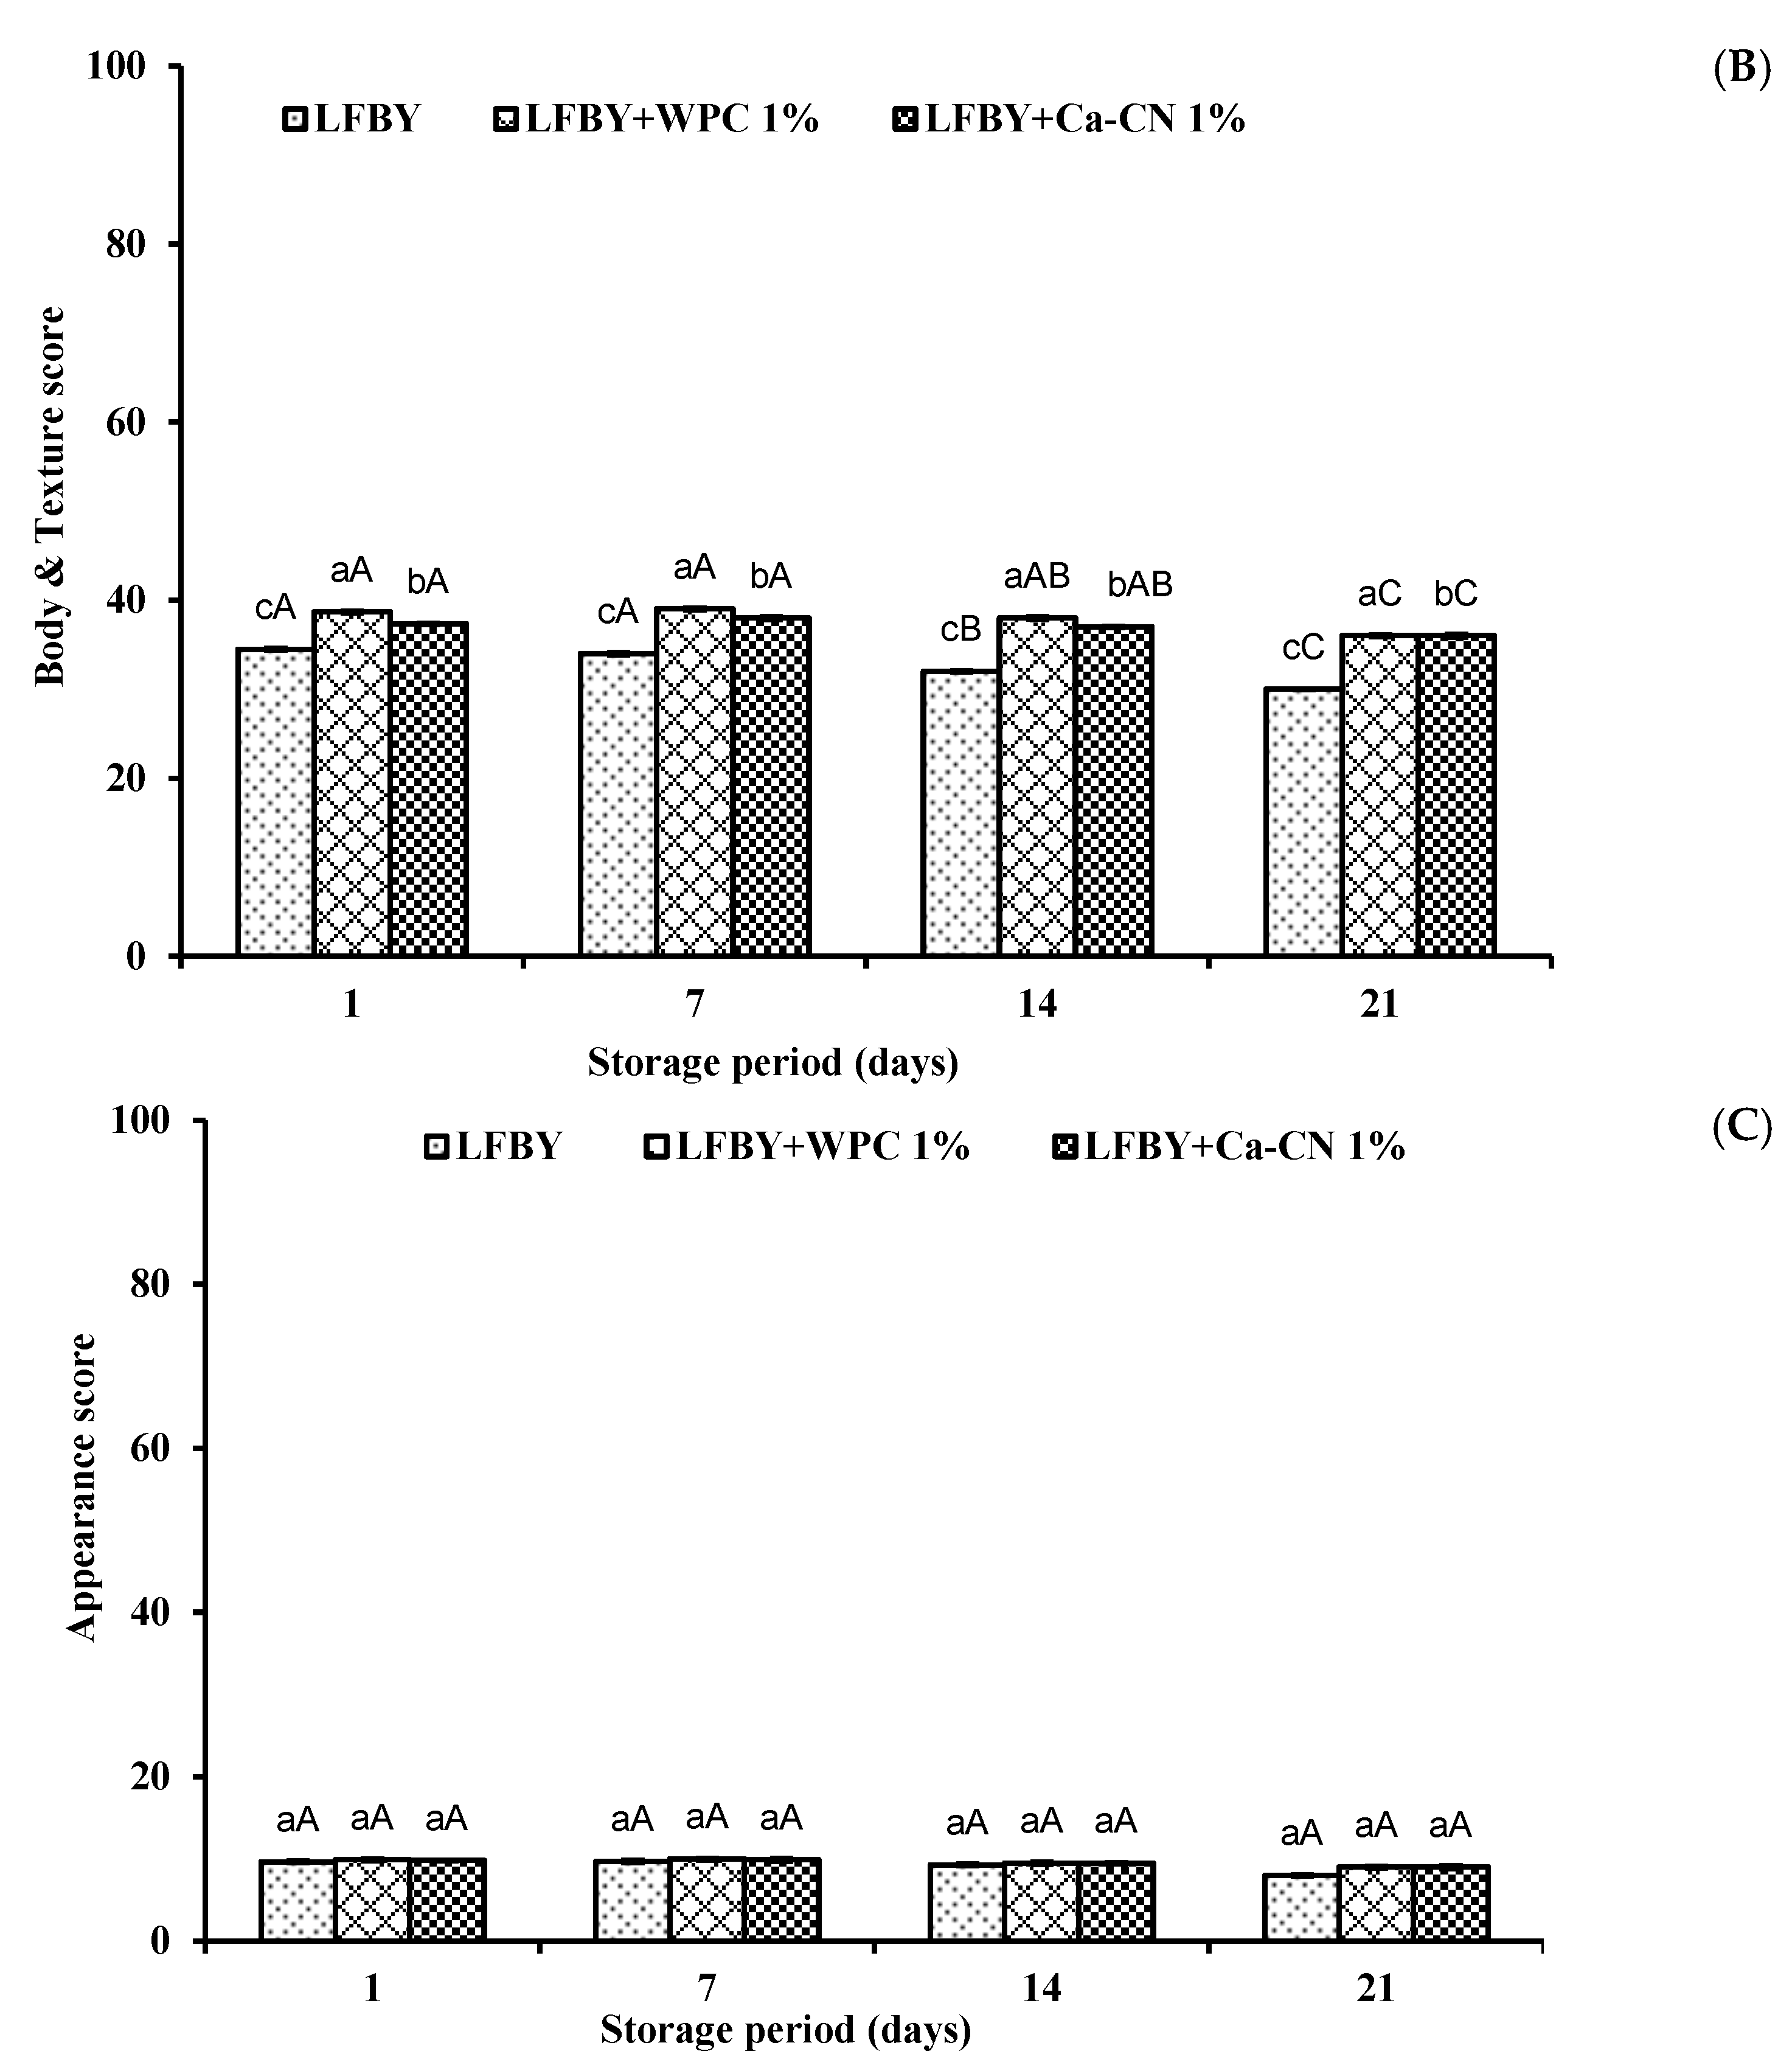
3.6. Organoleptical Attributes

Figure 3 shows organoleptical attributes of LFBY treatments during cold storage. Enrichment of LFBY with WPC and Ca-CN resulted in significant changes in judges’ preferences for sensorial properties of the yogurt samples. Panelists had given the yogurt enriched with WPC a higher score than those enriched with Ca-CN or control yogurt. On day 1, flavor levels varied from 45.50 ± 0.12 to 48.00 ± 0.08 of all treatments. Total acceptability varied from 89.57 ± 0.11 to 96.57 ± 0.07 on day 1 in all samples. On 21 days, flavor varied from 38.00 ± 0.05 to 45.00 ± 0.12 in all treatments. Total acceptability ranged from 76.00 ± 0.05 to 90.00 ± 0.07 one day 21 in all samples. The control yogurt had lower scores for flavor, body, and texture, and appearance. Yogurt enriched with WPC was the best-favored sample concerning the flavor, appearance, body, and texture. Moreover, the yogurt enriched with WPC had higher scores for total acceptability than that of the treatments with Ca-CN and control yogurt.

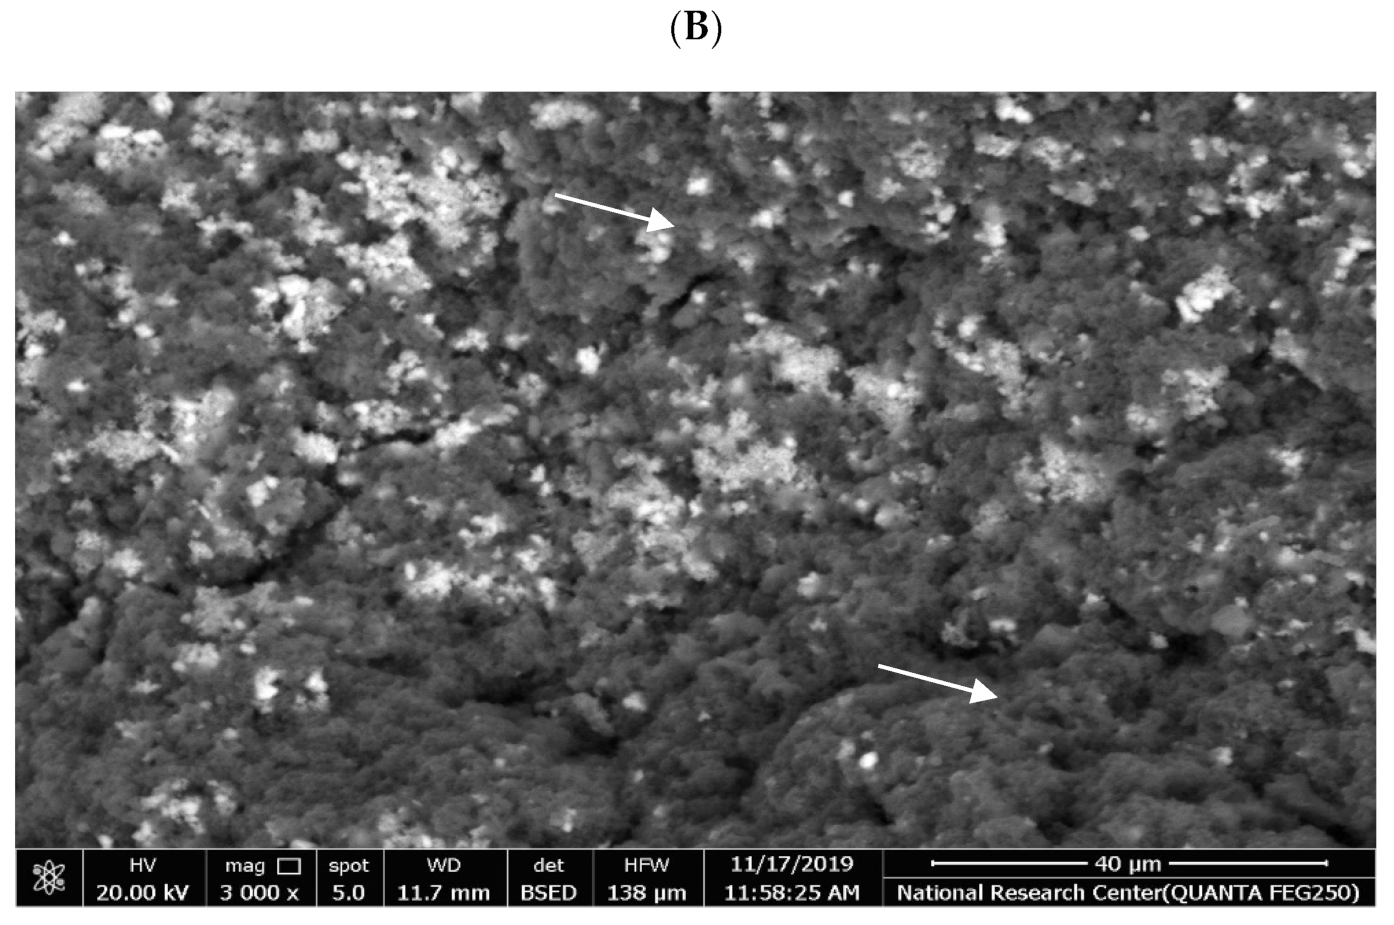
3.7. Microstructural Using Scanning Electron Microscopy (SEM)

The microstructure of the LFBY treatments was determined by the SEM method. SEM images of the yogurt treatments differed because the addition of WPC and Ca-CN affected the microstructure. The addition of WPC and Ca-CN increased the values of TS and proteins; these increases resulted in a production of a gel network by cross-linking during the milk fermentation or yogurt production. Figure 4 shows the images of the yogurt treatments enriched with WPC (B) and Ca-CN (C) and the control yogurt (A). The microstructure of the control yogurt (LFBY) is given various images compared to the other images (Figure 4A). The gel network in the control sample resulted in an irregular, with large pores and short and individualized casein filaments. The images appeared heterogeneous in the clusters or pores size. There were some openings and fat globules; fewer pores were detected, especially in LFBY with WPC and Ca-CN (Figure 4B,C). The microstructure of the Ca-CN samples caused a compact structure and coarseness compared to the LFBY, possibly increasing the firmness (Figure 4B). The microstructure of the LFBY with Ca-CN (Figure 4C) was less compact and dense, regular, with tiny pores, long and individualized casein filaments.

4. Discussion

The primary aim of the current study was to produce low-fat buffalo milk yogurt with WPC and Ca-CN, based functional yogurt and to determine the effects of these formulations on the volatile compounds, organoleptical attributes, and microbiological properties during cold storage. Set yogurt’s textural, body, and sensory attributes are critical quality analyses because they play an essential role in consumers’ acceptance of these types. Set yogurt with a relatively high level of syneresis is generally regarded as a low-quality product. Conventionally, syneresis is decreased by increasing the TS of the yogurt mix to around 14% (w/w) with dry ingredients [20]. In this respect, WPC and Ca-CN are used for Low-fat yogurt production. However, the availability and quality of other dairy ingredients make them attractive. Among these ingredients are WPC and caseinates that improve the texture and functional properties of the product [24]. The yogurt enriched with WPC and Ca-CN had higher levels of TS and protein than the control yogurt throughout the cold storage. This is due to the high contents of protein, TS in WPC and Ca-CN powders. The pH values were higher in the treatments enriched with WPC and Ca-CN than in the control sample, attributed to the Ca-CN and WPC’s high buffering capacity in yogurt matrixes. Lee and Lucey [39] found that enrichment with WPC increases the protein and TS contents of yogurts, thereby increasing the capacity of buffering that requires acid development by starter strains to achieve a similar pH level. The pH values decreased significantly throughout the cold storage. Guzmán-González et al. [37] reported that yogurt enriched with WPC presented a slighter decrease in pH values. They showed that a greater ionic strength of the yogurt enriched with WPC gave a slighter decrease in pH values.
Tyrosine value can play a role as an implication of bitter flavor increasing in yogurt samples. Asperger [40] observed that bitter flavor might become apparent when the tyrosine level exceeded 0.5 mg mL−1 in yogurt samples. In the current study, tyrosine contents were below that threshold level in all yogurt treatments. The protein and TS levels of yogurt may affect proteolysis besides other factors, including the percentage of cultures in the yogurt starter and proteolytic activity, proto-cooperation between the yogurt strains, and heat treatment of milk [20,41]. Slocum et al. [41] obtained an increase in proteolysis with increasing content of TS up to 14% in yogurts. These authors showed that strain growth might be advanced rather than inhibited at TS content of 12.5 to 14.5% due to the buffering capacity of WPC and Na or Ca-CN at these ranges. All yogurt treatments had a TS of around 14%; tyrosine levels tended to increase during cold storage. The casein in the cow milk is nearly the same in the BM; however, β-casein (β-CN) is the significant casein fraction of BM. Chandan et al. [42] reported that β-CN components are hydrolyzed more readily than whey proteins by the enzymes produced from yogurt starters. In general, it can be observed that proteolysis is dependent on the protein level available for hydrolysis than TS [41].
LFBY treatments contain a wide range of volatile acids and aldehyde compounds, which influence flavor properties. During cold storage, acetic acid, hexanoic acid, and heptanoic acid levels were higher in the LFBY + 1% WPC and LFBY + 1% Ca-CN treatments than in the LFBY treatment. The addition of WPC to yogurt increases the number of likely precursors in the pathway for forming acidic compounds [35]. Volatile acids contributed to yogurt’s pleasant odor and flavor (mainly acetic acid, butanoic acid, hexanoic acid, heptanoic acid, octanoic acid, and n-decanoic acid) [35]. Hexanoic acid is a significant source of odor and flavor in yogurt, and levels increased significantly during cold storage in all samples. Hexanoic acid enhances the taste and odor of yogurt and other fermented milks, giving them a “flowery, pungent” flavor. Heptanoic acid was detected in all treatments, with LFBY + 1% WPC having the highest heptanoic acid level. WPC is reported to be rich in valine and threonine compared to Ca-CN [43], and these amino acids could be the reason for high acid and aldehyde compound levels in WPC-enriched yogurts. The highest levels of acetic acid are responsible for the flavor and odor of yogurt, giving it an “acidic, pungent, vinegary” flavor [44]. These findings are consistent with those of Ongol et al. [45], who discovered that Lb. delbrueckii subsp. bulgaricus strains are highly resistant to lactic acid and convert lactose to lactic acid in a low-pH medium. Hexanoic acid improves the taste and odor of yogurt and other fermented milks and their “flowery, pungent” flavor [46]. Heptanoic acid was detected in all treatments, with LFBY + 1% WPC having the highest heptanoic acid level. They are in charge of yogurt’s flavor and aroma [47]. The important pathway for acetaldehyde formation in yogurts is threonine aldolase, which contributes to the breakdown of threonine to acetaldehyde and glycine [48]. It is an important volatile carbonyl compound in yogurt that gives fermented milk its “fresh, ethereal, pungent, green” aroma and flavor [16,49]. The highest concentrations of pentanal, hexanal, and benzaldehyde were found in yogurts enriched with WPC and Ca-CN, while the lowest concentrations were found in the control yogurt [50]. Yogurt and other fermented milks have an aromatic flavor because of benzaldehyde [51]. As mentioned by Cheng [16], heptanal is among the aldehyde compounds determined in yogurt, and it was found that this compound affects the taste and odor of the final yogurt, as it improves the flavor. Heptanal is a volatile carbonyl that contributes to yogurt’s “sweet and green” flavor [16]. Low heptanal levels can improve the taste and odor of fermented milk products [52]. All of these aldehydes, however, are very common components of other foods. It seems that, except for conveying the general odor of food, this common combination of aldehydes must not be very characteristic of any one food. The exception to this might be in the cases where one or more of these aldehydes predominate much more than usual and then can provide the characteristic odor of that food [51]. Fermented milk with mixed S. thermophiles and L. delbrueckii subsp. bulgaricus demonstrated a significantly higher level of non-volatile flavor compounds, i.e., lactate, pyruvate, formate, succinate, and free amino acids (as precursors for yogurt aroma formation) for a good organoleptic quality of yogurt [16]. In terms of technological relevance, all major yogurt aroma volatiles [16]; i.e., acetaldehyde (fresh, green, pungent), diacetyl (buttery, creamy), acetoin (buttery), 2-butanone (sweet, fruity), 2,3-pentanedione (buttery, vanilla-like) and acetic acid (vinegar, pungent) were detectable in our study. The contributions of S. thermophiles and L. delbrueckii subsp. bulgaricus to volatile aroma formation in fermented milk are well documented [11,53,54]. Similar trends for heptanal in fermented milk samples have been reported [35]. Saint-Eve et al. [10] investigated the release of aroma compounds in flavored yogurts (% fat) enriched with Na-CN, WPC, or low heat skim milk powder and discovered that aroma release was lower in yogurt enriched with Na-CN than in yogurt enriched with WPC. Acetaldehyde levels in all yogurt samples were undetectable after 21 days, as previously reported by Hrukar et al. [55]. This is due to the conversion of acetaldehyde to ethanol by alcohol dehydrogenase [56]. The enzyme has been found in S. thermophilus, but not in L. delbrueckii ssp. bulgaricus [57,58]. Acetoin, 4-methyl-2-hexanone, and 2-heptanone levels were highest in yogurt enriched with WPC. In yogurt, the primary ketones were acetoin, 2-heptanone, and 2-nonanone. Pyruvates produce volatile ketones, and pyruvate is produced by citrate and lactose metabolisms [59]. Ketones contribute to yogurt’s and other fermented milk’s “creamy and buttery” taste and odor [15,60,61]. Ethanol is a common lactose metabolite produced by various LAB strains and is obtained through acetaldehyde reduction [62]. During storage, ethanol levels in yogurt enriched with WPC were higher than in the other treatments. This rise in ethanol levels can be attributed to increased acetaldehyde levels in yogurt enriched with WPC. Similarly, Kwak [63] discovered an increase in ethanol level during cold storage of yogurt samples. Gursel et al. [64] detected that ethanol level slightly increased at d 7 in the samples.
Three ester components were observed in yogurt samples during cold storage. Levels of formic acid ethynyl ester were higher in yogurt enriched with WPC at 21 days. Low levels of volatile ester compounds give the “floral and fruity” taste and odor of yogurt and other dairy products [65]. These ester compounds isolated by Pan et al. [59] reported that decanoic acid ethyl ester, formic acid ethynyl ester, acetic acid butyl ester, and δ-nonalactone were isolated from yogurt samples. A total of 4 volatile hydrocarbon components were isolated in yogurt samples, and these compounds were low in all treatments. Similar data have been found in dairy products by Condurso et al. [66], wherein the toluene and p-xylene (volatile hydrocarbon) were low in all samples. The highest Str. thermophilus and Lb. delbrueckii subsp. bulgaricus viable counts have been detected in LFBY + 1% Ca-CN treatment. Gursel et al. [64] reported that the yogurts with NaCn, WPC, and WPI had higher viable cells of streptococci than the yogurt with skim goat milk powder (control). Damin et al. [25] studied the effect of milk enrichment with WPC, skim milk powder or Na-CN on microorganisms viable counts of stirred yogurt were not significant, but they found that viable counts of Str. thermophilus were higher than that of Lb. delbrueckii ssp. bulgaricus. In addition, Oliveira et al. [67] observed that in mixed strains of Str. thermophilus with Lb. rhamnosus or Lb. acidophilus; the formerly observed predominance under all strain conditions used for fermented milk enriched with caseinate hydrolysate. According to Mccomas and Gilliland [68], whey protein has no inducible effect on the count of Lb. delbrueckii ssp. bulgaricus, and the impact on Str. thermophilus is dependent on culture variability. Yeasts, molds, and coliform groups did not appear during storage in all yogurts. These data may be due to the high hygienic-sanitary conditions during the yogurt manufacture and the role of LAB in the preservation of dairy products associated with their ability to produce lactic acid [4].
Yogurt enriched by WPC and Ca-CN had higher WHC than the control yogurt. These findings agree with the data of Remeuf et al. [24], who reported that enriched yogurt by WPC had higher WHC than the control yogurt; this is due to the high content of protein in yogurt enriched by WPC. Similar data were recorded by Hashim et al. [69] observed that the incorporation of WPI increased the WHC to 50% than the nonfat control of yogurt.
Yogurt enriched with WPC was the best sample concerning the flavor, appearance, body, texture, and total acceptability. This may be due to its aroma, odor, creamier body and texture, and mild acidity. Moreover, the yogurt enriched with WPC had higher scores for total acceptability than that of the treatments with Ca-CN and control yogurt. These findings are in agreement with Ott et al. [70]. These authors detected significant variances in flavor between less acidic, mild, and acidic yogurt samples; they observed that acetaldehyde levels were only the one carbonyl component that can give to the yogurt odor and aroma, and therefore, the ultimate aromatic effects were from the mixture of the aromatic compounds and acidity. In general, flavor, body and texture, and appearance scores were increased up to 14 days in all treatments and then gradually decreased with the prolong of cold storage (21 days). Similar data were recorded by Gursel et al. [64], who detected that supplementation of goat milk with different milk protein-based products recorded significant differences for sensorial properties of the samples, and they found the yogurt with NaCn more than the yogurt with WPC due to its bright appearance, color; and creamier structure, though the scores for these characteristics were similar for all 2 yogurts. The authors observed that scores of body and texture of all samples decreased with the prolongation of cold storage, whereas the odor and flavor scores increased up to 14 days, then decreased on day 21.
The microstructure of the LFBY with WPC was less compact and dense, regular, with tiny pores and extended and individualized casein filaments probably due to the interaction between denatured caseins and β-lactoglobulin (β-LG). The addition of the WPC caused various structures in the LFBY, reflecting some fine cross-linking among globular caseins and proteins. The porous and looser microstructure and cross-linking capacity of LFBY with WPC may improve the decrease of the syneresis and WHC indices by increasing the bridging degree between casein and protein particles. The microstructure of the Ca-CN samples caused a compact structure and coarseness compared to the LFBY with WPC, possibly increasing the firmness. The gel network in the control sample resulted in an irregular, with large pores and short and individualized casein filaments. The images exhibited heterogeneity in the clusters or pores size. Large pores were detected in the LFBY samples, as reported by [71]. Saint-Eve et al. [10] and Marafon et al. [23] found that the pore sizes in the images obtained from the control yogurt were more significant than those from the supplemented yogurt with skim milk powder (SMP) or/and Na-CN and WPC. Similar microstructures were provided in the yogurt treatments by Puvanenthiran et al. [72], who detected that as the ratio of WPC increased, the gel network became more acceptable, the size of the pores of the aggregates became smaller, the gel network of crosslinks denser, and the smaller. The mix of sodium-calcium caseinate (SCaCN) and WPC given similar images produced by the yogurt supplemented with SCaCN and WPC; however, some pores or holes and more crosslinked structures were detected [19]. The use of SCaCN and WPC had effects on the microstructure of the yogurt treatments [19]. Similar microstructures were recorded in yogurt fortified with WPC by Atallah et al. [4], who found that the gel appeared various structures with an exemplary network, its contained counts of microscopic pores. The gel from the yogurt fortified with CaCNs exhibited a dense and finely perforated structure, similar to that of yogurt with WPCs. Whey protein (WP) is more heat treatment-sensitive than casein [73]. The denatured WP linked other proteins to produce soluble WP particles or with casein micelles to form WP-linked casein micelles [74,75,76]. More WP is denatured during heat treatments of yogurt, which the production of disulfide bonds and occurrence of hydrophobic interacts within WP and between κ-CN and denatures WP on the surface of casein particles leads to the production of WP–κ-casein mixtures [74,75,76]. Therefore, heat treatment of yogurt with WP contributes to a high number of cross-linking within the gel matrix, giving a denser yogurt microstructure and enhanced viscosity and WHC of yogurt [24]. In yogurts with WPC, the gel network was highly uniform, and the smaller pores than the yogurt supplemented with Ca-CN. Remeuf et al. [24] observed that the gel network of yogurt with WPC detected an excellent network with delicate pores.

5. Conclusions

In this study, LFBY treatments were produced with 1% (w/w) WPC and Ca-CN enrichment. The data reported that WPC and Ca-CN could be used to produce LFBY with improved volatile compounds, pH, and organoleptical attributes during storage. The volatile components of LFBY treatments were isolated by the SPME method and were determined by GC-MS. A total of 36 volatile components were isolated and identified in all yogurt samples, including 8 acids, 7 aldehydes, 9 ketones, 5 alcohols, 3 esters, and 4 hydrocarbon components. Some essential compounds contributed to the excellent flavor of yogurt (mainly acetic acid, butanoic acid, acetaldehyde, acetoin, 2,3-butanedione, ethanol, and 1-heptanol). Yogurts enriched with either WPC or Ca-CN had more volatile components than that control yogurt up to 21 days. These data also detect that the SPME method was an essential tool in indenting the volatile components produced in yogurt. Samples with WPC and Ca-CN had higher viable counts of Str. thermophilus and Lb. delbrueckii ssp. bulgaricus than the control yogurt during storage. Yogurt enriched with WPC was the best sample concerning the flavor, appearance, body, and texture. In addition, yogurt with WPC was softer and suffered high WHC than control. WPC may be considered as an added value in produced yogurt. WPC or Ca-CN has promising features as superior materials for low-fat buffalo milk yogurt production and commercial scaling up for the determinations used.

Author Contributions

Conceptualization, A.A.A. and H.B.; methodology, D.G.G., A.A.A. and A.M.; validation, H.B. and A.A.A.; formal analysis, D.G.G. and A.M.; investigation, D.G.G. and A.A.A.; data curation, A.M., A.A.A. and H.B.; writing—original draft preparation, H.B. and A.A.A.; writing—review and editing, H.B. and A.A.A. All authors have read and agreed to the published version of the manuscript.

Funding

The researchers would like to thank the Deanship of Scientific Research, Qassim University for funding the publication of this project.

Institutional Review Board Statement

Not applicable.

Informed Consent Statement

Not applicable.

Data Availability Statement

The data presented in this study are available on request from the corresponding author.

Acknowledgments

The authors would like to thank all colleagues at the Faculty of Agriculture, Benha University, Egypt, for their kind assistance in achieving the different experiments of this research.

Conflicts of Interest

The authors declare no conflict of interest.

Abbreviations

BM: buffalo milk; Ca-CN: calcium caseinate; GC: gas chromatography; GC-MS: gas chromatography-mass spectrometry; LAB: lactic acid bacteria; Lb: Lactobacillus; LFBY: low-fat buffalo milk yogurts; log10 CFU g−1: colony-forming units per gram; Na-CN: Na-caseinate; RI: retention indices; RT: retention time; SCaCN: sodium-calcium caseinate; SEM: scanning electron microscopy; SMP: skim milk powder; SPME: solid-phase microextraction; Str: Streptococcus; TN: total nitrogen; TS: total solids; WHC: water holding capacity; WP: Whey protein; WPC: whey protein concentrate; WPI: whey protein isolate; β-CN: β-casein; β-LG: β-lactoglobulin; κ-CN: kappa-casein.

References

  1. Kamal-Eldin, A.; Alhammadi, A.; Gharsallaoui, A.; Hamed, F.; Ghnimi, S. Physicochemical, rheological, and microstructural properties of yogurts produced from mixtures of camel and bovine milks. NFS J. 2020, 19, 26–33. [Google Scholar] [CrossRef]
  2. Abd El-Salam, M.H.; El-Shibiny, S. A comprehensive review on the composition and properties of buffalo milk. Dairy Sci. Technol. 2011, 91, 663. [Google Scholar] [CrossRef]
  3. Pelaes Vital, A.C.; Goto, P.A.; Hanai, L.N.; Gomes-da-Costa, S.M.; de Abreu Filho, B.A.; Nakamura, C.V.; Matumoto-Pintro, P.T. Microbiological, functional and rheological properties of low-fat yogurt supplemented with Pleurotus ostreatus aqueous extract. LWT—Food Sci. Technol. 2015, 64, 1028–1035. [Google Scholar] [CrossRef]
  4. Atallah, A.A.; Morsy, O.M.; Gemiel, D.G. Characterization of functional low-fat yogurt enriched with whey protein concentrate, Ca-caseinate and spirulina. Int. J. Food Prop. 2020, 23, 1678–1691. [Google Scholar] [CrossRef]
  5. Boycheva, S.; Mihaylova, G.; Naydenova, N.; Dimitrov, T. Amino acid and fatty acid content of yogurt supplemented with walnut and hazelnut pieces. Trakia J. Sci. 2012, 10, 17–25. [Google Scholar]
  6. Sodini, I.; Remeuf, F.; Haddad, S.; Corrieu, G. The Relative Effect of Milk Base, Starter, and Process on Yogurt Texture: A Review. Crit. Rev. Food Sci. Nutr. 2004, 44, 113–137. [Google Scholar] [CrossRef]
  7. McCarthy, N.A.; Gee, V.L.; Hickey, D.K.; Kelly, A.L.; O’Mahony, J.A.; Fenelon, M.A. Effect of protein content on the physical stability and microstructure of a model infant formula. Int. Dairy J. 2013, 29, 53–59. [Google Scholar] [CrossRef]
  8. Guichard, E. Interactions between flavor compounds and food ingredients and their influence on flavor perception. Food Rev. Int. 2002, 18, 49–70. [Google Scholar] [CrossRef]
  9. Tamime, A.Y.; Robinson, R.K. Yoghurt: Science and Technology; CRC Press: Boca Raton, FL, USA, 1999. [Google Scholar]
  10. Saint-Eve, A.; Juteau, A.; Atlan, S.; Martin, N.; Souchon, I. Complex viscosity induced by protein composition variation influences the aroma release of flavored stirred yogurt. J. Agric. Food Chem. 2006, 54, 3997–4004. [Google Scholar] [CrossRef]
  11. Beshkova, D.; Simova, E.; Frengova, G.; Simov, Z. Production of flavour compounds by yogurt starter cultures. J. Ind. Microbiol. Biotechnol. 1998, 20, 180–186. [Google Scholar] [CrossRef]
  12. Ott, A.; Fay, L.B.; Chaintreau, A. Determination and Origin of the Aroma Impact Compounds of Yogurt Flavor. J. Agric. Food Chem. 1997, 45, 850–858. [Google Scholar] [CrossRef]
  13. Karagül-Yüceer, Y.; Cadwallader, K.R.; Drake, M. Volatile Flavor Components of Stored Nonfat Dry Milk. J. Agric. Food Chem. 2002, 50, 305–312. [Google Scholar] [CrossRef] [PubMed]
  14. Mistry, V.V.; Hassan, H.N. Manufacture of nonfat yogurt from a high milk protein powder. J. Dairy Sci. 1992, 75, 947–957. [Google Scholar] [CrossRef]
  15. Settachaimongkon, S.; Nout, M.J.R.; Antunes Fernandes, E.C.; Hettinga, K.A.; Vervoort, J.M.; van Hooijdonk, T.C.M.; Zwietering, M.H.; Smid, E.J.; van Valenberg, H.J.F. Influence of different proteolytic strains of Streptococcus thermophilus in co-culture with Lactobacillus delbrueckii subsp. bulgaricus on the metabolite profile of set-yoghurt. Int. J. Food Microbiol. 2014, 177, 29–36. [Google Scholar] [CrossRef] [PubMed]
  16. Cheng, H. Volatile flavor compounds in yogurt: A Review. Crit. Rev. Food Sci. Nutr. 2010, 50, 938–950. [Google Scholar] [CrossRef]
  17. Kaneko, D.; Igarashi, T.; Aoyama, K. Reduction of the off-flavor volatile generated by the yogurt starter culture including Streptococcus thermophilus and Lactobacillus delbrueckii subsp. bulgaricus in soymilk. J. Agric. Food Chem. 2014, 62, 1658–1663. [Google Scholar] [CrossRef]
  18. Isleten, M.; Karagul-Yuceer, Y. Effects of dried dairy ingredients on physical and sensory properties of nonfat yogurt. J. Dairy Sci. 2006, 89, 2865–2872. [Google Scholar] [CrossRef]
  19. Akalın, A.S.; Unal, G.; Dinkci, N.; Hayaloglu, A.A. Microstructural, textural, and sensory characteristics of probiotic yogurts fortified with sodium calcium caseinate or whey protein concentrate. J. Dairy Sci. 2012, 95, 3617–3628. [Google Scholar] [CrossRef] [PubMed]
  20. Tamime, A.; Deeth, H. Yogurt: Technology and Biochemistry. J. Food Prot. 1980, 43, 939–977. [Google Scholar] [CrossRef]
  21. Zhao, L.L.; Wang, X.L.; Tian, Q.; Mao, X.Y. Effect of casein to whey protein ratios on the protein interactions and coagulation properties of low-fat yogurt. J. Dairy Sci. 2016, 99, 7768–7775. [Google Scholar] [CrossRef] [PubMed]
  22. Jaya, S. Microstructure analysis of dried yogurt: Effect of different drying methods. Int. J. Food Prop. 2009, 12, 469–481. [Google Scholar] [CrossRef]
  23. Marafon, A.P.; Sumi, A.; Granato, D.; Alcântara, M.R.; Tamime, A.Y.; Nogueira de Oliveira, M. Effects of partially replacing skimmed milk powder with dairy ingredients on rheology, sensory profiling, and microstructure of probiotic stirred-type yogurt during cold storage. J. Dairy Sci. 2011, 94, 5330–5340. [Google Scholar] [CrossRef]
  24. Remeuf, F.; Mohammed, S.; Sodini, I.; Tissier, J.P. Preliminary observations on the effects of milk fortification and heating on microstructure and physical properties of stirred yogurt. Int. Dairy J. 2003, 13, 773–782. [Google Scholar] [CrossRef]
  25. Damin, M.R.; Alcântara, M.R.; Nunes, A.P.; Oliveira, M.N. Effects of milk supplementation with skim milk powder, whey protein concentrate and sodium caseinate on acidification kinetics, rheological properties and structure of nonfat stirred yogurt. LWT—Food Sci. Technol. 2009, 42, 1744–1750. [Google Scholar] [CrossRef]
  26. Delikanli, B.; Ozcan, T. Improving the textural properties of yogurt fortified with milk proteins. J. Food Process. Preserv. 2017, 41, e13101. [Google Scholar] [CrossRef]
  27. IDF. 4A Cheese and Processed Cheese Determination of the Total Solids Content; IDF: Brussels, Belgium, 1982. [Google Scholar]
  28. IDF. 20A, Milk, Determination of Nitrogen Content (Kjeldahl Method) and Calculation of Crude Protein Content; IDF: Brussels, Belgium, 1986. [Google Scholar]
  29. IDF. 152A. Milk and Milk Products: Determination of Fat Content; General Guidance on the Use of Butyrometric Methods; IDF: Brussels, Belgium, 1997. [Google Scholar]
  30. Hull, M.E. Studies on milk proteins. 2. Colonmetric determination of the partial hydrolysis of the proteins in milk. J. Dairy Sci. 1947, 30, 881–884. [Google Scholar] [CrossRef]
  31. Ryan, M.P.; Rea, M.C.; Hill, C.; Ross, R.P. An application in cheddar cheese manufacture for a strain of Lactococcus lactis producing a novel broad-spectrum bacteriocin, lacticin 3147. Appl. Environ. Microbiol. 1996, 62, 612–619. [Google Scholar] [CrossRef] [PubMed] [Green Version]
  32. Wehr, H.M.; Frank, J.F. Standard Methods for the Examination of Dairy Products; American Public Health Association: Washington, DC, USA, 2004. [Google Scholar]
  33. IDF. International IDF Standard 94B: Milk & Milk Products. Enumeration of Yeasts & Moulds. Colony Count Technique at 25 Degrees C; IDF: Brussels, Belgium, 1990. [Google Scholar]
  34. Ning, L.; Fu-Ping, Z.; Hai-Tao, C.; Si-Yuan, L.; Chen, G.; Zhen-Yang, S.; Bao-Guo, S. Identification of volatile components in Chinese Sinkiang fermented camel milk using SAFE, SDE, and HS-SPME-GC/MS. Food Chem. 2011, 129, 1242–1252. [Google Scholar] [CrossRef]
  35. Dan, T.; Wang, D.; Jin, R.L.; Zhang, H.P.; Zhou, T.T.; Sun, T.S. Characterization of volatile compounds in fermented milk using solid-phase microextraction methods coupled with gas chromatography-mass spectrometry. J. Dairy Sci. 2017, 100, 2488–2500. [Google Scholar] [CrossRef] [PubMed] [Green Version]
  36. Mehanna, N.; Saleh, T.M.; Mehanna, A.; El-Asfory, S. The quality of low-calorie buffalo zabady. Egypt. J. Dairy Sci. 2000, 28, 59–71. [Google Scholar]
  37. Guzmán-González, M.; Morais, F.; Ramos, M.; Amigo, L. Influence of skimmed milk concentrate replacement by dry dairy products in a low fat set-type yoghurt model system. I: Use of whey protein concentrates, milk protein concentrates and skimmed milk powder. J. Sci. Food Agric. 1999, 79, 1117–1122. [Google Scholar] [CrossRef]
  38. Steel, R.; Torrie, J.; Dickey, D. Principles and Procedures of Statistics: A Biometrical Approach; McGraw-Hill College: New York, NY, USA, 1997. [Google Scholar]
  39. Lee, W.J.; Lucey, J.A. Formation and physical properties of yogurt. Asian-Australas. J. Anim. Sci. 2010, 23, 1127–1136. [Google Scholar] [CrossRef]
  40. Asperger, H. Applicability of analytical methods for the assessment of yogurt quality. Dairy Sci. Abstr. 1977, 39, 73. [Google Scholar]
  41. Slocum, S.A.; Jasinski, E.M.; Kilara, A. Processing Variables Affecting Proteolysis in Yogurt during Incubation. J. Dairy Sci. 1988, 71, 596–603. [Google Scholar] [CrossRef]
  42. Chandan, R.C.; Argyle, P.J.; Mathison, G.E. Action of Lactobacillus bulgaricus proteinase preparations on milk proteins. J. Dairy Sci. 1982, 65, 1408–1413. [Google Scholar] [CrossRef]
  43. Sindayikengera, S.; Xia, W.S. Nutritional evaluation of caseins and whey proteins and their hydrolysates from Protamex. J. Zhejiang Univ. Sci. B 2006, 7, 90–98. [Google Scholar] [CrossRef] [PubMed] [Green Version]
  44. Spanier, A.M.; Shahidi, F.; Parliment, T.H.; Mussinan, C.; Ho, C.T.; Contis, E.T. Food Flavors and Chemistry: Advances of the New Millennium; Royal Society of Chemistry: London, UK, 2007. [Google Scholar]
  45. Ongol, M.P.; Sawatari, Y.; Ebina, Y.; Sone, T.; Tanaka, M.; Tomita, F.; Yokota, A.; Asano, K. Yoghurt fermented by Lactobacillus delbrueckii subsp. bulgaricus H+-ATPase-defective mutants exhibits enhanced viability of Bifidobacterium breve during storage. Int. J. Food Microbiol. 2007, 116, 358–366. [Google Scholar] [CrossRef]
  46. Pereda, J.; Jaramillo, D.P.; Quevedo, J.M.; Ferragut, V.; Guamis, B.; Trujillo, A.J. Characterization of volatile compounds in ultra-high-pressure homogenized milk. Int. Dairy J. 2008, 18, 826–834. [Google Scholar] [CrossRef]
  47. Pogačić, T.; Maillard, M.-B.; Leclerc, A.; Hervé, C.; Chuat, V.; Valence, F.; Thierry, A. Lactobacillus and Leuconostoc volatilomes in cheese conditions. Appl. Microbiol. Biotechnol. 2016, 100, 2335–2346. [Google Scholar] [CrossRef] [PubMed]
  48. Rascón-Díaz, M.P.; Tejero, J.M.; Mendoza-Garcia, P.G.; García, H.S.; Salgado-Cervantes, M.A. Spray Drying Yogurt Incorporating Hydrocolloids: Structural Analysis, Acetaldehyde Content, Viable Bacteria, and Rheological Properties. Food Bioprocess Technol. 2012, 5, 560–567. [Google Scholar] [CrossRef]
  49. Routray, W.; Mishra, H.N. Scientific and Technical Aspects of Yogurt Aroma and Taste: A Review. Compr. Rev. Food Sci. Food Saf. 2011, 10, 208–220. [Google Scholar] [CrossRef]
  50. Gaafar, A.M. Volatile flavour compounds of yoghurt. Int. J. Food Sci. Technol. 1992, 27, 87–91. [Google Scholar] [CrossRef]
  51. Buttery, R.G.; Turnbaugh, J.G.; Ling, L.C. Contribution of volatiles to rice aroma. J. Agric. Food Chem. 1988, 36, 1006–1009. [Google Scholar] [CrossRef]
  52. Siek, T.J.; Albin, I.A.; Sather, L.A.; Lindsay, R.C. Taste thresholds of butter volatiles in deodorized butteroil medium. J. Food Sci. 1969, 34, 265-265. [Google Scholar] [CrossRef]
  53. Tamime, A.Y.; Robinson, R.K. Tamime and Robinson’s Yoghurt: Science and Technology, 3rd ed.; CRC Press: Cambridge, UK, 2007. [Google Scholar]
  54. Walstra, P.; Wouters, J.T.M.; Geurts, T.J. Dairy Science and Technology, 2nd ed.; CRC/Taylor & Francis: New York, NY, USA, 2006. [Google Scholar]
  55. Hruškar, M.; Vahčić, N.; Ritz, M. Aroma profiles and sensory evaluation of yogurt during storage. Mljekarstvo Časopis Za Unaprjeđenje Proizv. I Prerade Mlijeka 1995, 45, 175–190. [Google Scholar]
  56. Chaves, A.C.S.D.; Fernandez, M.; Lerayer, A.L.S.; Mierau, I.; Kleerebezem, M.; Hugenholtz, J. Metabolic Engineering of Acetaldehyde Production by Streptococcus thermophilus. Appl. Environ. Microbiol. 2002, 68, 5656–5662. [Google Scholar] [CrossRef] [PubMed] [Green Version]
  57. Marshall, V.M.; Cole, W.M. Threonine aldolase and alcohol dehydogenase activities in Lactobacillus bulgaricus and Latobacillus acidophilus and their contribution to flavour production in fermented milks. J. Dairy Res. 1983, 50, 375–379. [Google Scholar] [CrossRef]
  58. Raya, R.; Manca de Nadra, M.; de Ruiz Holgado, A.P.; Oliver, G. Acetaldehyde metabolismm in lactic acid bacteria. Milchwissenschaft 1986, 41, 397–399. [Google Scholar]
  59. Pan, D.D.; Wu, Z.; Peng, T.; Zeng, X.Q.; Li, H. Volatile organic compounds profile during milk fermentation by Lactobacillus pentosus and correlations between volatiles flavor and carbohydrate metabolism. J. Dairy Sci. 2014, 97, 624. [Google Scholar] [CrossRef] [Green Version]
  60. Beshkova, D.M.; Simova, E.D.; Frengova, G.I.; Simov, Z.I.; Dimitrov, Z.P. Production of volatile aroma compounds by kefir starter cultures. Int. Dairy J. 2003, 13, 529–535. [Google Scholar] [CrossRef]
  61. Nieto-Arribas, P.; Seseña, S.; Poveda, J.M.; Chicón, R.; Cabezas, L.; Palop, L. Enterococcus populations in artisanal Manchego cheese: Biodiversity, technological and safety aspects. Food Microbiol. 2011, 28, 891–899. [Google Scholar] [CrossRef]
  62. De Vos, W.M.; Hugenholtz, J. Engineering metabolic highways in Lactococci and other lactic acid bacteria. Trends Biotechnol. 2004, 22, 72–79. [Google Scholar] [CrossRef] [PubMed]
  63. Kwak, H.S. Effect of volatile flavor compound on yogurt during refrigerated storage. Korean J. Food Sci. Technol. 1995, 27, 939–943. [Google Scholar]
  64. Gursel, A.; Gursoy, A.; Anli, E.A.K.; Budak, S.O.; Aydemir, S.; Durlu-Ozkaya, F. Role of milk protein–based products in some quality attributes of goat milk yogurt. J. Dairy Sci. 2016, 99, 2694–2703. [Google Scholar] [CrossRef] [Green Version]
  65. Guler, M.O.; Stupp, S.I. A Self-assembled nanofiber catalyst for ester hydrolysis. J. Am. Chem. Soc. 2007, 129, 12082–12083. [Google Scholar] [CrossRef]
  66. Condurso, C.; Verzera, A.; Romeo, V.; Ziino, M.; Conte, F. Solid-phase microextraction and gas chromatography mass spectrometry analysis of dairy product volatiles for the determination of shelf-life. Int. Dairy J. 2008, 18, 819–825. [Google Scholar] [CrossRef]
  67. Oliveira, M.N.; Sodini, I.; Remeuf, F.; Corrieu, G. Effect of milk supplementation and culture composition on acidification, textural properties and microbiological stability of fermented milks containing probiotic bacteria. Int. Dairy J. 2001, 11, 935–942. [Google Scholar] [CrossRef]
  68. Mccomas, K.A., Jr.; Gilliland, S.E. Growth of probiotic and traditional yogurt cultures in milk supplemented with whey protein hydrolysate. J. Food Sci. 2003, 68, 2090–2095. [Google Scholar] [CrossRef]
  69. Hashim, M.A.; Nadtochii, L.A.; Muradova, M.B.; Proskura, A.V.; Alsaleem, K.A.; Hammam, A.R.A. Nonfat yogurt fortified with whey protein isolate: Physicochemical, rheological, and microstructural properties. Foods 2021, 10, 1762. [Google Scholar] [CrossRef]
  70. Ott, A.; Hugi, A.; Baumgartner, M.; Chaintreau, A. Sensory investigation of yogurt flavor perception: Mutual influence of volatiles and acidity. J. Agric. Food Chem. 2000, 48, 441–450. [Google Scholar] [CrossRef]
  71. Matumoto-Pintro, P.T.; Rabiey, L.; Robitaille, G.; Britten, M. Use of modified whey protein in yoghurt formulations. Int. Dairy J. 2011, 21, 21–26. [Google Scholar] [CrossRef]
  72. Puvanenthiran, A.; Williams, R.P.W.; Augustin, M.A. Structure and visco-elastic properties of set yoghurt with altered casein to whey protein ratios. Int. Dairy J. 2002, 12, 383–391. [Google Scholar] [CrossRef]
  73. Krzeminski, A.; Großhable, K.; Hinrichs, J. Structural properties of stirred yoghurt as influenced by whey proteins. LWT—Food Sci. Technol. 2011, 44, 2134–2140. [Google Scholar] [CrossRef]
  74. Singh, B.R.; Myhr, K. Cadmium uptake by barley as affected by Cd sources and pH levels. Geoderma 1998, 84, 185–194. [Google Scholar] [CrossRef]
  75. Smits, P.; Brouwershaven, J.H.V. Heat-induced association of β-lactoglobulin and casein mi-celles. J. Dairy Res. 1980, 47, 313–325. [Google Scholar] [CrossRef]
  76. Haque, Z.; Kinsella, J.E. Interaction between heated κ-casein and β-lactoglobulin: Predominance of hydrophobic interactions in the initial stages of complex formation. J. Dairy Res. 1988, 55, 67–78. [Google Scholar] [CrossRef]
Figure 1. Viable cell counts of (A) Str. thermophilus and (B) Lb. bulgaricus of LFBY and LFBY enriched with 1% WPC or Ca-CN (Mean ± SE); LFBY: Low-fat buffalo milk yogurts; LFBY + 1% WPC: Low-fat buffalo milk yogurts + 1% whey protein concentrate; LFBY + 1% Ca-CN: Low-fat buffalo milk yogurts + 1% Ca-caseinate.
Fermentation 07 00250 g001
Figure 2. The water holding capacity of LFBY and LFBY enriched with 1% WPC or Ca-CN (Mean ± SE); LFBY: Low-fat buffalo milk yogurts; LFBY + 1% WPC: Low-fat buffalo milk yogurts + 1% whey protein concentrate; LFBY + 1% Ca-CN: Low-fat buffalo milk yogurts + 1% Ca-caseinate. a,b,c: Bars within the same storage day not sharing a common letter are significantly different (p < 0.05). A,B,C,D: Bars not sharing a common letter during the storage periods are significantly different (p < 0.05).
Fermentation 07 00250 g002
Figure 3. (AD). Sensory attributes of LFBY and LFBY enriched with 1% WPC or Ca-CN (Mean ± SE); LFBY: Low-fat buffalo milk yogurts; LFBY + WPC 1%: Low-fat buffalo milk yogurts + 1% whey protein concentrate; LFBY + Ca-CN 1%: Low-fat buffalo milk yogurts + 1% Ca-caseinate. a,b,c: Bars within the same storage day not sharing a common letter are significantly different (p < 0.05). A,B,C: Bars not sharing a common letter during the storage periods are significantly different (p < 0.05).
Fermentation 07 00250 g003aFermentation 07 00250 g003bFermentation 07 00250 g003c
Figure 4. Scanning electron microscopy of LFBY and LFBY enriched with 1% WPC or Ca-CN; (A) LFBY: low-fat buffalo milk yogurts; (B) LFBY + WPC 1%: low-fat buffalo milk yogurts + 1% whey protein concentrate; (C) LFBY + Ca-CN 1%: low-fat buffalo milk yogurts + 1% Ca-caseinate.
Fermentation 07 00250 g004aFermentation 07 00250 g004bFermentation 07 00250 g004c
Table 1. Physicochemical attributes of LFBY and LFBY enriched with 1% WPC or Ca-CN (Mean ± SE).
ParametersTreatmentStorage Period (Day)
171421
Total solid (%)LFBY13.03 ± 0.16 bA13.04 ± 0.10 cA13.05 ± 0.20 cA13.03 ± 0.17 cA
LFBY + 1% WPC13.97 ± 0.37 aB13.98 ± 0.29 aAB14.00 ± 0.32 aA14.00 ± 0.33 aA
LFBY + 1% Ca-CN13.97 ± 0.27 aA13.96 ± 0.33 bA13.97 ± 0.32 bA13.98 ± 0.28 bA
Protein (%)LFBY3.98 ± 0.05 cAB3.98 ± 0.03 bAB3.99 ± 0.04 cA3.97 ± 0.04 cB
LFBY + 1% WPC4.41 ± 0.10 bA4.42 ± 0.08 aA4.42 ± 0.10 bA4.41 ± 0.09 bA
LFBY + 1% Ca-CN4.44 ± 0.08 aA4.43 ± 0.07 aA4.44 ± 0.08 aA4.44 ± 0.06 aA
Fat (%)LFBY1.47 ± 0.03 aAB1.48 ± 0.02 aA1.47 ± 0.03 aAB1.46 ± 0.02 aB
LFBY + 1% WPC1.46 ± 0.05 aA1.46 ± 0.03 bA1.47 ± 0.02 aA1.47 ± 0.01 aA
LFBY + 1% Ca-CN1.47 ± 0.03 aA1.47 ± 0.02 a bA1.46 ± 0.02 aA1.46 ± 0.00 aA
Titratable acidity * (%)LFBY0.71 ± 0.01 aA0.85 ± 0.02 aB0.94 ± 0.00 aC1.02 ± 0.03 aD
LFBY + 1% WPC0.72 ± 0.00 aA0.76 ± 0.01 bB0.85 ± 0.01 bC0.93 ± 0.02 bD
LFBY + 1% Ca-CN0.70 ± 0.01 aA0.78 ± 0.02 bB0.86 ± 0.02 bC0.95 ± 0.03 bD
pH valueLFBY4.54 ± 0.16 aA4.00 ± 0.15 a bB3.69 ± 0.13 bC3.21 ± 0.18 bD
LFBY + 1% WPC4.55 ± 0.21 aA4.28 ± 0.12 aAB4.09 ± 0.21 aB3.97 ± 0.15 aB
LFBY + 1% Ca-CN4.54 ± 0.16 aA4.26 ± 0.15 aAB4.10 ± 0.13 aB3.92 ± 0.18 aB
a,b,c: There is a significant difference (p < 0.05) between any two means, within the same column, have the different superscript letters; A,B,C,D: There is a significant difference (p < 0.05) between any two means for the same attribute, within the same row, have the different superscript letter; LFBY: Low-fat buffalo milk yogurts; LFBY + 1% WPC: Low-fat buffalo milk yogurts + 1% whey protein concentrate; LFBY + 1% Ca-CN: Low-fat buffalo milk yogurts + 1% Ca-caseinate. * Titratable acidity was expressed as lactic acid.
Table 2. Tyrosine value (mg g−1) of LFBY and LFBY enriched with 1% WPC or Ca-CN (Mean ± SE).
TreatmentsStorage Periods (Days)
171421
LFBY0.212 ± 0.01 bD0.307 ± 0.00 cC0.335 ± 0.00 cA0.300 ± 0.00 cB
LFBY + 1% WPC0.209 ± 0.00 bD0.322 ± 0.00 bC0.363 ± 0.01 bA0.354 ± 0.00 bB
LFBY + 1% Ca-CN0.287 ± 0.01 aD0.358 ± 0.01 aC0.387 ± 0.00 aA0.379 ± 0.01 aB
a,b,c: There is a significant difference (p < 0.05) between any two means, within the same column, have the different superscript letters; A,B,C,D: There is a significant difference (p < 0.05) between any two means for the same attribute, within the same row, have the different superscript letter; LFBY: Low-fat buffalo milk yogurts; LFBY + 1% WPC: Low-fat buffalo milk yogurt + 1% whey protein concentrate; LFBY + 1% Ca-CN: Low-fat buffalo milk yogurts + 1% Ca-caseinate.
Table 3. Volatile acid and aldehyde compounds identified in LFBY and LFBY enriched with 1% WPC or Ca-CN (Mean ± SE).
Volatile CompoundsRT 1 (min)Storage (Days)TreatmentsMethod 2RI 3Formula
LFBYLFBY + 1% WPCLFBY + 1% Ca-CN
Acid compounds (mg 100 g−1)
Acetic acid3.5616.22 ± 0.01 cB7.99 ± 0.09 aB7.30 ± 0.05 bBMS 4, STD 5STDC2H4O2
2116.23 ± 0.00 cA20.18 ± 0.08 aA18.10 ± 0.21 bA
Butanoic acid5.57120.89 ± 0.02 aA20.94 ± 0.11 aA20.90 ± 0.11 aAMS, RI790.66C4H8O2
21ND 6NDND
Pentanoic acid9.1410.97 ± 0.03 aA0.99 ± 0.01 aA0.98 ± 0.01 aAMS, RI868.78C5H10O2
21NDNDND
Hexanoic acid14.1815.02 ± 0.04 aB4.99 ± 0.06 aB5.00 ± 0.07 aBMS, RI999.24C6H12O2
219.23 ± 0.08 cA11.12 ± 0.07 aA10.11 ± 0.09 bA
Heptanoic acid17.1210.21 ± 0.07 aB0.24 ± 0.00 aB0.24 ± 0.01 aBMS, RI1071.70C7H14O2
211.16 ± 0.05 cA2.89 ± 0.04 aA1.98 ± 0.04 bA
Benzoic acid19.6111.02 ± 0.01 aA1.07 ± 0.00 aA1.02 ± 0.01 aAMS, RI1159.11C7H6O2
21NDNDND
Octanoic acid19.9811.94 ± 0.07 aB2.05 ± 0.08 aB1.89 ± 0.07 aBMS, RI1177.38C8H16O2
212.38 ± 0.06 aA2.41 ± 0.04 aA2.40 ± 0.06 aA
n-Decanoic acid24.2910.35 ± 0.01 aB0.32 ± 0.01 aB0.40 ± 0.01 aBMS, RI1341.01C10H20O2
211.98 ± 0.04 aA2.01 ± 0.07 aA1.97 ± 0.00 aA
Aldehyde compounds (mg 100 g−1)
Acetaldehyde1.38120.12 ± 0.03 bA21.83 ± 0.20 aA20.08 ± 0.21 bAMS, STDSTDC2H4O
21NDNDND
Pentanal3.2512.30 ± 0.04 bA3.99 ± 0.07 aA2.07 ± 0.05 cAMS, RI664.98C5H10O
21NDNDND
Hexanal6.4511.31 ± 0.06 cA3.08 ± 0.01 aA2.41 ± 0.09 bAMS, RI798.84C6H12O
210.85 ± 0.07 aB0.91 ± 0.01 aB0.89 ± 0.01 aB
Heptanal9.9810.33 ± 0.07 aB0.41 ± 0.07 aB0.39 ± 0.02 aBMS, RI889.78C7H14O
211.61 ± 0.01 cA3.69 ± 0.01 aA2.44 ± 0.03 bA
Benzaldehyde12.4710.40 ± 0.00 cA1.98 ± 0.03 aA1.20 ± 0.00 bAMS, RI977.14C7H6O
21NDNDND
2-Methylundecanal16.9713.12 ± 0.04 cA5.45 ± 0.08 aA4.02 ± 0.08 bAMS, RI1085.05C12H24O
21NDNDND
Nonanal17.8610.81 ± 0.04 aA0.86 ± 0.00 aA0.87 ± 0.04 aAMS, RI1114.01C9H18O
210.21 ± 0.01 aB0.20 ± 0.05 aB0.20 ± 0.03 aB
RT 1: The retention time; Method 2: RI, agrees with retention index literature; RI 3: The retention indices of unknown compounds on HP-5MS column calculated against the GC-MS retention time of n-alkanes (C3–C25); MS 4: Compared with NIST 11 Mass Spectral Database; STD, agrees with mass spectral of standard chemicals; STD 5: Agrees with mass spectral of standard chemicals; ND 6: Not detected; LFBY: Low-fat buffalo milk yogurts; LFBY + 1% WPC: Low-fat buffalo milk yogurts + 1% whey protein concentrate; LFBY + 1% Ca-CN: Low-fat buffalo milk yogurts + 1% Ca-caseinate; a,b,c:There is a significant difference (p < 0.05) between any two means within the same column, have the different superscript letters; A,B: There is a significant difference (p < 0.05) between any two means for the same attribute, within the same row, have the different superscript letters.
Table 4. Volatile ketone and alcohol compounds identified in LFBY and LFBY enriched with 1% WPC or Ca-CN (Mean ± SE).
Volatile CompoundsRT 1 (min)Storage (Days)TreatmentsMethod 2RI 3Formula
LFBYLFBY + 1% WPCLFBY + 1% Ca-CN
Ketone compounds (mg 100 g−1)
2,3-Butanedione1.991ND 4NDNDMS 5, STD 6STDC4H6O2
2110.23 ± 0.09 cA13.36 ± 0.31 aA12.19 ± 0.04 bA
2-Pentanone3.0511.26 ± 0.04 cA3.29 ± 0.08 aA2.25 ± 0.07 bAMS, RI657.44C5H10O
210.22 ± 0.02 cB1.29 ± 0.03 aB0.71 ± 0.01 bB
3-Methyl-2-butanone3.0811.99 ± 0.06 aA2.04 ± 0.04 aA2.00 ± 0.00 aAMS, RI659.01C5H10O
21NDNDND
Acetoin4.0113.51 ± 0.07 cA5.52 ± 0.06 aA4.45 ± 0.08 bAMS, RI700.04C4H8O2
21NDNDND
4-Methyl-2-hexanone9.4511.21 ± 0.00 cA2.69 ± 0.04 aA1.90 ± 0.03 bAMS, RI899.98C7H14O
210.23 ± 0.02 cB1.48 ± 0.06 aB0.98 ± 0.01 bB
2-Heptanone10.05118.22 ± 0.21 cB20.03 ± 0.21 aB19.19 ± 0.22 bBMS, RI912.07C7H14O
2125.23 ± 0.35 cA29.32 ± 0.32 aA27.19 ± 0.27 bA
Acetophenone15.8410.29 ± 0.04 aA0.30 ± 0.01 aA0.28 ± 0.03 aAMS, RI1057.77C8H8O
21NDNDND
2-Nonanone17.0417.01 ± 0.08 aB6.99 ± 0.08 aB6.97 ± 0.09 aBMS, RI1108.49C9H18O
2110.02 ± 0.07 aA10.07 ± 0.11 aA10.02 ± 0.12 aA
2-Undecanone22.8710.91 ± 0.01 aA0.91 ± 0.03 aA0.94 ± 0.03 aAMS, RI1321.02C11H22O
210.32 ± 0.01 aB0.30 ± 0.02 aB0.29 ± 0.02 aB
Alcohol compounds (mg 100 g−1)
Ethanol1.2814.23 ± 0.07 bB5.98 ± 0.09 aB5.19 ± 0.21 bBMS, STDSTDC2H6O
215.01 ± 0.09 bA6.98 ± 0.11 aA6.03 ± 0.11 bA
3-Methyl-2-pentanol4.451NDNDNDMS, RI777.2C6H14O
210.32 ± 0.00 bA0.89 ± 0.03 aA0.30 ± 0.01 bA
1-Hexanol9.6510.81 ± 0.03 bB1.52 ± 0.04 aB1.50 ± 0.07 aBMS, RI868.98C6H14O
211.32 ± 0.07 bA2.34 ± 0.06 aA2.30 ± 0.04 aA
1-Heptanol13.3511.00 ± 0.02 bA1.72 ± 0.08 aA1.71 ± 0.07 aAMS, RI988.45C7H16O
210.22 ± 0.02 bB0.95 ± 0.03 aB0.91 ± 0.01 aB
2-Nonanol17.7410.31 ± 0.04 aB0.33 ± 0.07 aB0.30 ± 0.02 aBMS, RI1152.04C9H20O
211.02 ± 0.07 aA0.97 ± 0.02 aA1.00 ± 0.04 aA
RT 1: The retention time; Method 2: RI, agrees with retention index literature; RI 3: The retention indices of unknown compounds on HP-5MS column calculated against the GC-MS retention time of n-alkanes (C3–C25); ND 4: Not detected; MS 5: Compared with NIST 11 Mass Spectral Database; STD, agrees with mass spectral of standard chemicals; STD 6: Agrees with mass spectral of standard chemicals; LFBY: Low-fat buffalo milk yogurts; LFBY + 1% WPC: Low-fat buffalo milk yogurts + 1% whey protein concentrate; LFBY + 1% Ca-CN: Low-fat buffalo milk yogurts + 1% Ca-caseinate; a,b,c: There is a significant difference (p < 0.05) between any two means, within the same column, have the different superscript letters; A,B: There is a significant difference (p < 0.05) between any two means for the same attribute, within the same row, have the different superscript letters.
Table 5. Volatile ester and hydrocarbon compounds identified in LFBY and LFBY enriched with 1% WPC or Ca-CN (Mean ± SE).
Volatile CompoundsRT 1 (min)Storage (Days)TreatmentsMethod 2RI 3Formula
LFBYLFBY + 1% WPCLFBY + 1% Ca-CN
Ester compounds (mg 100 g−1)
Formic acid ethenyl ester1.551ND 4NDNDMS 5, STD 6STDC3H4O2
218.54 ± 0.09 cA11.03 ± 0.11 aA9.31 ± 0.08 bA
Acetic acid ethenyl ester1.9918.02 ± 0.11 aA7.98 ± 0.01 aA7.97 ± 0.05 aAMS, STDSTDC4H6O2
210.78 ± 0.03 aB0.77 ± 0.04 aB0.81 ± 0.02 aB
δ-Nonalactone29.1110.32 ± 0.04 aA0.30 ± 0.02 aA0.29 ± 0.04 aAMS, RI1489.59C9H16O2
21NDNDND
Hydrocarbon compounds (mg 100 g−1)
Heptane3.321NDNDNDMS, RI687.88C7H15Cl
21NDNDND
Toluene5.5510.45 ± 0.05 aA0.39 ± 0.00 aA0.41 ± 0.04 aAMS, RI789.02C7H8
21NDNDND
o-Xylene9.3910.31 ± 0.02 aA0.34 ± 0.00 aA0.30 ± 0.03 aAMS, RI899.22C8H10
21NDNDND
p-Xylene9.4110.27 ± 0.06 aB0.25 ± 0.01 aB0.29 ± 0.01 aBMS, RI899.25C8H10
210.71 ± 0.07 aA0.85 ± 0.00 aA0.88 ± 0.00 aA
RT 1: The retention time; Method 2: RI, agrees with retention index literature; RI 3: The retention indices of unknown compounds on HP-5MS column calculated against the GC-MS retention time of n-alkanes (C3–C25); ND 4: Not detected; MS 5: Compared with NIST 11 Mass Spectral Database; STD, agrees with mass spectral of standard chemicals; STD 6: Agrees with mass spectral of standard chemicals; LFBY: Low-fat buffalo milk yogurts; LFBY + 1% WPC: Low-fat buffalo milk yogurts + 1% whey protein concentrate; LFBY + 1% Ca-CN: Low-fat buffalo milk yogurts + 1% Ca-caseinate; a,b,c: There is a significant difference (p < 0.05) between any two means within the same column, have the different superscript letters; A,B: There is a significant difference (p < 0.05) between any two means for the same attribute, within the same row, have the different superscript letter.
Publisher’s Note: MDPI stays neutral with regard to jurisdictional claims in published maps and institutional affiliations.

