Abstract
This study investigated the effect of fermentation conditions (time and temperature) on the nutritional composition and health-promoting properties of raw milk, optimized naturally fermented amasi, and amasi fermented with starter culture. The composition of the products, including chemical analysis, amino acids, mineral composition, and fatty acids, as well as health-promoting properties (total phenolic content (TPC), total flavonoid content (TFC), and antioxidant activity assays (2,2-Azinobis (3-Ethyl-Benzothiazone-6-Sulphonic acid) (ABTS) and 2,2-diphenyl-1-picrylhydrazyl (DPPH)) were investigated. The results showed that the fermentation conditions (time and temperature) significantly affected the ash contents of both fermented samples. Fermentation was also observed to have increased the contents of most of the essential and non-essential amino acids. A high concentration of glutamic acid was observed in optimized naturally fermented amasi at 32 °C (OP32, 6.30 g/100 g), followed by starter-culture-fermented amasi at 25 °C (SC25, 5.58 g/100 g) and then starter-culture-fermented amasi at 32 °C (SC32, 5.35 g/100 g), with optimized naturally fermented amasi at 32 °C (OP25, 4.46 g/100 g) having the lowest concentration. A similar trend in the composition of minerals was also observed, with potassium being the most abundant (110.1–134.5 µg/g). The TPC, TFC, and the antioxidant activities were significantly improved by fermentation, while a significant reduction in free fatty acids was recorded. In conclusion, the fermentation conditions had a significant effect on the nutritional and health-promoting properties of amasi. The results provided in this study could provide nutritional information regarding the composition of amasi, which can be beneficial to produce a high-quality product.
1. Introduction
The consumption of fermented milk products is prevalent in many countries due to their nutritional benefits. Besides the nutritional content of the milk itself, there are also health benefits which are, at times, conferred by the activity of living microorganisms contained in the fermented milk [1]. These microorganisms are responsible for improving the shelf life of milk by increasing the acidity level and also aid the development of desirable organoleptic characteristics, as well as the modification of nutritional and health constituents [2,3,4].
A range of fermented milk products can be found around the world, each with a slightly different composition. As a result, the local name of products is distinct between regions [5]. Amasi, also called maswi or sethemi, is traditional fermented cow’s milk produced in Zimbabwe, South Africa, Lesotho, and other countries in Southern Africa [6]. Amasi, like other fermented milk products, has been produced for a long time using spontaneous fermentation. The effects of other microorganisms during the fermentation of amasi are almost difficult to control due to the overabundance of other microorganisms that are present. Since the quality of the final product is unpredictable and primarily dependent on the dominant microorganisms initially involved, this generally results in inconsistent products with varying qualities. The production of fermented milk products has thus been optimized utilizing commercial starter cultures and controlled conditions, including the pasteurization of raw milk and the use of starter cultures, such as L. lactis subspecies cremoris and Lactococcus lactis subspecies lactis [7]. The fermentation process usually takes 12 to 18 h between 20 and 30 °C before the product can be packaged. The use of specific starter cultures for the fermentation of amasi ensures consistency in production and the standardization of the fermentation process.
With the beneficial nutritional value and health-promoting constituents of milk, fermentation not only extends the shelf life of milk, but also enhances these constituents. Accordingly, the value added to milk is increased, and fermented milk products are, in turn, categorized as functional foods [8]. Amongst the fermented dairy products, amasi is significant due to it being widely accepted, affordable, and having a longer shelf-life compared with milk [9]. Limited studies are, however, available in the literature on the nutritive quality and health-promoting properties of amasi. The available studies have only reported on usual nutritional parameters, such as proximate analysis and microbial analysis, in other naturally fermented milk products, such as nunu and mabisi. This study, therefore, investigated the nutritional composition and health-promoting properties of amasi, which is popularly produced in South Africa.
2. Materials and Methods
2.1. Collection of Samples
Raw cow’s milk samples were purchased from the Agriculture Research Council (ARC)—Irene farm, Pretoria, South Africa. The raw milk was transported in cooler boxes (Camp Master, Makro, South Africa) to the Food Technology Laboratory at the University of Johannesburg for processing upon arrival.
2.2. Laboratory Processing of Amasi
The raw cow’s milk was processed into amasi by pouring 200 mL of milk into a sterile container and covering it with a lid. The milk was allowed to naturally ferment using the obtained optimal conditions from an earlier study [10], which were 140 h at 32 °C and 120 h at 25 °C, and were named OP32 and OP25. To investigate the effect of starter culture addition on the optimized amasi, freeze-dried mesophilic culture (CHN-22) was used to ferment amasi for 120 h at 25 °C and a thermophilic culture was used (TCC-4) for 140 h at 32 °C. The starter cultures were purchased from Lake Foods (Johannesburg, South Africa), and samples obtained from 120 h at 25 °C and 140 h at 32 °C were named SC25 and SC32, respectively. Some selected physicochemical tests (pH, TTA, TSS, and consistency) were performed in all of the samples, and the results are presented in Supplementary Table S1 as part of an earlier study [10]. All samples, including the raw milk, were freeze-dried prior to analyses. As dictated by the type of analysis, equal amounts of all samples were analysed on a dry matter (DM) basis.
2.3. Total Phenolic Content (TPC)
For the determination of phenolic compounds, flavonoids, and antioxidant capacity, 0.5 g of freeze-dried raw milk and amasi samples were added to a mixture of acetone:acetic acid:water (70:0.5:29.5) [11]. The mixture were respectively centrifuged at 2500 rpm for 10 min at 4 °C. The supernatants were recovered and the residue was further washed with the same mixture and centrifuged under the same conditions. The TPC of amasi samples was evaluated following the Folin–Ciocalteu method as described by Amin et al. [12], with slight modifications. Into a 96-well microplate, 10 µL of the extract was pipetted in triplicate followed by 50 µL of Folin–Ciocalteu reagent. This was allowed to stand for 3 min in the dark followed by the addition of 50 µL of 7.5% Na2CO3. The plate was then covered with aluminium foil and the absorbance was read on a microplate reader (iMark, Biorad, South Africa) at a wavelength of 750 nm. Gallic acid was used as a standard and the results were expressed in mg gallic acid equivalents (GAE)/g.
2.4. Total Flavonoid Content (TFC)
Based on the method of Ar-Farsi and Lee [13], the TFC was evaluated by pipetting 10 µL of the extracts into a 96-well microplate, followed by 30 µL of NaNO2, and allowed to stand for 5 min. Then, 30 µL of AlCl3 was added to the 96-well microplate, and finally 100 µL of NaOH was added. The resulting mixture was read at a wavelength of 450 nm. Quercetin was used as a standard and the results obtained were expressed in mg gallic acid equivalents (GAE)/g dry mass of sample.
2.5. ABTS Assay (2,2-Azinobis (3-Ethyl-Benzothiazone-6-Sulphonic Acid))
This method was performed as described by [14]. Into a 96-well microplate, 20 µL of the extract was pipetted, followed by 180 µL of ABTS free radical cation solution (equal volumes of 7 Mm ABTS and 2.45 Mm K2S2O8 previously incubated for 12 h) and incubated for 5 min in the dark. The absorbance of the solution was measured on a microplate reader set at 750 nm. Trolox was used as a standard solution and the results obtained were expressed in µM trolox equivalents (TE)/g sample.
2.6. DPPH (2,2-Diphenyl-1-Picrylhydrazyl)
DPPH was analysed following the method of Awika et al. [14] using a DPPH stock solution. Briefly, 15 µL of the extract was pipetted into a 96-well microplate, followed by 285 µL of DPPH solution (working solution prepared by diluting 0.024 g of DPPH in 100 mL of methanol (MeOH) and incubated in the dark for 20 min). This was allowed to incubate at 37 °C for 15 min and the absorbance was read at a 570 nm wavelength on a microplate reader. Trolox was used as the standard solution and the results obtained were expressed in µM trolox equivalents (TE)/g sample.
2.7. Untargeted Phenolic Compounds Determination with Ultra-High-Performance Liquid Chromatography (UHPLC)/Quadrupole-Time of Flight Mass Spectrometry (QTOF-MS)
The analysis and quantification of phenolic compounds were performed at Stellenbosch University (Central Analytical Facilities), South Africa, using the modified method of [15]. To a 2 g sample, 20 mL of formic acid (1%) in methanol (80%) was added, mixed into a centrifuge tube, and stirred for 10 min; centrifugation was then conducted at 3000 rpm for 10 min with the temperature controlled at 4 °C. The supernatant was then vaporized to 1 mL and left to dry in a fume cupboard to a persistent weight for 48 h at 25 °C. The dried residue was dissolved in equal amounts of methanol and dimethyl sulphoxide (1 mL). High-resolution ultra-performance liquid chromatography (UPLC)-MS analysis was performed with a Waters Synapt G2 QTOF mass spectrometer linked to Waters Acquity (UPLC) (Waters, Milford, CT, USA). A cone voltage of 15 V in a negative mode with a desolvation gas and temperature of 650 L/h and 275 °C, respectively, along with optimized MS settings were used. A Waters HSS T3 C18 column (2.1 mm diameter × 100 mm length × 17 μm particle size) was used for separation and the mobile phase was 0.1% formic (solvent A) and acetonitrile with 0.1% formic acid (v/v) (solvent B), with a sample injection volume of 2 μL. At 100% solvent A, the gradient started to move for at least 1 min in a linear mode, and it progressed to solvent B (28%) for about 22 min. It continued to solvent B (40%) for 50 sec with a wash stop of 1.5 min at 100% solvent B. To return to the primary conditions, re-equilibration was conducted for 4 min, pumped at a 0.3 m/L min flow rate with a constant temperature column at 55 °C. The compound identification in raw milk and amasi samples were analysed according to the evaluation of their UV spectra, mass spectra, data acquired under the conditions of negative electron ionization with clean standards, Metlin Chemspider, and KNApSAcK databases, and accessible literature.
2.8. Chemical Compositions
The chemical compositions, including crude fat, ash, and moisture contents, were determined using the AOAC methods [16]
2.9. Amino Acid Composition
The composition of amino acids of the raw milk and amasi samples was analysed at the Agricultural Research Council, Irene, South Africa, using the method of [17]. For each sample, 700 mg was hydrolysed using a 1:1 volume of hydrochloric acid (6 N) solution and also α-amino-β-guanidino propionic acid as an internal standard. The hydrolysed solvent was poured into an Eppendorf tube and centrifuged at 300 rpm for at least 10 min; then, the supernatant was filtered (0.45 μm, syringe filter). The supernatant was desiccated under nitrogen gas and derivatized with FMOC reagent and borate buffer. The final mixture was removed with pentane and analysed by HPLC with the use of Schoeffel FS 970, Perkin–Elmer LS-4, and Shimadzu RF-530 fluorescence detectors. An HPLC-grade acetonitrile, methanol, and acetic acid mixture with a ratio of 10:40:50 (v/v/v) mobile phase was used as the eluent and equally mixed to produce acetonitrile acetic acid with a 50:50 v/v for 90 min. The temperature of the oven was maintained at 40 °C and the gradient flow began at a flow rate of 1.3 mL/min at 3 min, which proceeded to 2 mL/min for 0.5 min.
2.10. Mineral Composition
An inductively coupled plasma optical emission spectrometry (ICP-OES) system was used for the analysis of the minerals. Samples were digested using a microwave digester and triplicate freeze-dried samples were analysed using ICP-OES equipment (Spectro ARCOS, Spectro Analytical Instruments, Kleve, Germany) under the following instrumental conditions and parameters: RF power (emission intensity)—1200 W; nebulizer type—Concentric; nebulizer flow—0.5 L/min; gas (at 600 kpa)—argon, auxiliary gas flow—0.5 L/min, PMT volts—600 V, sample flow—0.9 mL/min, and rinse time—5 min (Adebiyi et al., 2017). The standard solutions were prepared using ICP-OES standard solutions, including calcium (Ca), copper (Cu), iron (Fe), potassium (K), magnesium (Mg), manganese (Mn), sodium (Na), phosphorus (P), selenium (Se), and zinc (Zn). The wavelengths of the respective minerals were as follows: Ca—317.93 nm, Cu—327.40 nm, Fe—259.94 nm, K—766.49 nm, Mg—285.21 nm, Mn—257.61 nm, Mo—202.10 nm, Na—589.59 nm, P—178.29 nm, Se—182.03 nm, and Zn—206.20 nm.
2.11. Fatty Acid
The fatty acids composition was analysed using the method of Moreno-Fernández [18]. Approximately 10 mL of chloroform:methanol (1:2) solution was added to 50 mg of sample. The samples were then vortexed and sonicated at ambient temperature. After 30 min of sonication, the samples were centrifuged at 3000 rpm for about 1 min and 500 µL of the bottom layer was dried with a stream of nitrogen. This mixture was reconstituted and vortexed with 500 µL of methyl tert-butyl ether, and 100 µL was derivatized with 30 µL of trimethylsulphonium hydroxide. In a 5:1 split ratio, 1 µL of the derivatized sample was analysed on a gas chromatography–flame ionization detector (GC-FID) system (6890N, Agilent Technologies) and separation was conducted on a polar RT-2560 column (100 m × 0.25 mm × 0.20 µm) (Restek, Bellefonte, PA, USA) capillary. Hydrogen was used as the carrier gas at a flow rate of 1.2 mL/min and the temperature of the injector was maintained at 240 °C. The oven temperature was set with the following conditions: 60 °C for 1 min, raised to 120 °C at a rate of 8 °C/min for 1 min, then followed by a rate of 1.5 °C/min to 245 °C for 1 min, and finally raised to 250 °C at a rate of 20 °C/min for 2 min. The fatty acids were quantified using 37 FAME Supleco standard mix (Sigma-Aldrich, St. Louis, MO, USA).
2.12. Statistical Analysis
All analyses were conducted in triplicate using a one-way analysis of variance (ANOVA) (IBM SPSS Statistics, ver 22, New York, NY, USA). Means were compared using Duncan’s multiple range test at a p ≤ 0.05 significance level and values were represented as the mean ± standard deviation.
3. Results and Discussion
3.1. Chemical Composition
The chemical composition of amasi varies widely and is influenced by the milk composition, the fermentation time and temperature, and the storage conditions [5]. The chemical compositions of the raw milk and fermented milk (amasi) are provided in Table 1. The moisture content significantly increased from 2.24% in raw milk to 5.5% in SC32, while OP32 was observed to have the lowest moisture content among the studied fermented samples. The low moisture content observed could be due to the removal of whey at the end of the fermentation process [19]. Based on the traditional recipe adopted for this study, the natural fermentation of amasi included the removal of whey, while amasi fermentation with starter culture did not include the removal of whey; hence, a higher moisture content was observed.

Table 1.
Chemical composition of raw milk and amasi.
The ash content ranged from 4–5.99% for all samples, as shown in Table 1. As expected, the ash content was higher in the fermented samples, with the starter-culture-fermented samples having a higher ash content. A similar trend was also observed by previous workers [20,21] during the production of nunu. The current study reports a higher content of ash, which is in line with the study of Moreno-Fernández et al. [18], while other studies reported a lower ash content ranging from 0.63–0.74% [19,22]. Milk and milk products are reported to be good sources of fat [23]. The fat content of raw milk and amasi ranged from 6.50–13%, as shown in Table 1, indicating a significant decrease in the fermented samples, except for SC32. A reduction in the fat content was also observed by Sarkiyayi and Shehu [22] and Fagbemigun et al. [24] during the production of nunu. The decrease in the fat content might be caused by the utilization of oxidized lipids to generate energy for growth and cellular activities by fermenting microorganisms [25]. A drastic increase in fat was observed in sample SC32, which is in agreement with the assertion that the lactic acid bacteria might increase the free fatty acid production by the lipolysis of dairy fat [26].
3.2. Amino Acid
Aside from playing a role in constituting proteins, amino acids have many essential biological functions. They are also energy metabolites, and most of them are important nutrients [17]. They are divided into essential and non-essential amino acids, of which the essential ones originate from food and cannot be synthesized by the body, while the non-essential can be synthesized by the body [27]. The effects of the fermentation time and temperature on the amino acid (AA) compositions of raw milk and amasi are displayed in Table 2. Spontaneous and starter culture fermentation were found to significantly increase the AA contents of most samples. Raw milk is known to be rich in various amino acids [28], and this was reflected in the AA composition of the raw milk in this study (Table 2). The naturally fermented samples at 32 °C (OP32) had the highest content of both essential and non-essential AAs compared with other samples. Tyrosine was at the highest concentration in the sample that was fermented with a starter culture at 32 °C (SC32).
Table 2.
Amino acid contents of raw milk and amasi.
Amongst all of the AAs detected, glutamic acid had the highest concentration in all of the samples investigated in this study (Table 2). A high concentration was observed in OP32 (6.30 g/100 g), followed by SC25 (5.58 g/100 g) and SC32 (5.35 g/100 g), with OP25 (4.46 g/100 g) having the lowest concentration. Similar results of glutamic acid being the AA most detected in all samples have been reported in the literature [28,29]. The second-most-abundant AA was leucine, with OP32 observed to have the highest concentration (2.49 g/100 g) and OP25 having the lowest concentration. The samples were fermented at different temperatures, hence the significant difference between the two samples. Temperature plays an essential role in the activities of microorganisms during fermentation [9]. Leucine is reported to be one of the important elements in protein synthesis and the generation of adenosine triphosphate (ATP) [30]. The hydroxyl derivative of proline (HO-Proline) was not detected in most samples, while proline was an abundant AA detected in this study. In all of the samples investigated, OP32 had the highest concentration of essential AAs, and this trend was also observed in the non-essential AAs.
3.3. Total Phenolic Content, Total Flavonoid Content, and Antioxidant Assay
Regular intake of phenolic and antioxidant compounds is reported to be of great significance for maintaining oxidative stress and may be a main way to prevent health problems, such as cardiovascular diseases and cancer [31]. Dairy products are considered good sources of antioxidants, which include proteins, vitamins, enzymes, phenolic compounds, and organic acids. The data presented in Figure 1 show the TPC, TFC, and antioxidant activity of the investigated samples. The TPC of raw milk increased from 0.32 mg GAE/g to 0.93 mg GAE/g in OP32, and there was a slight decrease in SC25 (0.31 mg GAE/g). However, for TFC, there was a dramatic increase from 1.67 mg CE/g in raw milk to 10.88 mg CE/g in SC25. The increase in TPC observed was in line with the study of Taskin and Bagdathoglu [32] during the production of plain yoghurt. During the process of fermentation, the hydrolysis of milk constituents might release bioactive compounds, which could have contributed to the increase in TPC [32]. Sample SC25 was also observed to have the highest TFC value (10.88 mg CE/g), followed by SC32 (5.74 mg CE/g).
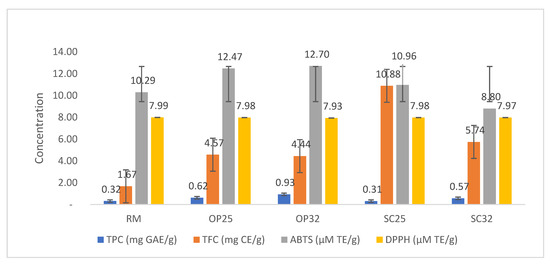
Figure 1.
Total phenolic content, total flavonoid content, and antioxidant assay of raw milk and amasi. RM—raw milk, OP25—optimized fermented milk (amasi) at 25 °C, OP32—optimized fermented milk (amasi) at 32 °C, SC25—fermented milk (amasi) with starter culture at 25 °C, SC32—fermented milk (amasi) with starter culture at 32 °C. TPC—total phenolic content, TFC—total flavonoid content, ABTS—2,2-Azinobis (3-Ethyl-Benzothiazone-6-Sulphonic acid) (ABTS), DPPH—2,2-diphenyl-1-picrylhydrazyl. Each value is a mean of triplicate analyses.
Milk and its products are sources of minerals, vitamins, proteins, and other nutrients, and these constituents reportedly have some antioxidant capacity [33]. As observed in Figure 1, fermentation significantly increased the antioxidant capacity in the fermented samples. The highest value of antioxidant activity recorded was 12.70 µM TE/g for OP32, while the lowest was 10.29 µM TE/g for raw milk. The increase in antioxidant activity observed was in line with the study by Yirmibeşoğlu and Oztürk [34] during the production of kefir. The increase in antioxidant capacity can be linked to the increase in other constituents reported in this study (Table 1, Table 2 and Table 3). Previous studies have alluded to this, positing that fermented products have higher antioxidant capacity compared with milk in its natural form due to the modification of its constituents [34,35].
Table 3.
Untargeted phenolic compounds of raw milk and amasi.
3.4. Untargeted Phenolic Compounds
The untargeted phenolic compounds were quantified by UHPLC/QTOF-MS and the data reported are presented in Table 3. To the best of our knowledge, this is the first study to report on the profiling of untargeted phenolic compounds in raw milk and amasi using UHPLC/QTOF-MS. Based on the four identified phenolic compounds, only scoparone was observed to be present in all samples at a retention time (Rt) of 6.62 min and m/z of 205.06. The levels of some phenolic compounds were observed to have significantly decreased in some compounds after the process of fermentation, in contrast to the TPC levels, which significantly increased after fermentation. Gardenin B, with the molecular formula C19H18O7, was observed to have drastically decreased after fermentation from 145.23 µg/g in raw milk to 0.4 µg/g in OP25, and it rapidly decreased to 86.34 µg/g in SC25. The decrease in these observed phenolic compounds may be attributed to their metabolism into different other forms through enzymatic activities which are known to break down the phenolic compounds during the process of fermentation [36]. The other reason for the decrease in the polyphenol contents could be linked to the binding of phenols with other molecules found in the product, such as proteins and carbohydrates [37]. Amasi obtained with starter cultures (SC25 and SC32) had higher concentrations of scoparone (319.52 and 316.83 µg/g) and chlorogenic acid (1.32 µg/g) in SC32 than the naturally fermented amasi and raw milk. During the process of fermentation, the proteolytic activities of LAB cultures could have equally contributed to the reported observation (Table 3), which caused the release of bound phenolic compounds that led to the formation of biologically active compounds [38].
3.5. Mineral Compositions
Raw milk and fermented milk products are great sources of minerals, containing significant amounts of phosphorus (P), calcium (Ca), potassium (K), and magnesium (Mg) [4]. Table 4 shows the mineral element compositions of the raw milk and amasi samples. The potassium contents ranged from (110.1–134.5 mg/kg) and were significantly (p ≤ 0.05) higher in all the samples, followed by Ca, P, Na, and Mg. OP32 exhibited a significantly higher mineral content, followed by SC25 and SC32, compared with the raw milk. The high concentrations of K, Ca, P, Na, and Mg in fermented samples could be due to metabolic activities that are taking place during fermentation [39]. A high concentration of K in fermented samples was also reported by the FAO/WHO [40]. Chileshe et al. [19] also reported a high concentration of Ca in mabisi (fermented milk product from Zambia). These minerals (K, Ca, P, Na, and Mg) are the most essential in the human body because they are responsible for the development and growth of bones, as well as metabolism and health maintenance. According to Cissé et al. [39], the mineral concentration in all of the fermented samples relied on the available species, their characteristics, the nature of the equipment used to store milk, degree of contamination, and the health condition of the mammal used to source milk.
Table 4.
Mineral compositions of raw milk and amasi.
Toxic elements, such as As, Cr, Ni, and Pb, were not detected. For each of the heavy metals that were detected in Table 4, their values were below the recommendation of the Joint FAO/WHO Expert Committee on Food Additives (JECFA) [41,42]. According to previous studies, amasi is mostly consumed due to the benefits of its mineral content, such as Ca [39,43]. Most Zulu men from Kwa Zulu Natal in South Africa used to believe that amasi gave them strength, which could be true, because Ca, P, and other essential minerals are reported to be great sources of strong and healthy bones [39,43].
3.6. Fatty Acids
The data presented in Table 5 show the fatty acid components of raw milk and its corresponding samples, which were optimized amasi and amasi fermented with starter cultures. A total of 17 fatty acids were observed, including both saturated and unsaturated fatty acids. The level of C16 (palmitic acid) in all of the analysed samples was the highest among all of the other fatty acids. The data shown in Table 5 also demonstrate that each fatty acid underwent some changes during the process of fermentation. For example, the content of C14 (myristic acid) decreased from 3.68 mg/g in raw milk to 2.90 mg/g and 2.48 mg/g in OP25 and OP32, respectively, and it further decreased to 1.80 mg/g in SC32. On the other hand, the content of C20 (eicosenoic acid) increased from 0.11 mg/g in raw milk to 0.13 mg/g in OP25, and then decreased again to 0.04 mg/g in OP32 and was not detected in SC25 and SC32. This shows that the individual fatty acids underwent various patterns of changes during the fermentation process. The decrease in fatty acids observed might be due to the biochemical and physiological changes that took place during the process of fermentation [44]. According to Adebo et al. [38], fermentation improving the composition of these fatty acids is necessary; LAB fermentation might lead to the conversion of intrinsic fatty acids into bioactive derivatives. The increase in fatty acid observed (Table 5) might be due to the hydrolysis of fats which can be found in raw milk. The increase could also be attributed to the separation of lipid complexes and lipolytic enzyme activities, which lead to increases in extractability and the liberation of the fat-related components [38].
Table 5.
Fatty acid composition of raw milk and amasi.
Previous reports have shown similar patterns where the content of fatty acids decreased after the fermentation process [38,45]. The fatty acids C18 (stearic acid) and C18: 1 (oleic acid) were higher in the raw milk than in the fermented products (OP25, OP32, SC25, and SC32), and this was in line with a previous study [44]. The study showed that the total amount of medium–long-chain fatty acids (caproic acid, caprylic acid, capric acid, and lauric acid) was significantly higher than that of unsaturated fatty acids (myristoleic acid, palmitoleic acid, oleic acid, linoleic acid, and eicosapentaenoic acid). Fermented milk with starter cultures had the lowest concentration of fatty acids (Table 5). This suggests that the fermenting microorganisms (starter cultures) used were not able to produce fatty acid isomers during the fermentation process [38]. The different patterns in fatty acid composition observed in the raw milk and fermented samples were a result of the activities of microorganisms found in amasi, such as Lactobacillaceae and Streptococcaceae. The breakdown of fatty acids is commonly understood to be the primary biochemical change that significantly affects the shelf-life of most dairy products, as well as their characteristics [46]. The development of the aroma and flavour of the raw milk and fermented samples is caused by the release of free fatty acids from the triglycerides that form during the breakdown of fatty acids [45].
4. Conclusions
The fermentation process is a traditional process to improve the nutritional composition of milk and its health-promoting properties. In this study, fermentation was found to improve the nutritional content, mineral composition, and amino acid value of amasi. It also increased most of the phytochemicals and antioxidant activity values of most of the samples. The content of fatty acids was observed to decrease in the fermented samples. It can be concluded that fermentation has a significant beneficial effect on the nutritional and health-promoting qualities of both spontaneously and starter-culture-fermented amasi. Amasi has the capacity to contribute to diet whilst also providing nutritional and health benefits. Further studies on the flavour profile of the product are recommended to correlate the observations in this study with the aroma of amasi.
Supplementary Materials
The following supporting information can be downloaded at: https://www.mdpi.com/article/10.3390/fermentation8100493/s1, Table S1: Physicochemical analysis of raw milk and amasi samples.
Author Contributions
O.A.A.: conceptualization; O.A.A. and M.S.M.: methodology; M.S.M.: formal analysis; M.S.M.: investigation; O.A.A.: resources; M.S.M.: data; M.S.M.: writing (original draft); O.A.A.: review and editing; O.A.A.: supervision. All authors have read and agreed to the published version of the manuscript.
Funding
This research was funded by the National Research Foundation (NRF) of South Africa Grant Holder Linked Bursary and Thuthuka funding (Grant no: 121826), and the University of Johannesburg (UJ) Global Excellence and Stature (GES) 4.0 Catalytic Initiative Grant.
Institutional Review Board Statement
Not applicable.
Informed Consent Statement
Not applicable.
Data Availability Statement
The data generated and analysed during the current study are available from the corresponding author on reasonable request.
Acknowledgments
The members of the Food Innovation Research Group are duly acknowledged.
Conflicts of Interest
The authors declare no conflict of interest.
References
- Jatmiko, Y.D.; Howarth, G.S.; Barton, M.D. Naturally fermented milk and its therapeutic potential in the treatment of inflammatory intestinal disorders. AIP Conf. Proc. 2018, 2019, 060009. [Google Scholar]
- Gran, H.M.; Gadaga, H.T.; Narvhus, J.A. Utilization of various starter cultures in the production of amasi, a Zimbabwean naturally fermented raw milk product. Int. J. Food Microbiol. 2003, 88, 19–28. [Google Scholar] [CrossRef]
- Moonga, H.B. Product Optimization of Zambian Traditionally Fermented Milk—Mabisi. Ph.D. Thesis, Wageningen University, Wageningen, The Netherlands, 2019. [Google Scholar]
- Maleke, M.; Adefisoye, M.; Doorsamy, W.; Adebo, O.A. Processing, nutritional composition and microbiology of amasi: A Southern African fermented milk product. Sci. Afr. 2021, 12, e00795. [Google Scholar] [CrossRef]
- Agyei, D.; Owusu, K.J.; Akabanda, F.; Akomea, F.S. Indigenous African fermented dairy products: Processing technology, microbiology and health benefits. Crit. Rev. Food Sci. Nutr. 2019, 60, 991–1006. [Google Scholar] [CrossRef]
- Todorov, S.D.; Nyati, H.; Meincken, M.; Dicks, L.M.T. Partial characterization of bacteriocin AMA-K, produced by Lactobacillus plantarum AMA-K isolated from naturally fermented milk from Zimbabwe. Food Control 2007, 18, 656–664. [Google Scholar] [CrossRef]
- Kayitesi, E.; Behera, S.K.; Panda, S.K.; Dlamini, B.; Mulaba-Bafubiandi, A.F. Amasi and Mageu Expedition from Ethnic Southern African Foods to Cosmopolitan Markets, Fermented Food—Part II: Technological Interventions; CRC Press: New York, NY, USA, 2017; pp. 385–388. [Google Scholar]
- Ebringer, L.; Ferenčík, M.; Krajčovič, J. Beneficial health effects of milk and fermented dairy products. Folia Microbiol. 2008, 53, 378–394. [Google Scholar] [CrossRef]
- Moonga, H.B.; Schoustra, S.E.; Linnemann, A.; Kuntashula, E.; Shindano, J.; Smid, E.J. The art of mabisi production: Traditional fermented milk. PLoS ONE 2019, 14, e0213541. [Google Scholar] [CrossRef]
- Maleke, M.S.; Doorsamy, W.; Abrahams, A.M.; Adefisoye, M.A.; Masenya, K.; Adebo, O.A. Influence of fermentation conditions (temperature and time) on the physicochemical properties and bacteria microbiota of amasi. Fermentation 2022, 8, 57. [Google Scholar] [CrossRef]
- Oyedeji, A.B.; Mellem, J.J.; Ijabadeniyi, O.A. Improvement of some quality attributes of soymilk through optimization of selected soybean sprouting parameters using response surface methodology. CyTA—J. Food 2018, 16, 230–237. [Google Scholar] [CrossRef]
- Amin, I.; Norazaidah, Y.; Hainida, K.E. Antioxidant activity and phenolic content of raw and blanched Amaranthus species. Food Chem. 2006, 94, 47–52. [Google Scholar] [CrossRef]
- Ar-Farsi, M.A.; Lee, C.Y. Optimization of phenolics and dietary fibre extraction from date seeds. J. Food Sci. Technol. 2013, 108, 977–985. [Google Scholar]
- Awika, J.M.; Rooney, L.W.; Wu, X.; Prior, R.L.; Cisneros-Zevallos, L. Screening methods to measure antioxidant activity of sorghum (Sorghum bicolor) and sorghum products. J. Agric. Food Chem. 2003, 51, 6657–6662. [Google Scholar] [CrossRef]
- Magalhaes, S.C.Q.; Taveira, M.; Cabrita, A.R.J.; Fonseca, A.J.M.; Valentao, P.; Andrade, P.B. European marketable grain legume seeds: Further insight into phenolic compounds profiles. Food Chem. 2017, 215, 177–184. [Google Scholar] [CrossRef]
- Association of Analytical Communities (AOAC). Official Methods of Analysis of AOAC International, 18th ed.; AOAC: Washington, DC, USA, 2010. [Google Scholar]
- Adebiyi, J.A.; Obadina, O.A.; Adebo, O.A.; Kayitesi, E. Comparison of nutritional quality and sensory acceptability of biscuits obtained from native, fermented and malted pearl millet (Pennisetum glaucum) flour. Food Chem. 2017, 232, 210–217. [Google Scholar] [CrossRef]
- Moreno-Fernández, J.; Díaz-Castro, J.; Alférez, M.J.; Hijano, S.; Nestares, T.; López-Aliaga, I. Production and chemical composition of two dehydrated fermented dairy products based on cow or goat milk. J. Dairy Res. 2016, 83, 81–88. [Google Scholar] [CrossRef]
- Chileshe, J.; van den Heuvel, J.; Handema, R.; Zwaan, B.J.; Talsma, E.F.; Schoustra, S. Nutritional composition and microbial communities of two non-alcoholic traditional fermented beverages from Zambia: A study of mabisi and munkoyo. Nutrients 2020, 12, 1628. [Google Scholar] [CrossRef]
- Okeke, S.K.; Abullahi, O.I.; Makun, H.A.; Okeke, U.K. Physico-chemical and nutritional qualities of dairy cattle products. Glob. J. Life Sci. Biol. Res. 2016, 2, 8–13. [Google Scholar]
- Obi, C.N.; Ikenebomeh, M.J. Studies on the microbiology and nutritional qualities of a Nigerian fermented milk product (nono). Int. J. Dairy Sci. 2007, 2, 95–99. [Google Scholar]
- Sarkiyayi, S.; Shehu, M. Effects of boiling and fermentation on the nutrient composition of cow milk in Kaduna Metropolis. Res. J. Chem. Sci. 2011, 2231, 606X. [Google Scholar]
- Barłowska, J.; Szwajkowska, M.; Litwi, N.Z.; Król, J. Nutritional value and technological suitability of milk from various animal species used for dairy production. Comp. Rev. Food Sci. Food Saf. 2011, 10, 291–302. [Google Scholar] [CrossRef]
- Fagbemigun, O.; Rösch, N.; Sung, C.G. Nutritional and sensory qualities of indigenous and starter culture fermented milk from Nigeria. Int. J. Sci. Technoledge 2021, 9. [Google Scholar] [CrossRef]
- Sanni, A.I.; Lönner, C. Identification of yeasts isolated from Nigerian traditional alcoholic beverages. Food Microbiol. 1993, 10, 517–523. [Google Scholar] [CrossRef]
- Vieira, C.P.; Álvares, T.S.; Gomes, L.S.; Torres, A.G.; Paschoalin, V.M.F.; Conte-Junior, C.A. Kefir grains change fatty acid profile of milk during fermentation and storage. PLoS ONE 2015, 10, e0139910. [Google Scholar]
- Hou, Y.; Yin, Y.; Wu, G. Dietary essentiality of “nutritionally non-essential amino acids” for animals and humans. Exp. Biol. Med. 2015, 240, 997–1007. [Google Scholar] [CrossRef]
- Akabanda, F.; Kwarteng, J.O.; Deborah, K.T.; Parkouda, C.; Jespersen, L. The use of lactic acid bacteria starter culture in the production of nunu, a spontaneously fermented milk product in Ghana. Int. J. Food Sci. 2014, 2014, 721067. [Google Scholar] [CrossRef]
- Kakimov, A.; Kakimova, Z.; Mirasheva, G.; Bepeyeva, A.; Toleubekova, S.; Jumazhanova, M.; Zhumadilova, G.; Yessimbekov, Z. Amino acid composition of sour-milk drink with encapsulated probiotics. Annu. Res. Rev. Biol. 2017, 1–7. [Google Scholar] [CrossRef]
- Duan, Y.; Li, F.; Li, Y.; Tang, Y.; Kong, X.; Feng, Z.; Anthony, T.G.; Watford, M.; Hou, Y.; Wu, G. The role of leucine and its metabolites in protein and energy metabolism. Amino Acids 2016, 48, 41–51. [Google Scholar] [CrossRef]
- Sadat, L.; Cakir-Kiefer, C.; Negue, M.N.; Gaillard, J.; Girardet, J.M.; Miclo, M. Isolation and identification of antioxidant peptides from bovine α-lactalbumin. Int. Dairy J. 2011, 21, 214–221. [Google Scholar] [CrossRef]
- Taskin, B.; Bagdathoglu, N. Influence of conventional fermentation on antioxidant activity and phenolic contents of two common dairy products: Yogurt and kefir. Turk. J. Agric.—Food Sci. Technol. 2020, 8, 1277–1282. [Google Scholar]
- Khan, I.T.; Nadeem, M.; Imran, M.; Khalique, A. Impact of post fermentation cooling patterns on fatty acid profile, lipid oxidation and antioxidant features of cow and buffalo milk set yoghurt. Lipids Health Dis. 2020, 19, 1–12. [Google Scholar] [CrossRef]
- Yirmibeşoğlu, S.S.S.; Oztürk, B.E.T. Comparing microbiological profiles, bioactivities, and physicochemical and sensory properties of donkey milk kefir and cow milk kefir. Turk. J. Vet. Anim. Sci. 2020, 44, 774–781. [Google Scholar] [CrossRef]
- Songisepp, E.; Kulisaar, T.; Hutt, P.; Elias, P.; Brilene, T.; Zilmer, M.; Mikelsaar, M. A new probiotic cheese with antioxidative and antimicrobial activity. J. Dairy Sci. 2004, 87, 17–23. [Google Scholar] [CrossRef]
- Adebo, O.A.; Medina-Meza, I.E. Impact of fermentation on the phenolic compounds and antioxidant activity of whole cereal grains: A mini review. Molecules 2020, 25, 927. [Google Scholar] [CrossRef] [PubMed]
- Saharan, K.; Khetarpaul, N.; Bishnoi, S. Antinutrients and protein digestibility of fababean and ricebean as affected by soaking, dehulling and germination. J. Food Sci. Technol. 2002, 39, 418–422. [Google Scholar]
- Adebo, O.A.; Kayitesi, E.; Tugizimana, F.; Njobeh, P.B. Differential metabolic signatures in naturally and lactic acid bacteria (LAB) fermented ting (a Southern African food) with different tannin content, as revealed by gas chromatography mass spectrometry (GC-MS) based metabolomics. Food Res. Int. 2019, 121, 326–335. [Google Scholar] [CrossRef]
- Cissé, H.; Muandze-Nzambe, J.U.; Somda, N.S.; Sawadogo, A.; Drabo, S.M.; Tapsoba, F.; Zongo, C.; Traoré, Y.; Savadogo, A. Assessment of safety and quality of fermented milk of camels, cows, and goats sold and consumed in five localities of Burkina Faso. Vet. World 2019, 12, 295. [Google Scholar] [CrossRef]
- Wang, H.; Wang, C.; Wang, M.; Guo, M. Chemical, physiochemical, and microstructural properties, and probiotic survivability of fermented goat milk using polymerized whey protein and starter culture Kefir Mild 01. J. Food Sci. 2017, 82, 2650–2658. [Google Scholar] [CrossRef]
- FAO; WHO. Limit Test for Heavy Metals in Food Additive Specifications. Explanatory Note: Joint FAO/WHO Expert Committee on Food Additives, 59th Meeting; The Food and Agriculture Organization (FAO): Rome, Italy, 2002. [Google Scholar]
- Elbagermi, M.A.; Edwards, H.G.M.; Alajtal, A.I. Monitoring of heavy metal content in fruits & vegetables collected from production and market sites in the Misurata area of Libya. Int. Sch. Res. Netw. 2012, 2012, 827645. [Google Scholar]
- Burger, L. Amasi’s sweet success: Processing. Dairy Mail 2010, 17, 90–95. [Google Scholar]
- Manzo, N.; Pizzolongo, F.; Montefusco, I.; Aponte, M.; Blaiotta, G.; Romano, R. The effects of probiotics and prebiotics on the fatty acid profile and conjugated linoleic acid content of fermented cow milk. Int. J. Food Sci. Nutr. 2015, 66, 254–259. [Google Scholar] [CrossRef]
- Sumarmono, J.; Sulistyowati, M. Fatty acids profiles of fresh milk, yogurt and concentrated yogurt from peranakan etawah goat milk. Proc. Food Sci. 2015, 3, 216–222. [Google Scholar] [CrossRef]
- Şenel, E.; Atamer, M.; Gürsoy, A.; Öztekin, F.S. Changes in some properties of strained (Süzme) goat’s yoghurt during storage. Small Rumin. Res. 2011, 99, 171–177. [Google Scholar] [CrossRef]

Publisher’s Note: MDPI stays neutral with regard to jurisdictional claims in published maps and institutional affiliations. |
© 2022 by the authors. Licensee MDPI, Basel, Switzerland. This article is an open access article distributed under the terms and conditions of the Creative Commons Attribution (CC BY) license (https://creativecommons.org/licenses/by/4.0/).