Abstract
Geosmin produced by Streptomyces can cause an earthy off-flavor at trace levels, seriously deteriorating the quality of Chinese liquor. Geosmin was detected during the Daqu (Chinese liquor fermentation starter)-making process, which is a multi-species fermentation process in an open system. Here, biocontrol, using the native microbiota present in Daqu making, was used to control the geosmin contamination. Six native strains were obtained according to their inhibitory effects on Streptomyces and then were inoculated into the Daqu fermentation. After inoculation, the content of geosmin decreased by 34.40% (from 7.18 ± 0.13 μg/kg to 4.71 ± 0.30 μg/kg) in the early stage and by 55.20% (from 8.86 ± 1.54 μg/kg to 3.97 ± 0.78 μg/kg) in the late stage. High-throughput sequencing combined with an interaction network revealed that the fungal community played an important role in the early stage and the correlation between Pichia and Streptomyces changed from the original indirect promotion to direct inhibition after inoculation. This study provides an effective strategy for controlling geosmin contamination in Daqu via precisely regulating microbial communities, as well as highlights the potential of biocontrol for controlling off-flavor chemicals at trace levels in complex fermentation systems.
1. Introduction
Geosmin is a volatile metabolite produced by Streptomyces, cyanobacteria, and fungi [1,2], which can cause an earthy off-flavor at trace levels (the threshold is at the ng/L level) [3], seriously deteriorating the flavor and quality of multiple products, such as aquatic products [4,5,6], drinking water [7,8], juice [9,10], and especially Chinese liquor [1,4]. Geosmin contamination has always been a serious problem for the Chinese liquor industry and leaves a dirty and dusty impression. The highest concentrations of geosmin have been determined in the light-aroma-type liquor [2,4]. Geosmin has an extremely low threshold (from 6 to 10 ng/L), and people usually start to feel uncomfortable at 7 ng/L at 45 °C [11,12]. Therefore, although the concentration of geosmin in food and beverages remains at a very low level, it still causes unpleasant feelings. In our previous studies, Streptomyces spp. acting as the geosmin producer have been regarded as the most frequent and serious microbial contamination. Streptomyces spp. produce a vast array of antibiotics that inhibit the growth and metabolism of brewing functional yeasts and molds, thereby reducing the flavor compounds (alcohols and esters) in Chinese liquor [1,2,4,13].
Chinese liquor is a traditional distilled alcoholic beverage with thousands of years’ history [4,14]. Different from distilled liquors in the West, such as whisky and brandy, Chinese liquor is a typical solid-state fermentation product from grains [13], with saccharification and fermentation simultaneously proceeding [14]. Daqu acts as the saccharifying and fermenting agent and contributes a large number of functional communities to the fermentation process of liquor [2,15,16]. Daqu is manufactured through a spontaneous solid-state fermentation process in an open environment [15]. Functional mold, bacteria, and yeasts form a special microbiota and produce various enzymes and flavor compounds through growth and metabolism during Daqu fermentation. The dominant mold existing in the Daqu includes the genus Aspergillus (A. terreus, A. oryzae), Rhizopus (R. oryzae, R. peka), Thermomyces (T. crustaceus), and Thermoascus (T. crustaceus). Yeasts mainly include Pichia (P. anomala, P. fermentans, P. kudriavzevii), Saccharomyces (S. cerevisiae), Wickerhamomyces (W. anomalus), Torulaspora, and Candida. Bacteria includes Bacillus (B. subtilis, B. licheniformis, B. amyloliquefaciens, B. sonorensis), Lactobacillus (L. helveticus, L. fermentum, and L.panis), Lactococcus (L. lactis), Weissella (W. cibaria), and acetic acid bacteria species [5,17]. Therefore, microbiota in Daqu largely determine the characteristics of Daqu and Chinese liquor [13]. However, in an open system, high concentrations of geosmin were found during the Daqu-making process, causing damage to the quality of the liquor [13].
Recently, several effective methods have been suggested to control geosmin in drinking water and wine. For example, activated carbon, chlorination, ozonation process, and K2FeO4 oxidation were applied in drinking water [8,18,19,20,21]. Chitosan, zeolite, and filtration have been used to remove geosmin from white wine [22]. However, these methods are not effective to control geosmin and Streptomyces contamination in the practical production of Daqu making. Biocontrol is an efficient and environmentally friendly approach to rationally improve the fermentation quality, where some bacteria and yeasts have been used as biocontrol agent in fermented foods production [23,24,25]. For instance, non- and low-fermenting yeast strains were used in grape juice to control the ochratoxin A producer Aspergillus spp. [23]. Bacillus megaterium was used in peanuts to control the aflatoxin produced by Aspergillus flavus and reduce the post-harvest rot problem of peanut kernels [24]. In our previous study, Bacillus showed a good ability to inhibit geosmin production in the simulated fermentation experiments on a laboratory scale [2]. Therefore, biocontrol could be a more promising solution to solve the urgent requirements in geosmin contamination. However, different from the laboratory-scale fermentation, the practical production process of Daqu is in an open environment with multi-species and is influenced by multiple factors. Therefore, whether biocontrol effectively controls geosmin production in the complex fermentation process of Daqu still needs further verification.
In this study, Streptomyces albus F5A-1 was used as the representative strain of Streptomyces spp. A medium-temperature Daqu was used to select the functional microorganisms that inhibited Streptomyces growth. Then, the functional microorganisms were inoculated into the Daqu-making process to evaluate their effects on the geosmin production, microbial structure, and flavor metabolites of the Daqu. Headspace solid-phase microextraction–gas chromatography–mass spectrometry (HS-SPME-GC-MS) was used to determine the content of geosmin and other volatile metabolites. High-throughput sequencing was used to determine the microbial community structure during Daqu fermentation.
2. Materials and Methods
2.1. Strains
The indicator strain of geosmin production was Streptomyces albus F5A-1, which was previously isolated from medium-temperature Daqu and stored in our lab at −80 °C in a Luria-Bertani (LB) broth glycerol stock [1,2].
Geosmin-inhibiting microorganisms were isolated by the conventional agar dilution method from medium-temperature Daqu. As a type of Daqu, the maximum temperature in the production of medium-temperature Daqu is 40–50 °C. For the isolation of geosmin-inhibiting microorganisms, 10 g of the Daqu sample was mixed with 90 mL of sterile saline solution (0.90% (wt/vol)) and then shaken for 1 h at 200 rpm at 30 °C. The homogenates were diluted serially 10-fold with sterile saline solution. Finally, 100 μL of the dilution was spread on the agar plates and incubated. The fungi, which included mold and yeast, were incubated in potato dextrose agar (PDA; potato extract 6 g/L, glucose 20 g/L, penicillin–streptomycin solution 100 mg/L, and agar 20 g/L) plates at 28 °C for 5 days. Bacteria was incubated in Luria-Bertani (LB) agar (peptone 10 g/L, NaCl 10 g/L, yeast extract 5 g/L, nystain 10 mg/L, and agar 20 g/L, pH: 7.4) plates at 37 °C for 2 days. The colonies of different forms were purified by repetitive streaking until a single-colony morphology. DNA of isolated strains was extracted based on previously described methods [26]. For fungi, primers ITS1 and ITS4 were used to amplify the ITS region [27]. For bacteria, primer sets 27F and 1492R were used to amplify the 16S rRNA genes [28]. PCR products were obtained by GENEWIZ (Suzhou, China). The sequences were used for BLAST searches (http://www.ncbi.nlm.nih.gov/BLAST/, accessed on 1 April 2020) for the identification of isolates. Finally, all the isolates were stored in their corresponding broth glycerol stock at −80 °C.
The growth inhibition assays were carried out according to Zhi et al. [2]. Every inhibition zone on the plate was measured six times with a vernier caliper. The final value is the average of the six values. We quantified the growth inhibition based on the diameter ratio of inhibition zone to colony (R inhibition zone/R colony). The strains with R inhibition zone/R colony > 1.15 were chosen as the geosmin-inhibiting microorganisms.
2.2. Preparation of Geosmin-Inhibiting Microorganisms
The yeast strains were separately inoculated into yeast extract–peptone–dextrose (YPD) broth (yeast extract 10 g/L, peptone 20 g/L, and glucose 20 g/L) at 30 °C, spun at 200 rpm for 2 d, and Bacillus was inoculated into Luria-Bertani (LB) broth (beef extract 5 g/L, peptone 10 g/L, sodium chloride 10 g/L) at 37 °C, spun at 200 rpm for 2 d. After inoculation, each seed broth was centrifuged at 12,000 rpm/min for 10 min; then the supernatant was discarded, and the precipitated cells were washed three times with sterile normal saline. The precipitated cells were then resuspended in sterile water and counted using a hemocytometer. Finally, each suspension was separately diluted to 106 cells/g Daqu and then mixed them together to inoculate into the Daqu fermentation.
2.3. Experimental Design and Daqu Sample Collection
The experiments were performed in a distillery in Shaanxi Province, China (34°55′ N; 107°32′ E). Four independent batches of Daqu fermentation from two workshops (Workshops A and B, which were closely located) were chosen. Two batches from Workshop A were the test group (inoculation with the geosmin-inhibiting microorganisms) and another two batches from Workshop B were the control group. Four batches used the same raw materials (wheat) and technological parameters (such as the water content and machine parameters (pressure and the times of pressing bricks)). The seed broth was evenly mixed with crushed materials. Then, the uninoculated and inoculated Daqu were fermented in the same way. According to a previous study, geosmin is mainly produced in the early and the middle stage of fermentation [2,29]. Hence, the Daqu samples were collected on Days 0, 3, 5, 10, 15, and 20. Samples were collected from the upper, middle, and lower layers, and three Daqu bricks were obtained from each layer. Finally, the rind and the core of the Daqu bricks from different points in the same layer were separately crushed and then mixed to form one sample (Figure S1). Six parallel samples were obtained in each fermentation time. Daqu samples were then transferred to the lab for the analysis of physicochemical parameters, volatile compound analysis, and microbial community.
2.4. Total DNA Extraction, Amplification, and Sequencing
Each sample (7 g) was treated with 0.1 mol/L sterile phosphate-buffered saline (PBS) and centrifuged at 300× g for 10 min at 4 °C. The supernatant was then centrifuged again at 4 °C, 13,000× g, for 10 min. An E.Z.N.A. (easy nucleic acid isolation) soil DNA kit (Omega bio-tek, Norcross, GA, USA) was used for isolating DNA, according to the manufacturer’s instructions. The DNA isolated from the six parallel samples was mixed to form one sample to reduce the heterogeneity before amplification and sequencing. The bacterial V3–V4 region of the 16S rRNA gene was amplified using sets F338 and barcode-R806 primers [30]. The fungal ITS2 region was amplified with primers ITS3 and ITS4 [31]. A PCR purification kit was used to purify the PCR products. The barcoded PCR products were sequenced on a MiSeq benchtop sequencer for 250-bp paired-end sequencing (2 × 250 bp; Illumina, San Diego, CA, USA) at Beijing Auwigene Tech. Ltd. (Beijing, China).
The generated raw sequences were processed using QIIME v.1.9.1 and R v.3.3.1, (http://www.r-project.org, accessed on 1 December 2020) [32]. Briefly, the raw sequences were quality-filtered, and sequences with ambiguous bases (‘N’) were removed using Trimmomatic. Chimeric sequences were removed using the Uchime algorithm. The high-quality sequences were clustered (with a 97% sequence similarity threshold) into OTUs using the Qiime Uparse pipeline [33,34,35]. The bacterial OTU sequences were annotated using the Silva database (Release 138 http://www.arb-silva.de, accessed on 1 January 2021) [36]. The fungal OTU sequences were compared using a BLAST search against the UNITE fungal ITS database (Release 8.2 http://unite.ut.ee/index.php, accessed on 1 January 2021). Then, the Chao1 richness and Shannon diversity indices were calculated using Qiime [37].
2.5. Real-Time Quantitative PCR (qPCR) to Estimate Microbial Biomass
The biomass of Streptomyces albus was determined by real-time quantitative PCR (qPCR). We extracted template DNA for a standard curve from the Daqu substate in which 10× serial dilutions of conidial suspensions of Streptomyces albus had been inoculated, as described by Hoffman and Winston [38]. ddH2O was used to dissolve the DNA, and then DNA concentrations were quantified using a NanoDrop ND-1000 spectrophotometer (NanoDrop Technologies, Wilmington, DE, USA). A Real-Time PCR System (Applied Biosystems, Foster City, CA, USA) was used for qPCR analysis. The genomic DNA was used as the template to amplify Streptomyces albus by primers 245F (5′-TCT TCT TCG ACG ACC ACT TCC T-3′) and 551R (5′-CGG CGC ATC TCG ATG TAC TC-3′) [5]. Each reaction was conducted in 20.0 μL which contained 10.0 μL SYBR Green Supermix (SYBR Premix ExTaq II, Takara, Dalian, China), 0.4 μL of each primer (20 μM), 1.0 μL of DNA template, and 8.2 μL ddH2O. The amplification conditions and calibration curves were as follows: initial denaturation at 98 °C for 5 min, followed by 30 cycles of denaturation at 95 °C for 60 s, annealing and extension at 56 °C for 5 s, and increases of 0.5 °C every 5 s from 65 °C to 95 °C for melting curve analysis. The standard curve was established according to the Ct values obtained from the genomic DNA of the serially diluted spores and the logarithm of the corresponding initial spore concentrations.
2.6. Analysis of Volatile Compounds and Geosmin
We added 5 g of the Daqu samples to 20 mL ultrapure water. The samples were treated at 4 °C for 30 min ultrasonically and centrifuged 4000× g for 10 min. After centrifugation, 8 mL of supernatant and 20 μL menthol (internal standard, 100 μg/mL) were added into a 20 mL headspace vial with 3 g NaCl. [4]. Volatile compounds and geosmin were determined by headspace solid-phase microextraction–gas chromatography (HS-SPME-GC-MS) on a DB-Wax column (30 m × 0.25 mm i.d., 0.25 μm film thickness; J&W Scientific, Folsom, CA, USA), as described by Gao et al. [39].
2.7. Physicochemical Parameters Detection and Analysis
We detected the total titratable acidity by titration, as described by Li et al. [40]. Liquefying power and saccharifying power were determined by the method in He et al. [17]. The amount of starch liquefied was regarded as one unit of liquefying power. The amount of glucose released per hour by 1 g of Daqu was defined as the saccharifying power [17]. The esterifying power and fermenting power were determined based on the national professional standard methods. The content of ethyl caproate produced by 50 g of Daqu per 7 days in the mixture of caproic acid and ethanol at 35 °C was regarded as one unit of esterifying power. The amount of CO2 released by 1 g of Daqu per 72 h at 30 °C was regarded as one unit of fermenting power [17]. Each detection was conducted in triplicate and indicated by dry weight.
2.8. Statistical Analysis
The statistical analysis and data plots were performed with OriginPro 2018 (OriginLab, Northampton, MA, USA), Microsoft Office Excel 2016 (Microsoft, Redmond, WA, USA), and Adobe Illustrator CC 22.0 (Adobe Systems Incorporated, San Jose, CA, USA). Principal component analysis (PCA) was analyzed via CANOCO (vision 5). The relationships among microbial communities were calculated based on all possible Spearman’s rank correlations between the abundant genera. To reduce network complexity, only the genera with relatively high abundance (with average abundance of >0.5%) were considered [41]. The correlations were considered valid if they were significant at p < 0.05 (with false discovery rate correction) [42]. The creation and visualization of the network were conducted by Gephi (Web Atlas, Paris, France) [43]. Each genus was represented by a node. A strong and significant correlation between nodes was represented by the edge [44,45].
2.9. Data Availability
All sequences generated were submitted to the NCBI database under the accession number PRJNA691687 and PRJNA886836.
3. Results and Discussion
3.1. Isolation of Geosmin-Inhibiting Microorganisms from Daqu
A total of 50 strains (including 23 bacteria, 22 yeasts, and 5 mold) were isolated from the medium-temperature Daqu. These strains were used for antagonism against Streptomyces albus by modified agar well-diffusion assay [46]. Finally, six strains, including five yeasts and a Bacillus strain, with R inhibition zone/R colony > 1.50 were chosen as the geosmin-inhibiting microorganisms [2]. These six strains were Pichia fermentans Y1B-2, Pichia fermentans Y1A-1, Pichia kudriavzevii MY5-2, Saccharomyces cerevisiae Y8-2, Issatchenkia orientalis Y2A-1, and Bacillus subtilis J7-4. The sketch map of the antibacterial experiment is shown in Figure 1. The R inhibition zone/R colony values of these strains are shown in Table 1.
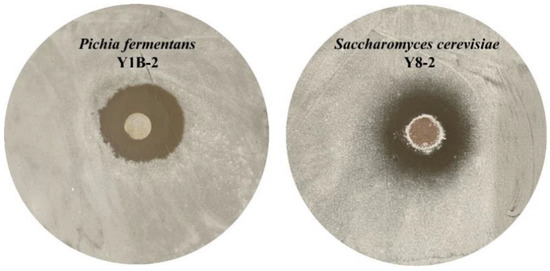
Figure 1.
The sketch map of the antibacterial experiment results.

Table 1.
The R inhibition zone/R colony values of the six strains.
Saccharomyces cerevisiae Y8-2 and Pichia fermentans Y1B-2 had the largest inhibition on the growth of Streptomyces albus, and their R inhibition zone/R colony values reached 2.90 ± 0.06 and 2.82 ± 0.08, respectively. S. cerevisiae is one of the most important species in fermented foods and contributes to the production of alcohols and esters [47]. In winemaking, S. cerevisiae is widely used as a starter culture [48]. Moreover, inoculation with S. cerevisiae has been recommended to enhance flavor complexity and microbial community stability. For example, pomegranate wine fermentation with S. cerevisiae inoculation transformed the negative correlations into positive correlations among the fungal communities [48]. Inoculated S. cerevisiae can suppress wild microflora, determining the starter’s ability to dominate the process [49]. Pichia is a very critical non-Saccharomyces and plays important roles in fermented food fermentation. P. fermentans is one of the most important species of the Pichia genus. A P. fermentans strain isolated from Chinese liquor increased the esters and fatty acids levels in mixed fermentation of wines [50]. Mixed fermentation with P. fermentans and S. cerevisiae enhanced the fruity and floral traits in wine [51]. P. kudriavzevii has an ecological function and can maintain the diversity of the yeast community and antagonize fungal blooms [52,53]. In addition, P. kudriavzevii can also decrease the level of some unsafe compounds, such as ethyl carbamate in Baijiu fermentation [54]. However, there have been few studies reporting use of S. cerevisiae and Pichia for control of Streptomyces-caused food or beverage contamination. Therefore, Daqu microbes have developed an intrinsic community structure during their natural evolution. Native functional microorganisms can efficiently inhibit the growth of Streptomyces albus, indicating that they are effective biocontrol agents to prevent Streptomyces contamination and geosmin production during Daqu fermentation.
3.2. Geosmin and Physicochemical Parameters Analysis during Daqu Fermentation
Figure 2A shows the geosmin contents in the early stage and late stage during Daqu fermentation. Compared to the control group, the inoculation of geosmin-inhibiting microorganisms (test group) significantly (p < 0.05) reduced the geosmin content in Daqu. In the early stage, the geosmin content in the test group was 4.71 ± 0.30 μg/kg, which was significantly (p < 0.05) lower than that in the control group (7.18 ± 0.13 μg/kg), thus being reduced by 34.40%. In the late stage, the geosmin content in the test group was 3.97 ± 0.78 μg/kg, and it was 8.86 ± 1.54 μg/kg in the control group. The geosmin content was thus reduced by 55.20% in the late stage of Daqu fermentation by the inoculation of geosmin-inhibiting microorganisms. These results revealed that these inoculation microorganisms quickly reside in the Daqu and inhibit geosmin production.
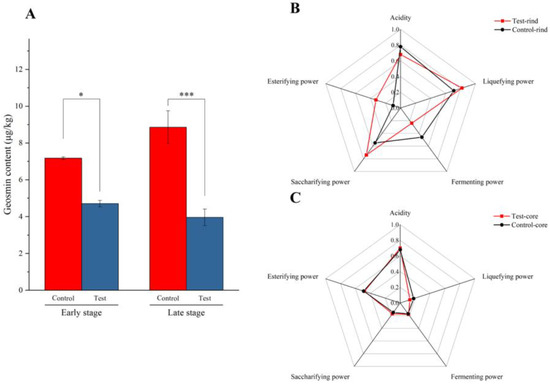
Figure 2.
(A) Geosmin content in the early stage and late stage during Daqu incubation. *, p < 0.05; ***, p < 0.001. (B) The physicochemical characteristics in the rind of the Daqu. (C) The physicochemical characteristics in the core of the Daqu. The red line represents the test group; the black line represents the control group.
The physicochemical parameters of the rind and the core of Daqu are shown in Figure 2B,C and Table S2. In the rind of Daqu, the test group exhibited a higher liquefying power, saccharifying power, and esterifying power than the control group. By inoculation of geosmin-inhibiting microorganisms, the liquefying power increased from 0.71 g starch/g.h to 0.82 g starch/g.h; the saccharifying power increased from 0.55 g glucose/g.h to 0.74 g glucose/g.h; and the esterifying power increased from 0.1 g/50 g·7 d to 0.33 g/50 g·7 d. The liquefying power and saccharifying power in the test group was 13.50% and 25.7% higher than the control group, respectively. However, the fermenting power and acidity were decreased after inoculation of geosmin-inhibiting microorganisms. The fermenting power decreased from 0.46 g/0.5 g·72 h to 0.24 g/0.5 g·72 h, and the acidity decreased from 0.78 mmol/10 g to 0.68 mmol/10 g. In the core of the Daqu, the physicochemical parameters showed no significant differences between the test group and control group. Only the liquefying power decreased from 0.18 g starch/g.h to 0.13 g starch/g.h after the inoculation of geosmin-inhibiting microorganisms.
The enzymes in Daqu have pivotal effects on initiating the ethanol fermentation of Chinese liquor through hydrolyzing macromolecules. A higher liquefying power and saccharifying power in the test group indicated its greater starch hydrolysis capacity. During Daqu fermentation, the abundant microorganisms, such as Bacillus, Lactobacillus, and filamentous fungi, have the ability to secrete starch-degrading enzymes [55]. These results revealed that inoculation with geosmin-inhibiting microorganisms changed the microbial composition in the Daqu.
3.3. Microbial Community Structure and Interaction during Daqu Fermentation
qPCR was applied to detect the dynamics in the Streptomyces albus biomass during Daqu fermentation. Figure 3A shows the total biomass of Streptomyces albus in the early stage and late stage during Daqu fermentation. In the early stage, the biomass of Streptomyces albus was 3.02 ± 0.08 log10 spore count/g in the test group, which was significantly (p < 0.001) lower than that in the control group (5.51 ± 0.48 log10 spore count/g). Streptomyces albus was reduced by 45.20% in the early stage after inoculation with geosmin-inhibiting microorganisms. In the late stage, the biomass of Streptomyces albus in the test group was 3.06 ± 0.39 log10 spore count/g, whereas it was 5.62 ± 0.39 log10 spore count/g in the control group; thus, significantly (p < 0.001) decreased by 45.60%.
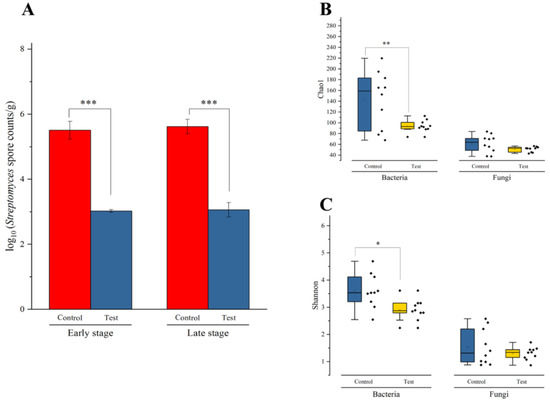
Figure 3.
(A) The biomass of Streptomyces albus during the Daqu incubation process. (B) Chao1 index of microbial communities in the Daqu. Each point represented the Chao1 value. (C) Shannon index of microbial communities in the Daqu. Each point represented the Shannon value. *, p < 0.05; **; p < 0.01; ***, p < 0.001.
High-throughput sequencing was applied to investigate the microbial community structures during Daqu fermentation. A total of 1,065,436 high-quality reads from the V3–V4 region of 16S rRNA gene, and 917,050 high–quality reads from the ITS region were obtained from all 21 samples. For bacteria, we found an average of 50,735 reads per sample, ranging from 17,688 to 93,991 reads; and for fungi, an average of 43,669 reads per sample, ranging from 26,306 to 76,944 reads. The rarefaction curves of the microbial communities reached a saturation plateau, indicating that microbial communities were well represented at the sequencing depth.
Microbial alpha diversity was determined based on the Shannon index and Chao1 index (Tables S3 and S4). Bacterial diversity was significantly higher (p < 0.05) in the control group than that in the test group (Figure 3B,C). Fungal diversity showed no significant difference between two groups (p > 0.05). At the genus level, a total of 135 bacterial genera and 40 fungal genera were identified from all samples (Tables S5 and S6). Only 12 bacterial genera and 7 fungal genera were abundant (with over 1% average abundance).
Principal component analysis (PCA) of the bacterial community was carried out based on weighted UniFrac distances (Figure 4B). The two axes explained 34.36% and 53.87% of the variance in bacterial community differentiation, respectively. Results showed that the bacterial community structure in the test group and the control group of Daqu in the first five days of fermentation were close and differentiated from the other samples. From the 10th day, the bacterial communities of the control group and the test group began to show greater differences. It can be seen that the bacterial community mainly play an important role in the 5 days to the 20 days during Daqu fermentation. Lactobacillus and Weissella were the most abundant (with over 20% average abundance) genera in Daqu. In addition, Staphylococcus, Acetobacter, Pediococcus, Sebaldella, Acinetobacter, Streptomyces, and Pantoea were also abundant (with over 1% but under 20% average abundance) in the Daqu. During fermentation, Lactobacillus and Weissella in the rind and the core of the Daqu were the most abundant at the beginning of fermentation (in the first 3 days of fermentation). After fermenting for 3 days, Lactobacillus decreased in the test group, and was lower in the test group than that in the control group at the end of fermentation. In the rind of Daqu, the relative abundance of Lactobacillus, Staphylococcus, Pediococcus, Acetobacter, Streptomyces, and Bacillus were lower in the test group than those in the control group; whereas the relative abundance of Weissella and Acinetobacter were higher in the test group than those in the control group at the end of fermentation. In the core of the Daqu, the relative abundance of Lactobacillus, Weissella, Streptomyces, Acetobacter, Pediococcus, Sebaldella, Pantoea, Apibacter, Bacillus, and Lactococcus were lower in the test group than those in the control group; whereas the relative abundance of Staphylococcus, Acinetobacter, Brevibacterium and Enterococcus were higher in the test group than those in the control group at the end of fermentation (Figure 4A).
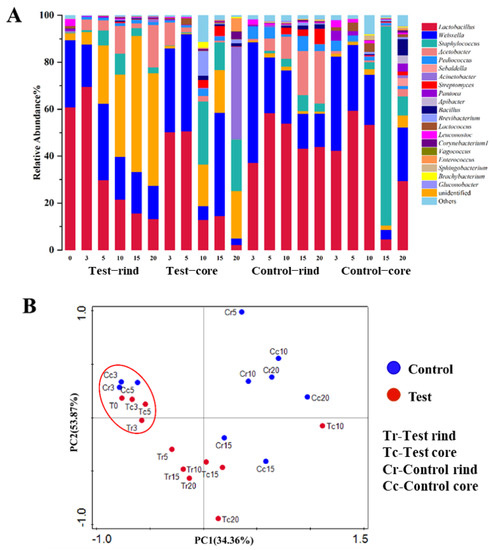
Figure 4.
(A) The relative abundance of the dominant bacterial communities in Daqu at the genus level. (B) Principal component analysis of the bacterial communities based on weighted UniFrac distances. The red circle represents clustered results. Tr represents the rind of the test group; Tc represents the core of test group; Cr represents the rind of the control group; Cc represents the core of the control group.
For fungi, the two axes explained 36.51% and 50.49% of the variance in the fungal community, according to the PCA analysis (Figure 5B). Results showed that the fungal community structure of the core of the Daqu in both the test group and control group in the first five days differentiated from the other samples, and the fungal community showed obvious clustering in the next 15 days. Combined with the relative abundance analysis of Pichia and Saccharomyces, it can be seen that the fungal community plays an important role in the first five days of Daqu incubation. What is more, seven fungal genera were abundant (with over 1% average abundance) in the Daqu samples. Pichia and Thermoascus were the most abundant (with over 25% average abundance) genera in Daqu. Meanwhile, Lichtheimia, Aspergillus, Rhizopus, and Saccharomyces were also abundant (with over 1% but under 20% average abundance) in Daqu. During fermentation, Pichia dominated in the rind of the Daqu and Thermoascus dominated in the core of the Daqu. In the rind of the Daqu, the relative abundance of Pichia and Candida in the test group was lower than in the control group, and the relative abundance of Thermoascus, Lichtheimia, Rhizopus, Saccharomyces, and Aspergillus was higher in the test group than those in the control group at the end of fermentation. In the core of the Daqu, it can be clearly seen that the domination of Pichia was gradually replaced by Thermoascus as the Daqu fermentation proceeded. Pichia decreased and Thermoascus increased both in the test and control group during fermentation. On the 5th day of Daqu fermentation, the relative abundance of Pichia was 81.5% in the test rind of the Daqu, 73.9% in the control rind of the Daqu, 26.7% in the test core of the Daqu, and 19.9% in the control core of the Daqu. The relative abundance of Saccharomyces was 1.4% in the test rind of the Daqu, 0.7% in the control rind of the Daqu, 0.9% in the test core of the Daqu, and 0.4% in the control core of the Daqu (Figure 5A).
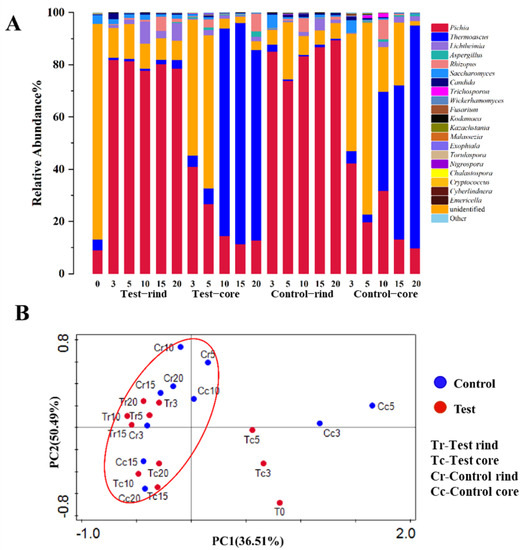
Figure 5.
(A) The relative abundance of the dominant fungal communities in Daqu at the genus level. (B) Principal component analysis of the fungal communities based on weighted UniFrac distances. The red circle represents clustered results. Tr represents the rind of the test group; Tc represents the core of test group; Cr represents the rind of the control group; Cc represents the core of the control group.
To illuminate the effect of inoculation of geosmin-inhibiting microorganisms on microbial interaction during Daqu fermentation, the correlations among the microbes were explored based on Spearman’s rank correlations (|ρ| > 0.5 and p < 0.05). Figure 6A shows the correlation among microorganisms in the control group and Figure 6B shows the correlation among microorganisms in the test group. We put the Streptomyces on the left; the first column to the right of Streptomyces represents microorganisms directly related to Streptomyces, and the second column to the right of Streptomyces represents microorganisms indirectly related to Streptomyces. In the control group, 38 pairs of significant and robust correlations, including 20 pairs of positive correlations and 18 pairs of negative correlations, were identified from 19 genera, with an average degree (AD) of 4.75 (Figure 6A). For the network, the average path length (APL) between the nodes was 2.72 edges, with a network diameter (ND; the longest distance between nodes) of four edges, and an average clustering coefficient of 0.685. In the test group, 38 pairs of significant and robust correlations, including 21 pairs of positive correlations and 17 pairs of negative correlations, were identified from 19 genera, with an average degree (AD) of 4.00 (Figure 6B). For the network, the average path length (APL) between nodes was 2.15 edges, with a network diameter (ND) of four edges, and an average clustering coefficient of 0.609.
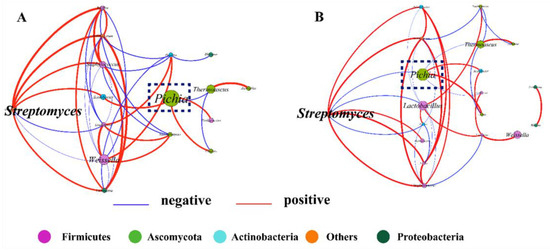
Figure 6.
Relationships among microbial communities in the control group (A) and test group (B). A connection represents a significant (p < 0.05) and strong (Spearman’s |ρ| > 0.6) correlation. The size of each node is in proportion to the relative abundance of each microorganism, and the nodes are colored by phylum (Firmicutes, purple; Ascomycota, green; Actinobacteria, blue; others, orange; Proteobacteria, dark green.). The Spearman’s correlation coefficient (ρ) is in proportion to the thickness of each connection (edge) between two nodes. The color of the edges represents the positive (red) or negative (blue) relationship. The Pichia circled in the box is the main microorganism that inhibits the growth of Streptomyces.
In the test group, the positive interactions between the microbes were significantly enhanced. The correlation between Pichia and Streptomyces changed from the original indirect promotion to a direct inhibition effect. Pichia had a significant negative correlation with Streptomyces after inoculation of geosmin-inhibiting microorganisms. These results revealed that inoculation changed the correlation among microbes. In a complex multi-species fermentation system, microbial communities are shaped and stabilized by the interactions between microorganisms, and these interactions greatly determine the composition, dynamics, and functionality of the microbial community [56]. Therefore, our study demonstrated that a shift in microbial interaction played a pivotal role in inhibiting the growth of Streptomyces and geosmin production after inoculation. This was also found in a previous study where S. cerevisiae inoculation transformed the microbial negative correlations into positive correlations during pomegranate wine fermentation [48]. Therefore, illuminating the microbial interactions is necessary to evaluate the effect of microbial inoculation.
3.4. Volatile Compounds Analysis during Daqu Fermentation
The flavor compounds of the Daqu contribute significantly to the flavor of Chinese liquor [4,17], so it is important to maintain the flavor of the Daqu stable or enhance the volatile compounds by inoculation with geosmin-inhibiting microorganisms. A total of 30 volatile compounds were determined from the Daqu samples, including 8 alcohols, 3 aldehydes, 10 esters, 4 acids, and 5 aromatic compounds (Dataset 2). PLS-DA was performed to analyze the variability in the volatile compounds between the different groups. When two compounds were calculated, the cumulative R2X, R2Y, and Q2 values were 0.666, 0.882, and 0.693, respectively. PLS-DA analysis showed that the volatile compounds in the test group was clearly separated from the control group. Inoculation of geosmin-inhibiting microorganisms changed the volatile compounds in the both the Daqu rind and core. To determine which compounds caused segregation, a VIP score (variable importance for the projection) of >1.0 was used. Fourteen compounds were identified for metabolic differences between the two groups, including 4 alcohols (2-methyl-1-propanol, 1-hexanol, 3-methyl-1-pentanol, and heptanol), 4 esters (hexyl acetate, ethyl-2-hydroxyhexanoate, ethyl acetate, and ethyl-2-methylbutyrate), 1 acid (acetic acid), 2 aldehydes (hexanal and 3-methyl-butanal), and 3 aromatics (butylated hydroxytoluene, ethyl phenylacetate, and phenethyl alcohol), as shown in Figure 7. 1-Hexanol and ethyl acetate showed the largest difference between two groups. Inoculation significantly (p < 0.05) increased the contents of 1-hexanol, from 0.173 ± 0.104 mg/kg to 0.955 ± 0.008 mg/kg, and ethyl acetate, from 0.262 ± 0.013 mg/kg to 1.338 ± 0.139 mg/kg. 1-Hexanol is a very important compound in Chinese liquor. A previous study found that 1-hexanol was strongly and positively correlated with Candida [57]. Ethyl acetate is one of the most abundant esters in Chinese liquor and provides pear-like and banana-like aromas [58]. Ethyl acetate greatly influences the style and quality of the liquor. Previous studies have found that yeasts are the main contributors to ethyl acetate production. For example, co-culture of S. cerevisiae and Wickerhamomyces anomalus produced a higher level of ethyl acetate during liquor fermentation [59]. A higher level of ethyl acetate in the test group may be attributable to the increase in Saccharomyces (Figure 5A).
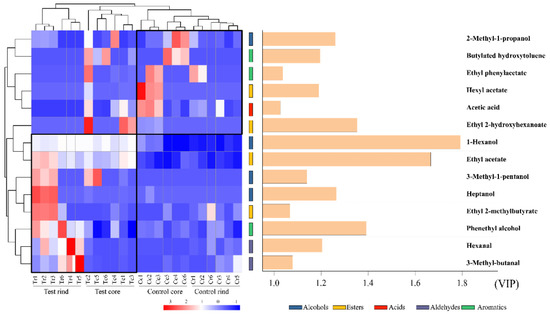
Figure 7.
Heatmap of the differential volatile compounds (VIP > 1.0) between the test group and control group. The color scale represents the scaled abundance of each compound, indicated as the Z-score, with red and blue indicating high and low abundances, respectively. The histogram shows the VIP value.
4. Conclusions
Geosmin contamination has always been a serious problem in freshwater [60,61,62]. However, in recent years, the Chinese liquor industry also has been plagued by geosmin contamination due to its significantly negative effect on the liquor’s flavor and quality [2,4]. A musty off-flavor may arouse psychosomatic effects, such as headaches, stress, or stomach upsets [61,63]. In this study, Streptomyces albus F5A-1 was selected as a model strain to represent the Streptomyces genus, which was the geosmin producer during Chinese liquor production. In turn, a medium-temperature Daqu fermentation system was employed as a model to identify the functional strains that can inhibit the growth of Streptomyces and thus geosmin production. By combining in vitro antibacterial experiments and in situ inoculation, we obtained six native functional strains (yeasts and Bacillus species) as biocontrol agents and achieved the goal of geosmin reduction. In addition, we revealed that microbial interaction significantly affected the growth of Streptomyces and thus production of geosmin. This study highlights the potential of biocontrol for controlling off-flavor chemicals at trace levels in complex fermentation systems, and also provides an effective and eco-friendly strategy for controlling geosmin contamination in medium-temperature Daqu via regulating microbial communities.
Supplementary Materials
The following supporting information can be downloaded at: https://www.mdpi.com/article/10.3390/fermentation8110588/s1, Figure S1: The schematic diagram of the experimental design and Daqu sample collection; Table S1: The geosmin contents in the early stage and the late stage during Daqu incubation; Table S2: The physicochemical parameters in the Daqu; Table S3: Chao1 index values for fungal and bacterial communities in Daqu; Table S4: Shannon index values for fungal and bacterial communities in Daqu; Table S5: Microbial community structure during Daqu fermentation; Table S6: Table sThe contents of volatile compounds between test group and control group.
Author Contributions
Conceptualization, H.D. and J.W.; methodology, X.Z.; software, J.W.; validation, H.D., X.Z. and J.W.; formal analysis, H.D.; investigation, H.D. and Y.X.; resources, H.D. and Y.X.; data curation, H.D.; writing—original draft preparation, H.D. and J.W.; writing—review and editing, J.W.; visualization, J.W.; supervision, H.D. and Y.X.; project administration, Y.X.; funding acquisition, Y.X. All authors have read and agreed to the published version of the manuscript.
Funding
This work was supported by the National Natural Science Foundation of China (NSFC) (grant 32172176) and Natural Science Foundation of Jiangsu Province of China (grant BK20201341).
Institutional Review Board Statement
Not applicable.
Informed Consent Statement
Not applicable.
Data Availability Statement
Data is presented in the manuscript.
Conflicts of Interest
We declare that we have no known competing financial interest or personal relationships that could have appeared to influence the work reported in this paper.
References
- Du, H.; Xu, Y. Determination of the microbial origin of geosmin in Chinese liquor. J. Agric. Food Chem. 2012, 60, 2288–2292. [Google Scholar] [CrossRef] [PubMed]
- Zhi, Y.; Wu, Q.; Du, H.; Xu, Y. Biocontrol of geosmin-producing Streptomyces spp. by two Bacillus strains from Chinese liquor. Int. J. Food Microbiol. 2016, 231, 1–9. [Google Scholar] [CrossRef] [PubMed]
- Gerber, N.N.; Lechevalier, H.A. Geosmin, an earthly-smelling substance isolated from actinomycetes. Appl. Microbiol. 1965, 13, 935–938. [Google Scholar] [CrossRef]
- Du, H.; Fan, W.; Xu, Y. Characterization of geosmin as source of earthy odor in different aroma type Chinese liquors. J. Agric. Food Chem. 2011, 59, 8331–8337. [Google Scholar] [CrossRef] [PubMed]
- Du, H.; Lu, H.; Xu, Y.; Du, X. Community of environmental Streptomyces related to geosmin development in Chinese liquors. J. Agric. Food Chem. 2013, 61, 1343–1348. [Google Scholar] [CrossRef]
- McCrummen, S.T.; Wang, Y.F.; Hanson, T.R.; Bott, L.; Liu, S.Y. Culture environment and the odorous volatile compounds present in pond-raised channel catfish (Ictalurus punctatus). Aquacult. Int. 2018, 26, 685–694. [Google Scholar] [CrossRef]
- Saadoun, I.M.K.; Schrader, K.K.; Blevins, W.T. Environmental and nutritional factors affecting geosmin synthesis by Anabaena sp. Water Res. 2001, 35, 1209–1218. [Google Scholar] [CrossRef]
- Juttner, F.; Watson, S.B. Biochemical and ecological control of geosmin and 2-methylisoborneol in source waters. Appl. Environ. Microbiol. 2007, 73, 4395–4406. [Google Scholar] [CrossRef]
- la Guerche, S.; de Senneville, L.; Blancard, D.; Darriet, P. Impact of the Botrytis cinerea strain and metabolism on (-)-geosmin production by Penicillium expansum in grape juice. Anton. Leeuw. Int. J. G. 2007, 92, 331–341. [Google Scholar] [CrossRef]
- Morales-Valle, H.; Silva, L.C.; Oliveira, J.M.; Venancio, A.; Lima, N. Microextraction and gas chromatography/mass spectrometry for improved analysis of geosmin and other fungal “off” volatiles in grape juice. J. Microbiol. Meth. 2010, 83, 48–52. [Google Scholar] [CrossRef]
- Omur-Ozbek, P.; Little, J.C.; Dietrich, A.M. Ability of humans to smell geosmin, 2-MIB and nonadienal in indoor air when using contaminated drinking water. Water Sci. Technol. 2007, 55, 249–256. [Google Scholar] [CrossRef] [PubMed]
- Liato, V.; Aider, M. Geosmin as a source of the earthy-musty smell in fruits, vegetables and water: Origins, impact on foods and water, and review of the removing techniques. Chemosphere 2017, 181, 9–18. [Google Scholar] [CrossRef]
- Du, H.; Lu, H.; Xu, Y. Influence of geosmin-producing Streptomyces on the growth and volatile metabolites of yeasts during Chinese liquor fermentation. J. Agric. Food Chem. 2015, 63, 290–296. [Google Scholar] [CrossRef] [PubMed]
- Jin, G.Y.; Zhu, Y.; Xu, Y. Mystery behind Chinese liquor fermentation. Trends Food Sci. Technol. 2017, 63, 18–28. [Google Scholar] [CrossRef]
- Song, J.; Tang, H.; Liang, H.; Luo, L.; Lin, W. Effect of bioaugmentation on biochemical characterisation and microbial communities in Daqu using Bacillus, Saccharomycopsis and Absidia. Int. J. Food Sci. Technol. 2019, 54, 2639–2651. [Google Scholar] [CrossRef]
- Du, H.; Wang, X.; Zhang, Y.; Xu, Y. Exploring the impacts of raw materials and environments on the microbiota in Chinese Daqu starter. Int. J. Food Microbiol. 2019, 297, 32–40. [Google Scholar] [CrossRef]
- He, G.; Dong, Y.; Huang, J.; Wang, X.; Zhang, S.; Wu, C.; Jin, Y.; Zhou, R. Alteration of microbial community for improving flavor character of Daqu by inoculation with Bacillus velezensis and Bacillus subtilis. LWT-Food Sci. 2019, 111, 1–8. [Google Scholar] [CrossRef]
- Zoschke, K.; Engel, C.; Boernick, H.; Worch, E. Adsorption of geosmin and 2-methylisoborneol onto powdered activated carbon at non-equilibrium conditions: Influence of NOM and process modelling. Water Res. 2011, 45, 4544–4550. [Google Scholar] [CrossRef]
- Lin, T.F.; Chang, D.W.; Lien, S.K.; Tseng, Y.S.; Chiu, Y.T.; Wang, Y.S. Effect of chlorination on the cell integrity of two noxious cyanobacteria and their releases of odorants. J. Water Supply Res. T. 2009, 58, 539–551. [Google Scholar] [CrossRef]
- Worley, J.L.; Dietrich, A.M.; Hoehn, R.C. Dechlorination techniques to improve sensory odor testing of geosmin and 2-MIB. J. AM. Water Works Ass. 2003, 95, 109–117. [Google Scholar] [CrossRef]
- Liu, S.; Tang, L.; Wu, M.; Fu, H.; Xu, J.; Chen, W.; Ma, F. Parameters influencing elimination of geosmin and 2-methylisoborneol by K2FeO4. Sep. Purif. Technol. 2017, 182, 128–133. [Google Scholar] [CrossRef]
- Behr, M.; Cocco, E.; Lenouvel, A.; Guignard, C.; Evers, D. Earthy and fresh mushroom off-flavors in wine: Optimized remedial treatments. Am. J. Enol. Viticult. 2013, 64, 545–549. [Google Scholar] [CrossRef]
- Fiori, S.; Urgeghe, P.P.; Hammami, W.; Razzu, S.; Jaoua, S.; Migheli, Q. Biocontrol activity of four non- and low-fermenting yeast strains against Aspergillus carbonarius and their ability to remove ochratoxin A from grape juice. Int. J. Food Microbiol. 2014, 189, 45–50. [Google Scholar] [CrossRef] [PubMed]
- Kong, Q.; Shan, S.H.; Liu, Q.Z.; Wang, X.D.; Yu, F.T. Biocontrol of Aspergillus flavus on peanut kernels by use of a strain of marine Bacillus megaterium. Int. J. Food Microbiol. 2010, 139, 31–35. [Google Scholar] [CrossRef] [PubMed]
- Branco, P.; Sabir, F.; Diniz, M.; Carvalho, L.; Albergaria, H.; Prista, C. Biocontrol of Brettanomyces/Dekkera bruxellensis in alcoholic fermentations using saccharomycin-overproducing Saccharomyces cerevisiae strains. Appl. Microbiol. Biot. 2019, 103, 3073–3083. [Google Scholar] [CrossRef] [PubMed]
- Wang, X.; Du, H.; Zhang, Y.; Xu, Y. Environmental microbiota drives microbial succession and metabolic profiles during Chinese liquor fermentation. Appl. Environ. Microbiol. 2018, 84, e02369-17. [Google Scholar] [CrossRef]
- White, T.J.; Bruns, T.; Lee, S.; Taylor, J. Amplification and direct sequencing of fungal ribosomal RNA genes for phylogenetics. PCR Protoc. A Guide Methods Appl. 1990, 18, 315–322. [Google Scholar]
- Rochelle, P.A.; Fry, J.C.; John Parkes, R.; Weightman, A.J. DNA extraction for 16S rRNA gene analysis to determine genetic diversity in deep sediment communities. FEMS Microbiol. Lett. 1992, 100, 59–65. [Google Scholar] [CrossRef]
- Yang, X.; Jiao, R.; Zhu, X.; Zhao, S.; Liao, G.; Yu, J.; Wang, D. Profiling and characterization of odorous volatile compounds from the industrial fermentation of erythromycin. Environ. Pollut. 2019, 255, 113130. [Google Scholar] [CrossRef]
- Soergel, D.A.; Dey, N.; Knight, R.; Brenner, S.E. Selection of primers for optimal taxonomic classification of environmental 16S rRNA gene sequences. ISME J. 2012, 6, 1440–1444. [Google Scholar] [CrossRef]
- Toju, H.; Tanabe, A.S.; Yamamoto, S.; Sato, H. High-coverage ITS primers for the DNA-based identification of Ascomycetes and Basidiomycetes in Environmental Samples. PLoS ONE 2012, 7, e40863. [Google Scholar] [CrossRef] [PubMed]
- Caporaso, J.G.; Kuczynski, J.; Stombaugh, J.; Bittinger, K.; Bushman, F.D.; Costello, E.K.; Fierer, N.; Pena, A.G.; Goodrich, J.K.; Gordon, J.I. QIIME allows analysis of high-throughput community sequencing data. Nat. Methods 2010, 7, 335–336. [Google Scholar] [CrossRef] [PubMed]
- Edgar, R.C. Search and clustering orders of magnitude faster than BLAST. Bioinformatics 2010, 26, 2460–2461. [Google Scholar] [CrossRef] [PubMed]
- Liu, Z.; Lozupone, C.; Hamady, M.; Bushman, F.D.; Knight, R. Short pyrosequencing reads suffice for accurate microbial community analysis. Nucleic Acids Res. 2007, 35, e120. [Google Scholar] [CrossRef]
- Bolger, A.M.; Lohse, M.; Usadel, B. Trimmomatic: A flexible trimmer for Illumina sequence data. Bioinformatics 2014, 30, 2114–2120. [Google Scholar] [CrossRef]
- Johnston, D.; Earley, B.; Cormican, P.; Murray, G.; Kenny, D.A.; Waters, S.M.; McGee, M.; Kelly, A.K.; McCabe, M.S. Illumina MiSeq 16S amplicon sequence analysis of bovine respiratory disease associated bacteria in lung and mediastinal lymph node tissue. BMC Vet. Res. 2017, 13, 118. [Google Scholar] [CrossRef]
- Ji, M.; Du, H.; Xu, Y. Structural and metabolic performance of p-cresol producing microbiota in different carbon sources. Food Res. Int. 2020, 132, 109049. [Google Scholar] [CrossRef]
- Hoffman, C.S.; Winston, F. A ten-minute DNA preparation from yeast efficiently releases autonomous plasmids for transformation of Escherichia coli. Gene 1987, 57, 267–272. [Google Scholar] [CrossRef]
- Gao, W.J.; Fan, W.L.; Xu, Y. Characterization of the key odorants in light aroma type Chinese liquor by gas chromatography-olfactometry, quantitative measurements, aroma recombination, and omission studies. J. Agric. Food. Chem. 2014, 62, 5796–5804. [Google Scholar] [CrossRef]
- Li, P.; Lin, W.; Liu, X.; Wang, X.; Luo, L. Environmental factors affecting microbiota dynamics during traditional solid-state fermentation of Chinese Daqu starter. Front. Microbiol. 2016, 7, 1237. [Google Scholar] [CrossRef]
- Barberan, A.; Bates, S.T.; Casamayor, E.O.; Fierer, N. Using network analysis to explore co-occurrence patterns in soil microbial communities. ISME J. 2012, 6, 343–351. [Google Scholar] [CrossRef] [PubMed]
- Zhang, H.; Wang, L.; Wang, H.; Yang, F.; Chen, L.; Hao, F.; Lv, X.; Du, H.; Xu, Y. Effects of initial temperature on microbial community succession rate and volatile flavors during Baijiu fermentation process. Food Res. Int. 2020, 141, 109887. [Google Scholar] [CrossRef] [PubMed]
- Bastian, M.; Heymann, S.; Jacomy, M. Gephi: An open source software for exploring and manipulating networks. ICWSM 2009, 8, 361–362. [Google Scholar]
- Wang, X.; Du, H.; Xu, Y. Source tracking of prokaryotic communities in fermented grain of Chinese strong-flavor liquor. Int. J. Food Microbiol. 2017, 244, 27–35. [Google Scholar] [CrossRef]
- Wei, J.; Du, H.; Zhang, H.; Nie, Y.; Xu, Y. Mannitol and erythritol reduce the ethanol yield during Chinese Baijiu production. Int. J. Food Microbiol. 2020, 337, 108933. [Google Scholar] [CrossRef]
- Dimkic, I.; Zivkovic, S.; Beric, T.; Ivanovic, Z.; Gavrilovic, V.; Stankovic, S.; Fira, D. Characterization and evaluation of two Bacillus strains, SS-12.6 and SS-13.1, as potential agents for the control of phytopathogenic bacteria and fungi. Biol. Control 2013, 65, 312–321. [Google Scholar] [CrossRef]
- Wu, Q.; Chen, L.; Xu, Y. Yeast community associated with the solid state fermentation of traditional Chinese Maotai-flavor liquor. Int. J. Food Microbiol. 2013, 166, 323–330. [Google Scholar] [CrossRef]
- Wang, X.S.; Ren, X.D.; Shao, Q.Q.; Peng, X.; Zou, W.J.; Sun, Z.G.; Zhang, L.H.; Li, H.H. Transformation of microbial negative correlations into positive correlations by Saccharomyces cerevisiae inoculation during pomegranate wine fermentation. Appl. Environ. Microbiol. 2020, 86, 12. [Google Scholar] [CrossRef]
- Liu, W.; Li, H.; Jiang, D.; Zhang, Y.; Zhang, S.; Sun, S. Effect of Saccharomyces cerevisiae, Torulaspora delbrueckii and malolactic fermentation on fermentation kinetics and sensory property of black raspberry wines. Food Microbiol. 2020, 91, 103551. [Google Scholar] [CrossRef]
- Kong, C.L.; Li, A.H.; Su, J.; Wang, X.C.; Chen, C.Q.; Tao, Y.S. Flavor modification of dry red wine from Chinese spine grape by mixed fermentation with Pichia fermentans and S. cerevisiae. LWT-Food Sci. Technol. 2019, 109, 83–92. [Google Scholar] [CrossRef]
- Ma, D.; Yan, X.; Wang, Q.; Zhang, Y.; Tao, Y. Performance of selected P. fermentans and its excellular enzyme in co-inoculation with S. cerevisiae for wine aroma enhancement. LWT-Food Sci. Technol. 2017, 86, 361–370. [Google Scholar] [CrossRef]
- Zhang, H.; Du, H.; Xu, Y. Volatile organic compounds mediated antifungal activity of Pichia and its effect on the metabolic profiles of fermentation communities. Appl. Environ. Microbiol. 2021, 87, e02992-20. [Google Scholar] [CrossRef] [PubMed]
- Zhang, H.; Wang, L.; Tan, Y.; Wang, H.; Yang, F.; Chen, L.; Hao, F.; Lv, X.; Du, H.; Xu, Y. Effect of Pichia on shaping the fermentation microbial community of sauce-flavor Baijiu. Int J Food Microbiol. 2021, 336, 108898. [Google Scholar] [CrossRef] [PubMed]
- Du, H.; Song, Z.W.; Xu, Y. Ethyl carbamate formation regulated by lactic acid bacteria and nonconventional yeasts in solid-state fermentation of Chinese Moutai-flavor liquor. J. Agric. Food Chem. 2018, 66, 387–392. [Google Scholar] [CrossRef] [PubMed]
- Shi, W.; Chai, L.J.; Fang, G.Y.; Mei, J.L.; Lu, Z.M.; Zhang, X.J.; Xiao, C.; Wang, S.T.; Shen, C.H.; Shi, J.S.; et al. Spatial heterogeneity of the microbiome and metabolome profiles of high-temperature Daqu in the same workshop. Food Res. Int. 2022, 156, 111298. [Google Scholar] [CrossRef]
- Lino, F.S.D.; Bajic, D.; Vila, J.C.C.; Sanchez, A.; Sommer, M.O.A. Complex yeast-bacteria interactions affect the yield of industrial ethanol fermentation. Nat. Commun. 2021, 12, 1498. [Google Scholar] [CrossRef]
- He, G.; Huang, J.; Zhou, R.; Wu, C.; Jin, Y. Effect of fortified Daqu on the microbial community and flavor in Chinese strong-flavor liquor brewing process. Front. Microbiol. 2019, 10, 56. [Google Scholar] [CrossRef]
- Fan, W.; Shen, H.; Xu, Y. Quantification of volatile compounds in Chinese soy sauce aroma type liquor by stir bar sorptive extraction and gas chromatography-mass spectrometry. J. Sci. Food Agric. 2011, 91, 1187–1198. [Google Scholar] [CrossRef]
- Fan, G.; Teng, C.; Xu, D.; Fu, Z.; Minhazul, K.; Wu, Q.; Liu, P.; Yang, R.; Li, X. Enhanced production of ethyl acetate using co-culture of Wickerhamomyces anomalus and Saccharomyces cerevisiae. J. Biosci. Bioeng. 2019, 128, 564–570. [Google Scholar] [CrossRef]
- Youn, S.J.; Kim, H.N.; Yu, S.J.; Byeon, M.S. Cyanobacterial occurrence and geosmin dynamics in Paldang Lake watershed, South Korea. Water Environ. J. 2020, 34, 634–643. [Google Scholar] [CrossRef]
- Xue, Q.; Shimizu, K.; Sakharkar, M.K.; Utsumi, M.; Cao, G.; Li, M.; Zhang, Z.; Sugiura, N. Geosmin degradation by seasonal biofilm from a biological treatment facility. Environ. Sci. Pollut. R. 2012, 19, 700–707. [Google Scholar] [CrossRef] [PubMed]
- Zhang, J.; Zhang, H.; Li, L.; Wang, Q.; Yu, J.; Chen, Y. Microbial community analysis and correlation with 2-methylisoborneol occurrence in landscape lakes of Beijing. Environ. Res. 2020, 183, 109217. [Google Scholar] [CrossRef] [PubMed]
- Young, W.F.; Horth, H.; Crane, R.; Ogden, T.; Arnott, M. Taste and odour threshold concentrations of potential potable water contaminants. Water Res. 1996, 30, 331–340. [Google Scholar] [CrossRef]


Publisher’s Note: MDPI stays neutral with regard to jurisdictional claims in published maps and institutional affiliations. |
© 2022 by the authors. Licensee MDPI, Basel, Switzerland. This article is an open access article distributed under the terms and conditions of the Creative Commons Attribution (CC BY) license (https://creativecommons.org/licenses/by/4.0/).