Article

Functional Properties of an Oat-Based Postbiotic Aimed at a Potential Cosmetic Formulation

by
Giulia Lentini
1,†,
Federica Nigro
2,†,
Rosa Colucci Cante
1,3,
Francesca Passannanti
1,2,
Marianna Gallo
1,2,3,
Andrea Luigi Budelli
4 and
Roberto Nigro
1,*
1
Department of Chemical Engineering, Materials, and Industrial Production, University of Naples Federico II, P. Tecchio, 80, 80125 Naples, Italy
2
I.T.P. Innovation and Technology Provider S.r.l., Via Bisignano a Chiaia, 68, 80121 Naples, Italy
3
Department of Industrial Engineering, University of Niccolò Cusano, Via Don Carlo Gnocchi, 3, 00166 Rome, Italy
4
Heinz Innovation Center, Nieuwe Dukenburgseweg 19, 6534 AD Nijmegen Postbus 57, NL-6500 AB Nijmegen, The Netherlands
*
Author to whom correspondence should be addressed.
These authors contributed equally to this work.
Fermentation 2022, 8(11), 632; https://doi.org/10.3390/fermentation8110632
Submission received: 7 October 2022 / Revised: 4 November 2022 / Accepted: 10 November 2022 / Published: 12 November 2022
(This article belongs to the Special Issue Fermentation in Cosmetics)

Abstract

:
The concept of postbiotic has been attracting the attention of the scientific community and several industrial realities to develop new claims and new market segments for functional fermented products. The aim of this work was to develop a process to produce an oat-based postbiotic ingredient to be used in personal care cosmetic formulations. A hydrolyzed oatmeal suspension was fermented using Lacticaseibacillus paracasei CBA L74 as starter culture, at 37 °C for 48 h by controlling the pH; then the bacterial charge was inactivated by a mild thermal treatment at 80 °C for 30 s, obtaining a postbiotic. The effect of different process steps, hydrolysis, sterilization, fermentation, and inactivation phases, on lactic acid concentration, total polyphenolic content, antioxidant activity, tyrosinase inhibition activity and Sun Protection Factor value was investigated, demonstrating the potential cosmetic applications. The maximum bacterial growth and lactic acid production were achieved after 24 h of process, with a cell density and a lactic acid concentration of 3.05 × 10⁹ CFU/mL and 8.60 g/L, respectively. The total phenolic content and the antioxidant activity reached their maximum values (2.5 mgGAE/mL, EC50 = 2.2 mg/mL and 1.38 × 10⁻² mmol Fe2+/g and 7.3 × 10⁻³ mmol TE/g, respectively) after the sterilization treatment; the maximum tyrosinase inhibition of 50.6%, corresponding to a sample concentration of 16 mg/mL, was found after 24 h of fermentation process. Fermentation did not show an impact on UV shielding ability and the SPF value decreased during the process.

1. Introduction

Skin aging is a biological process characterized by a progressive reduction of the normal functions of the skin, in particular its reparative capacity and a greater susceptibility to diseases and harmful environmental stimuli [1]. Cosmeceutical’s concept is going to become relevant. It is based on the addition of a biologically active ingredient to the cosmetic formulation, able to reduce the damage due to skin aging both chronic and caused by UV radiation [1]. One of the processes used for the development of functional ingredients is fermentation. During this process, the microorganisms break down complex substances contained in the fermenting substrate, producing the energy needed to grow and multiply. In recent years, many studies are focusing on the use of food matrices as natural substrates to be fermented. Foods are natural sources of proteins, lipids, carbohydrates, vitamins, minerals, water, etc., and can acquire higher added value through fermentation [2]. Probiotic bacterial fermentation improves the therapeutic and cosmetic values of natural active ingredients [3], promoting their skin-healthy enhancing effect through the rebalancing of the skin microbiota.
Moreover, during the fermentation process, bioactive compounds widely used in cosmetic are produced, such as small peptides and antimicrobial molecules [4,5].
Skin microbiota consists of resident microbes in the healthy skin which play an essential role in stabilizing the skin barrier function by interacting with the immune cells and secreting antimicrobial agents to fight the pathogens [6].
Probiotics are defined as “live microorganisms (usually bacteria) that administered in adequate quantities confer a health benefit of the guest” [7]; they influence not only the gut microbiome when orally dispensed but can also preserve and restore the skin microbiota through topical use.
However, the application of live bacteria on skin poses several challenges [8].
In recent years, the concept of postbiotic is gaining an increasing interest from both the scientific and industrial worlds. Postbiotic refers to “a preparation of inanimate (non-viable) microorganisms and/or their components that confers a health benefit on the host. Effective postbiotics must contain inactivated microbial cells or cell components, with or without metabolites, that contribute to observed health benefits” [9].
Nowadays, postbiotics are facing an increasing use in food applications, mainly as functional ingredients since they have anti-inflammatory, immunomodulatory, antiproliferative, and antioxidant properties [10]. Postbiotic can be used in healthy individuals to improve their overall health but also in critically ill patients with high pathological vulnerability, young children, and premature neonates to relieve symptoms [11,12,13,14].
Recent studies suggest that some postbiotics can scavenge free radicals to reduce skin damage [15,16,17]; furthermore, they can naturally balance the skin microbiota [18]. Considering all these properties, postbiotic potentialities in the cosmetic field are evident.
Moreover, the use of postbiotics in cosmetics has great potential due to their greater safety and stability in comparison with probiotic products. The presence of “dead bacteria” makes the product more stable over time, bringing certain benefits in terms of storage and shelf-life both to the consumer and the companies that invest in the development of these semi-finished products.
One of the food matrices widely used in cosmetic formulations is oat, due to its high antioxidant, anti-inflammatory, anti-allergenic, and anti-carcinogenic capacity [19,20].
Oat contains some of the most important active ingredients used in the cosmetics field, such as β-glucan, phenolic acid derivatives, cinnamic acids derived from the class aldehydes, tocopherol, and vitamin E [21,22]; moreover, an increase in lactic acid content determined by a lactic fermentation process can guarantee all the typical properties associated to the topical application of lactic acid: it is effective for depigmentation and improving the surface roughness and mild wrinkling of the skin caused by environmental photo-damage [23].
In this work, the cosmetic potential of an oat-based postbiotic produced by a lactic acid fermentation process was studied. The microorganism used as starter culture for fermentation process was Lacticaseibacillus paracasei CBA L74. Its probiotic nature, confirmed by in vitro and ex vivo studies reported by Zagato et al. [24] on its anti-inflammatory effect and protective activity against colitis, and its ability to ferment cereal, fruit, and legume-based matrices were already studied in several works [25,26,27,28,29,30,31,32,33].
The fermentation process was carried out on a hydrolyzed oatmeal suspension under controlled conditions of temperature and pH, previously identified as optimal for LP’s growth and its metabolic activity [34,35], and a subsequent mild heat treatment was performed to achieve the microbial inactivation. The effect of each single process step on selected functional properties of interest, as lactic acid concentration, total polyphenol content, antioxidant activity, anti-tyrosinase activity, and photoprotection activity (Sun Protection Factor, SPF, estimation) was investigated to confirm the potential of the resulting oat-based postbiotic.

2. Materials and Methods

2.1. Strain and Feedstock

Lacticaseibacillus paracasei (LP) CBA L74, patented and provided by Heinz Italia S.p.A, was used as the starter culture for the fermentation trials. It was stored at −80 °C in cryovials with glycerol (20%) and reactivated through incubation at 37 °C for 24 h in 9 mL of an animal free broth (20 g/L Bacto Yeast Extract, BD Biosciences, Milan, Italy; 0.5 g/L MgSO4, Sigma-Aldrich, Milan, Italy; 50 g/L Glucose, Sigma-Aldrich, Milan, Italy; 0.5 g/L citric acid, Sigma-Aldrich, Milan, Italy) before inoculation. The cell density in the inoculum broth was 108 CFU/mL. Whole oatmeal (Le Farine Magiche, Lo Conte Group) was purchased from a local store in Naples, Italy.
Mushroom tyrosinase enzyme (8503 units/mg), L-tyrosine, kojic acid, 2,2-diphenyl-1-picrylhydrazyL (DPPH), 6-di(tert-butyl-1-d1)-4-methyl-d3-phenol-3,5-d2 (BHT), 6-hydroxy-2,5,7,8-tetramethylchroman-2-carboxylic acid (TROLOX), were supplied by Sigma Aldrich, Milan, Italy.

2.2. Experimental Apparatus

Fermentation tests were carried out using the experimental laboratory apparatus described by Gallo et al. [35]. The system consisted of a batch reactor (20 cm high, 10 cm ID, 1.5 L) equipped with an external jacket for the circulation of a service fluid coming from a thermostatically controlled water bath. The mixing system consisted of a stainless-steel rotating shaft mounted on the head plate and equipped with three Rushton turbines. It was connected to a motor that allowed the adjustments of the stirring speed. A silicone gasket placed on the edge of the vessel and a metal ring around the head plate ensured hermetic sealing of the reactor.
The head plate was equipped with an input for the insertion of the In Pro 3100 probe (Mettler Toledo, Milan, Italy), connected to the M300 transmitter (Mettler Toledo, Milan, Italy), which is useful for inline temperature/pH measurements, and an input connected to a tank containing a 4 M NaOH solution, fed by a peristaltic pump used for controlling pH.

2.3. Fermentation Protocol

Fermentation tests were carried out according to the protocols reported by Gallo et al. [30,35] with some modifications. Briefly, 1 L of an oatmeal aqueous suspension (15% w/v) with 1% w/v of added glucose was fermented; before loading the reactor, an enzymatic pre-treatment of the oat suspension using amylase (0.036% w/v) was carried out to prevent starch gelling during the following sterilization treatment and to guarantee an efficient mixing and homogeneity of the suspension during the fermentation. Furthermore, the amylase treatment allowed to process a higher amount of flour than that would be possible to ferment in absence of the enzymatic hydrolysis step, without affecting the mixing and sterilization performances, as reported by Gallo et al. [30].
Preliminary tests allowed to find the optimal sterilization conditions to be set in autoclave (134 °C for 40 min) to perform the sterilization phase, before beginning the fermentation process. After the thermal treatment, the system was cooled down to 37 °C and the strain was inoculated (1% v/v).
Fermentation tests were performed with pH control (set at 6.2 value) for 48 h at 37 °C.
Fermented oatmeal samples were withdrawn aseptically from the reactor at specific times (after the inoculum [t0] and after 2 h [t2], 4 h [t4], 6 h [t6], 8 h [t8], 14 h [t14], 16 h [t16], 18 h [t18], 20 h [t20], 22 h [t22], 24 h [t24], and 48 h [t48] of fermentation) for bacterial count and organic acid determination. After 48 h of process, the fermented suspension was thermally treated in the bioreactor at 80 °C for 30 s, to inactivate the bacterial charge and obtain the final postbiotic. After the thermal treatment, bacterial count was measured again to check that a complete microbial deactivation was occurred.
The entire experimental design is shown in Figure 1.
Oat samples collected after the hydrolysis step (Hydrolysed Oatmeal, in the following named as HO), after the inoculum at the beginning of fermentation (FO0), after 24 h and 48 h of fermentation (FO24 and FO48, respectively), and after the thermal inactivation (Postbiotic, P), were freeze-dried in a benchtop freeze dryer (Alpha 1-2 LDplus, Christ Osterode am Harz, Germany)and stored for further analysis.
In Table 1, nomenclature, and description of all the samples investigated are summarized.

2.4. Analytical Methods

2.4.1. Bacterial Count, Lactic Acid, and Secondary Metabolite Determination

Bacterial count was measured by serial dilutions and the spread plate method [36] on Petri plates filled with De Man, Rogosa, and Sharpe (MRS) agar (Oxoid, Basingstoke, UK). MacConkey agar (Oxoid, Basingstoke, UK) and Gelatin Peptone Bios Agar (Biolife, Milan, Italy) were used to control the presence of microbial contaminants in the fermenting medium. All plates were incubated at 37 °C for 48 h before reading. Anaerobic kits (Anaerogen Compact, Oxoid, Basingstoke, UK) were used for MRS plates to guarantee anaerobic growth conditions for LP CBA L74 during the incubation period. The count of bacteria measured was expressed in log(CFU/g), where CFU is the colony forming units.
The concentration of lactic acid was determined by high performance liquid chromatography (HPLC), Agilent 1100 series (Agilent Technologies, Milan, Italy), equipped with an Agilent Synergi Hydro-RP C18 column (250 mm × 4.6 mm and a pore size of 4 μm) with a visible/UV detector. Mobile phase consisted of 0.27% KH2PO4 aqueous solution at a pH of 2 modified with H3PO4 (eluent A) and 100% methanol (eluent B), using a gradient consisting of 30% B in 2.6 min followed by 100% A in 2.9 min with a flow rate of 1 mL/min. The detection was set at 218 nm [37].
Secondary metabolites, as acetic, propionic, and butyric acids, were measured by gas chromatography, (GC), Agilent technologies 6890, using a capillary Poraplot Q column (25 mm × 0.32 mm). The mobile phase was helium gas with a flow rate of 200 mL/min [35].

2.4.2. Total Polyphenol Content (TPC) and Antioxidant Activity (AA) Determinations

Extract Preparation

Extraction was performed on raw oatmeal, hydrolyzed oatmeal, and fermented samples (RO, HO, FO0, FO24, FO48, and P) using an ethanol solution (70% w/v) as solvent [38,39]. Briefly, 0.5 g of samples were weighed and extracted with 7 mL of ethanol solution through sonication for 15 min. After centrifugation at 2000 rpm for 15 min, supernatant was recovered, the sedimented pellet was redissolved, and the same extraction procedure was repeated for three times.
The supernatants were combined, and the resulting extracts were used for evaluating.

Measurement of Total Polyphenol Content (TPC)

TPC in RO, HO, FO0, FO24, FO48, and P extracts was determined by Folin–Ciocalteu reagent assay [38,39].
About 1 mL of extract was mixed with 0.3 mL of Folin–Ciocalteu reagent and 1 mL of Na2CO3 (7.5% w/v), and a final volume of 10 mL was reached with deionized water. After 2 h in the dark, absorbance was read at 720 nm using a spectrophotometer and deionized water was used as blank. Total phenolic amount was expressed as milligrams of gallic acid equivalent (GAE) through a calibration curve, previously prepared using gallic acid as standard.

Evaluation of the Antioxidant Activity (AA)

Antioxidant activity of RO, HO, FO0, FO24, FO48, and P extracts was evaluated using two analytical methods: DPPH (2,2-diphenyl-1-picrylhydrazyl) scavenging activity assay and FRAP (ferric reducing antioxidant power) assay, according to the procedures reported by Brand-Williams et al. [40] and Benzie and Devaki [41], respectively.
As for DPPH assay, solutions containing different concentrations of extracts and a constant DPPH concentration of 4.47 × 10⁻⁵ M were prepared and the corresponding absorbances were read at 470 nm after 12 h of incubation. In each solution, the residual DPPH content, [DPPH]res, resulting from the scavenging reaction between the free radical DPPH and the antioxidant compounds present in the extracts, was calculated using the following Equation (1):
%   [ DPPH ] res = C C i C i     × 100
where Ci and C are the initial and the final DPPH concentrations, respectively.
An indirect measurement of the antioxidant power of each sample was represented by the amount necessary to reduce the initial DPPH content by 50% (efficient concentration, EC50). It was compared with the EC50 values found for BHT (butylated hydroxytoluene) and Trolox (6-hydroxy-2,5,7,8-tetramethylchroman-2-carboxylic acid), used as positive references.
FRAP assay is based on a reduction reaction of ferric to ferrous ions due to the presence of antioxidant molecules, with the consequent formation of a colored ferrous-tripyridyl triazine (TPTZ) complex.
Reaction mixtures were prepared by adding 0.15 mL of each sample extract to 4.4 mL of FRAP reagent (300 mM acetate buffer at pH 3.6; 10 mM TPTZ in 40 mM HCl, and 20 mM FeCl3·6H2O in a ratio of 10:1:1), and a final volume of 5 mL was reached with deionized water. Absorbances were measured at 593 nm using a spectrophotometer. For each reaction solution, the resulting concentrations of Fe2+ ions were quantified through a calibration curve prepared using FeSO4·H2O solutions at known concentrations (0.01 ÷ 0.15 mmol/L). The ferric reducing power of the tested samples was also expressed as millimoles of Trolox equivalents (TE), through a calibration curve previously prepared using Trolox as reference standard.

2.4.3. Evaluation of the Tyrosinase Inhibitory Activity (TIA)

Powder samples of raw oatmeal, hydrolyzed oatmeal, and fermented samples (RO, HO, FO0, FO24, FO48, and P, respectively) were dehydrated in deionized water with a mass to volume ratio of 1:6. Preparation of reaction solutions to be analyzed was performed according to the procedure reported by Zheng et al. [42], with some modifications. Briefly, 160 µL of a 200 mg/L tyrosine solution prepared in 50 mM sodium phosphate buffer (pH 6.8), was added to 20 µL of sample solutions and incubated at 30 °C for 5 min.
After incubation, 20 µL of a tyrosinase solution (300 U/mL) was added to the mixture and 20 µL of the resulting reaction volume was injected into an HPLC system (Agilent Technologies 1100), according to the method described by Kim et al. [43]. The stationary phase consisted of a Phenomenex Jupiter 4 µm Proteo 90 Å (250 × 4.6 mm)(Phenomenex Inc., Torrance, CA, USA) with a visible/UV detector. The mobile phase consisted of 80% eluent A, 0.1% trifluoroacetic acid (TFA) aqueous solution, and 20% eluent B, 100 acetonitrile (ACN), with a flow rate of 1 mL/min. The detection was set at 275 nm.
% Inhibition (I) was calculated according to the following Equation (2).
%   I = ( A s , 0 A s , 60 ) A c , 0 A c , 60 A c , 0 A c , 60     × 100
where As,0, As,60 are the areas underlying the tyrosine peak evaluated during HPLC runs performed at time 0 and after 60 min, respectively, on reaction sample solutions, while Ac,0, and Ac,60 are the areas underlying the peak of tyrosine during HPLC runs performed at time 0 and after 60 min, respectively, on control reaction solutions, prepared using deionized water instead of the samples, as described above. Moreover, the analytical procedure previously described was used to test solutions with different concentrations of kojic acid (0.001 ÷ 0.01 mg/mL), used as a reference standard. In Figure 2, the inhibition percentage as function of kojic acid concentration is reported.

2.4.4. Determination of the Sun Protection Factor (SPF)

Sun Protection Factor (SPF) of ethanol extracts obtained from each sample (RO, HO, FO0, FO24, FO48, and P) was determined according to the following Mansur Equation (3) [44]:
SPF = CF × [EE (λ) × I (λ) × Abs (λ)]
where EE (λ), I (λ), Abs (λ), CF, and E (λ) × I (λ) represent the erythemal effect spectrum, the solar intensity spectrum, the measured absorbance, a correction factor (13.4), and labelled constant reported by Mbanga et al. [45]. Absorbances were determined within a wavelength range from 290 nm to 320 nm with 5 nm intervals. CF was evaluated by performing the same procedure on a standard sunscreen formulation with SPF = 20, so that an 8% homosalate solution presented a SPF value equal to 5.36.

2.5. Statistical Analysis

Statistical analysis was performed using Prism 9®.
Fermentation tests and lactic acid, secondary metabolite, polyphenol, and antioxidant activity analysis were carried out in triplicate and, for each experimental data, mean values, and standard deviations (n = 3) were calculated. Their statistical significance was evaluated by one-way ANOVA followed by Tukey’s multiple comparisons test, accepting as significant only results with p < 0.05.

3. Results and Discussion

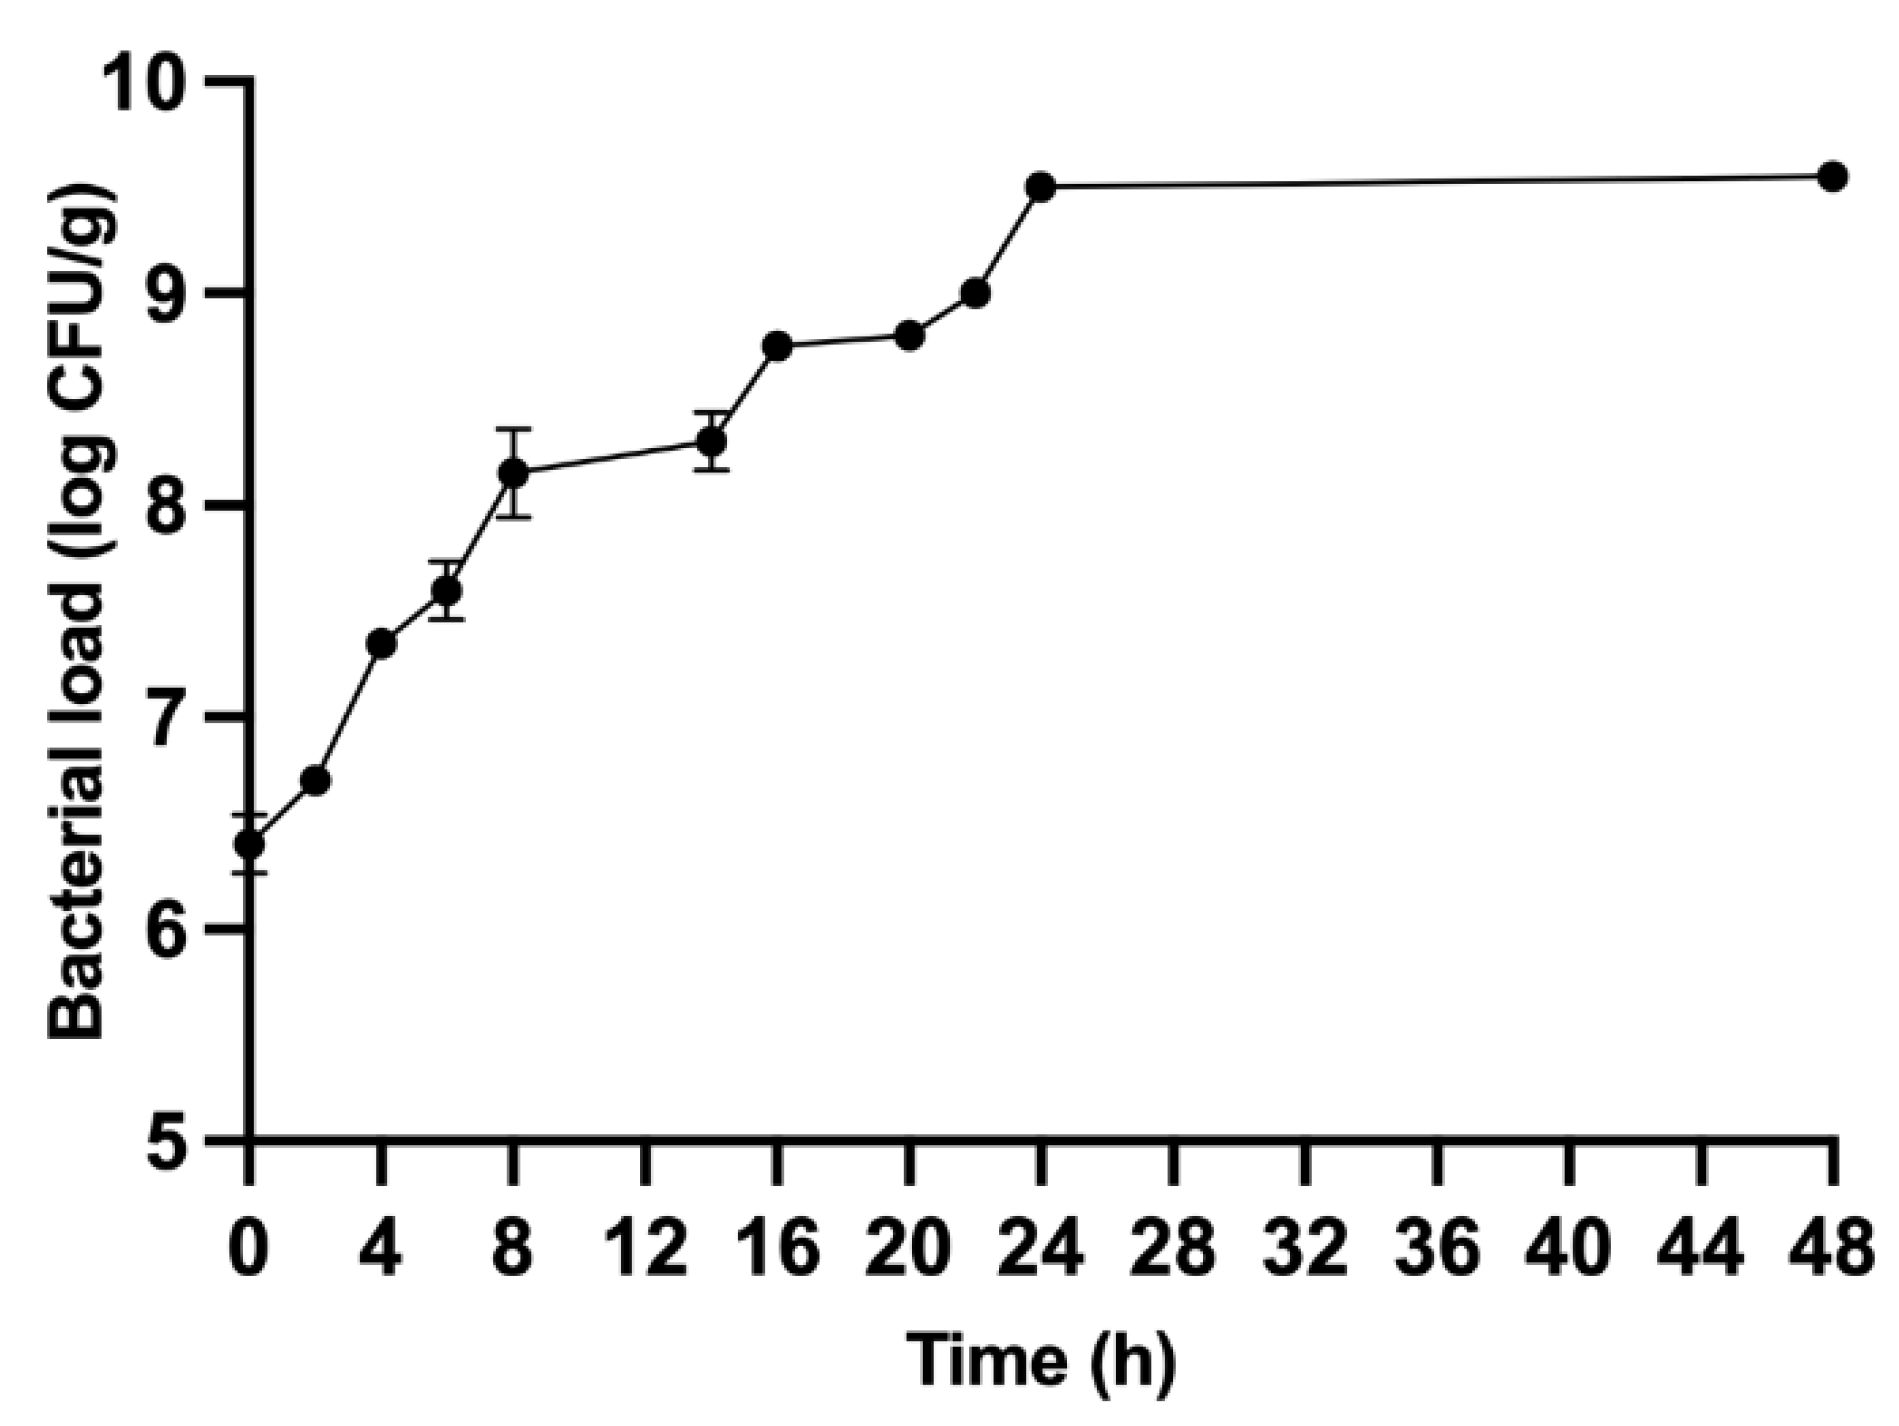
3.1. Fermentation Results

Fermentation process was carried out under controlled conditions of pH and temperature (6.2 and 37 °C, respectively) to ensure the maximum microbial growth and lactic acid production [35]. The entire process lasted 48 h, after that the fermented product was inactivated, through a mild heat treatment (80 °C, for 30 s) to reduce the bacterial load and obtain a postbiotic product.
Bacterial growth and lactic acid production curves are shown in Figure 2 and Figure 3, respectively.
The bacterial growth curve (Figure 3) was characterized by a lag phase of less than 2 h, starting from a microbial charge of 6.36 ± 0.14 log(CFU/g), immediately after inoculation (t0); the growth exponential phase lasted 22 h, reaching a maximum bacterial load of 9.48 ± 0.03 log(CFU/g) after 24 h of fermentation; the stationary phase started at time t24 and a constant bacterial charge of 9 log was maintained until the end of the process (t48).
The lactic acid production trend shown in Figure 4 was completely comparable to that observed for the bacterial growth. A maximum lactic acid production of 8.56 ± 0.3 g/L after 24 h of fermentation, which remained approximately constant until the end of the process (8.20 ± 0.225 g/L). Moreover, no significant quantities of acetic, propionic, and butyric acids were detected (data not shown), indicating the absence of contaminants during the process.
Furthermore, bacterial load and lactic acid concentration were measured also in the wet postbiotic product, after the microbial inactivation treatment. As expected, the bacterial count was practically equal to zero. Therefore, it was assumed that the viable bacterial load of 9.6 log CFU/g detected before the heat treatment was equal to the final biomass value present into the postbiotic product (10.3 log CFU/gdried postbiotic). The lactic acid concentration was 8.0 ± 0.2 g/L, confirming a low impact of the heat treatment on this parameter, as also reported by Igual et al. [46] where a conventional pasteurization treatment (80 °C for 11 s) led to a reduction of organic acids of about 4%.
From this study, it was evident that pH control during the fermentation process led to a higher lactic acid production (8.5 g/L in T24) in comparison with the maximum lactic acid content of 3.3 g/L reached by Gallo et al. [28] after 24 h fermentation of an oat water suspension (15% w/w) using LP CBA L74 without controlling pH. Conversely, the maximum bacterial load of 9.48 log (CFU/g) found by controlling pH was similar to that achieved during the uncontrolled pH process (9.74 log(CFU/g) [28]. Furthermore, as demonstrated by Colucci Cante et al. [34], pH control allows the microorganism to show a better duplication capacity and improved kinetic performances.
Moreover, a rice water suspension (15% w/w) was fermented by Gallo et al. [35] using the same microorganism and the same pre-treatment and fermentation protocols: under controlled pH conditions, a bacterial load of 3.16 × 10⁸ CFU/mL and a lactic acid concentration of 2.8 g/L were reached after 24 h of the process, suggesting a higher microorganism affinity for oat than rice.

3.2. Total Polyphenolic Content

Total polyphenolic content (TPC) determined in raw, hydrolyzed, and fermented oatmeal samples (RO, HO, FO0, FO24, FO48, and P, respectively), is shown in Figure 5.
The initial amount of polyphenols in the raw matrix was 1.0 ± 0.15 mg GAE/g.
It remained approximately constant after the enzymatic treatment (1.1 ± 0.04 mgGAE/g) applied on the oatmeal suspension to hydrolyze the starch and avoid gelatinization during the subsequent sterilization treatment, prior fermentation. TPC resulted instead increased in FO sample (2.54 ± 0.54 mgGAE/g) and remained approximately constant during the successive fermentation timing.
Non-statistically significant differences between TPC values were found in FO0, FO24, FO48, and P samples (p > 0.05), thus the effect of fermentation appeared irrelevant.
These data suggested that the increase in polyphenolic content could be due to the thermal treatment performed before the fermentation process to ensure sterile conditions. The strong heat treatment could be responsible for the release of all the phenolic compounds covalently bound to the cell walls of molecules present in the food matrix, such as polysaccharide and proteins, as suggested by Li et al. [47] and Colucci Cante et al. [39]. As shown in Figure 5, the total polyphenolic content evaluated in the raw, hydrolyzed, and fermented oatmeal samples (FO0, FO24, FO48, and P, respectively) appeared similar to the values reported by Colucci Cante et al. [39] for raw, cooked, and fermented navy beans, where phenol concentrations of 1.2 mgGAE/g, 1.1 mgGAE/g, and 2.9 mgGAE/g were determined, respectively.
The influence of thermal processes on the total phenolic content and the antioxidant properties of cereal and legume-based products were already investigated by several authors, as Randhir et al. [48], Călinoiu and Vodnar [49], and Rico et al. [50], which confirmed an enrichment in polyphenols and antioxidant compounds of these matrices when treated at specific operative temperatures and times.
Tyagi et al. [51] obtained a functional brown rice product through fermentation using Limosilactobacillus reuteri, with a high antioxidant potential and a total polyphenolic content of 1.08 mgGAE/g, lower than that obtained in this work.

3.3. Antioxidant Activity

The antioxidant activity of unfermented and fermented samples was analyzed in terms of free radical scavenging activity (DPPH method) and ferric reducing antioxidant power (FRAP method).
Free radical scavenging ability of raw, hydrolyzed, and fermented oatmeal samples (RO, HO, FO0, FO24, FO48, and P, respectively), at six different sample concentrations is shown in Figure 6 and in Table S1.
In all cases, it was evident that the scavenging ability increased as the sample concentration increased; in particular, the scavenging power was higher in FO0, FO24, FO48, and P than that determined for raw and hydrolyzed oatmeal. Moreover, antioxidant properties of the tested samples confirmed the trend of total polyphenolic content, as shown in Figure 7, where the scavenging ability was plotted versus the polyphenol concentrations evaluated in all oat samples (RO, HO, FO0, FO24, FO48, and P).
EC50 values, evaluated for raw oatmeal, hydrolyzed oatmeal, and fermented samples (FO0, FO24, FO48, and P), are reported in Figure 8, where they were also compared to those determined in solutions of Trolox and BHT, considered as reference molecules with high antioxidant activity.
In particular, a reduction of EC50, corresponding to an increase in antioxidant activity, was mainly observed in FO0 (2.2 mg/mL) with respect to the values determined for raw and hydrolyzed samples (4.0 mg/mL and 4.1 mg/mL, respectively) while the differences between the values found for FO24, FO48, and P (2.1 mg/mL, 2.3 mg/mL, and 1.8 mg/mL, respectively) resulted to be not significantly different (p > 0.05). As expected, BHT and Trolox showed an EC50 three orders of magnitude lower (0.002 mg/mL) than those estimated for the tested samples. The experimental data confirmed that the antioxidant activity was strictly connected with the total polyphenolic content: the higher the polyphenolic content, the higher the antioxidant power, and the lower the EC50 value.
Moreover, the sample to DPPH concentration ratio able to ensure a 50% of scavenging activity, was approximately equal to 107.6 mgsample/mgDPPH and comparable with the ratio of 93.6 mgsample/mgDPPH reported by Colucci Cante et al. [48] for fermented navy beans.
Juan and Chou [52] carried out a solid-state fermentation of black soybeans with Bacillus subtilis BCRC 14715 to evaluate the effect of fermentation on antioxidant activity: a final EC50 value of 30.7 mgsample/mgDPPH was found. Moreover, Chen et al. [53] developed a rice-bran-based skin care product through the fermentation of rice bran using lactic acid bacteria; the EC50 value determined for the fermented rice bran was 811.5 mgsample/mgDPPH, higher than that obtained in this study, suggesting a higher antioxidant power of the fermented oatmeal produced.
The ferric reducing antioxidant power of the tested samples is reported in Table 2 and expressed as mmol Fe2+/g and mmol TE/g.
FRAP assay highlighted a slightly increase in antioxidant potential for the fermented samples, following the same trend of DPPH results, but, in this case, all the determined values did not differ in a statistically significant way (p > 0.05).
Rummun et al. [54] studied the bioactivity of nonedible parts of Punica granatum, a common fruit from Mauritius widely used in cooking and in medicine; its ferric reducing potential of 6.29 × 10⁻³ mmol Fe2+/g, resulted to be slightly lower than the values obtained in this work for oat fermented samples. Denga et al. [55] investigated the antioxidant activity of cereal grains and reported a FRAP value of 1.6 × 10⁻² mmol Fe2+/g for oat, confirming the results obtained in this work.
Furthermore, Alvarez-Jubete et al. [56] examined the antioxidant properties of methanolic extract from cereals, obtaining a FRAP value of 2.2 × 10⁻³ mmol TE/g for amaranth seeds, in line with the values obtained in this study.

3.4. Determination of Tyrosinase Inhibition

Figure 9 shows the ability of raw, hydrolyzed, and fermented oatmeal (RO, HO, FO0, FO24, FO48, and P, respectively) solutions, in which a fixed oat sample concentration of 16 mg/mL was used to inhibit the tyrosinase activity. Tyrosinase is the enzyme involved in melanin synthesis pathway.
RO, HO, and FO0 oat samples were able to inhibit the tyrosinase activity of approximately 32%, while an increased inhibition percentage of about 50% was reached in FO24, FO48, and P sample solutions. Non-statistically significant differences were found between FO24, FO48, and P inhibition values (p > 0.05).
Fermentation process appeared to be responsible for increasing the anti-tyrosinase activity, probably due to both the highest lactic acid content reached in the fermented matrix after 24 h of process and its increased phenolic amount, as confirmed by several literature works [53,57,58], where lactic acid and phenolic compounds were identified as the main substances responsible for the melanin inhibition process.
As shown in Figure 2, the kojic acid concentration that caused a 50% enzyme activity loss (IC50) was 0.65 µg/mL and resulted to be 4 orders of magnitude lower than the IC50 value found for oatmeal fermented samples (16 mg/mL for FO24, FO48, and P).
Furthermore, in Figure 10, HPLC chromatogram of the main sample on which this study was focused, namely postbiotic, is reported and compared with that of control solution, after 60 min of reaction. Tyrosine conversion (tyrosine peak detected at a retention time of 3.7 min) in presence of postbiotic was lower than that observed after 60 min of reaction in control solution, indicating an inhibitory effect of the functional ingredient developed in this study.
The ability of a fermented rice bran solution to inhibit melanin synthesis was investigated by Chen et al. [53]. A lower IC50 value of 9.23 mg/mL than that obtained in this work was reported.
Furthermore, Manosroi et al. [59] investigated the tyrosinase inhibition of samples from various fermented rice types obtained after 48 h of fermentation: IC50 values of 298.61 mg/mL, 87.71 mg/mL, and 20.41 mg/mL were determined for white, brown, and purple plain rice, respectively, while values of 243.33 mg/mL and 26.96 mg/mL were found for white and purple glutinous rice, respectively, using a tyrosine solution of 1 mg/mL and a 200 units tyrosinase. In all cases, the IC50 values were higher than those obtained for the fermented oatmeal samples tested in this work.

3.5. Sun Protection Factor (SPF) Evaluation

The ability of oat non-fermented and fermented samples (RO, HO, FO0, FO24, FO48, and P) to protect against UV radiation was investigated through the SPF determination, as reported in Figure 11.
Fermentation seemed to have no positive impact on the ability to protect against UV radiation since the higher SPF values was reported for unfermented samples (1.40 ± 0.02, 1.38 ± 0.016 and 1.43 ± 0.003 for RO, HO, FO0 oatmeal samples, respectively); then, SPF decreased due to the fermentation process and reached a value of 0.43 ± 0.002 in postbiotic.
Nizioł-Łukaszewska et al. [60] investigated the ability of fermented green coffee to protect against UV radiation. As well as in this work, during the first days of fermentation a decrease in SPF from the initial value of 3.15 in raw green coffee to 0.73 after 7 days of fermentation was recorded; then it increased up to 2.57 after 28 days of fermentation. An initial SPF decrease, and the subsequent increase could be mostly caused by the polymerization and depolymerization of the active compounds with natural sunscreen properties, such as polyphenols, flavonoids, and anthocyanins, which occur during the fermentation process [61]. Rejeki et al. [62] determined the SPF value of lime fruits containing high amount of vitamin C and flavonoids with sunscreen potential.
The ethanol extracts of lime peels in various concentrations, 100 ppm, 150 ppm, 200 ppm, 250 ppm, and 300 ppm were respectively 4.77, 10.17, 27.05, 50.33, and 80.54. The results showed that lime ethanol extracts had high potential as sunscreen agents and that it was strictly related to its concentration.

4. Conclusions

The aim of this work was to develop a process to produce an oat-based postbiotic ingredient to be used in personal care cosmetic formulations. Functional properties were evaluated after each process phase (hydrolysis, 24 h and 48 h of fermentation, and bacterial inactivation) in order to explore the effect of each single treatment on the functional profile of the oat matrix.
The production process consisted of a lactic acid fermentation carried out by controlling pH and temperature on a hydrolyzed oatmeal water suspension, using Lacticaseibacillus paracasei CBA L74. At the end of the process that lasted 48 h, bacterial charge was inactivated by a mild thermal treatment to obtain a postbiotic.
The maximum microbial load and lactic acid production were achieved after 24 h of fermentation, with a value of 9.48 ± 0.03 log(CFU/g) and 8.56 ± 0.3 g/L, respectively. The trend of the total polyphenol content was investigated: the maximum polyphenol content of 2.54 ± 0.54 mgGAE/g was achieved after hydrolysis and sterilization processes, with an increase of approximately 60% compared to the raw oatmeal. Furthermore, polyphenol content remained approximately stable throughout the fermentation process and in the postbiotic. The results highlighted that the sterilization process carried out before starting the fermentation was the main responsible for the polyphenol content increase and that the fermentation’s contribution was not relevant.
The antioxidant activity (DPPH method and FRAP assay) of fermented and unfermented samples was also investigated; the results reflected the trend of total polyphenol contents and showed an increase in scavenging ability and ferric reducing potential in FO0 samples. As above, this increase was exclusively due to the thermal treatment performed before the fermentation.
In addition to its contribution to the lactic acid enrichment, the fermentation process appeared to be decisive even for the anti-tyrosinase activity of the resulting product; in fact, the oatmeal fermented samples (FO24, FO48, and P) inhibited the tyrosinase activity of about 50% with respect to non-fermented samples that showed an inhibition percentage of around 30%.
Thus, in light of the results obtained, a fermentation time of 24 h was sufficient to guarantee the maximum lactic acid concentration and anti-tyrosinase effect. The UV shielding ability was mild and decreased with fermentation: the average SPF value of fermented samples was approximately 0.39 compared to that of unfermented samples of about 1.40.
This study pointed out and confirmed the potential in the cosmetic field of the semi-finished product produced. The resulting oat-based postbiotic contained lactic acid (approximately 55 mg/gpostbiotic), a molecule that is exploited in cosmetic for its moisturizing or exfoliating properties, dead bacteria (approximately 10.3 logCFU/gpostbiotic), that can balance the skin microbiota, high polyphenols content (approximately 1.8 mgGAE/gpostbiotic) with antioxidant activity, and additionally, scavenging and anti-tyrosinase properties, useful to counter the formation of free radicals and skin blemishes.
Prospects will be to carry out cosmetic formulation tests where the postbiotic will be used as an active ingredient in order to understand the most suitable percentage of use for different types of cosmetic products. Moreover, in vitro efficacy studies of the formulations produced will be performed.

Supplementary Materials

The following supporting information can be downloaded at: https://www.mdpi.com/article/10.3390/fermentation8110632/s1. Table S1: Scavenging ability of raw (RO), hydrolyzed (HO), and fermented oatmeal samples obtained at time 0, and after 24 h, 48 h, and deactivation process (FO0, FO24, FO48, and P, respectively) calculated at different sample concentrations. Each result represents the mean value of a triplicate analysis. Values marked with same lowercase letters in the same row are not significantly different (p > 0.05).

Author Contributions

Conceptualization, F.N. and R.C.C.; methodology, G.L., F.N. and R.C.C.; validation, G.L., F.N., R.C.C., F.P. and M.G.; investigation, F.N., G.L. and R.C.C.; formal analysis, G.L. and F.N.; visualization, G.L., F.N. and R.C.C.; data curation, F.N., G.L., R.C.C., F.P. and M.G.; writing—original draft, G.L., F.N. and R.C.C.; writing—review and editing, G.L., F.N., R.C.C., F.P., M.G. and R.N.; supervision, F.N., R.C.C., A.L.B. and R.N.; project administration, A.L.B. and R.N. All authors have read and agreed to the published version of the manuscript.

Funding

This research received no external funding.

Institutional Review Board Statement

Not applicable.

Informed Consent Statement

Not applicable.

Data Availability Statement

Not applicable.

Conflicts of Interest

The authors declare no conflict of interest.

References

  1. Hernandez, D.F.; Cervantes, E.L.; Luna-Vital, D.A.; Mojica, L. Food-derived bioactive compounds with anti-aging potential for nutricosmetic and cosmeceutical products. Crit. Rev. Food Sci. Nutr. 2021, 61, 3740–3755. [Google Scholar] [CrossRef] [PubMed]
  2. Das, G.; Paramithiotis, S.; Sundaram Sivamaruthi, B.; Wijaya, C.H.; Suharta, S.; Sanlier, N.; Shin, H.S.; Patra, J.K. Traditional fermented foods with anti-aging effect: A concentric review. Food Res. Int. 2020, 134, 109269. [Google Scholar] [CrossRef] [PubMed]
  3. Shin, D.; Lee, Y.; Huang, Y.H.; Lim, H.W.; Jang, K.; Kim, D.D.; Lim, C.J. Probiotic fermentation augments the skin anti-photoaging properties of Agastache rugosa through up-regulating antioxidant components in UV-B-irradiated HaCaT keratinocytes. BMC Complement. Altern. Med. 2018, 18, 196. [Google Scholar] [CrossRef] [PubMed] [Green Version]
  4. Chai, K.F.; Voo, A.Y.H.; Chen, W.N. Bioactive peptides from food fermentation: A comprehensive review of their sources, bioactivities, applications, and future development. Compr. Rev. Food Sci. Food Saf. 2020, 19, 3825–3885. [Google Scholar] [CrossRef] [PubMed]
  5. Schagen, S.K. Topical Peptide Treatments with Effective Anti-Aging Results. Cosmetics 2017, 4, 16. [Google Scholar] [CrossRef] [Green Version]
  6. Al-Ghazzewi, F.H.; Tester, R.F. Impact of prebiotics and probiotics on skin health. Benef. Microbes 2014, 5, 99–107. [Google Scholar] [CrossRef]
  7. Hill, C.; Guarner, F.; Reid, G.; Gibson, G.R.; Merenstein, D.J.; Pot, B.; Morelli, L.; Canani, R.B.; Flint, H.J.; Salminen, S.; et al. The International Scientific Association for Probiotics and Prebiotics consensus statement on the scope and appropriate use of the term probiotic. Nat. Rev. Gastroenterol. Hepatol. 2014, 11, 506–514. [Google Scholar] [CrossRef] [Green Version]
  8. Naik, S.; Bouladoux, N.; Wilhelm, C.; Molloy, M.J.; Salcedo, R.; Kastenmuller, W.; Deming, C.; Quinones, M.; Koo, L.; Conlan, S.; et al. Compartmentalized control of skin immunity by resident commensals. Science 2012, 337, 1115–1119. [Google Scholar] [CrossRef] [Green Version]
  9. Salminen, S.; Collado, M.C.; Endo, A.; Hill, C.; Lebeer, S.; Quigley, E.M.M.; Sanders, M.E. Probiotics and Prebiotics (ISAPP) consensus statement on the definition and scope of postbiotics. Nat. Rev. Gastroenterol. Hepatol. 2021, 18, 649–667. [Google Scholar] [CrossRef]
  10. Aguilar-Toalá, J.; Garcia-Varela, R.; Garcia, H.; Mata-Haro, V.; González-Córdova, A.; Vallejo-Cordoba, B.; Hernández-Mendoza, A. Postbiotics: An evolving term within the functional foods field. Trends Food Sci. Technol. 2018, 75, 105–114. [Google Scholar] [CrossRef]
  11. Pirhadi, M.; Alikord, M.; Mohammadi, M.A.; Shariatifar, N. Beneficial effects of postbiotics on food products and its effect on human health: A Critical Review. Plant Biotechnol. Persa 2021, 3, 56–62. [Google Scholar]
  12. Deshpande, G.; Athalye-Jape, G.; Patole, S. Para-probiotics for Preterm Neonates-The Next Frontier. Nutrients 2018, 10, 871. [Google Scholar] [CrossRef] [Green Version]
  13. Wegh, C.; Geerlings, S.Y.; Knol, J.; Roeselers, G.; Belzer, C. Postbiotics and Their Potential Applications in Early Life Nutrition and Beyond. Int. J. Mol. Sci. 2019, 20, 4673. [Google Scholar] [CrossRef] [PubMed] [Green Version]
  14. Conte, M.; Nigro, F.; Porpora, M.; Bellomo, C.; Furone, F.; Budelli, A.L.; Nigro, R.; Barone, M.V.; Nanayakkara, M. Gliadin Peptide P31-43 Induces mTOR/NFkβ Activation and Reduces Autophagy: The Role of Lactobacillus paracasei CBA L74 Postbiotc. Int. J. Mol. Sci. 2022, 23, 3655. [Google Scholar] [CrossRef] [PubMed]
  15. Ácsová, A.; Hojerová, J.; Martiniaková, S. Efficacy of postbiotics against free radicals and UV radiation. Chem. Pap. 2022, 76, 2357–2364. [Google Scholar] [CrossRef]
  16. Izuddin, W.I.; Humam, A.M.; Loh, T.C.; Foo, H.L.; Samsudin, A.A. Dietary Postbiotic Lactobacillus plantarum Improves Serum and Ruminal Antioxidant Activity and Upregulates Hepatic Antioxidant Enzymes and Ruminal Barrier Function in Post-Weaning Lambs. Antioxidants 2020, 9, 250. [Google Scholar] [CrossRef] [Green Version]
  17. Kaur, S.; Thukral Kaur, S.; Kaur, P.; Samota, M.K. Perturbations associated with hungry gut microbiome and postbiotic perspectives to strengthen the microbiome health. Future Foods 2021, 4, 100043. [Google Scholar] [CrossRef]
  18. Carlomagno, F.; Zanzottera, S. Biotechnological Active Ingredient, Protecting Skin Microbiota. SÖFW-J. 2019, 145, 28–34. [Google Scholar]
  19. Xiaoyu, Z.; Chen, J.; Li, X.; Yi, K.; Ye, Y.; Liu, G.; Wang, S.; Hu, H.; Zou, L.; Wang, Z. Dynamic changes in antioxidant activity and biochemical composition of tartary buckwheat leaves during Aspergillus niger fermentation. J. Funct. Foods 2017, 32, 375–381. [Google Scholar] [CrossRef]
  20. Bei, Q.; Wu, Z.; Chen, G. Dynamic changes in the phenolic composition and antioxidant activity of oats during simultaneous hydrolysis and fermentation. Food Chem. 2020, 305, 125269. [Google Scholar] [CrossRef]
  21. Tang, T.; Li, S.; Yan, J.; Peng, Y.; Weng, W.; Yao, X.; Gao, A.; Cheng, J.; Ruan, J.; Xu, B. Bioactive Components and Health Functions of Oat. Food Rev. Int. 2022, 1–20. [Google Scholar] [CrossRef]
  22. Faccio, G. Plant Complexity and Cosmetic Innovation. iScience 2020, 23, 101358. [Google Scholar] [CrossRef] [PubMed]
  23. Huang, H.C.; Lee, I.J.; Huang, C.; Chang, T.M. Lactic Acid Bacteria and Lactic Acid for Skin Health and Melanogenesis Inhibition. Curr. Pharm. Biotechnol. 2020, 21, 566–577. [Google Scholar] [CrossRef] [PubMed]
  24. Zagato, E.; Mileti, E.; Massimiliano, L.; Fasano, F.; Budelli, A.; Penna, G.; Rescigno, M. Lactobacillus paracasei CBA L74 metabolic products and fermented milk for infant formula have anti-inflammatory activity on dendritic cells in vitro and protective effects against colitis and an enteric pathogen In Vivo. PLoS ONE 2014, 9, e87615. [Google Scholar] [CrossRef]
  25. Colucci Cante, R.; Gallo, M.; Nigro, F.; Passannanti, F.; Salameh, D.; Budelli, A.; Nigro, R. Lactic fermentation of cooked navy beans by Lactobacillus paracasei CBA L74 aimed at a potential production of functional legume-based foods. Can. J. Chem. Eng. 2020, 98, 1955–1961. [Google Scholar] [CrossRef]
  26. Salameh, D.; Nigro, F.; Colucci Cante, R.; Passannanti, F.; Gallo, M.; Budelli, A.; Marzocchella, A.; Nigro, R. Fermentation of Rice Flour Supernatant Using Lactobacillus Paracasei Cba L74. Chem. Eng. Trans. 2019, 75, 289–294. [Google Scholar] [CrossRef]
  27. Gallo, M.; Passannanti, P.; Colucci Cante, R.; Nigro, F.; Schiattarella, P.; Zappulla, S.; Budelli, A.; Nigro, R. Lactic fermentation of cereals aqueous mixture of oat and rice flours with and without glucose addition. Heliyon 2020, 6, e04920. [Google Scholar] [CrossRef]
  28. Gallo, M.; Passannanti, F.; Colucci Cante, R.; Nigro, F.; Salameh, D.; Schiattarella, P.; Schioppa, C.; Budelli, A.; Nigro, R. Effect of the glucose addition during lactic fermentation of rice, oat, and wheat flours. Appl. Food Biotechnol. 2020, 7, 21–30. [Google Scholar] [CrossRef]
  29. Gallo, M.; Passannanti, F.; Schiattarella, P.; Esposito, A.; Colucci Cante, R.; Nigro, F.; Budelli, A.; Nigro, R. Banana Puree Lactic Fermentation: The Role of Ripeness, Heat Treatment, and Ascorbic Acid. Appl. Sci. 2021, 11, 5153. [Google Scholar] [CrossRef]
  30. Gallo, M.; Passannanti, F.; Schioppa, C.; Montella, S.; Colucci Cante, R.; Nigro, F.; Budelli, A.; Nigro, R. Enzymatic pre-treatment and lactic fermentation of wheat flour suspension at a high solid content. J. Food Process. Preserv. 2021, 45, e15299. [Google Scholar] [CrossRef]
  31. Gallo, M.; Nigro, F.; Passannanti, F.; Salameh, D.; Schiattarella, P.; Budelli, A.L.; Nigro, R. Lactic Fermentation of Cereal Flour: Feasibility Tests on Rice, Oat and Wheat. Appl. Food Biotechnol. 2019, 6, 165–172. [Google Scholar] [CrossRef]
  32. Sarno, M.; Lania, G.; Cuomo, M.; Nigro, F.; Passannanti, F.; Budelli, A.; Fasano, F.; Troncone, R.; Auricchio, S.; Barone, M.V.; et al. Lactobacillus paracasei CBA L74 interferes with gliadin peptides entrance in Caco-2 cells. Int. J. Food Sci. Nutr. 2014, 65, 953–959. [Google Scholar] [CrossRef] [PubMed]
  33. Labruna, G.; Nanayakkara, M.; Pagliuca, C.; Nunziato, M.; Iaffaldano, L.; D’Argenio, V.; Colicchio, R.; Budelli, A.L.; Nigro, R.; Salvatore, P.; et al. Celiac disease-associated Neisseria flavescens decreases mitochondrial respiration in CaCo-2 epithelial cells: Impact of Lactobacillus paracasei CBA L74 on bacterial-induced cellular imbalance. Cell Microbiol. 2019, 21, e13035. [Google Scholar] [CrossRef] [PubMed] [Green Version]
  34. Colucci Cante, R.; Gallo, M.; Nigro, F.; Passannanti, F.; Budelli, A.; Nigro, R. Mathematical modelling of Lactobacillus paracasei CBA L74 growth during rice flour fermentation performed with and without pH control. Appl. Sci. 2021, 11, 2921. [Google Scholar] [CrossRef]
  35. Gallo, M.; Nigro, F.; Passannanti, F.; Nanayakkara, M.; Lania, G.; Parisi, F.; Salameh, D.; Budelli, A.; Barone, M.V.; Nigro, R. Effect of pH control during rice fermentation in preventing a gliadin P31-43 entrance in epithelial cells. Int. J. Food Sci. Nutr. 2019, 70, 950–958. [Google Scholar] [CrossRef]
  36. Sanders, E.R. Aseptic laboratory techniques: Plating methods. J. Vis. Exp. 2012, 63, e3064. [Google Scholar] [CrossRef]
  37. Kordis-Krapez, M.; Abram, V.; Kac, M.H.; Ferjan, S. Determination of organic acids in white wines by RP-HPLC. Food Tech. Biotechnol. 2001, 39, 93–99. [Google Scholar]
  38. Aikpokpodion, P.E.; Dongo, L.N. Effects of fermentation intensity on polyphenols and antioxidant capacity of cocoa beans. Int. J. Sustain. Crop Prod. 2010, 5, 66–70. [Google Scholar]
  39. Colucci Cante, R.; Gallo, M.; Nigro, F.; Vitelli, C.; Passannanti, F.; Budelli, A.L.; Nigro, R. Optimization of Mixing Conditions for Improving Lactobacillus Paracasei Cba L74’ S Growth During Lactic Fermentation of Cooked Navy Beans and Functional Characterization of the Fermented Products. Chem. Eng. Trans. 2022, 93, 313–318. [Google Scholar] [CrossRef]
  40. Brand-Williams, W.; Cuvelier, M.E.; Berset, C. Use of a free radical method to evaluate antioxidant activity. LWT Food Sci. Technol. 1995, 28, 25–30. [Google Scholar] [CrossRef]
  41. Benzie, I.F.; Devaki, M. The ferric reducing/antioxidant power (FRAP) assay for non-enzymatic antioxidant capacity: Concepts, procedures, limitations and applications. In Measurement of Antioxidant Activity & Capacity; Apak, R., Capanoglu, E., Shahidi, F., Eds.; Wiley Online Library: New York, NY, USA, 2018; pp. 77–106. [Google Scholar] [CrossRef]
  42. Zheng, Z.P.; Tan, H.Y.; Wang, M. Tyrosinase inhibition constituents from the roots of Morus australis. Fitoterapia 2012, 83, 1008–1013. [Google Scholar] [CrossRef] [PubMed]
  43. Kim, J.H.; Jang, D.H.; Lee, K.W.; Kim, K.D.; Shah, A.B.; Zhumanova, K.; Park, K.H. Tyrosinase Inhibition and Kinetic Details of Puerola Having But-2-Enolide Structure from Amorpha fruticosa. Molecules 2020, 25, 2344. [Google Scholar] [CrossRef] [PubMed]
  44. Mansur, J.S.; Breder, M.N.R.; Mansur, M.C.A.; Azulay, R.D. Determinação do fator de proteção solar por espectrofotometria. An. Bras. Dermatol. 1986, 61, 121–124. [Google Scholar]
  45. Mbanga, L.; Mulenga, M.; Mpiana, P.T.; Bokolo, K.; Mumbwa, M.; Mvingu, K. Determination of Sun Protection Factor (SPF) of Some Body Creams and Lotions Marketed in Kinshasa by Ultraviolet Spectrophotometry. Int. J. Adv. Res. Chem. Sci. 2014, 1, 7–13. [Google Scholar]
  46. Igual, M.; García-Martínez, E.; Camacho, M.M.; Martínez-Navarrete, N. Effect of thermal treatment and storage on the stability of organic acids and the functional value of grapefruit juice. Food Chem. 2010, 118, 291–299. [Google Scholar] [CrossRef]
  47. Li, M.; Chen, X.; Deng, J.; Ouyang, D.; Wang, D.; Liang, Y.; Chen, Y.; Sun, Y. Effect of thermal processing on free and bound phenolic compounds and antioxidant activities of hawthorn. Food Chem. 2020, 332, 127429. [Google Scholar] [CrossRef]
  48. Randhir, R.; Kwon, Y.; Shetty, K. Effect of thermal processing on phenolics, antioxidant activity and health-relevant functionality of select grain sprouts and seedlings. Innov. Food Sci. Emerg. Technol. 2008, 9, 355–364. [Google Scholar] [CrossRef]
  49. Călinoiu, L.F.; Vodnar, D.C. Thermal Processing for the Release of Phenolic Compounds from Wheat and Oat Bran. Biomolecules 2020, 10, 21. [Google Scholar] [CrossRef] [Green Version]
  50. Rico, D.; Villaverde, A.; Martinez-Villaluenga, C.; Gutierrez, A.L.; Caballero, P.A.; Ronda, F.; Peñas, E.; Frias, J.; Martin Diana, A.B. Application of Autoclave Treatment for Development of a Natural Wheat Bran Antioxidant Ingredient. Foods 2020, 9, 781. [Google Scholar] [CrossRef]
  51. Tyagi, A.; Shabbir, U.; Chelliah, R.; Daliri, E.B.M.; Chen, X.; Oh, D.H. Limosilactobacillus reuteri Fermented Brown Rice: A Product with Enhanced Bioactive Compounds and Antioxidant Potential. Antioxidants 2021, 10, 1077. [Google Scholar] [CrossRef]
  52. Juan, M.Y.; Chou, C.C. Enhancement of antioxidant activity, total phenolic and flavonoid content of black soybeans by solid state fermentation with Bacillus subtilis BCRC 14715. Food Microbiol. 2010, 27, 586–591. [Google Scholar] [CrossRef] [PubMed]
  53. Chen, L.; Chen, I.C.; Chen, P.Y.; Huang, P.H. Efficacy of rice bran fermentation in cosmetics and skin care products. Biosci. J. 2018, 34, 1102–1113. [Google Scholar] [CrossRef]
  54. Rummun, N.; Somanah, J.; Ramsaha, S.; Bahorun, T.; Neergheen-Bhujun, V.S. Bioactivity of Nonedible Parts of Punica granatum L.: A Potential Source of Functional Ingredients. Int. J. Food Sci. 2013, 2013, 602312. [Google Scholar] [CrossRef] [Green Version]
  55. Denga, G.X.; Xub, X.R.; Guoa, Y.J.; Xiaa, E.Q.; Lia, S.; Wua, S.; Chenc, F.; Linga, W.H.; Li, H.-B. Determination of antioxidant property and their lipophilic and hydrophilic phenolic contents in cereal grains. J. Funct. Foods 2012, 4, 906–914. [Google Scholar] [CrossRef]
  56. Alvarez-Jubete, L.; Wijngaard, H.; Arendt, E.K.; Gallagher, E. Polyphenol composition and in vitro antioxidant activity of amaranth, quinoa buckwheat and wheat as affected by sprouting and baking. Food Chem. 2010, 119, 770–778. [Google Scholar] [CrossRef]
  57. Cha, J.Y.; Yang, H.J.; Moon, H.I.; Cho, Y.S. Inhibitory effect and mechanism on melanogenesis from fermented herbal composition for medical or food uses. Int. Food Res. J. 2012, 45, 225–231. [Google Scholar] [CrossRef]
  58. Chen, Y.M.; Shih, T.W.; Chiu, C.P.; Pan, T.M.; Tsai, T.Y. Effects of lactic acid bacteria-fermented soy milk on melanogenesis in B16F0 melanocytes. J. Funct. Foods 2013, 5, 395–405. [Google Scholar] [CrossRef]
  59. Manosroi, A.; Ruksiriwanich, W.; Kietthanakorn, B.; Manosroi, W.; Manosroi, J. Relationship between biological activities and bioactive compounds in the fermented rice sap. Int. Food Res. J. 2011, 44, 2757–2765. [Google Scholar] [CrossRef]
  60. Nizioł-Łukaszewska, Z.; Ziemlewska, A.; Bujak, T.; Zagórska-Dziok, M.; Zarebska, M.; Hordyjewicz-Baran, Z.; Wasilewski, T. Effect of Fermentation Time on Antioxidant and Anti-Ageing Properties of Green Coffee Kombucha Ferments. Molecules 2020, 25, 5394. [Google Scholar] [CrossRef]
  61. Wagemaker, T.A.L.; Carvalho, C.R.L.; Maia, N.B.; Baggio, S.R.; Filho, O.G. Sun protection factor, content, and composition of lipid fraction of green coffee beans. Ind. Crop. Prod. 2011, 33, 469–473. [Google Scholar] [CrossRef]
  62. Rejeki, S.; Fahrun, N.; Siwi, H. The SPF value determination of sunscreen lotio of lime rind spectrometry UV-VIS method. In Proceeding of the International Conference on Medical and Healthcare, Tsukuba, Japan, 8–10 June 2018; Volume 1, pp. 16–19. [Google Scholar]
Figure 1. Flow diagram of the experimental design.
Fermentation 08 00632 g001
Figure 2. Tyrosinase inhibition curve evaluated for different Kojic acid solutions. Each result represents the mean value of a triplicate analysis and error bars indicate the corresponding standard deviations.
Fermentation 08 00632 g002
Figure 3. Bacterial growth curve determined during oatmeal fermentation. Each result reported is a mean value of a triplicate analysis and error bars indicate the corresponding standard deviations.
Fermentation 08 00632 g003
Figure 4. Lactic acid production curve determined during oatmeal fermentation. Each result reported is a mean value of a triplicate analysis and error bars indicate the corresponding standard deviations.
Fermentation 08 00632 g004
Figure 5. Total phenolic content (TPC) determined in raw (RO), hydrolyzed (HO), fermented oatmeal samples obtained at time 0, and after 24 h, 48 h, and deactivation process (RO, HO, FO0, FO24, FO48, and P) oatmeal samples. Each result is a mean value of a triplicate analysis and error bars indicate the corresponding standard deviations. Values marked with different lowercase letters are significantly different (p < 0.05), according to Tukey’s test.
Fermentation 08 00632 g005
Figure 6. Scavenging ability of raw, hydrolyzed, and fermented oatmeal samples (RO, HO, FO0, FO24, FO48, and P, respectively) calculated at different sample concentrations. Each result represents the mean value of a triplicate analysis and error bars indicate the corresponding standard deviations.
Fermentation 08 00632 g006
Figure 7. Scavenging ability versus total polyphenol concentrations (TPC) evaluated in oat samples. Each result represents the mean value of a triplicate analysis and error bars indicate the corresponding standard deviations.
Fermentation 08 00632 g007
Figure 8. Antioxidant activity of raw (RO), hydrolyzed (HO), and fermented oatmeal samples obtained at time 0, and after 24 h, 48 h, and deactivation process (FO0, FO24, FO48, and P, respectively) and BHT and Trolox, expressed as the amount necessary to reduce the initial DPPH content by 50% (EC50). Each result represents the mean value of a triplicate analysis and error bars indicate the corresponding standard deviations. Values marked with different lowercase letters are significantly different (p < 0.05), according to Tukey’s test.
Fermentation 08 00632 g008
Figure 9. Tyrosinase inhibition ability of raw (RO), hydrolyzed (HO), and fermented oatmeal samples obtained at time 0, and after 24 h, 48 h, and deactivation process (FO0, FO24, FO48, and P, respectively) in solutions at fixed concentration (16 mg/mL). Each result represents the mean value of a triplicate analysis and error bars indicate the corresponding standard deviations. Values marked with different lowercase letters are significantly different (p < 0.05), according to Tukey’s test.
Fermentation 08 00632 g009
Figure 10. HPLC chromatograms of (a) control solution at time 0, (b) control solution at time 60 min, and (c) postbiotic at time 60 min, determined during anti-tyrosine activity analysis.
Fermentation 08 00632 g010
Figure 11. SPF values calculated for raw (RO), hydrolyzed (HO), and fermented oatmeal samples obtained at time 0, and after 24 h, 48 h, and deactivation process (FO0, FO24, FO48, and P, respectively). Each result is a mean value of a triplicate analysis and error bars indicate the corresponding standard deviations. Values marked with different lowercase letters are significantly different (p < 0.05), according to Tukey’s test.
Fermentation 08 00632 g011
Table 1. Description of the investigated samples.
Oat SamplesDescription
RORaw oatmeal
HOHydrolyzed oatmeal
FO0Fermented oatmeal at time 0
FO24Fermented oatmeal after 24 h of fermentation
FO48Fermented oatmeal after 48 h of fermentation
PPostbiotic, after 48 h of fermentation and deactivation.
Table 2. FRAP values of raw, hydrolyzed, and fermented oatmeal samples (RO, HO, FO0, FO24, FO48, and P, respectively). Each result is shown as the mean value of a triplicate analysis and the corresponding standard deviations. Values marked with same lowercase letters in the same column are not significantly different (p > 0.05).
Samplemmol Fe2+/gmmol TE/g
RO7.14 × 10−3 ± 3.03 × 10⁻³ a4.13 × 10−3 ± 1.63 × 10⁻³ b
HO7.50 × 10−3 ± 1.98 × 10⁻³ a4.40 × 10−3 ± 2.55 × 10⁻³ b
FO01.38 × 10−2 ± 2.60 × 10⁻³ a7.30 × 10−3 ± 2.27 × 10⁻³ b
FO241.30 × 10−2 ± 2.83 × 10⁻³ a7.70 × 10−3 ± 1.13 × 10⁻³ b
FO481.40 × 10−2 ± 2.05 × 10⁻³ a8.10 × 10−3 ± 1.27 × 10⁻³ b
P1.42 × 10−2 ± 3.18 × 10⁻³ a7.94 × 10−3 ± 1.72 × 10⁻³ b
Publisher’s Note: MDPI stays neutral with regard to jurisdictional claims in published maps and institutional affiliations.

