
Fermentation Characteristics of Rye and Sorghum Depending on Water:Feed Ratio

 , , , and
Abstract
:1. Introduction
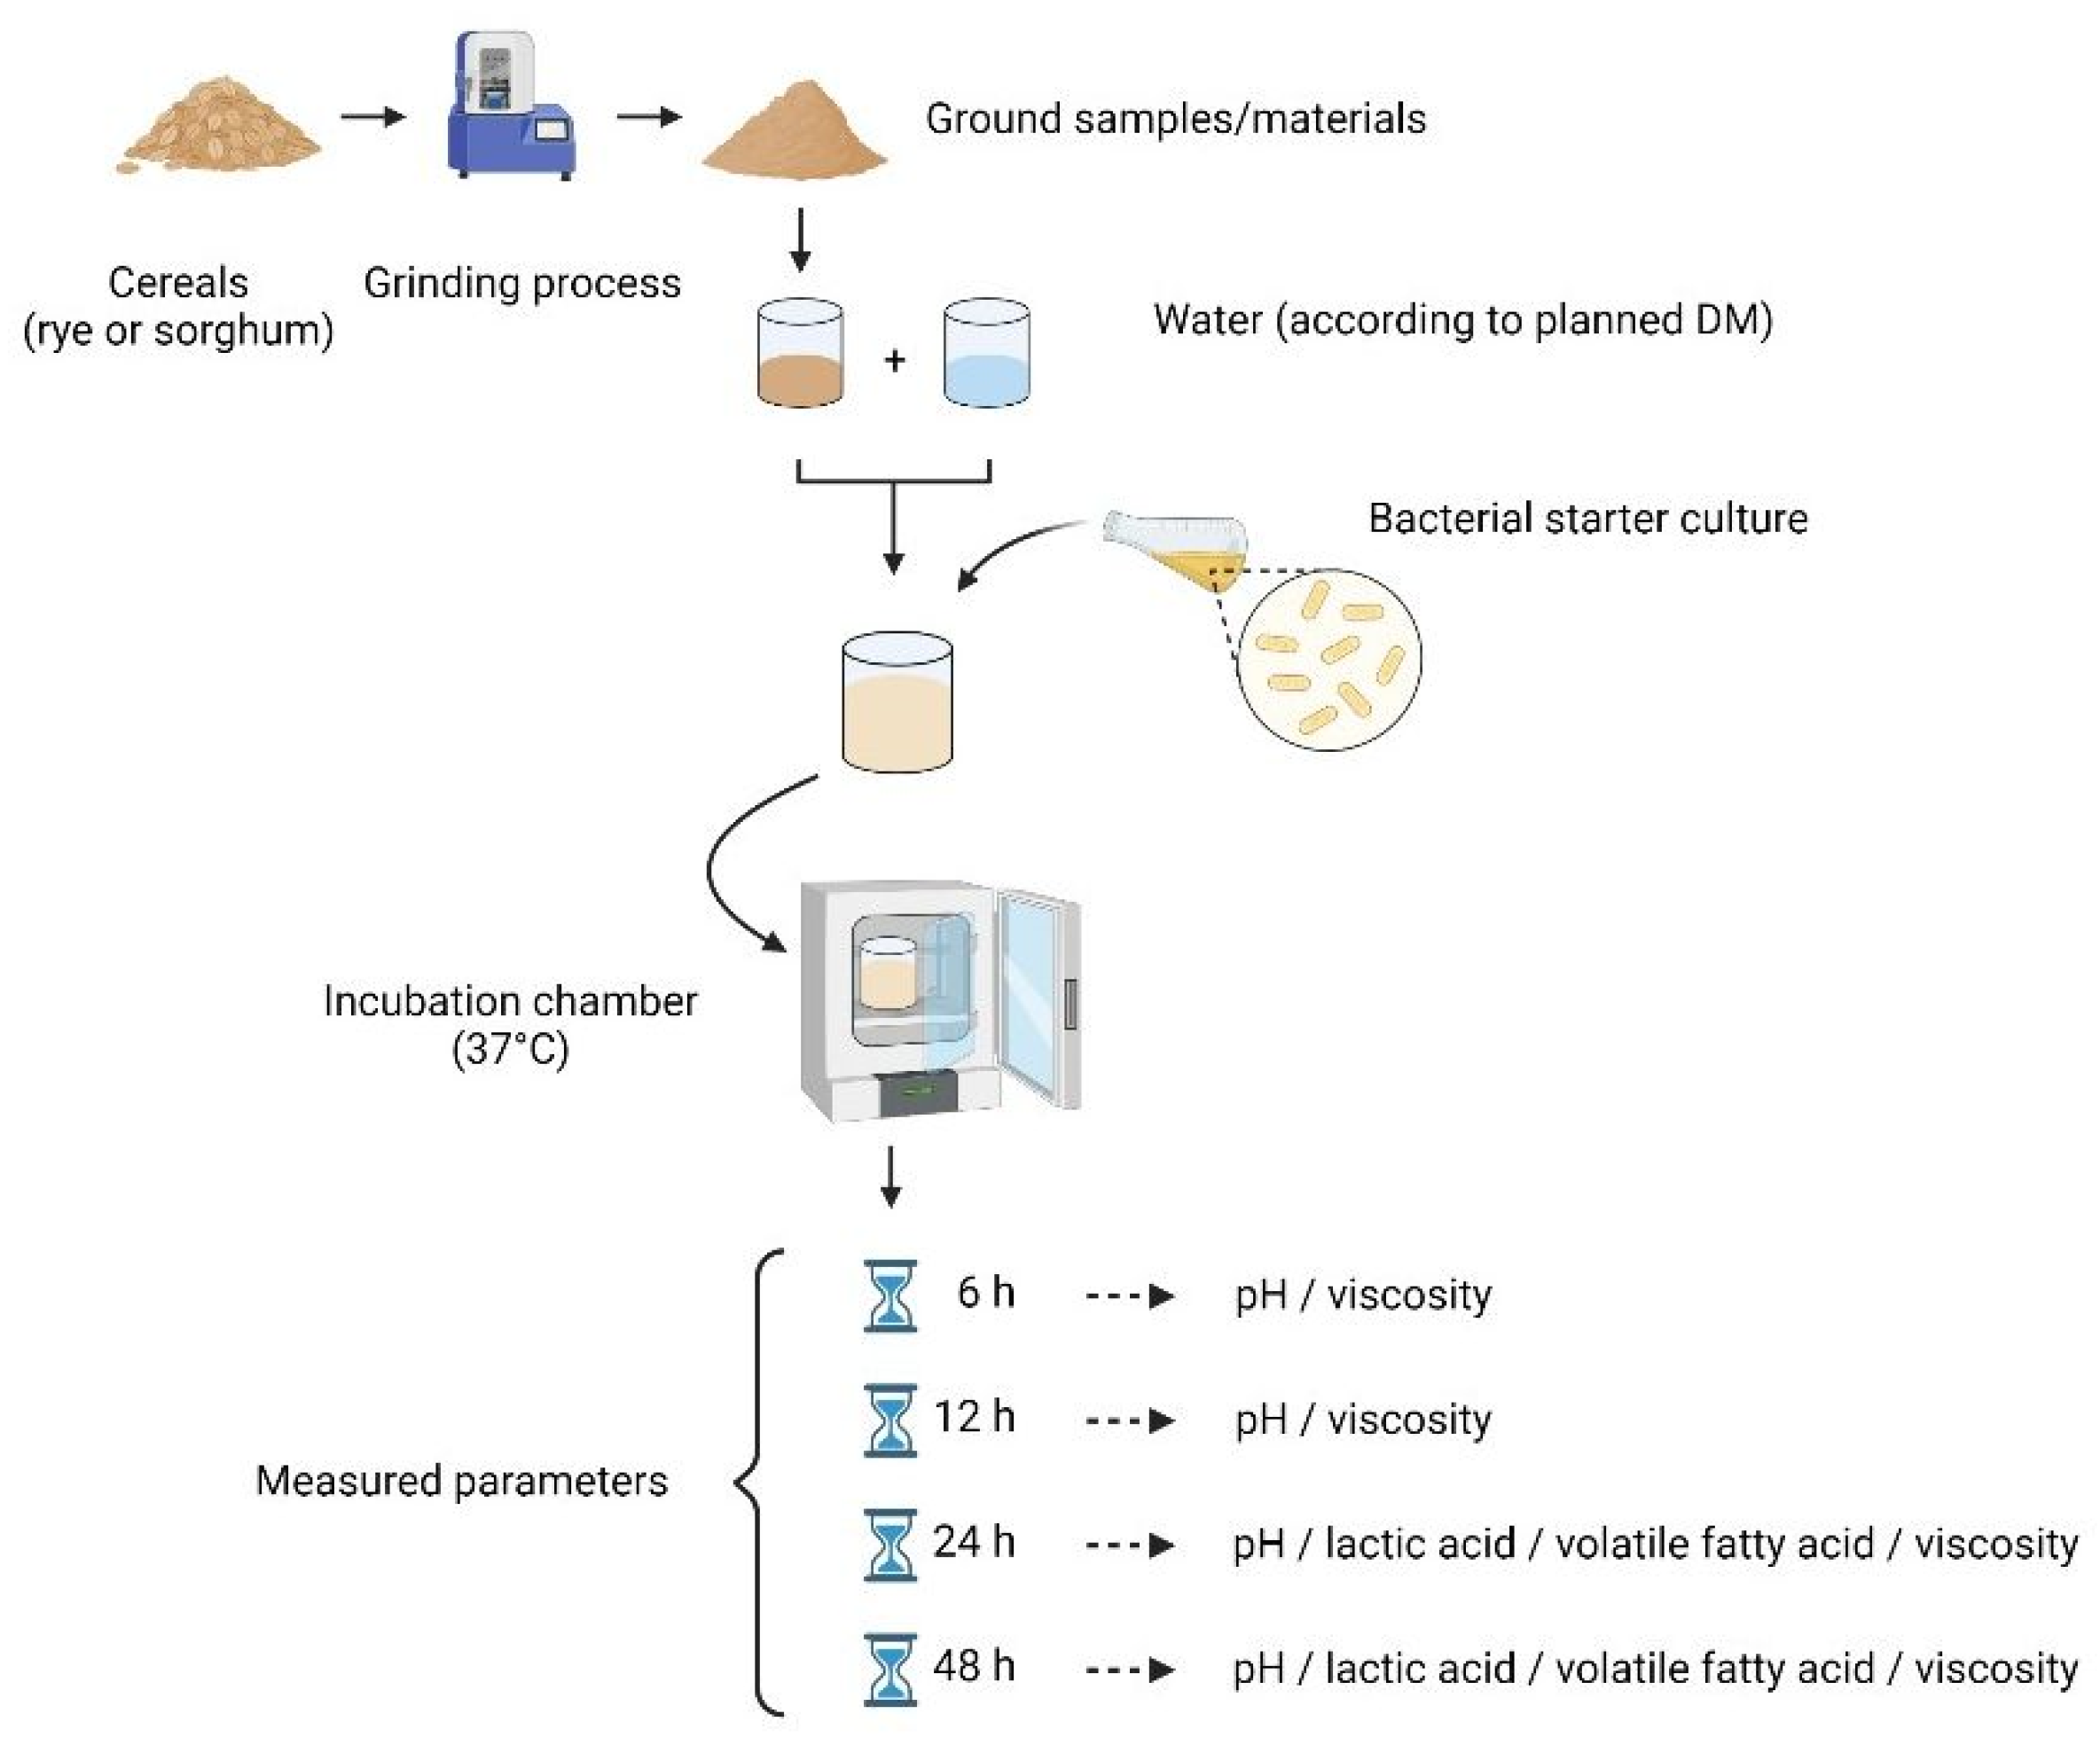
2. Materials and Methods
2.1. Samples and Grinding
2.2. Fermentation
2.3. Wet Sieve Analysis
2.4. Dry Matter and Protein Analysis
2.5. Lactic Acid Bacteria Counts
2.6. pH Value
2.7. Lactic Acid
2.8. Fatty Acid
2.9. Extract Viscosity
2.10. Scanning Electron Microscopy Analysis
2.11. Statistical Analysis
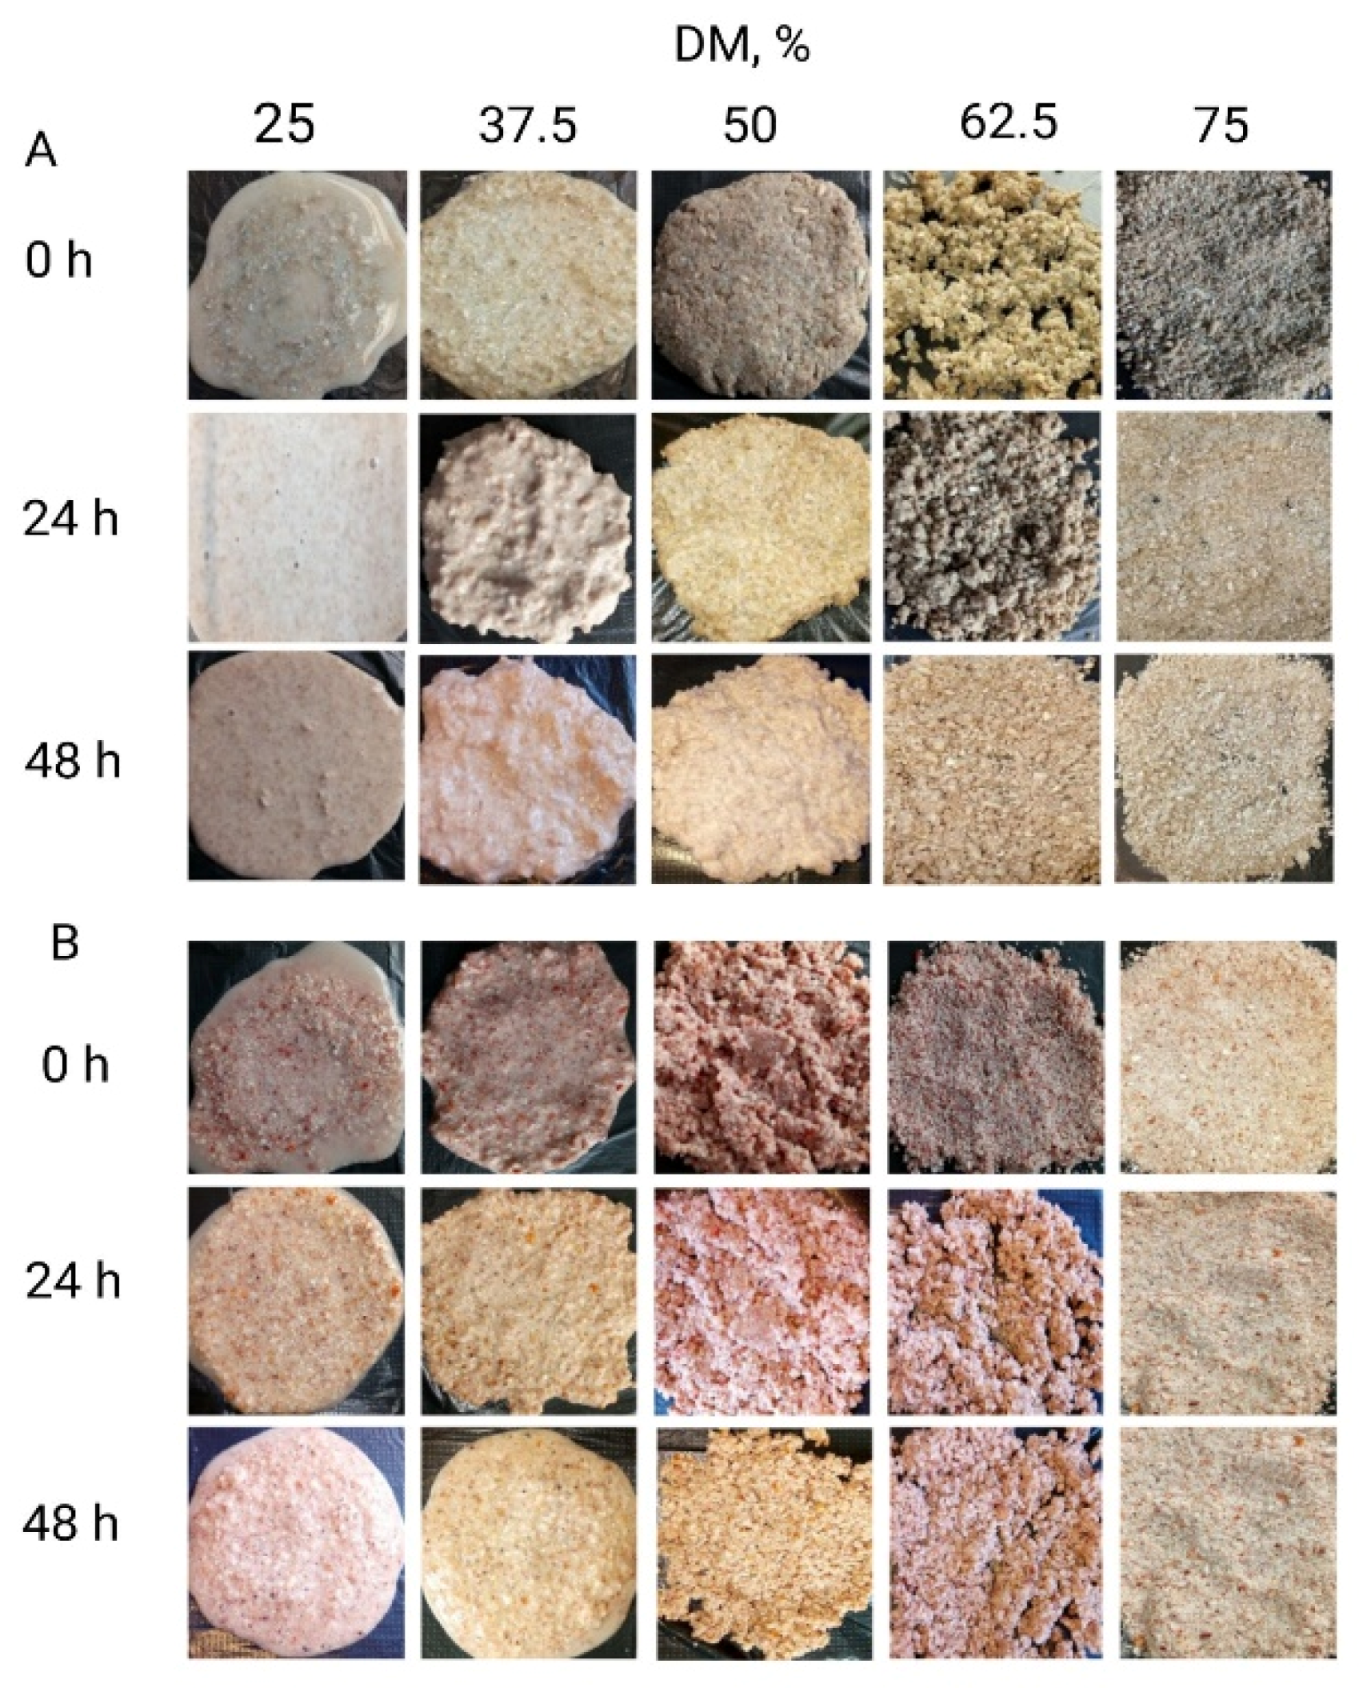
3. Results
3.1. Particle Size Distribution
3.2. Protein Content
3.3. Counting Lactic Acid Bacteria
3.4. pH Value
3.5. L-lactic Acid Content
3.6. Fatty Acid Concentrations
3.7. Viscosity
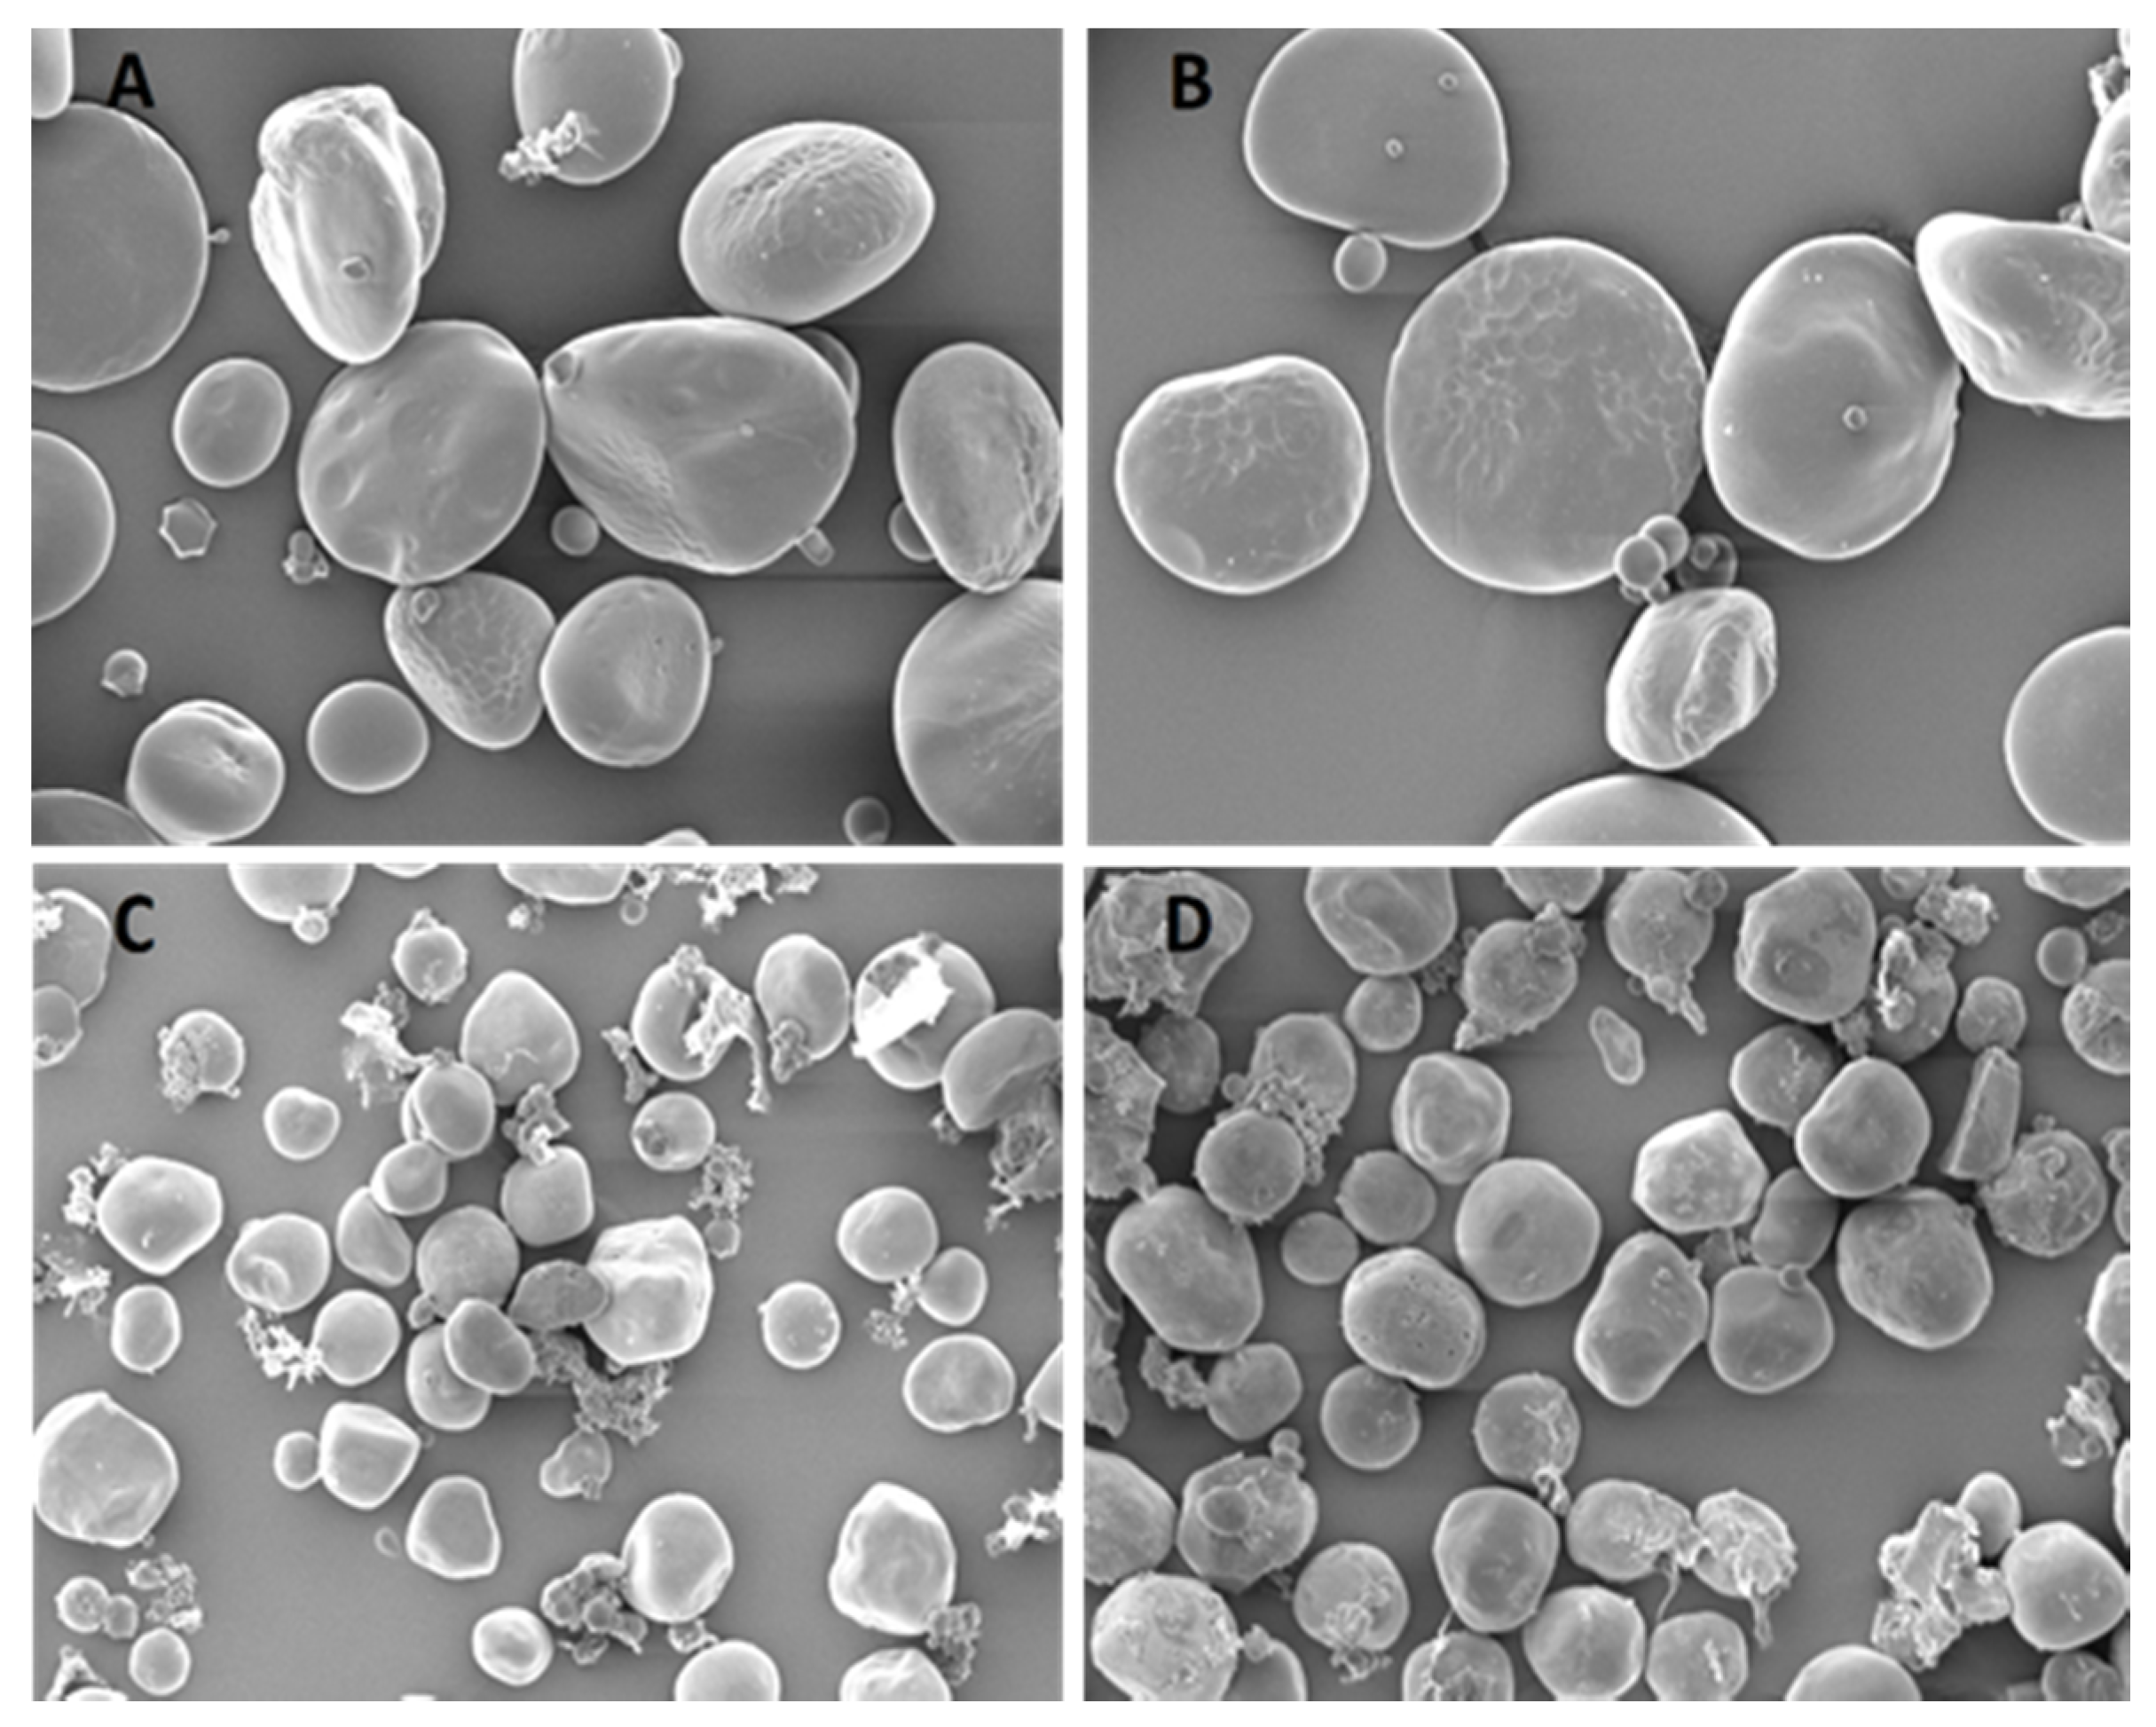
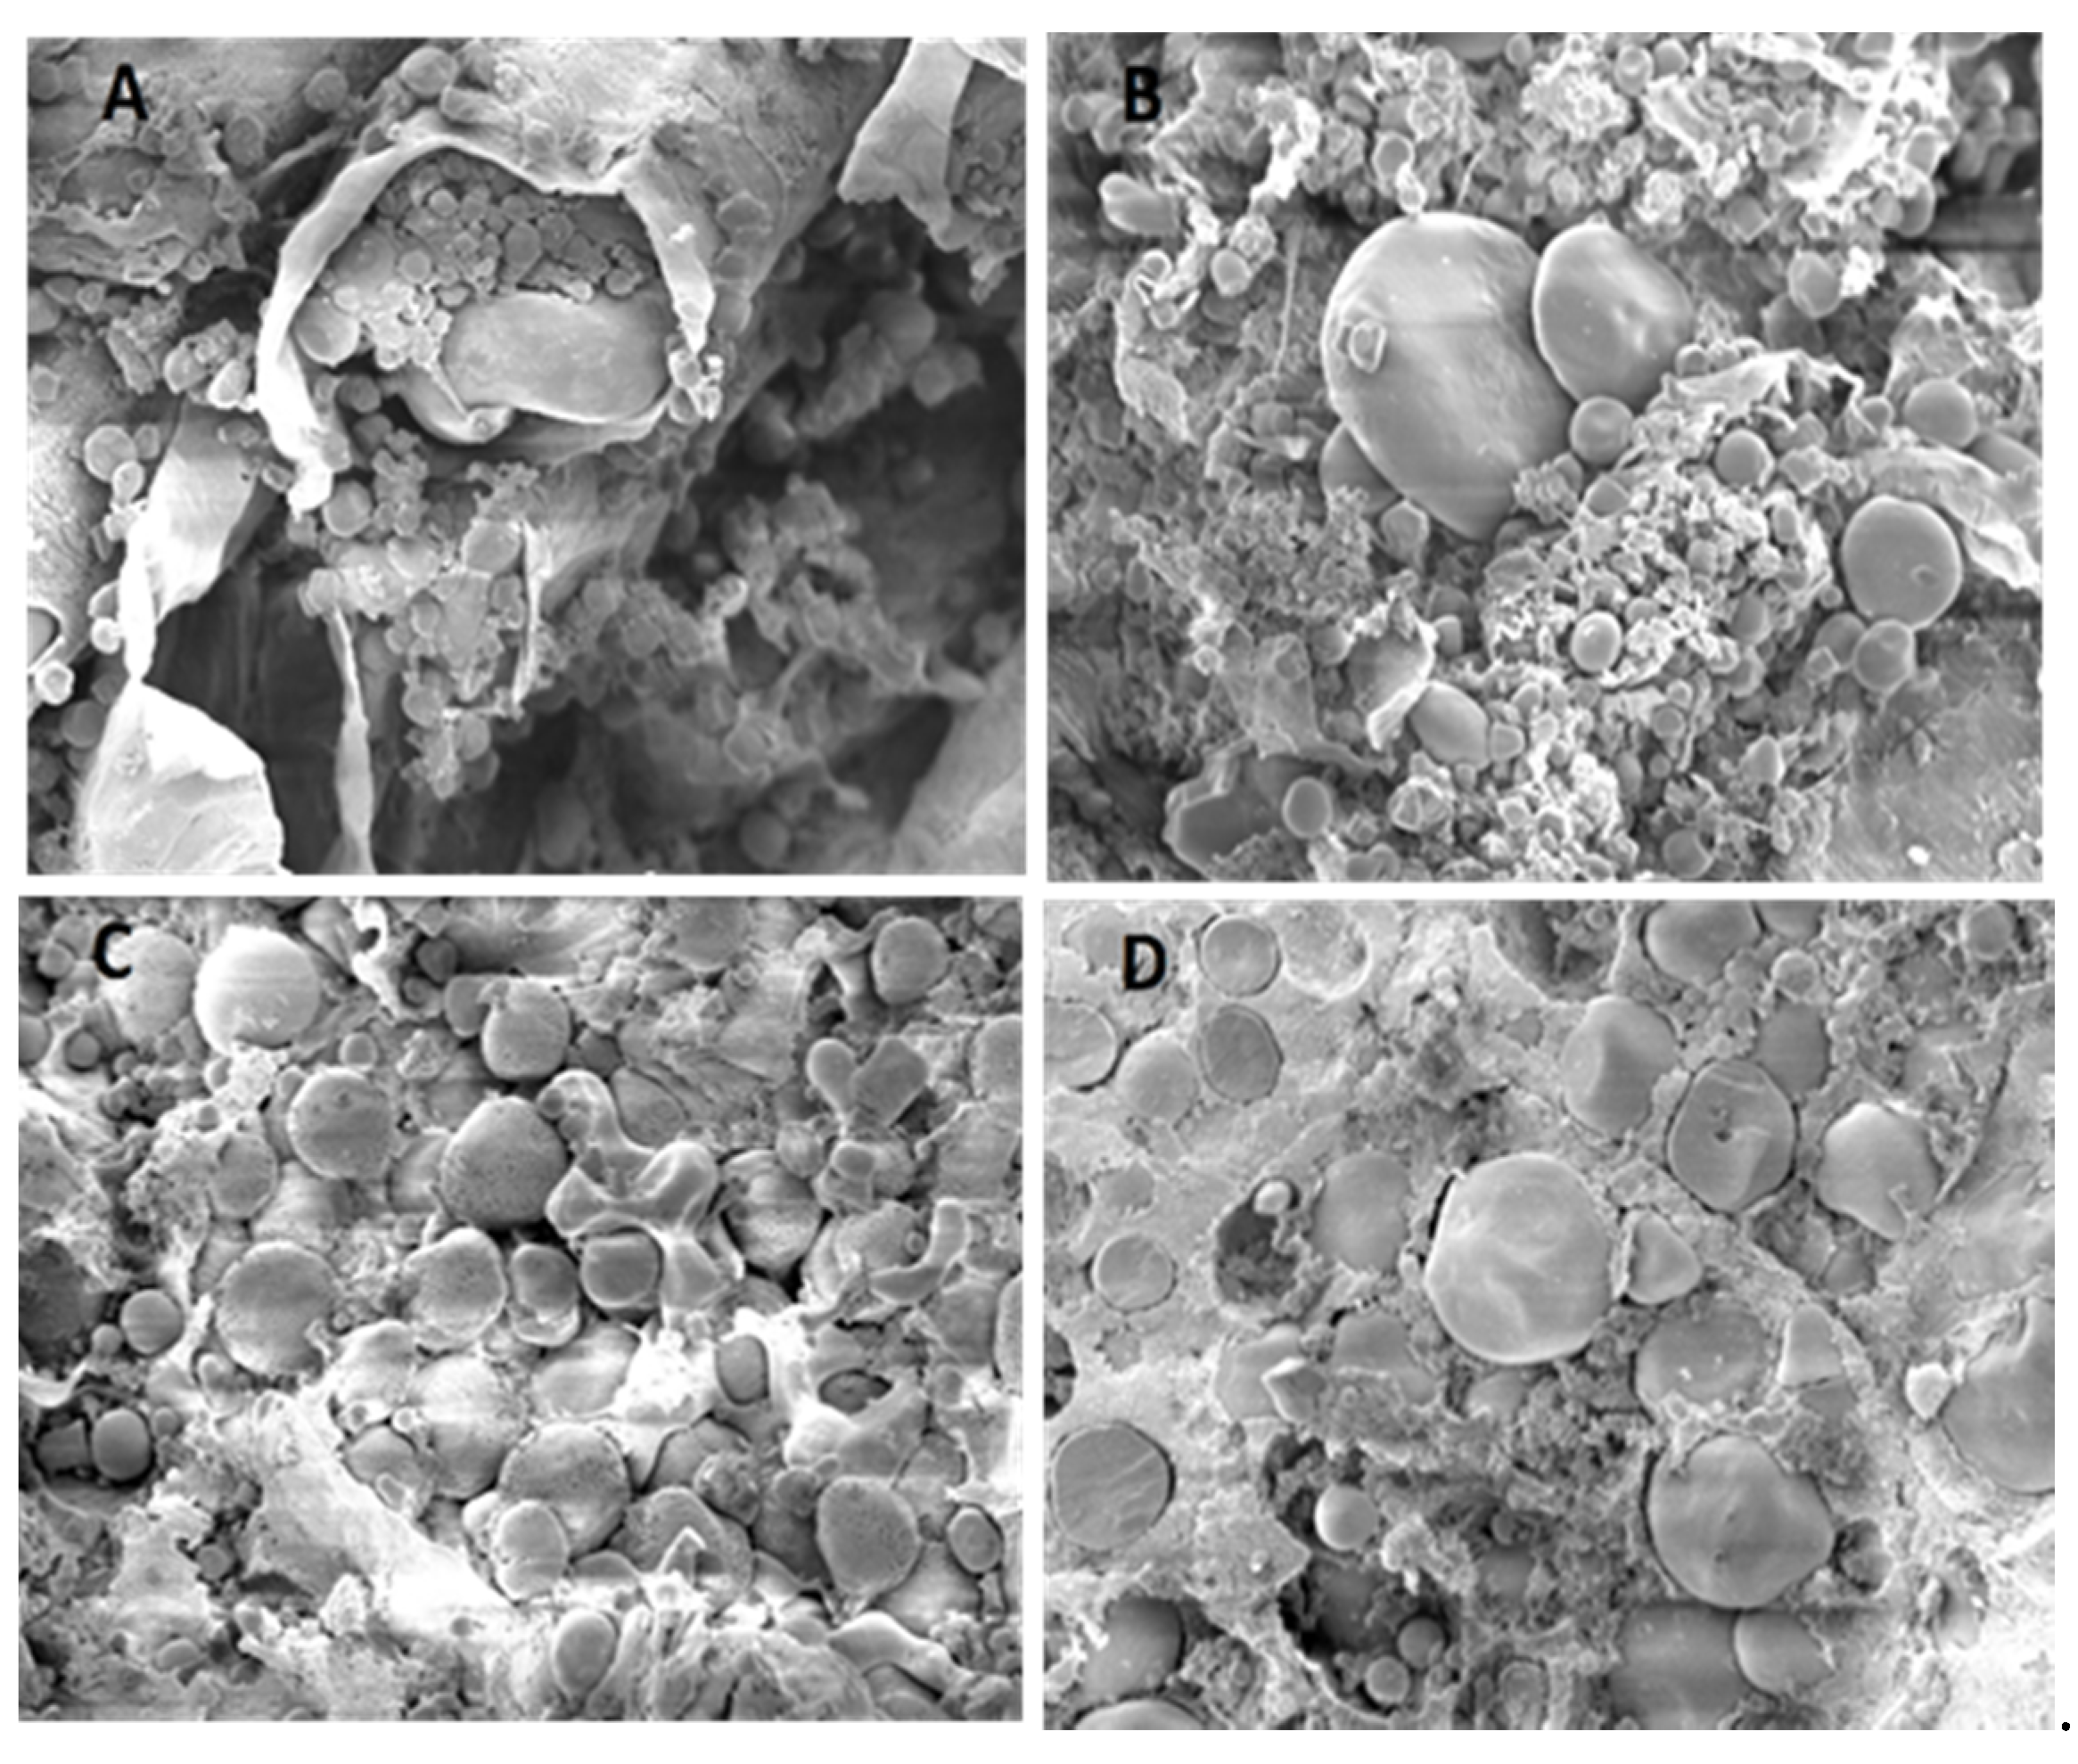
3.8. Specific Microscopic Features
4. Discussion
4.1. Particle Size and Protein Level
4.2. Fermentation Characteristics
4.3. Viscosity
4.4. Microscopic Findings
5. Conclusions
Author Contributions
Funding
Institutional Review Board Statement
Informed Consent Statement
Data Availability Statement
Acknowledgments
Conflicts of Interest
References
- Sugiharto, S.; Ranjitkar, S. Recent advances in fermented feeds towards improved broiler chicken performance, gastrointestinal tract microecology and immune responses: A review. Anim. Nutr. 2019, 5, 1–10. [Google Scholar] [CrossRef] [PubMed]
- Olukomaiya, O.O.; Fernando, C.; Mereddy, R.; Li, X.; Sultanbawa, Y. Solid-state fermented plant protein sources in the diets of broiler chickens: A review. Anim. Nutr. 2019, 5, 319–330. [Google Scholar] [CrossRef] [PubMed]
- Engberg, R.M.; Hammershj, M.; Johansen, N.F.; Abousekken, M.S.; Steenfeldt, S.; Jensen, B.B. Fermented feed for laying hens: Effects on egg production, egg quality, plumage condition and composition and activity of the intestinal microflora. Br. Poult. Sci. 2009, 50, 228–239. [Google Scholar] [CrossRef] [PubMed]
- Waters, D.M.; Mauch, A.; Coffey, A.; Arendt, E.K.; Zannini, E. Lactic acid bacteria as a cell factory for the delivery of functional biomolecules and ingredients in cereal-based beverages: A review. Crit. Rev. Food Sci. Nutr. 2014, 55, 503–520. [Google Scholar] [CrossRef] [PubMed]
- Marco, M.L.; Heeney, D.; Binda, S.; Cifelli, C.J.; Cotter, P.D.; Foligné, B.; Gänzle, M.; Kort, R.; Pasin, G.; Pihlanto, A.; et al. Health benefits of fermented foods: Microbiota and beyond. Curr. Opin. Biotechnol. 2017, 44, 94–102. [Google Scholar] [CrossRef] [PubMed]
- Kårlund, A.; Gómez-Gallego, C.; Korhonen, J.; Palo-Oja, O.-M.; El-Nezami, H.; Kolehmainen, M. Harnessing microbes for sustainable development: Food fermentation as a tool for improving the nutritional quality of alternative protein sources. Nutrients 2020, 12, 1020. [Google Scholar] [CrossRef] [PubMed] [Green Version]
- Zentek, J.; Boroojeni, F.G. (Bio)Technological processing of poultry and pig feed: Impact on the composition, digestibility, anti-nutritional factors and hygiene. Anim. Feed Sci. Technol. 2020, 268, 114576. [Google Scholar] [CrossRef]
- Canibe, N.; Jensen, B.B. Fermented liquid feed—Microbial and nutritional aspects and impact on enteric diseases in pigs. Anim. Feed Sci. Technol. 2012, 173, 17–40. [Google Scholar] [CrossRef]
- Van Winsen, R.L.; Urlings, B.A.P.; Lipman, L.J.A.; Snijders, J.M.A.; Keuzenkamp, D.; Verheijden, J.H.M.; van Knapen, F. Effect of fermented feed on the microbial population of the gastrointestinal tracts of pigs. Appl. Environ. Microbiol. 2001, 67, 3071–3076. [Google Scholar] [CrossRef] [PubMed] [Green Version]
- Qin, L.; Liu, L.; Zeng, A.-P.; Wei, D. From low-cost substrates to Single Cell Oils synthesized by oleaginous yeasts. Bioresour. Technol. 2017, 245, 1507–1519. [Google Scholar] [CrossRef]
- Yu, Z.; Dong, B.; Lu, W. Dynamics of bacterial community in solid-state fermented feed revealed by 16S rRNA. Lett. Appl. Microbiol. 2009, 49, 166–172. [Google Scholar] [CrossRef] [PubMed]
- Bintsis, T. Lactic acid bacteria as starter cultures: An update in their metabolism and genetics. AIMS Microbiol. 2018, 4, 665–684. [Google Scholar] [CrossRef]
- Gous, P.W.; Fox, G.P. Review: Amylopectin synthesis and hydrolysis; Understanding isoamylase and limit dextrinase and their impact on starch structure on barley (Hordeum vulgare) quality. Trends Food Sci. Technol. 2017, 62, 23–32. [Google Scholar] [CrossRef] [Green Version]
- Yu, W.; Quek, W.P.; Li, C.; Gilbert, R.G.; Fox, G.P. Effects of the starch molecular structures in barley malts and rice adjuncts on brewing performance. Fermentation 2018, 4, 103. [Google Scholar] [CrossRef] [Green Version]
- Bederska-Łojewska, D.; Świątkiewicz, S.; Arczewska-Włosek, A.; Schwarz, T. Rye non-starch polysaccharides: Their impact on poultry intestinal physiology, nutrients digestibility and performance indices—A review. Ann. Anim. Sci. 2017, 17, 351–369. [Google Scholar] [CrossRef] [Green Version]
- Rodehutscord, M.; Rückert, C.; Maurer, H.P.; Schenkel, H.; Schipprack, W.; Knudsen, K.E.B.; Schollenberger, M.; Laux, M.; Eklund, M.; Siegert, W.; et al. Variation in chemical composition and physical characteristics of cereal grains from different genotypes. Arch. Anim. Nutr. 2016, 70, 87–107. [Google Scholar] [CrossRef]
- Smits, C.H.; Annison, G. Non-starch plant polysaccharides in broiler nutrition–towards a physiologically valid approach to their determination. World Poult. Sci. J. 1996, 52, 203–221. [Google Scholar] [CrossRef]
- Ananda, G.K.S.; Myrans, H.; Norton, S.L.; Gleadow, R.; Furtado, A.; Henry, R.J. Wild sorghum as a promising resource for crop improvement. Front. Plant Sci. 2020, 11, 1108. [Google Scholar] [CrossRef]
- Awika, J.M.; Rooney, L.W.; Waniska, R.D. Properties of 3-deoxyanthocyanins from sorghum. J. Agric. Food Chem. 2004, 52, 4388–4394. [Google Scholar] [CrossRef]
- Knudsen, K.E.B. Fiber and nonstarch polysaccharide content and variation in common crops used in broiler diets. Poult. Sci. 2014, 93, 2380–2393. [Google Scholar] [CrossRef]
- Borgelt, L. Einflüsse Einer Zweistufigen Vermahlung in der Mischfutterproduktion auf die Leistung und Gesundheit von Absetzferkeln; University of Veterinary Medicine Hannover, Foundation: Hannover, Germany, 2015. [Google Scholar]
- Bunte, S.; Keller, B.; Chuppava, B.; Kamphues, J.; Visscher, C.; El-Wahab, A.A. Influence of fermented diets on in vitro survival rate of some artificially inoculated pathogens—A preliminary study. Processes 2020, 8, 1345. [Google Scholar] [CrossRef]
- Dusel, G.; Kluge, H.; Glaser, K.; Simon, O.; Hartmann, G.; Lengerken, J.; Jeroch, H. An investigation into the variability of extract viscosity of wheat-relationship with the content of non-starch-polysaccharide fractions and metabolisable energy for broiler chickens. Arch. Anim. Nutr. 1997, 50, 121–135. [Google Scholar] [CrossRef] [PubMed]
- Bertoft, E. Understanding starch structure: Recent progress. Agronomy 2017, 7, 56. [Google Scholar] [CrossRef]
- Anguita, M.; Gasa, J.; Martín-Orúe, S.M.; Pérez, J.F. Study of the effect of technological processes on starch hydrolysis, non-starch polysaccharides solubilization and physicochemical properties of different ingredients using a two-step in vitro system. Anim. Feed Sci. Technol. 2006, 129, 99–115. [Google Scholar] [CrossRef]
- Tester, R.F.; Qi, X.; Karkalas, J. Hydrolysis of native starches with amylases. Anim. Feed Sci. Technol. 2006, 130, 39–54. [Google Scholar] [CrossRef]
- Khempaka, S.; Thongkratok, R.; Okrathok, S.; Molee, W. An evaluation of cassava pulp feedstuff fermented with A. oryzae, on growth performance, nutrient digestibility and carcass quality of broilers. J. Poult. Sci. 2014, 51, 71–79. [Google Scholar] [CrossRef] [Green Version]
- Sugiharto, S.; Yudiarti, T.; Isroli, I. Haematological and biochemical parameters of broilers fed cassava pulp fermented with filamentous fungi isolated from the Indonesian fermented dried cassava. Livest. Res. Rural. Dev. 2016, 28, 1–6. [Google Scholar]
- Scholten, R.H.J.; Van Der Peet-Schwering, C.M.C.; Hartog, L.A.D.; Balk, M.; Schrama, J.W.; Verstegen, M.W.A. Fermented wheat in liquid diets: Effects on gastrointestinal characteristics in weanling piglets. J. Anim. Sci. 2002, 80, 1179–1186. [Google Scholar] [CrossRef] [Green Version]
- Canibe, N.; Jensen, B. Fermented liquid feed and fermented grain to piglets-effect on gastrointestinal ecology and growth performance. Livest. Sci. 2007, 108, 198–201. [Google Scholar] [CrossRef]
- Gänzle, M.G.; Ehmann, M.; Hammes, W.P. Modeling of growth of Lactobacillus sanfranciscensis and Candida milleri in response to process parameters of sourdough fermentation. Appl. Environ. Microbiol. 1998, 64, 2616–2623. [Google Scholar] [CrossRef] [Green Version]
- Brandt, M.J.; Hammes, W.P. Effects of process parameters on growth and metabolism of Lactobacillus sanfranciscensis and Candida humilis during rye sourdough fermentation. Eur. Food Res. Technol. 2004, 218, 333–338. [Google Scholar] [CrossRef]
- Moran, C.A.; Scholten, R.H.J.; Tricarico, J.M.; Brooks, P.H.; Verstegen, M.W.A. Fermentation of wheat: Effects of backslopping different proportions of pre-fermented wheat on the microbial and chemical composition. Arch. Anim. Nutr. 2006, 60, 158–169. [Google Scholar] [CrossRef] [PubMed]
- Niba, A.T.; Kouchika, H.; Kudi, A.C.; Beal, J.D.; Brooks, P.H. Effect of micro-organism and particle size on fermentation of sorghum and maize for poultry feed. Afr. J. Biotechnol. 2013, 12, 4147–4157. [Google Scholar]
- Niba, A.; Beal, J.; Kudi, A.; Brooks, P. Potential of bacterial fermentation as a biosafe method of improving feeds for pigs and poultry. Afr. J. Biotechnol. 2009, 8. [Google Scholar] [CrossRef]
- Tse, T.; Wiens, D.; Shen, J.; Beattie, A.; Reaney, M. Saccharomyces cerevisiae fermentation of 28 barley and 12 oat cultivars. Fermentation 2021, 7, 59. [Google Scholar] [CrossRef]
- Knudsen, K.E.B.; Jørgensen, H. Intestinal degradation of dietary carbohydrates-from birth to maturity. In Digestive Physiology of Pigs, Proceedings of the 8th Symposium, Swedish University of Agricultural Sciences, Uppsala, Sweden, 20–22 June 2000; CABI Publishing: Oxfordshire, UK, 2001. [Google Scholar]
- Izydorczyk, M.S.; Dexter, J.E. Barley β-glucans and arabinoxylans: Molecular structure, physicochemical properties, and uses in food products—A Review. Food Res. Int. 2008, 41, 850–868. [Google Scholar] [CrossRef]
- Teirlynck, E.; Bjerrum, L.; Eeckhaut, V.; Huygebaert, G.; Pasmans, F.; Haesebrouck, F.; Dewulf, J.; Ducatelle, R.; Van Immerseel, F. The cereal type in feed influences gut wall morphology and intestinal immune cell infiltration in broiler chickens. Br. J. Nutr. 2009, 102, 1453–1461. [Google Scholar] [CrossRef] [PubMed]
- Bedford, M.R.; Classen, H.L. Reduction of intestinal viscosity through manipulation of dietary rye and pentosanase concentration is effected through changes in the carbohydrate composition of the intestinal aqueous phase and results in improved growth rate and food conversion efficiency of broiler chicks. J. Nutr. 1992, 122, 560–569. [Google Scholar] [CrossRef] [PubMed]
- van Krimpen, M.M.; Torki, M.; Schokker, D. Effects of rye inclusion in grower diets on immune competence-related parameters and performance in broilers. Poult. Sci. 2017, 96, 3324–3337. [Google Scholar] [CrossRef] [PubMed]
- Meyer, D.; Weipert, D. Beeinflussung der Qualität von Weizen durch den Befall mit Fusarium culmorum. Getreide Mehl Brot (1972) 1986, 40, 35–39. [Google Scholar]
- Schwarz, P.; Casper, H.; Barr, J.; Musial, M. Impact of Fusarium head blight on malting and brewing quality of barley. In Fusarium Head Blight of Wheat and Barley; Leonard, K.J., Bushnell, W.R., Eds.; APS Press: St. Paul, MN, USA, 2003; pp. 395–419. [Google Scholar]
- Bechtel, D.; Kaleikau, L.A.; Gaines, R.; Seitz, L. The effects of Fusarium graminearum infection on wheat kernels. Cereal Chem. 1985, 62, 191–197. [Google Scholar]
- Seitz, L.M.; Bechtel, D.B. Chemical, physical, and microscopical studies of scab-infected hard red winter wheat. J. Agric. Food Chem. 1985, 33, 373–377. [Google Scholar] [CrossRef]
- Tang, H.; Watanabe, K.; Mitsunaga, T. Structure and functionality of large, medium and small granule starches in normal and waxy barley endosperms. Carbohydr. Polym. 2002, 49, 217–224. [Google Scholar] [CrossRef]


| Grain | Sieve Hole, mm/h | Experimental Groups, DM Content in % | p-Value | ||||
|---|---|---|---|---|---|---|---|
| 25 | 37.5 | 50 | 62.5 | 75 | |||
| Rye | <0.2/24 | 67.4 b ± 3.81 | 73.9 a ± 0.71 | 63.2 b ± 2.03 | 46.4 c ± 5.41 | 24.7 d ± 2.10 | <0.0001 |
| >1.0/24 | 14.3 d ± 2.50 | 17.0 d ± 0.59 | 26.9 c ± 1.46 | 38.6 b ± 3.51 | 49.8 a ± 2.75 | <0.0001 | |
| Sorghum | <0.2/24 | 22.3 ab ± 2.72 | 22.1 ab ± 3.60 | 19.5 ab ± 0.99 | 24.2 a ± 2.65 | 17.5 b ± 3.32 | <0.0240 |
| >1.0/24 | 24.8 ab ± 2.83 | 22.1 b ± 1.67 | 27.9 a ± 0.60 | 21.1 b ± 2.45 | 27.3 a ± 1.28 | <0.0010 | |
| Grain | Time, h | Experimental Groups, DM Content in % | p-Value | ||||
|---|---|---|---|---|---|---|---|
| 25 | 37.5 | 50 | 62.5 | 75 | |||
| Rye | 24 | 105 a ± 1.95 | 106 a ± 1.48 | 105 a ± 0.72 | 104 a ± 0.33 | 106 a ± 1.51 | 0.0913 |
| 48 | 106 a ± 1.51 | 106 ab ± 1.14 | 106 ab ± 0.66 | 104 b ± 0.53 | 107 a ± 0.66 | 0.0031 | |
| Sorghum | 24 | 132 a ± 4.25 | 129 ab ± 1.88 | 126 b ± 1.05 | 128 ab ± 0.97 | 128 ab ± 1.66 | 0.0428 |
| 48 | 132 a ± 2.97 | 131 a ± 0.82 | 129 a ± 0.41 | 129 a ± 0.96 | 131 a ± 2.10 | 0.0934 | |
| Grain | Time, h | Experimental Groups, DM Content in % | p-Value | ||||
|---|---|---|---|---|---|---|---|
| 25 | 37.5 | 50 | 62.5 | 75 | |||
| Rye | 24 | 8.93 a ± 0.08 | 9.02 a ± 0.07 | 9.10 a ± 0.06 | 8.98 a ± 0.12 | 7.15 b ± 1.51 | <0.0001 |
| 48 | 9.03 a ± 0.17 | 9.07 a ± 0.07 | 9.21 a ± 0.03 | 9.42 a ± 0.12 | 6.32 b ± 0.66 | <0.0001 | |
| Sorghum | 24 | 8.94 a ± 0.03 | 9.17 a ± 0.01 | 9.21 a ± 0.06 | 9.22 a ± 0.05 | 5.93 b ± 0.50 | <0.0001 |
| 48 | 8.77 a ± 0.10 | 8.90 a ± 0.18 | 8.86 a ± 0.11 | 9.21 a ± 0.13 | 6.38 b ± 0.66 | <0.0001 | |
| Grain | Time, h n = 4 | Experimental Groups, DM Content in % | p-Value | ||||
|---|---|---|---|---|---|---|---|
| 25 | 37.5 | 50 | 62.5 | 75 | |||
| Rye | 6 | 6.13 c ± 0.01 | 6.14 bc ± 0.02 | 6.17 b ± 0.03 | 6.48 a ± 0.01 | 6.49 a ± 0.01 | <0.001 |
| 12 | 4.55 c ± 0.35 | 4.16 d ± 0.10 | 5.36 b ± 0.21 | 6.27 a ± 0.07 | 6.49 a ± 0.23 | <0.001 | |
| 24 | 3.57 d ± 0.01 | 3.75 cd ± 0.02 | 3.91 c ± 0.01 | 4.93 b ± 0.26 | 6.42 a ± 0.03 | <0.001 | |
| 48 | 3.55 e ± 0.02 | 3.67 d ± 0.01 | 3.83 c ± 0.01 | 4.24 b ± 0.10 | 6.40 a ± 0.03 | <0.001 | |
| Sorghum | 6 | 5.95 e ± 0.02 | 5.87 d ± 0.04 | 6.20 c ± 0.03 | 6.37 b ± 0.02 | 6.54 a ± 0.02 | <0.001 |
| 12 | 3.93 d ± 0.05 | 4.24 c ± 0.03 | 5.82 b ± 0.03 | 5.87 b ± 0.05 | 6.51 a ± 0.01 | <0.001 | |
| 24 | 3.77 e ± 0.01 | 3.83 d ± 0.01 | 3.99 c ± 0.01 | 4.09 b ± 0.01 | 6.38 a ± 0.06 | <0.001 | |
| 48 | 3.77 d ± 0.01 | 3.79 d ± 0.03 | 3.98 c ± 0.01 | 4.08 b ± 0.01 | 6.27 a ± 0.04 | <0.001 | |
| Grain | Time, h | Experimental Groups, DM Content in % | p-Value | ||||
|---|---|---|---|---|---|---|---|
| 25 | 37.5 | 50 | 62.5 | 75 | |||
| Rye | 24 | 18.7 a ± 0.67 | 13.9 b ± 0.77 | 9.85 c ± 1.55 | 3.75 d ± 1.04 | 0.36 e ± 0.04 | <0.0001 |
| 48 | 22.1 a ± 1.11 | 17.3 b ± 1.77 | 12.4 c ± 1.33 | 7.67 d ± 1.67 | 0.55 e ± 0.21 | <0.0001 | |
| Sorghum | 24 | 22.2 a ± 3.80 | 12.4 b ± 1.43 | 14.0 b ± 0.89 | 11.75 b ± 1.20 | 0.13 c ± 0.01 | <0.0001 |
| 48 | 24.4 a ± 2.91 | 16.5 b ± 0.75 | 15.5 bc ± 0.36 | 13.4 c ± 0.43 | 0.19 d ± 0.09 | <0.0001 | |
| Grain | Item | Time, h | Experimental Groups, DM Content in % | p-Value | ||||
|---|---|---|---|---|---|---|---|---|
| 25 | 37.5 | 50 | 62.5 | 75 | ||||
| Rye | Acetic acid | 24 | 3.02 a ± 0.52 | 0.68 b ± 0.11 | 0.27 b ± 0.18 | 0.31 b ± 0.14 | 0.31 b ± 0.04 | <0.0001 |
| 48 | 2.32 a ± 1.72 | 0.41 b ± 0.07 | 0.57 b ± 0.20 | 0.45 b ± 0.26 | 0.61 b ± 0.24 | <0.0174 | ||
| Propionic acid | 24 | ND | 0.12 a ± 0.01 | 0.04 c ± 0.03 | 0.02 bc ± 0.01 | 0.02 bc ± 0.01 | <0.0001 | |
| 48 | 0.05 ab ± 0.07 | 0.08 a ± 0.01 | 0.07 ab ± 0.03 | 0.00 b ± 0.01 | 0.00 b ± 0.00 | <0.0092 | ||
| Butyric acid | 24 | 0.72 a ± 0.32 | 0.06 b ± 0.06 | 0.01 b ± 0.01 | 0.01 b ± 0.00 | 0.01 b ± 0.01 | <0.0001 | |
| 48 | 0.37 a ± 0.45 | 0.03 a ± 0.01 | 0.04 a ± 0.01 | 0.01 a ± 0.01 | 0.01 a ± 0.00 | <0.0942 | ||
| Sorghum | Acetic acid | 24 | 1.49 a ± 0.28 | 0.72 b ± 0.14 | 0.60 b ± 0.10 | 0.49 b ± 0.10 | 0.16 c ± 0.02 | <0.0001 |
| 48 | 1.97 a ± 0.37 | 1.30 b ± 0.17 | 0.87 c ± 0.15 | 0.61 c ± 0.10 | 0.23 d ± 0.01 | <0.0001 | ||
| Propionic acid | 24 | 0.04 cd ± 0.01 | 0.07 ab ± 0.01 | 0.10 a ± 0.01 | 0.06 bc ± 0.01 | 0.02 d ± 0.00 | <0.0001 | |
| 48 | 0.04 c ± 0.01 | 0.05 b ± 0.01 | 0.10 a ± 0.00 | 0.07 b ± 0.00 | 0.02 d ± 0.00 | <0.0001 | ||
| Butyric acid | 24 | 0.08 a ± 0.04 | 0.04 b ± 0.01 | 0.01 b ± 0.01 | ND | ND | <0.0003 | |
| 48 | 0.12 a ± 0.03 | 0.07 b ± 0.02 | 0.00 c ± 0.00 | ND | ND | <0.0001 | ||
| Grain | Time, h | Experimental Groups, DM Content in % | p-Value | ||||
|---|---|---|---|---|---|---|---|
| 25 | 37.5 | 50 | 62.5 | 75 | |||
| Rye | 6 | 3.59 bc ± 0.28 | 3.62 bc ± 0.12 | 3.37 c ± 0.42 | 4.18 ab ± 0.28 | 4.62 a ± 0.29 | <0.0001 |
| 12 | 1.72 e ± 0.10 | 2.54 c ± 0.11 | 2.12 d ± 0.05 | 3.10 b ± 0.17 | 4.65 a ± 0.11 | <0.0001 | |
| 24 | 1.52 d ± 0.07 | 1.55 d ± 0.02 | 1.90 c ± 0.04 | 3.01 b ± 0.15 | 4.65 a ± 0.09 | <0.0001 | |
| 48 | 1.38 c ± 0.15 | 1.41 c ± 0.05 | 1.65 c ± 0.06 | 2.32 b ± 0.26 | 4.61 a ± 0.13 | <0.0001 | |
| Sorghum | 6 | 0.99 b ± 0.06 | 1.02 b ± 0.05 | 1.11 a ± 0.10 | 1.16 ab ± 0.09 | 1.31 a ± 0.13 | <0.0008 |
| 12 | 0.97 b ± 0.02 | 1.00 b ± 0.07 | 1.07 b ± 0.02 | 1.07 b ± 0.02 | 1.31 a ± 0.13 | <0.0005 | |
| 24 | 0.96 b ± 0.02 | 0.98 b ± 0.06 | 1.03 b ± 0.02 | 1.05 b ± 0.05 | 1.26 a ± 0.08 | <0.0001 | |
| 48 | 0.96 b ± 0.03 | 0.98 b ± 0.07 | 0.98 b ± 0.06 | 1.00 b ± 0.01 | 1.21 a ± 0.08 | <0.0001 | |
Publisher’s Note: MDPI stays neutral with regard to jurisdictional claims in published maps and institutional affiliations. |
© 2022 by the authors. Licensee MDPI, Basel, Switzerland. This article is an open access article distributed under the terms and conditions of the Creative Commons Attribution (CC BY) license (https://creativecommons.org/licenses/by/4.0/).
Share and Cite
Osman, A.; Hartung, C.B.; Lingens, J.B.; Rohn, K.; Schreiner, T.; Ahmed, M.F.E.; Hankel, J.; Abd El-Wahab, A.; Visscher, C. Fermentation Characteristics of Rye and Sorghum Depending on Water:Feed Ratio. Fermentation 2022, 8, 155. https://doi.org/10.3390/fermentation8040155
Osman A, Hartung CB, Lingens JB, Rohn K, Schreiner T, Ahmed MFE, Hankel J, Abd El-Wahab A, Visscher C. Fermentation Characteristics of Rye and Sorghum Depending on Water:Feed Ratio. Fermentation. 2022; 8(4):155. https://doi.org/10.3390/fermentation8040155
Chicago/Turabian StyleOsman, Ahmed, Clara Berenike Hartung, Jan Berend Lingens, Kerstin Rohn, Tom Schreiner, Marwa Fawzy Elmetwaly Ahmed, Julia Hankel, Amr Abd El-Wahab, and Christian Visscher. 2022. "Fermentation Characteristics of Rye and Sorghum Depending on Water:Feed Ratio" Fermentation 8, no. 4: 155. https://doi.org/10.3390/fermentation8040155
APA StyleOsman, A., Hartung, C. B., Lingens, J. B., Rohn, K., Schreiner, T., Ahmed, M. F. E., Hankel, J., Abd El-Wahab, A., & Visscher, C. (2022). Fermentation Characteristics of Rye and Sorghum Depending on Water:Feed Ratio. Fermentation, 8(4), 155. https://doi.org/10.3390/fermentation8040155