3.1. Simultaneous Production of Microbial Oil and Carotenoids: Screening Study
The evaluated strains were able to simultaneously produce lipids and carotenoids using the nitrogen-limited media, as shown in
Figure 2. According to
Figure 2a, the highest carotenoid production (1544.19 ± 234.78 µg/L) was attained by the strain P5, showing no significant difference with the strains Xd and L4 (1367.44 ± 144.41 and 1373.64 ± 107.01 µg/L, respectively). The lowest carotenoid production was 446.51± 27.91 µg/L by yeast P10. Conversely, the yeast Xd produced only 1.62 ± 0.26 g/L of lipids; meanwhile, the highest lipid production was obtained by the yeasts JR1 (4.31 ± 0.12 g/L) and P10 (4.03 ± 0.38 g/L). The maximum carotenoid yield (256.40 µg/g of dry biomass) was achieved by Xd, and the lower yield was 58.49 µg/g by yeast P10 (
Figure 2b). The same graph demonstrates that the highest lipid accumulation was 52.81% (P10), while Xd accumulated 30.82%, the lowest value. In this respect, the screened strains can be cataloged as oleaginous yeast due to their accumulation capacity being over 20%
w/
w [
9,
18,
44].
Although the simultaneous production in oleaginous yeast is possible, the yields obtained vary among yeast strain, culture media, and environmental parameters of fermentation [
18,
19,
49]. Glucose-based media have been used to assess the production baseline of lipids and carotenoids for oleaginous yeast [
3,
31,
49]. Lakshmidevi et al. [
3] reported an accumulation of ~40% of lipids and carotenoid yields above 200 µg/g by
R. glutinis and
R. toruloides in a glucose yeast extract mineral medium.
R. glutinis simultaneously produced 5 g/L of lipids and 0.81 mg/L of carotenoids when glucose was used as the sole carbon source [
50]. Furthermore, the individual components of fatty acids and carotenoids in oleaginous yeast bioprocessing are affected by glucose supplementation, which promotes the accumulation of saturated fatty acids [
31]; meanwhile, the β-carotene synthesis might be increased [
49].
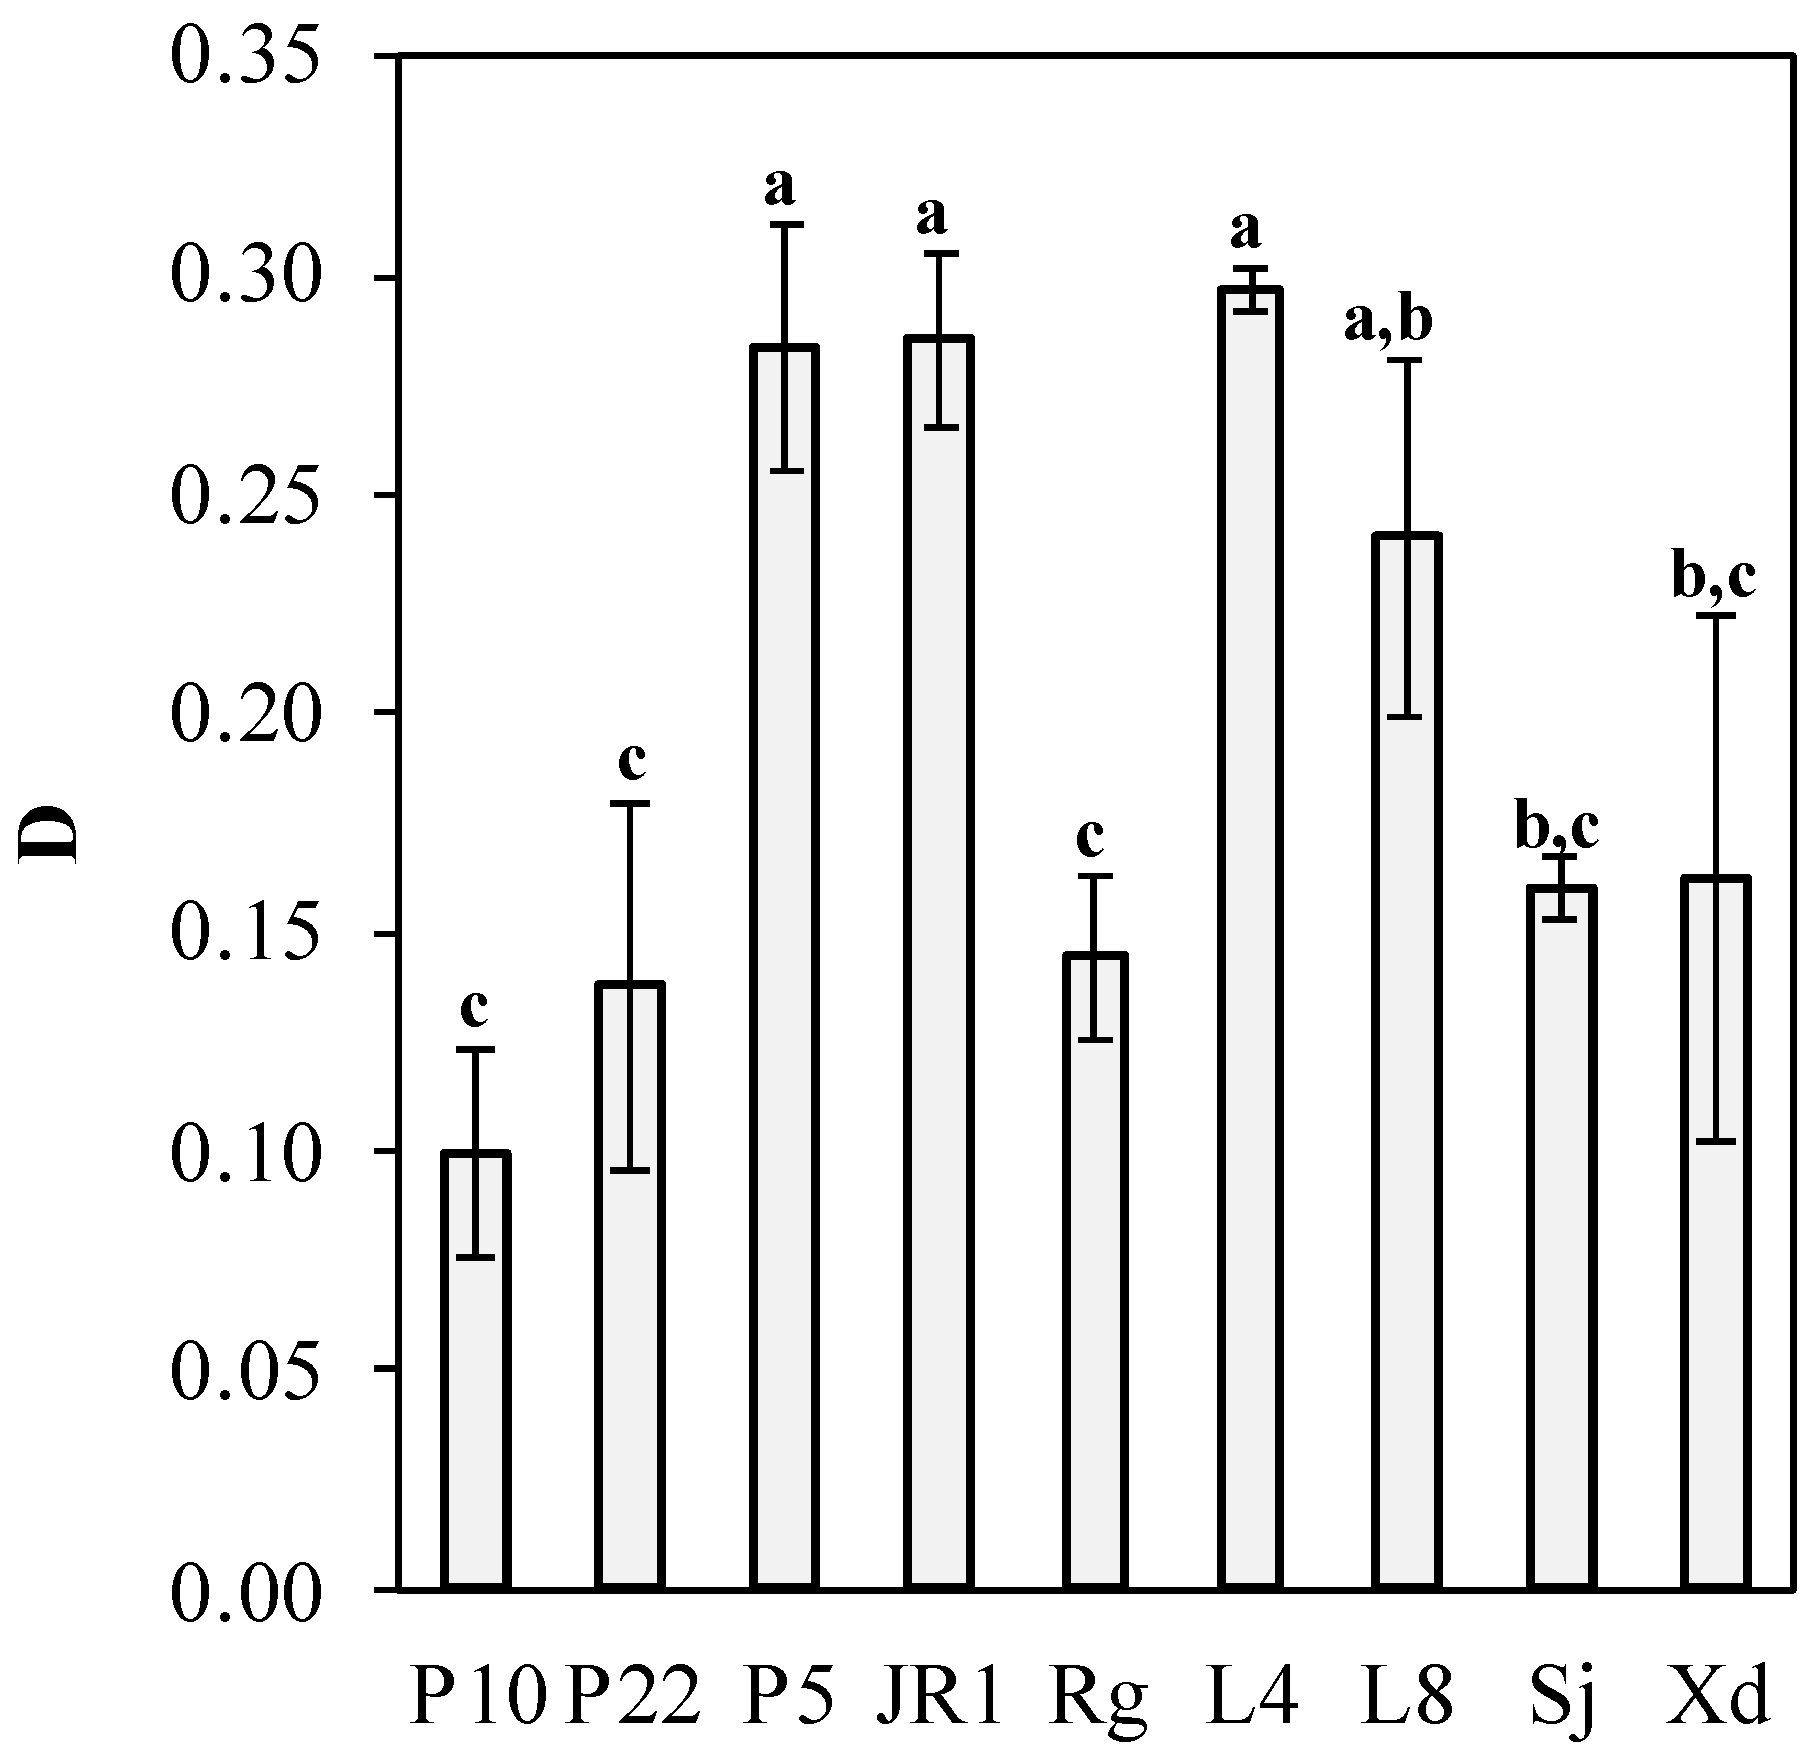
A global desirability function was used to select the yeast with the greatest potential for the simultaneous production of MO and carotenoids. The results can be visualized in
Figure 3. Considering that the weights in the function were the same for all responses (P, Y
P/X, L, Y
L/X), the strains with the best potential are P5, L4, and JR1. In addition, there is no significant difference (
p < 0.05) between such strains. Thus, the yeasts P5 and JR1 were selected for their higher carotenoid and lipid yield, respectively, to evaluate their fermentation potential in agro-food waste hydrolysates.
3.2. Agro-Food Residues Valorization as Hydrolysates
Agro-food residues characterization is shown in
Table 2. BSG had the highest protein and hemicellulose content compared to the other residues, while the highest starch content was found in PPW. The differences found in nutrimental components among agro-food residues lie in each product’s raw material and process conditions. For instance, brewery byproducts can differ depending on the beer recipe [
51,
52]; PPW is affected by process conditions such as extrusion and heating used in pasta processing, and bread waste varies due to mixtures of bakery products [
7,
53].
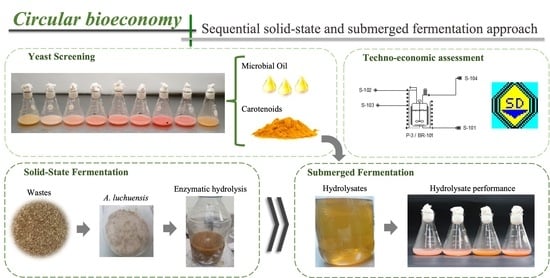
The promising advantages of a sequential solid-state and submerged fermentation have recently been reviewed to develop a circular bioeconomy and reduce processing costs [
54]. In this study, the three residues showed the potential to perform crude enzymatic hydrolysis by
A. luchuensis. The composition of total sugars and FAN of the crude hydrolysates obtained by SSF is reported in
Table 3. The higher total sugar content was measured in PPW hydrolysate (30 g/L), while the high FAN content was found in BSG hydrolysate (127.85 mg/L). The lower values of both TS and FAN were obtained in BW hydrolysate. The high starch content in the PPW resulted in the increased conversion yield of total sugar by hydrolysis. Compared to the literature, conversion yields of starch to glucose can be obtained up to 90% in rich-starch feedstock [
7,
55,
56,
57]. It has been reported that high sugar concentration in fermentation can enhance the production of MO and carotenoids [
58]; as a result, BSG, and PPW hydrolysates seem appropriate for this purpose.
Afterward, fermentations were carried out using a nitrogen-limited medium as a control. BSG and PPW hydrolysates were utilized as media with and without phosphate salts and trace elements (TE) supplementation (
Table 4). The nitrogen-limited medium was the most suitable for lipids production and lipid accumulation in both yeasts. On the other hand, better carotenoids yield, production, and productivity were found using PPW hydrolysate supplemented with medium salts by strain P5.
The effect of using phosphate salts and trace elements was previously reported by Papadaki et al. [
4], where the nitrogen source concentration in a molasses-based medium could be reduced for the joint production of MO and carotenoids by
R. toruloides. On the other hand, the incorporation of phosphate salts and TE reduced the sugar consumption rate of molasses, resulting in reduced lipid production by
R. toruloides [
8]. Therefore, the addition of these nutrients must be evaluated among the carbon source supplemented. Compared to this study’s results, the phosphate salt and TE supplementation positively affected the secondary metabolites production. Based on the above, we decided to analyze the process profitability using the nitrogen-limited media to identify the areas needing improvement or if the culture media accounts for a high percentage of processing costs.
3.3. Economic Analysis
According to the base case simulation (1.25 kg of lipids/batch and 0.5 g carotenoids/batch), annual production of 78.75 kg and 31.5 kg was achieved (
Table 5).
Results showed that the main revenue was MO due to its higher concentration in the cells than carotenoids. In such a scenario, the profitability of this bioprocess is not viable due to its negative NPV given by low ROI (10%), gross margin (5%), and the 10-year payback time. We attributed such results to the possible scheduling bottlenecks; that is, the unattractive economic parameters to investment are given by the low annual productivity of the plant due to the number of batches produced per year capacity. The batch duration was 260 h (
Figure 4a), and the cycle duration was 130 h, resulting in only 63 batches per year. The batch time is understood as the duration between the beginning of the first unit operation and the end of the last unit operation.
In contrast, the cycle time represents the interval between two consecutive batches [
59]. The annual production capacity will equal the production per batch multiplied by the number of batches executed per year. Reducing the cycle time can increase the production capacity per year because the capacity of the number of batches is inversely proportional to the cycle time of the plant. Thus, we decided to perform relevant adjustments to the simulation process to reduce the cycle time by identifying scheduling bottlenecks.
Figure 4a illustrates the equipment occupancy chart showing two consecutive batches. The light blue bars represent the first batch and the orange bars the second batch. It was observed that the bottleneck restricts the start of the second batch in using the fermenter (FR-101), that is, the equipment with the longest occupancy time. Therefore, it was decided to consider the addition of fermenters in staggered mode to increase the number of batches per year.
Adding an extra fermenter in the process did not mean a considerable increase in the payback time (6.76 years), primarily due to an observed increase in capital investment. Thus, we performed new simulations to eliminate the only identified scheduling bottleneck and increase the process throughput.
Table 5 summarizes the economic parameters obtained after adding fermenters in the bioprocess in four scenarios.
The gross margin of the evaluated scenarios adding extra fermenters ranged from 22 to 28%. In some processes, a gross margin in such ranges is considered beneficial [
29,
60]; however, it will depend on how high the investment has been. Among the most used indices for evaluating the profitability of a project are the ROI, NPV, IRR, and payback time [
61].
Regarding ROI, this was between 10 and 17%. This percentage (ROI) translates to a payback time that ranges from 10 to almost 5 years. In general, a minimum ROI value between 5 and 10% return on investment is enough to cancel a project [
62]. The shorter the payback time, the more attractive and profitable the project is because the initial investment is paid back in a shorter period. In this sense, projects with less than five years of payback can be considered profitable [
62]. Under this premise, scenario 1 would be discarded. Indeed, this will also depend on the type of industry.
In scenario 3, the number of batches per year increased up to 188. The addition of two extra fermenters (scenario 3) increased the batches per year by up to three times more than in scenario 1, which improved the profitability of the project given by the increased gross margin and ROI despite the increase in total investment. As for scenario 4, it was observed that the profitability indexes were reduced. The reason was the new scheduling bottlenecks related to downstream processing, which did not allow a significant increase in batches/year. We performed various simulations by increasing the number of pieces of equipment to eliminate identified bottlenecks. Yet, the increase in production capacity would not imply a considerable improvement in the economic indexes due to the required investment.
Thus, scenario 3 was selected for the sensitivity analysis; the equipment occupancy chart of scenario 3 showing the implementation of the staggered fermenters is presented in
Figure 4b. Accordingly, implementing extra fermenters on the upstream increases plant productivity by reducing the manufacturing cost of MO [
25,
30,
63]; however, equipment, labor, and electricity costs can increase the annual operating cost [
64].
The sensitivity analysis considered the effect of MO price (main revenue) and batch throughput on profitability and plant productivity. We contemplated a lower price range of MO than the reported in the literature (1–4 USD/g) [
23,
24,
30] and performed the simulations between a batch throughput range of 5 g and 5 kg per batch (20 g/batch increments).
The effect of MO price and batch throughput on ROI and payback time is illustrated in
Figure 5. As mentioned above, processes with less than five years of payback time are considered profitable [
62], translating to an ROI higher than 20%. Thus, it was observed that at a microbial cost lower than 2 USD/g, the process is not profitable (
Figure 5a). A selling price of USD 3 can increase ROI up to 40% at a batch throughput of 3.7; thus, the payback time can be reduced to <3 years, indicating an interesting project performance to investment (
Figure 5b).
We selected the MO price of 3 USD/g to estimate the economic equilibrium, the required batch throughput at which the annual revenues are higher than the operating costs. The break-even point is displayed in
Figure 6a.
It was observed that after a batch throughput of 0.25 kg/batch, the annual revenues are higher than the yearly costs. It was also observed that the annual revenues increased linearly with the batch throughput up to 3.45 kg/batch; meanwhile, the processing costs seem to stabilize by increasing the batch throughput. This behavior where the unit cost of production decreases with an increase in production has been reported for different bioprocesses [
29,
65,
66]. Furthermore, it was observed that after 3.65 kg/batch of production, the annual revenues do not increase, which also negatively affects the ROI. Such results are attributed to the maximum capacity of production batches per year (
Figure 6b).
If it is desired to increase the production capacity without reducing the number of batches per year, it must acquire more equipment to eliminate scheduling bottlenecks. However, as mentioned before, the investment would increase considerably.
Thus, the following results are for scenario 3 using an oil price of USD 3/g and a batch throughput of 3.7 kg/batch.
Table 6 summarizes the economic evaluation indexes to measure the process profitability. It can be observed that it is required a total investment of USD 2,268,000 and the annual revenues are USD 2,032,000 per year.
The processing cost is USD 820,000 per year; thus, the gross margin is 59.65%, representing an ROI of 40.95% and 2.44 years of payback time. At an interest rate of 7%, the net present value is USD 4,235,000. Such an economic index indicates that the process is profitable.
Primarily, the reported annual productions of MO higher than 10 kt resulted in a profitable and attractive process for investors [
23,
24,
30,
67]. Bonatsos et al. described the effect of glucose cost and annual plant capacity where it is possible to obtain a production cost of USD 4.1/kg with a plant capacity of 40 kt [
23]. Similarly, Kumar et al. obtained a 50% reduction in MO manufacturing cost when plant capacity was increased to 100 million L [
67]. In general, obtaining an ROI value higher than 20% and a short payback time (<5 years) make a profitable production of MO [
24,
30,
67]. Other key factors in the economic analysis include the equipment cost and the breakdown of raw materials in which reductions could be possible [
30].
Table 7 displays the primary equipment specification to reach a batch throughput of 3.7 kg/batch. It is clarified that most equipment capacity is calculated according to the highest demand among all the carried-out operations in each equipment. In addition, the software considers the maximum set workload (70% in the present study). If that volume exceeds the maximum volume specification, the software will assume multiple identical units (as in equipment V-103).
It is highlighted that the process requires three bioreactors of ≈1500 L working in staggered mode (including air filters and centrifugal compressors) and a seed bioreactor of ≈150 L. In this respect, it has been concluded that over 70% of the equipment purchase cost is given by bioreactors [
23,
63]; in our simulation, this cost represents 50% of the primary equipment required in scenario 3. Low-cost alternatives for fermenters are fabrication and re-design with cheaper materials than stainless steel [
30]. Another innovative way to mitigate electrical and heating power includes cultivating oleaginous yeast in raceway open-pound systems, which have been described and compared in previously reported research [
24,
68].
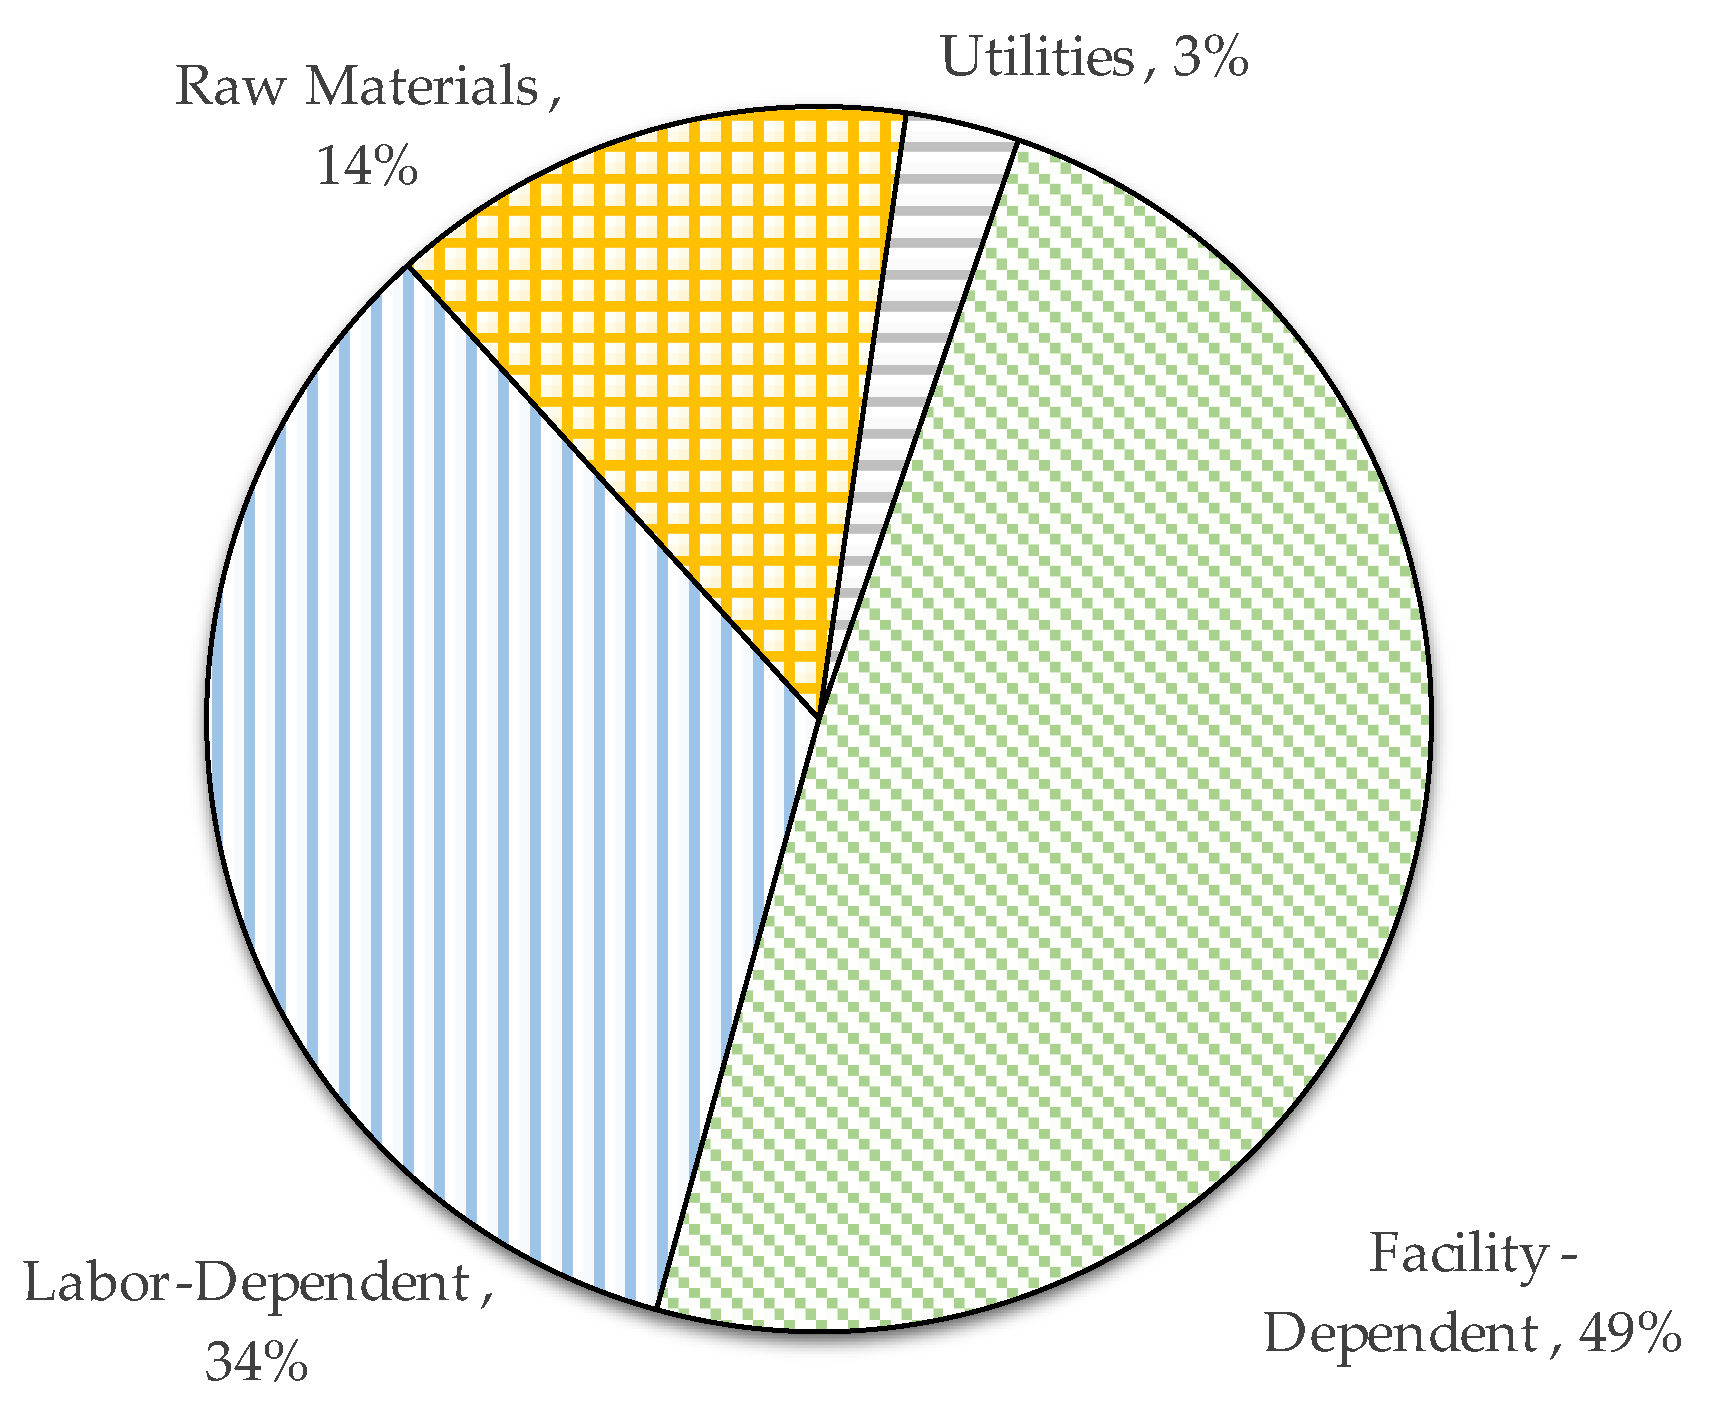
Regarding the operating costs, these are shown in
Figure 7. The major operating costs are facility-dependent (49%), followed by labor-dependent expenses (34%). The facility-dependent cost is related to the use of the facility, such as maintenance, depreciation, overhead-type fees, local taxes, and other miscellaneous costs. Such costs (labor and facility dependent) cannot be easily reduced. However, it is also observed that a high percentage of the annual operating cost is attributed to raw materials (14%).
A breakdown of the raw materials costs is presented in
Table 8. We can observe that the production medium accounts for more than 55% of the total costs related to raw materials. Such results agreed with the literature, where the fermentation media can account for up to 50% of the total production cost [
69]. Therefore, reducing media costs is feasible to increase the process profitability. Hence, utilizing agro-food residues as substrates can contribute to developing a low-cost fermentation medium in the joint production of lipids and carotenoids.
Nonetheless, feedstocks whit minimum process requirements must be selected to obtain cost-effective bioprocess [
24]. Subsequent studies will include the experimental results obtained with the utilization of agro-food waste hydrolysates for the synthesis of MO and carotenoids.


 ,
, 


