Article

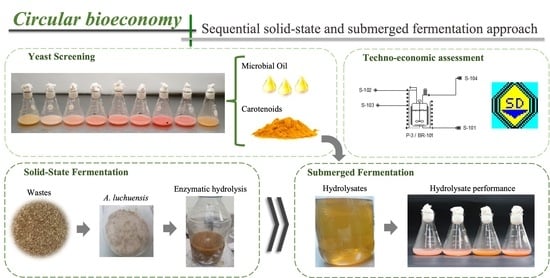
Coproduction of Microbial Oil and Carotenoids within the Circular Bioeconomy Concept: A Sequential Solid-State and Submerged Fermentation Approach

by
Miguel Ángel Villegas-Méndez
1,
Julio Montañez
1,
Juan Carlos Contreras-Esquivel
1,
Iván Salmerón
2,
Apostolis Koutinas
3 and
Lourdes Morales-Oyervides
1,*
1
Facultad de Ciencias Quimicas, Universidad Autonoma de Coahuila, Unidad Saltillo, Saltillo 25280, Coahuila, Mexico
2
School of Chemical Science, Autonomous University of Chihuahua, Circuit 1, New University Campus, Chihuahua 31125, Chihuahua, Mexico
3
Department of Food Science and Human Nutrition, Agricultural University of Athens, Iera Odos 75, 11855 Athens, Greece
*
Author to whom correspondence should be addressed.
Fermentation 2022, 8(6), 258; https://doi.org/10.3390/fermentation8060258
Submission received: 29 April 2022 / Revised: 19 May 2022 / Accepted: 20 May 2022 / Published: 28 May 2022
(This article belongs to the Special Issue The Future of Fermentation Technology in the Biorefining Process)

Abstract

:
The main objective of integrative biorefinery platforms is to propose efficient green methodologies addressed to obtain high-value compounds with low emissions through biochemical conversions. This work first screened the capacity of various oleaginous yeast to cosynthesize high-value biomolecules such as lipids and carotenoids. Selected strains were evaluated for their ability to coproduce such biocompounds in the waste-based media of agro-food (brewer’s spent grain, pasta processing waste and bakery waste). Carbon and nitrogen source feedstock was obtained through enzymatic hydrolysis of the agro-food waste, where up to 80% of total sugar/starch conversion was obtained. Then, the profitability of the bioprocess for microbial oil (MO) and carotenoids production by Sporobolomyces roseus CFGU-S005 was estimated via simulation using SuperPro Designer®. Results showed the benefits of establishing optimum equipment scheduling by identifying bottlenecks to increase profitability. Sensitivity analysis demonstrated the impact of MO price and batch throughput on process economics. A profitable process was achieved with a MO batch throughput of 3.7 kg/batch (ROI 31%, payback time 3.13 years). The results revealed areas that require further improvement to achieve a sustainable and competitive process for the microbial production of carotenoids and lipids.

Graphical Abstract

1. Introduction

The gathering of a high volume of waste generated through anthropogenic and industrial activities brings severe environmental concerns due to the conventional practice of waste disposal in landfills; in addition, huge mass increases greenhouse gas emissions and water pollution [1]. Consequently, concepts such as biorefinery, bio-based and circular economy have grown in popularity to promote sustainable processes to deal with such wastes and other challenges [2,3,4,5].
In this sense, biotechnology industries meet an excellent opportunity to increase positioning as the perfect industry to sustainable produce a wide variety of compounds via microbial synthesis [6]. Therefore, researchers’ primary objective in the process engineering field is to implement green methods to convert waste and byproducts into high-valuable chemicals [1]. The complex composition of agro-food byproducts such as wheat milling side streams, molasses, peels, and straws enables the valorization of carbon and nitrogen feedstocks for microbial platform conversion [7,8,9,10]. Thus, waste valorization offers an opportunity for bio-based products to compete in price with their chemically synthesized counterpart. Nonetheless, the biorefinery approaches top choices are expected to reconcile the two areas of sustainability and competitiveness.
Suitably, the market demands for green, sustainable, and safe additives have become the main incentive to look toward yeast biotechnology to exploit high-value compounds production, intensifying the research on pigments and microbial oil [11].
Oleaginous yeasts have been exploited recently as plausible cell factories due to their biotechnological capacity to produce a variety of added-value compounds [10,12,13] and their main advantages such as short periods of cellular growth, strain capacity to use a wide variety of substrates, no land utilization and feasibility of process scale-up [14,15,16]. The most-reported biomolecules synthesized by oleaginous yeast are lipids and carotenoids [17,18,19,20], and its concomitant production in the genus related to Rhodotorula, Rhodosporidium, and Sporobolomyces is possible due to the common precursor acetyl-coA in lipogenesis and carotenogenesis [21,22]. Remarkably, oleaginous yeast that can accumulate carotenoids become an extra value to bioprocess. However, the main challenge in industrial scaling bioprocess is the manufacturing cost determined by production yields and energy consumption [23,24,25]. The latest reports on the estimation cost of MO as an alternative for vegetable oil indicate values between USD 3–5/kg, which are not yet competitive against vegetable oils [23,24]. On the other hand, the carotenoid market value will surpass USD 2.0 billion over the coming years [26]; however, industries focus on chemical synthesis due to its economic and technical feasibility [27]. The selling price of chemically produced carotenoids might vary up to USD 3000 while biotechnological produced pigments cost could reach over USD 7000 [28].
To fulfill process efficiency evaluation, techno-economic analysis (TEA) is a practical tool to assess the project’s economic performance and identify crucial parameters for the efficient commercialization of commodities [23,24]. With process simulation, one can analyze profitability, estimate operating costs and capital investment, and identify areas needing improvement before investing. Simulators are designed to model continuous and batch processes and handle material and energy balances, equipment sizing and costing, economic evaluation, environmental impact assessment, process scheduling, and debottlenecking [23,29]. Since the process simulation allows identifying the key operational parameters, bioprocess development might be less time-consuming and provide better investment strategies [24,29,30]. Likewise, the research stresses that a cost-effective bioprocess involves selecting a strain with high production performance and the ability to adapt to extreme environmental conditions to assess the effective obtention of target metabolites [31,32].
Therefore, this work aims to select an oleaginous yeast strain for the simultaneous production of high-value and competitive biomolecules such as carotenoids and microbial oil through waste valorization as an opportunity to close the circular bioeconomy loop. The central features of the work include a multi-response approach to select strains with the ability to coproduce microbial oil and carotenoids, the agro-food waste valorization enabled by sequential solid-state-submerged bioprocess, and the techno-economic assessment for the coproduction of such compounds.

2. Materials and Methods

2.1. Raw Material Recollection

Brewer’s spent grain (BSG), pasta processing waste (PPW), and bakery waste (BW) were collected from local companies (Saltillo, Mexico). All residues were dried in a tray dehydrator (Koleff KL10, Queretaro, México) at 60 °C for 24 h; then, residues were milled (Retsch SM100, Retsch, Haan, Germany) to 2 mm diameter to conduct proximal analysis.

2.2. Microorganisms

The evaluated yeast strains for carotenoids and lipids production were provided by the collections from the Chemical Engineering Department (Faculty of Chemical Sciences, Autonomous University of Coahuila) and National University of St Agustin (Arequipa, Peru). Table 1 lists the yeast strains used for the screening experiments. Microorganisms were propagated on YM agar plates and incubated at 25 °C with different incubation times according to the pink/red colonies formation in the plate. These incubation times were established in preliminary studies (Table 1). Then a single colony was transferred in 25 mL of YM broth in a shake flask at the following conditions 25 °C, 180 rpm for 36 h.
The fungal strain Aspergillus luchuensis was kindly provided by the Glicobiotechnology laboratory (Autonomous University of Coahuila, México). Spores’ production of the fungus was carried in flasks of 250 mL using wheat bran agar (wheat bran, 5% w/v; agar, 2% w/v) incubated at 30 °C for five days.

2.3. Simultaneous Production of Microbial Oil and Carotenoids: Screening Study

Screening experiments to evaluate the potential simultaneous production of MO and carotenoids were conducted in Erlenmeyer flasks (125 mL) under submerged fermentation. For the screening experiment, a modified nitrogen-limited media was used [4,18]. The composition was the following (g/L): glucose (20.0), yeast extract (2.0), KH2PO4 (7.0), Na2HPO4 (2.5), MgSO4 (1.5), CaCl2·2H2O (0.15), FeCl3·6H2O (0.15), ZnSO4·7H2O (0.02), MnSO4·H2O (0.06). Flasks with 25 mL of medium were inoculated (10 % v/v) and incubated at 25 °C, 180 rpm for 120 h with an initial pH of 5.

2.4. Production of Agro-Industrial Waste Hydrolysates through Solid-State Fermentation

The collected residues were used as solid substrates for solid-state fermentation (SSF) with the strain A. luchuensis. Crude enzyme extract was produced following the protocol described by Tsakona et al. [33]. Concisely, 5 g of each residue (BSG, PPW, and BW) were weighed in a 250 mL flask. Then, the materials were inoculated with a fungal spore solution of 1 × 10⁸ esp/mL that was also used to adjust the moisture content up to 65%, and they were incubated for three days at 30 °C. Five flasks of each fermented substrate were suspended in 500 mL sterilized water and homogenized in a kitchen blender. The suspension was centrifugated (10,000 rpm, 10 min, 20 °C), and the supernatant was individually added to 30 g/L of BSG, PPW, and BW. The hydrolysis was carried in Duran bottles (1 L) with constant mixing by magnetic stirrers and kept at 55 °C. After 24 h, hydrolysates were filtrated using a muslin cloth; then centrifugated (10,000 rpm, 10 min, 4 °C), filtrated through 11 µm pore size, and the pH was adjusted to 5.0. The hydrolysates were evaluated in the simultaneous production of lipids and carotenoids by adjusting the initial sugar total sugar concentration to 20 g/L and supplemented with phosphate and trace elements salts.

2.5. Analytical Methods

Moisture, ash, protein, lipid, hemicellulose, cellulose, and lignin content in Agro-food byproducts were determined by AOAC protocols [34]. Starch analysis was performed according to Megazyme starch assay kit (Megazyme, Ireland) [35].
For cultures biomass determination (X, g/L), an aliquot of fermentation sample (10 mL) was centrifugated at 10,000 rpm for 5 min and 4 °C (Sigma-18KS, Osterode am Harz, Germany). Pelletized biomass was further washed twice with distilled water. Total dry weight was determined by oven-drying the washed biomass at 70 °C until constant weight. For carotenoids analysis, frozen yeast cells were disrupted using glass beads and two mL of preheated (55 °C) dimethyl sulfoxide. Then, 2 mL of each acetone, petroleum ether, and NaCl solution (20% w/v) were added to disrupted cells to obtain the carotenoid fraction. Total carotenoid content was measured in the recovered petroleum ether phase in a spectrophotometer at 450 nm (Unico UV 2150, USA). The total carotenoids were calculated using the following equation:
Y P / X = v   ×   A   ×   10 4 E 1 %   ×   m s
where YP/X = carotenoids yield (µg/g, dry weight); A = absorbance; v = volume of solvent used (mL); ms = dry cell mass (g); E1%= specific absorptivity of carotenoids in petroleum ether (2592) [36,37].
Lipid content was determined by the phospho-vanillin assay proposed by Mishra et al. with modifications [38]. An aliquot between 50–100 µL of fermentation broth was collected on centrifuge tubes, then centrifugated (9000 rpm, 4 min, 4 °C) and washed twice with distilled water. Two milliliters of concentrated H2SO4 were added to each tube; then, samples were covered and placed in hot water (100 °C) for 12 min. Samples were cooled down in an ice bath for 7 min. Five milliliters of freshly prepared phospho-vanillin reagent (vanillin, 1.2 g/L; ethanol 20 mL/L; distilled H2O, 180 mL/L; phosphoric acid, 800 mL/L) is added to each sample. Samples were incubated at 37 °C for 17 min, and absorbance was read at 530 nm. A calibration curve was prepared with canola oil as standard [38,39]. Total sugar (TS) concentration was measured using the phenol sulfuric method. Aliquots of hydrolysates and fermentation supernatants (0.5 mL) reacted with phenol (0.5 mL, 5 % w/v) and concentrated sulfuric acid (2 mL). Samples were boiled in hot water (100 °C) for 5 min and cooled down in an ice bath for 10 min; then, the absorbance was measured in a spectrophotometer at 490 nm [40]. Free amino nitrogen (FAN) was quantified using the ninhydrin assay. Briefly, the samples (1 mL) were mixed with 0.5 mL of ninhydrin color reagent (49.71 g/L Na2HPO4 2H2O, 5 g/L ninhydrin, 3 g/L fructose; pH adjusted to 6.7 using KH2PO4). Samples were boiled for 16 min in hot water (100 °C) and chilled in an ice bath for 20 min. Then, 2.5 mL of dilution reagent (2 g of KIO3 diluted in 616 mL of distilled water and 384 mL of ethanol) is added to samples, and color absorbance is detected at 570 nm [41].

2.6. Data Analysis

Evaluated responses were carotenoids (P, µg/L), lipid production (L, g/L), carotenoids yield per dry weight biomass (YP/X, µg/g), and lipid content per dry biomass (YL/X, % w/w).
Such responses were reduced to a single target by applying a “Desirability function,” allowing us to have an overall solution [42]. The measured value for each response was transformed into a dimensionless desirability value, d. The desirability lay from zero (unacceptable response) to one (ideal target). In this study, all responses were larger the better; the normalized function ( d R i ) can be expressed as:
d R i = { 0 , X R i m i n [ X R i ] m a x [ X R i ] m i n [ X R i ] 1 , ,   X R i   =   m i n [ X R i ]   m i n [ X R i ] X R i m a x [ X R i ]   X R i = m a x [ X R i ]
where X ( R i ) was the obtained value at every level of each factor studied, m i n [ X ( R i ) ] represents a value lower than the minimum obtained in the whole set of data and m a x [ X ( R i ) ] , values for each response were based on the maximum production of carotenoids and lipids reported in the literature [20,43,44,45].
The global desirability function was defined as:
D = ( i = 1 n d R i w i )
where wi, represents the importance of each response, satisfying the conditions 0 < wi < 1 and i n w i = 1 [46].
Individual responses and target desirability were analyzed with an ANOVA to test statistical differences (p < 0.05), followed by post-hoc analysis with Tukey’s test at 5% probability to define homogeneous groups.

2.7. Techno-Economic Assessment of Microbial Oil and Carotenoids

2.7.1. Simulation Description

The SuperPro Designer® (Intelligent Inc., Scotch Plains, NJ, USA) process simulator was used to assess the feasibility of industrial production of MO and carotenoids. For the analysis, it was considered that the facility is located in the north of Mexico. The construction year was 2021, as well as the year of study. A 15-year project lifetime was assumed, including 30 months for the plant to operate at 100% capacity. The startup period was four months. The operation mode was set in batch operation mode with 330 days of operation time per year, taking 35 days/year to perform maintenance work and quality control procedures in the plant.
For the base case, we considered the production of 1.25 kg of lipids (USD 4.1 per gram) and 0.5 g of carotenoids (USD 0.9 per gram) per batch.

2.7.2. Process Description

Figure 1 illustrates the process flowsheet; each piece of equipment represents a unit operation, and the streams have been tagged to aid in process description and identification.
The process was divided into three main stages: fermentation, biomass recovery, and separation of carotenoids and lipids.
The raw material, composition and their related costs, products yield, mass, and energy transfer data, cost of the equipment and services, and data for any other technical parameter such as times, temperature, and mass flows were obtained from experimental data of previous experimental stage. The separation and purification of lipids and carotenoids was considered a sequential extraction based on saponification, which was recently reported in the literature [47,48].
The upstream processing includes an inoculum propagation step in a shake flask (SFR-101) and a fermenter (R-101). The cosynthesis of carotenoids and lipids is carried out in a stirred-tank bioreactor (FR-101); the inoculum percentage was 10% (v/v). Conditions such as temperature, pH, and agitation speed (power) were used as described in Section 2.3 and Section 2.4. Media was charged into the bioreactor (FR-101) and sterilized using steam at 152 °C prior to inoculation. A maximum working volume of 70% was allowed. Airflow was set at 1.0 vvm, and a compressor (G-101) and an air filter (AF-101) were used to supply sterile air into the bioreactor (FR-101). The fermentation stoichiometry was considered using mass coefficients.
The downstream section included the recovery and purification steps [47,48]. The culture broth was pumped (PM-101) into the plate filters (PFF-101) to separate the cells from the culture broth. A disruption step was conducted by homogenization (HG-101), then the disrupted biomass was placed in a mixer tank (V-102), and ethanolic 1.1 M KOH was added to obtain a saponified extract. After separating cell debris by centrifugation (DC-101), liquid–liquid extraction was used (MSX-101) to stream carotenoids with hexane. After that, the solvent was removed by a rotatory evaporator (V-101). The fatty acid salt stream was neutralized with HCl in a vessel (V-104) then the remaining solvent was evaporated using an additional rotatory evaporator (V-102). The downstream yield was calculated with an efficiency of 80% for the carotenoid and MO.

2.7.3. Economic Evaluation

The economic evaluation included estimating total capital investment and annual operating costs. For the profitability analysis, different indicators were considered, like gross margin (%), return on investment (ROI, %), payback time (years), internal rate of return (IRR, %), and net present value (NPV, USD).
Total capital investment refers to the fixed costs associated with the process, such as fixed capital (plant equipment and facilities), working capital for paying wages and raw materials and other items that require direct payment. The software estimates the direct fixed capital investment based on the total equipment purchase cost using the following equation:
C o s t = C o ( Q Q o ) a
where Co is the base cost, Q the capacity, Qo the base capacity, and a , a fitting parameter. The prices and base capacity were based on information collected via the Alibaba platform (www.alibaba.com (accessed on 1 November 2021)) and other local suppliers. The parameter a was estimated by nonlinear regression (Microsoft Excel, 2017).
The capital investment related to raw materials, working capital, and other expenses was estimated to cover the expenses for 30 days. Regarding the operating costs, these included raw materials, facilities, and labor, and other costs such as laboratories, consumables, utilities, disposal, and other miscellaneous costs. The raw materials costs were also obtained from www.alibaba.com and local suppliers.

2.7.4. Sensitivity Analysis

As a first assessment, revenues accounted for both lipids and carotenoids sales. The plant was initially simulated based on production for a working volume in the production bioreactor (FR-101) of 1.5 m3 and a production per batch of 1.25 kg of purified lipids and 0.5 g of carotenoids. Once the results for the base-case simulation were obtained, various simulations considering the use of one or more extra equipment for unit operations that represented a bottleneck were performed.
Then after selecting the best scenario, the sensitivity analysis was carried out under different product sale prices and different levels of annual throughput (production per batch) to assess their effect on the economic indexes of the project.

3. Results

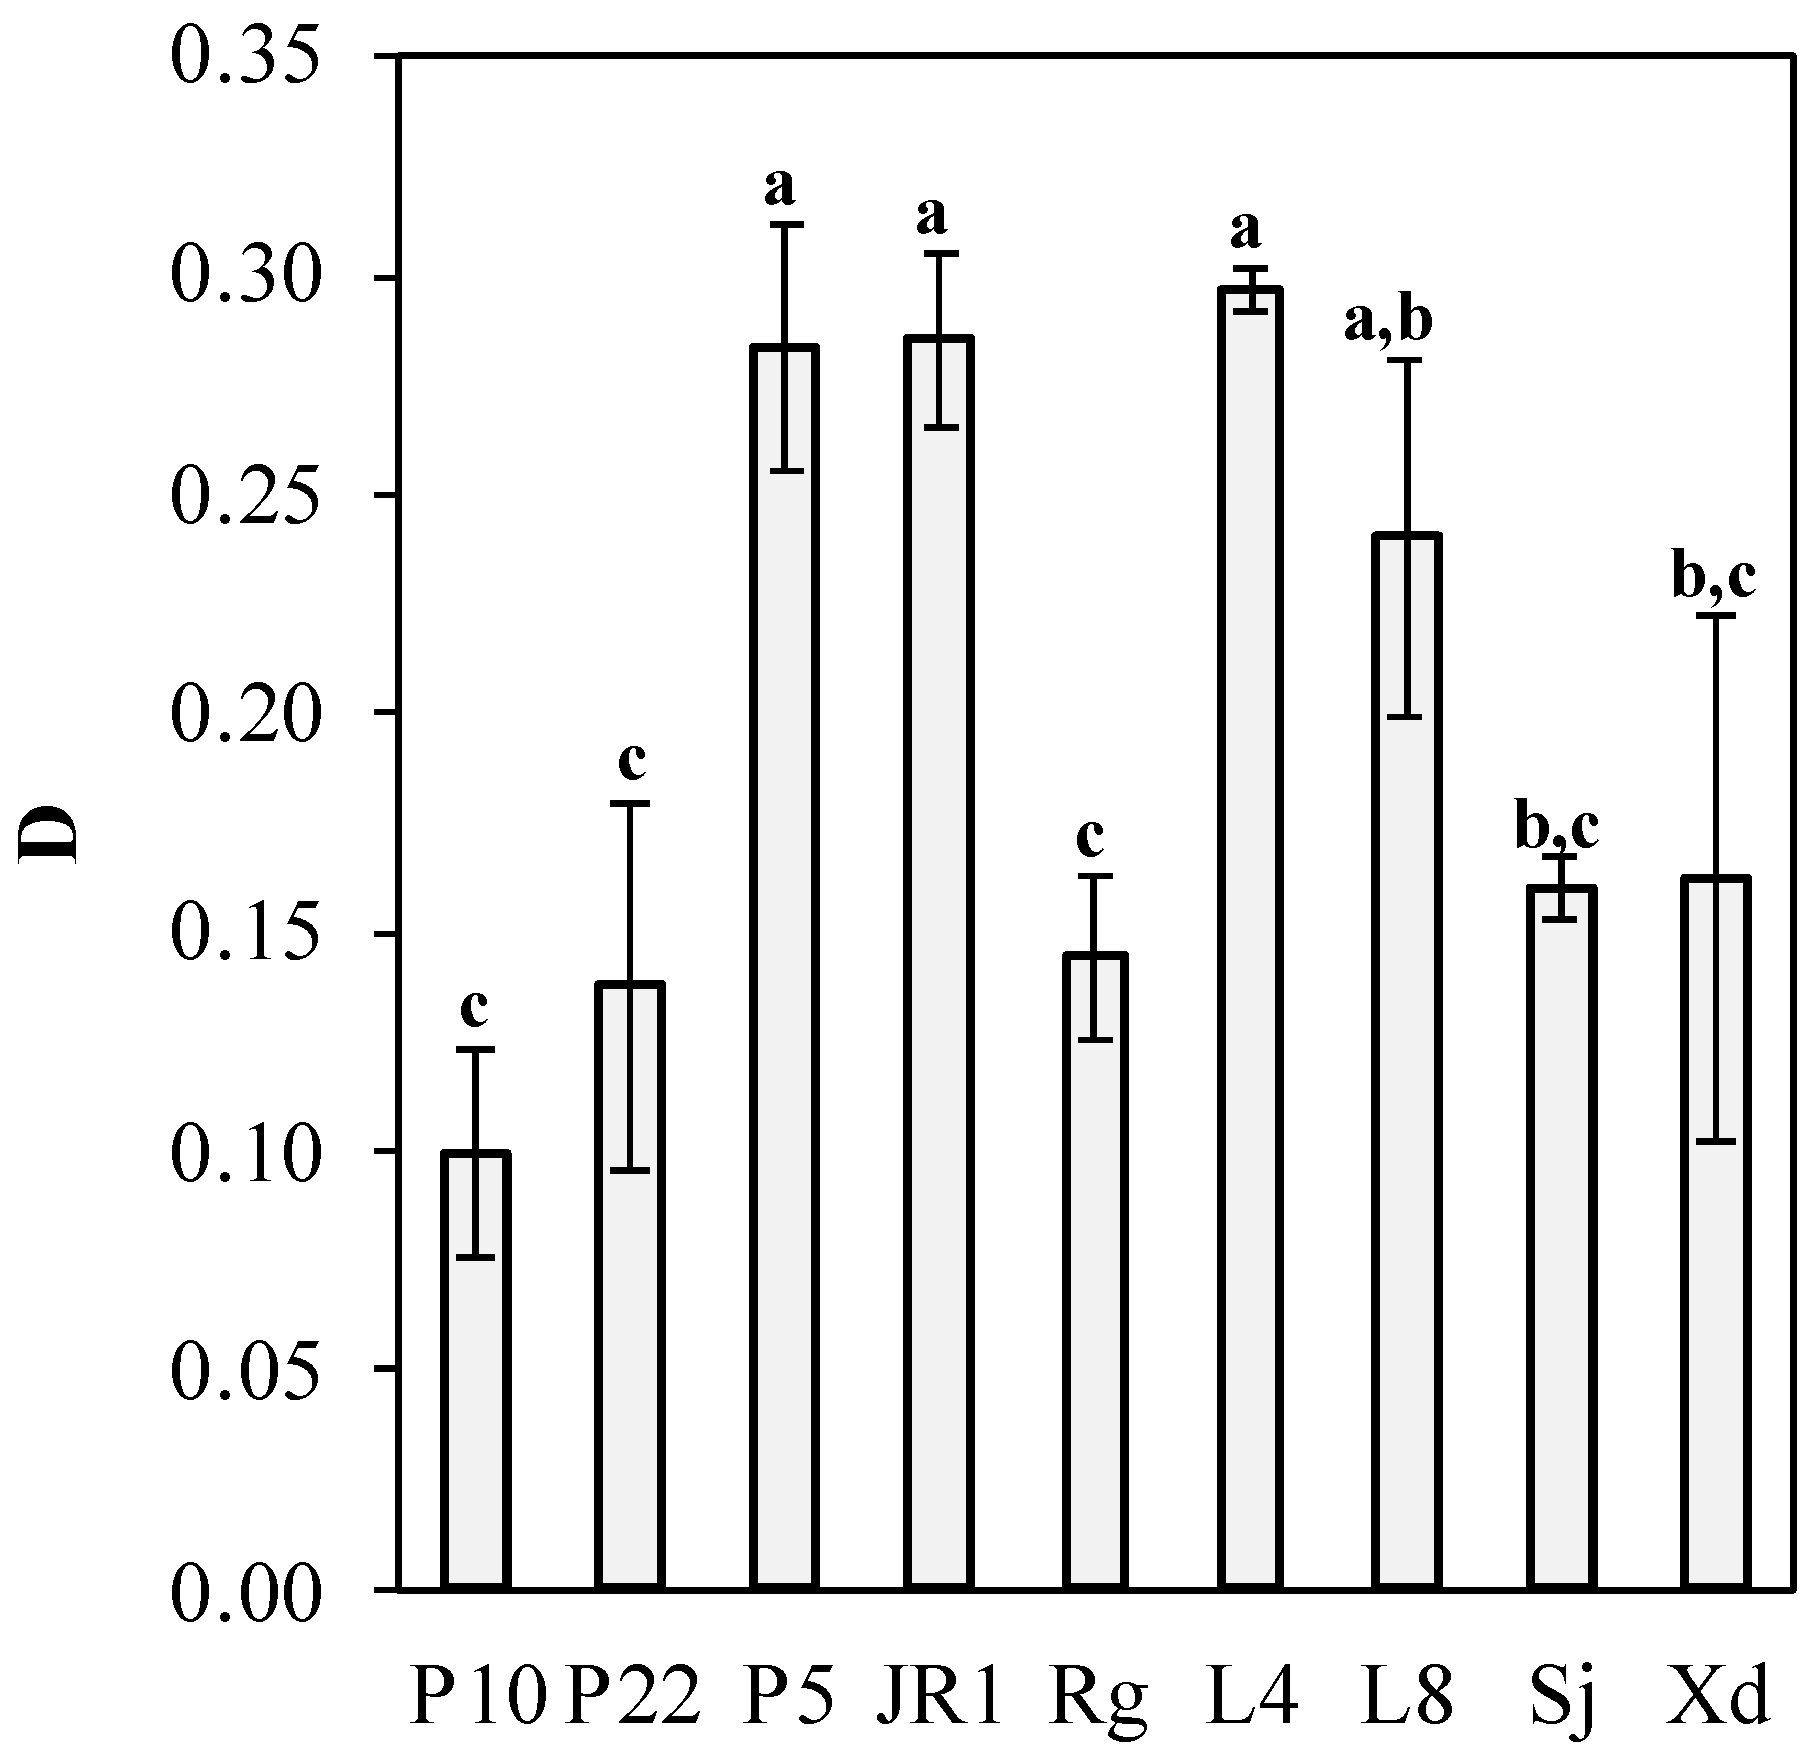
3.1. Simultaneous Production of Microbial Oil and Carotenoids: Screening Study

The evaluated strains were able to simultaneously produce lipids and carotenoids using the nitrogen-limited media, as shown in Figure 2. According to Figure 2a, the highest carotenoid production (1544.19 ± 234.78 µg/L) was attained by the strain P5, showing no significant difference with the strains Xd and L4 (1367.44 ± 144.41 and 1373.64 ± 107.01 µg/L, respectively). The lowest carotenoid production was 446.51± 27.91 µg/L by yeast P10. Conversely, the yeast Xd produced only 1.62 ± 0.26 g/L of lipids; meanwhile, the highest lipid production was obtained by the yeasts JR1 (4.31 ± 0.12 g/L) and P10 (4.03 ± 0.38 g/L). The maximum carotenoid yield (256.40 µg/g of dry biomass) was achieved by Xd, and the lower yield was 58.49 µg/g by yeast P10 (Figure 2b). The same graph demonstrates that the highest lipid accumulation was 52.81% (P10), while Xd accumulated 30.82%, the lowest value. In this respect, the screened strains can be cataloged as oleaginous yeast due to their accumulation capacity being over 20% w/w [9,18,44].
Although the simultaneous production in oleaginous yeast is possible, the yields obtained vary among yeast strain, culture media, and environmental parameters of fermentation [18,19,49]. Glucose-based media have been used to assess the production baseline of lipids and carotenoids for oleaginous yeast [3,31,49]. Lakshmidevi et al. [3] reported an accumulation of ~40% of lipids and carotenoid yields above 200 µg/g by R. glutinis and R. toruloides in a glucose yeast extract mineral medium. R. glutinis simultaneously produced 5 g/L of lipids and 0.81 mg/L of carotenoids when glucose was used as the sole carbon source [50]. Furthermore, the individual components of fatty acids and carotenoids in oleaginous yeast bioprocessing are affected by glucose supplementation, which promotes the accumulation of saturated fatty acids [31]; meanwhile, the β-carotene synthesis might be increased [49].
A global desirability function was used to select the yeast with the greatest potential for the simultaneous production of MO and carotenoids. The results can be visualized in Figure 3. Considering that the weights in the function were the same for all responses (P, YP/X, L, YL/X), the strains with the best potential are P5, L4, and JR1. In addition, there is no significant difference (p < 0.05) between such strains. Thus, the yeasts P5 and JR1 were selected for their higher carotenoid and lipid yield, respectively, to evaluate their fermentation potential in agro-food waste hydrolysates.

3.2. Agro-Food Residues Valorization as Hydrolysates

Agro-food residues characterization is shown in Table 2. BSG had the highest protein and hemicellulose content compared to the other residues, while the highest starch content was found in PPW. The differences found in nutrimental components among agro-food residues lie in each product’s raw material and process conditions. For instance, brewery byproducts can differ depending on the beer recipe [51,52]; PPW is affected by process conditions such as extrusion and heating used in pasta processing, and bread waste varies due to mixtures of bakery products [7,53].
The promising advantages of a sequential solid-state and submerged fermentation have recently been reviewed to develop a circular bioeconomy and reduce processing costs [54]. In this study, the three residues showed the potential to perform crude enzymatic hydrolysis by A. luchuensis. The composition of total sugars and FAN of the crude hydrolysates obtained by SSF is reported in Table 3. The higher total sugar content was measured in PPW hydrolysate (30 g/L), while the high FAN content was found in BSG hydrolysate (127.85 mg/L). The lower values of both TS and FAN were obtained in BW hydrolysate. The high starch content in the PPW resulted in the increased conversion yield of total sugar by hydrolysis. Compared to the literature, conversion yields of starch to glucose can be obtained up to 90% in rich-starch feedstock [7,55,56,57]. It has been reported that high sugar concentration in fermentation can enhance the production of MO and carotenoids [58]; as a result, BSG, and PPW hydrolysates seem appropriate for this purpose.
Afterward, fermentations were carried out using a nitrogen-limited medium as a control. BSG and PPW hydrolysates were utilized as media with and without phosphate salts and trace elements (TE) supplementation (Table 4). The nitrogen-limited medium was the most suitable for lipids production and lipid accumulation in both yeasts. On the other hand, better carotenoids yield, production, and productivity were found using PPW hydrolysate supplemented with medium salts by strain P5.
The effect of using phosphate salts and trace elements was previously reported by Papadaki et al. [4], where the nitrogen source concentration in a molasses-based medium could be reduced for the joint production of MO and carotenoids by R. toruloides. On the other hand, the incorporation of phosphate salts and TE reduced the sugar consumption rate of molasses, resulting in reduced lipid production by R. toruloides [8]. Therefore, the addition of these nutrients must be evaluated among the carbon source supplemented. Compared to this study’s results, the phosphate salt and TE supplementation positively affected the secondary metabolites production. Based on the above, we decided to analyze the process profitability using the nitrogen-limited media to identify the areas needing improvement or if the culture media accounts for a high percentage of processing costs.

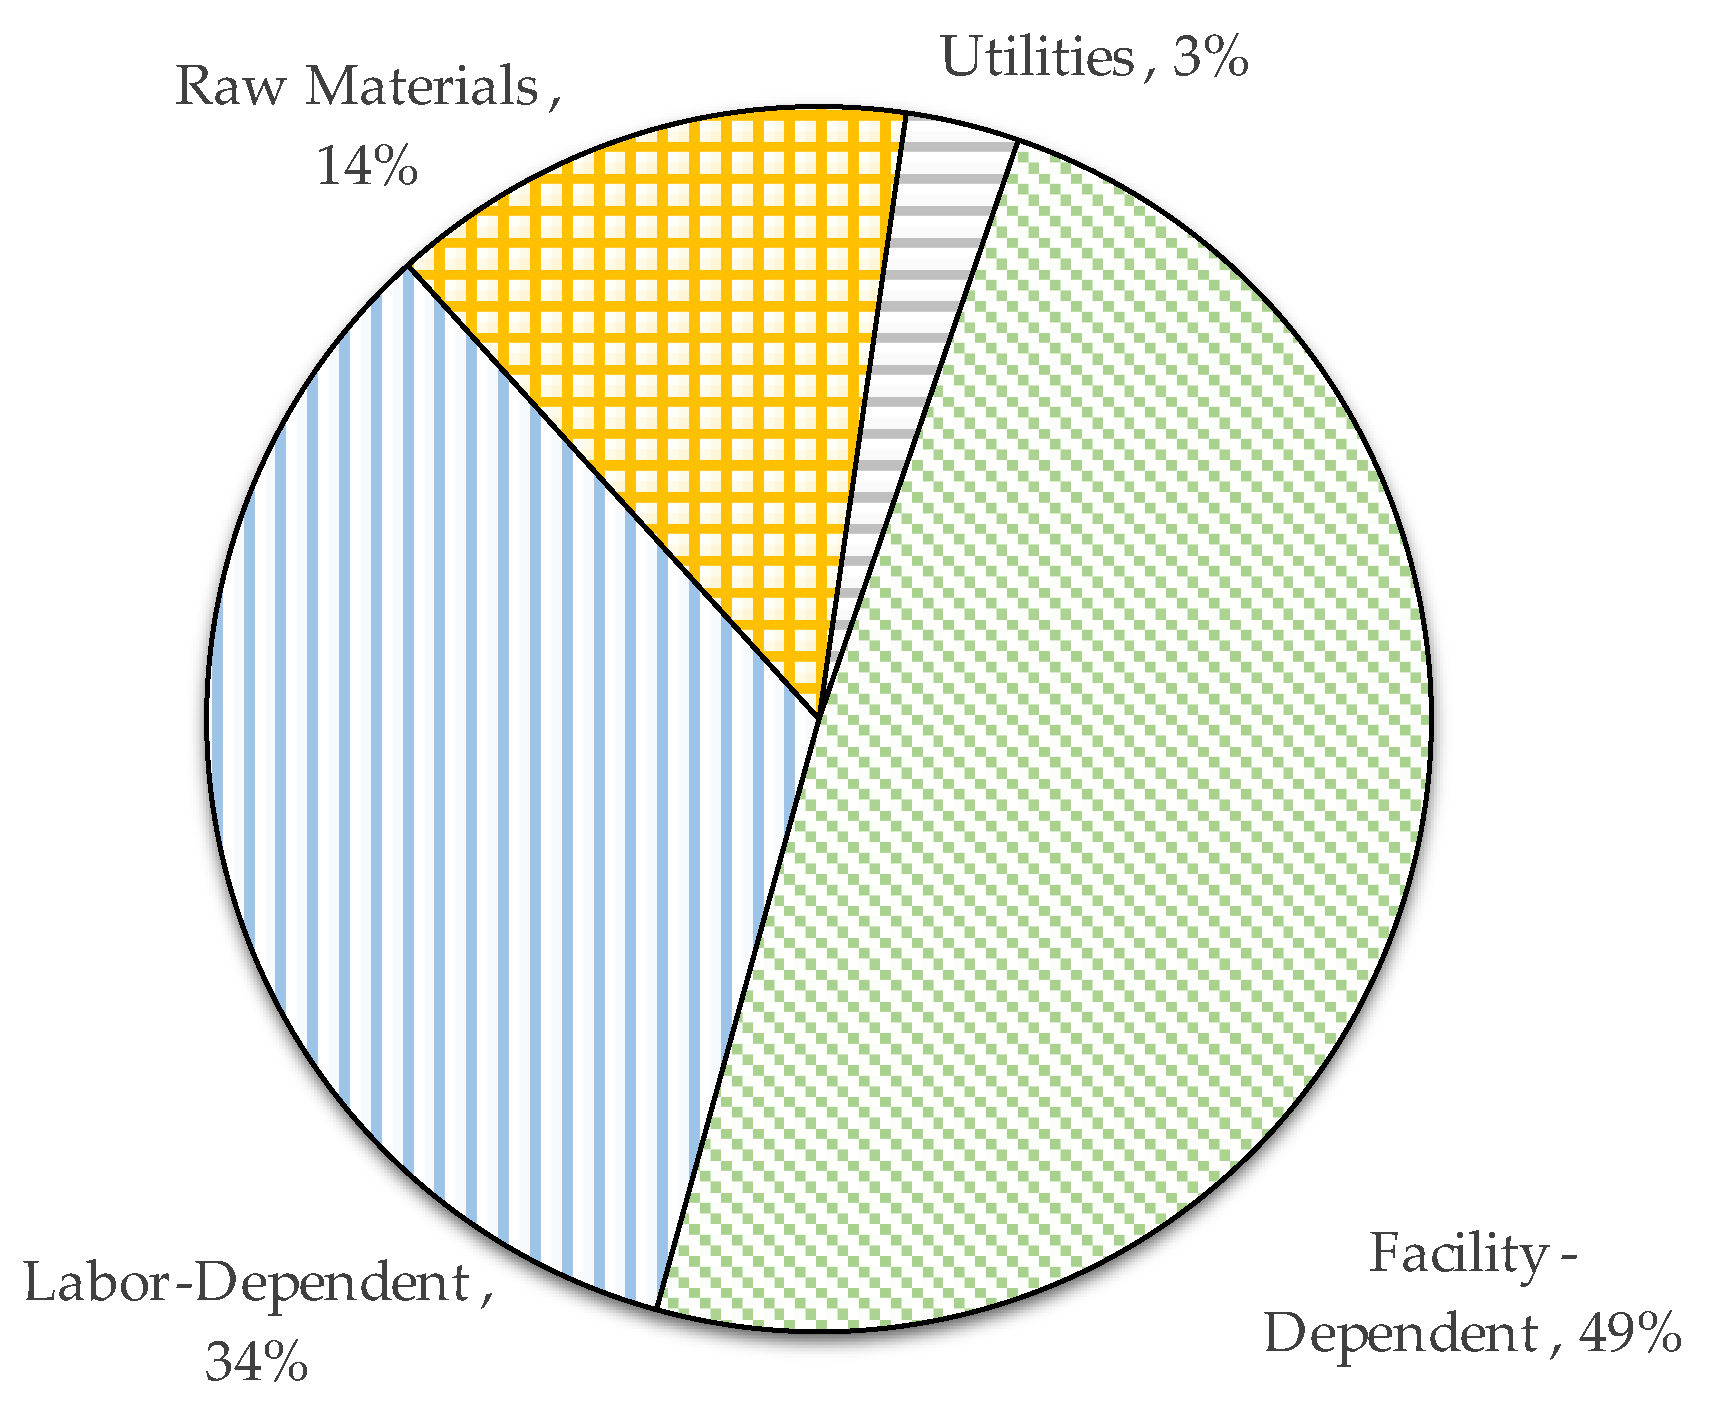
3.3. Economic Analysis

According to the base case simulation (1.25 kg of lipids/batch and 0.5 g carotenoids/batch), annual production of 78.75 kg and 31.5 kg was achieved (Table 5).
Results showed that the main revenue was MO due to its higher concentration in the cells than carotenoids. In such a scenario, the profitability of this bioprocess is not viable due to its negative NPV given by low ROI (10%), gross margin (5%), and the 10-year payback time. We attributed such results to the possible scheduling bottlenecks; that is, the unattractive economic parameters to investment are given by the low annual productivity of the plant due to the number of batches produced per year capacity. The batch duration was 260 h (Figure 4a), and the cycle duration was 130 h, resulting in only 63 batches per year. The batch time is understood as the duration between the beginning of the first unit operation and the end of the last unit operation.
In contrast, the cycle time represents the interval between two consecutive batches [59]. The annual production capacity will equal the production per batch multiplied by the number of batches executed per year. Reducing the cycle time can increase the production capacity per year because the capacity of the number of batches is inversely proportional to the cycle time of the plant. Thus, we decided to perform relevant adjustments to the simulation process to reduce the cycle time by identifying scheduling bottlenecks.
Figure 4a illustrates the equipment occupancy chart showing two consecutive batches. The light blue bars represent the first batch and the orange bars the second batch. It was observed that the bottleneck restricts the start of the second batch in using the fermenter (FR-101), that is, the equipment with the longest occupancy time. Therefore, it was decided to consider the addition of fermenters in staggered mode to increase the number of batches per year.
Adding an extra fermenter in the process did not mean a considerable increase in the payback time (6.76 years), primarily due to an observed increase in capital investment. Thus, we performed new simulations to eliminate the only identified scheduling bottleneck and increase the process throughput.
Table 5 summarizes the economic parameters obtained after adding fermenters in the bioprocess in four scenarios.
The gross margin of the evaluated scenarios adding extra fermenters ranged from 22 to 28%. In some processes, a gross margin in such ranges is considered beneficial [29,60]; however, it will depend on how high the investment has been. Among the most used indices for evaluating the profitability of a project are the ROI, NPV, IRR, and payback time [61].
Regarding ROI, this was between 10 and 17%. This percentage (ROI) translates to a payback time that ranges from 10 to almost 5 years. In general, a minimum ROI value between 5 and 10% return on investment is enough to cancel a project [62]. The shorter the payback time, the more attractive and profitable the project is because the initial investment is paid back in a shorter period. In this sense, projects with less than five years of payback can be considered profitable [62]. Under this premise, scenario 1 would be discarded. Indeed, this will also depend on the type of industry.
In scenario 3, the number of batches per year increased up to 188. The addition of two extra fermenters (scenario 3) increased the batches per year by up to three times more than in scenario 1, which improved the profitability of the project given by the increased gross margin and ROI despite the increase in total investment. As for scenario 4, it was observed that the profitability indexes were reduced. The reason was the new scheduling bottlenecks related to downstream processing, which did not allow a significant increase in batches/year. We performed various simulations by increasing the number of pieces of equipment to eliminate identified bottlenecks. Yet, the increase in production capacity would not imply a considerable improvement in the economic indexes due to the required investment.
Thus, scenario 3 was selected for the sensitivity analysis; the equipment occupancy chart of scenario 3 showing the implementation of the staggered fermenters is presented in Figure 4b. Accordingly, implementing extra fermenters on the upstream increases plant productivity by reducing the manufacturing cost of MO [25,30,63]; however, equipment, labor, and electricity costs can increase the annual operating cost [64].
The sensitivity analysis considered the effect of MO price (main revenue) and batch throughput on profitability and plant productivity. We contemplated a lower price range of MO than the reported in the literature (1–4 USD/g) [23,24,30] and performed the simulations between a batch throughput range of 5 g and 5 kg per batch (20 g/batch increments).
The effect of MO price and batch throughput on ROI and payback time is illustrated in Figure 5. As mentioned above, processes with less than five years of payback time are considered profitable [62], translating to an ROI higher than 20%. Thus, it was observed that at a microbial cost lower than 2 USD/g, the process is not profitable (Figure 5a). A selling price of USD 3 can increase ROI up to 40% at a batch throughput of 3.7; thus, the payback time can be reduced to <3 years, indicating an interesting project performance to investment (Figure 5b).
We selected the MO price of 3 USD/g to estimate the economic equilibrium, the required batch throughput at which the annual revenues are higher than the operating costs. The break-even point is displayed in Figure 6a.
It was observed that after a batch throughput of 0.25 kg/batch, the annual revenues are higher than the yearly costs. It was also observed that the annual revenues increased linearly with the batch throughput up to 3.45 kg/batch; meanwhile, the processing costs seem to stabilize by increasing the batch throughput. This behavior where the unit cost of production decreases with an increase in production has been reported for different bioprocesses [29,65,66]. Furthermore, it was observed that after 3.65 kg/batch of production, the annual revenues do not increase, which also negatively affects the ROI. Such results are attributed to the maximum capacity of production batches per year (Figure 6b).
If it is desired to increase the production capacity without reducing the number of batches per year, it must acquire more equipment to eliminate scheduling bottlenecks. However, as mentioned before, the investment would increase considerably.
Thus, the following results are for scenario 3 using an oil price of USD 3/g and a batch throughput of 3.7 kg/batch. Table 6 summarizes the economic evaluation indexes to measure the process profitability. It can be observed that it is required a total investment of USD 2,268,000 and the annual revenues are USD 2,032,000 per year.
The processing cost is USD 820,000 per year; thus, the gross margin is 59.65%, representing an ROI of 40.95% and 2.44 years of payback time. At an interest rate of 7%, the net present value is USD 4,235,000. Such an economic index indicates that the process is profitable.
Primarily, the reported annual productions of MO higher than 10 kt resulted in a profitable and attractive process for investors [23,24,30,67]. Bonatsos et al. described the effect of glucose cost and annual plant capacity where it is possible to obtain a production cost of USD 4.1/kg with a plant capacity of 40 kt [23]. Similarly, Kumar et al. obtained a 50% reduction in MO manufacturing cost when plant capacity was increased to 100 million L [67]. In general, obtaining an ROI value higher than 20% and a short payback time (<5 years) make a profitable production of MO [24,30,67]. Other key factors in the economic analysis include the equipment cost and the breakdown of raw materials in which reductions could be possible [30].
Table 7 displays the primary equipment specification to reach a batch throughput of 3.7 kg/batch. It is clarified that most equipment capacity is calculated according to the highest demand among all the carried-out operations in each equipment. In addition, the software considers the maximum set workload (70% in the present study). If that volume exceeds the maximum volume specification, the software will assume multiple identical units (as in equipment V-103).
It is highlighted that the process requires three bioreactors of ≈1500 L working in staggered mode (including air filters and centrifugal compressors) and a seed bioreactor of ≈150 L. In this respect, it has been concluded that over 70% of the equipment purchase cost is given by bioreactors [23,63]; in our simulation, this cost represents 50% of the primary equipment required in scenario 3. Low-cost alternatives for fermenters are fabrication and re-design with cheaper materials than stainless steel [30]. Another innovative way to mitigate electrical and heating power includes cultivating oleaginous yeast in raceway open-pound systems, which have been described and compared in previously reported research [24,68].
Regarding the operating costs, these are shown in Figure 7. The major operating costs are facility-dependent (49%), followed by labor-dependent expenses (34%). The facility-dependent cost is related to the use of the facility, such as maintenance, depreciation, overhead-type fees, local taxes, and other miscellaneous costs. Such costs (labor and facility dependent) cannot be easily reduced. However, it is also observed that a high percentage of the annual operating cost is attributed to raw materials (14%).
A breakdown of the raw materials costs is presented in Table 8. We can observe that the production medium accounts for more than 55% of the total costs related to raw materials. Such results agreed with the literature, where the fermentation media can account for up to 50% of the total production cost [69]. Therefore, reducing media costs is feasible to increase the process profitability. Hence, utilizing agro-food residues as substrates can contribute to developing a low-cost fermentation medium in the joint production of lipids and carotenoids.
Nonetheless, feedstocks whit minimum process requirements must be selected to obtain cost-effective bioprocess [24]. Subsequent studies will include the experimental results obtained with the utilization of agro-food waste hydrolysates for the synthesis of MO and carotenoids.

4. Conclusions

This work assessed the feasibility of coproducing carotenoids and lipids by oleaginous yeasts. The desirability function allowed an overall solution among evaluated responses in which three strains were promising for the simultaneous synthesis of both products. The agro-food waste valorization as renewable feedstock via enzymatic hydrolysis showed higher sugar recovery yields using BSG and PPW. Recovered sugars were sufficient to formulate a waste-based medium for simultaneous production of carotenoids and lipids. These hydrolysates used as fermentation media provide the necessary nutrients to synthesize carotenoids by selected strains. On the other hand, lipid titers obtained with the waste-based media were lower than in the control medium.
The techno-economic analysis allowed us to identify areas for further improvement. First, it was determined that the revenues generated using the carotenoids yield obtained with the nitrogen-limited media are insufficient to contribute to the profitability of the process. Thus, the primary revenue was the MO despite the high price of carotenoids. In addition, the profitability analysis demonstrated that the debottlenecking scenario 3 (using two staggered bioreactors) increased the process profitability over the base case. The sensitivity analysis showed that the process is not economically viable using oil prices lower than USD 2/g. Expanding the plant capacity increases the process profitability up to a batch throughput of 3.70 kg oil/batch; a higher production capacity requires eliminating new scheduling bottlenecks. In scenario 3 and the selected plant capacity (3.7 kg oil/batch), the cost related to the fermentation medium accounted for 55% of the raw materials costs. Thus, despite the low contribution of carotenoids to process profitability, it is expected that the utilization of an agro-food-based media will reduce process costs. Nevertheless, efforts still need to be made to achieve processing costs that compete with their chemically synthesized counterpart.

Author Contributions

Investigation, M.Á.V.-M.; Resources, J.M., J.C.C.-E.; Supervision, I.S. and L.M.-O.; Writing—original draft, M.Á.V.-M.; Writing—review & editing, J.M., A.K. and L.M.-O. All authors have read and agreed to the published version of the manuscript.

Funding

This research received no external funding.

Institutional Review Board Statement

Not applicable.

Informed Consent Statement

Not applicable.

Data Availability Statement

Not applicable.

Acknowledgments

Author M.Á.V.-M. (750450-2019) acknowledges CONACyT-Mexico for the financial support provided for conducting his doctoral studies. The authors would like to thank the National University of St. Agustin (Peru), Antonio Ledezma-Pérez (Centro de Investigación en Química Aplicada, Mexico) and the Glicobiotechnology Laboratory (Autonomous University of Coahuila, Mexico) for the kind donation of microorganisms.

Conflicts of Interest

The authors declare no conflict of interest.

References

  1. Morone, P.; Koutinas, A.; Gathergood, N.; Arshadi, M.; Matharu, A. Food Waste: Challenges and Opportunities for Enhancing the Emerging Bio-Economy. J. Clean. Prod. 2019, 221, 10–16. [Google Scholar] [CrossRef]
  2. Lopes, H.J.S.; Bonturi, N.; Kerkhoven, E.J.; Miranda, E.A.; Lahtvee, P.J. C/N Ratio and Carbon Source-Dependent Lipid Production Profiling in Rhodotorula toruloides. Appl. Microbiol. Biotechnol. 2020, 104, 2639–2649. [Google Scholar] [CrossRef] [PubMed] [Green Version]
  3. Lakshmidevi, R.; Ramakrishnan, B.; Ratha, S.K.; Bhaskar, S.; Chinnasamy, S. Valorisation of Molasses by Oleaginous Yeasts for Single Cell Oil (SCO) and Carotenoids Production. Environ. Technol. Innov. 2021, 21, 101281. [Google Scholar] [CrossRef]
  4. Papadaki, A.; Kopsahelis, N.; Mallouchos, A.; Mandala, I.; Koutinas, A.A. Bioprocess Development for the Production of Novel Oleogels from Soybean and Microbial Oils. Food Res. Int. 2019, 126, 108684. [Google Scholar] [CrossRef]
  5. Cheng, S.Y.; Tan, X.; Show, P.L.; Rambabu, K.; Banat, F.; Veeramuthu, A.; Lau, B.F.; Ng, E.P.; Ling, T.C. Incorporating Biowaste into Circular Bioeconomy: A Critical Review of Current Trend and Scaling up Feasibility. Environ. Technol. Innov. 2020, 19, 101034. [Google Scholar] [CrossRef]
  6. Danielson, N.; McKay, S.; Bloom, P.; Dunn, J.; Jakel, N.; Bauer, T.; Hannon, J.; Jewett, M.C.; Shanks, B. Industrial Biotechnology—An Industry at an Inflection Point. Ind. Biotechnol. 2020, 16, 321–332. [Google Scholar] [CrossRef]
  7. Tsakona, S.; Skiadaresis, A.G.; Kopsahelis, N.; Chatzifragkou, A.; Papanikolaou, S.; Kookos, I.K.; Koutinas, A.A. Valorisation of Side Streams from Wheat Milling and Confectionery Industries for Consolidated Production and Extraction of Microbial Lipids. Food Chem. 2016, 198, 85–92. [Google Scholar] [CrossRef]
  8. Boviatsi, E.; Papadaki, A.; Efthymiou, M.N.; Nychas, G.J.E.; Papanikolaou, S.; da Silva, J.A.C.; Freire, D.M.G.; Koutinas, A. Valorisation of Sugarcane Molasses for the Production of Microbial Lipids via Fermentation of Two Rhodosporidium Strains for Enzymatic Synthesis of Polyol Esters. J. Chem. Technol. Biotechnol. 2020, 95, 402–407. [Google Scholar] [CrossRef]
  9. Liu, Z.; Feist, A.M.; Dragone, G.; Mussatto, S.I. Lipid and Carotenoid Production from Wheat Straw Hydrolysates by Different Oleaginous Yeasts. J. Clean. Prod. 2020, 249, 119308. [Google Scholar] [CrossRef]
  10. Carmona-Cabello, M.; García, I.L.; Papadaki, A.; Tsouko, E.; Koutinas, A.; Dorado, M.P. Biodiesel Production Using Microbial Lipids Derived from Food Waste Discarded by Catering Services. Bioresour. Technol. 2021, 323, 124597. [Google Scholar] [CrossRef]
  11. Sen, T.; Barrow, C.J.; Deshmukh, S.K. Microbial Pigments in the Food Industry—Challenges and the Way Forward. Front. Nutr. 2019, 6, 1–15. [Google Scholar] [CrossRef] [PubMed] [Green Version]
  12. Parsons, S.; Allen, M.J.; Chuck, C.J. Coproducts of Algae and Yeast-Derived Single Cell Oils: A Critical Review of Their Role in Improving Biorefinery Sustainability. Bioresour. Technol. 2020, 303, 122862. [Google Scholar] [CrossRef] [PubMed]
  13. Papadaki, A.; Cipolatti, E.P.; Aguieiras, E.C.G.; Pinto, M.C.C.; Kopsahelis, N.; Freire, D.M.G.; Mandala, I.; Koutinas, A.A. Development of Microbial Oil Wax-Based Oleogel with Potential Application in Food Formulations. Food Bioprocess Technol. 2019, 12, 899–909. [Google Scholar] [CrossRef]
  14. Cipolatti, E.P.; Remedi, R.D.; Sá, C.d.S.; Rodrigues, A.B.; Ramos, J.M.G.; Burkert, C.A.V.; Furlong, E.B.; Burkert, J.F.d.M. Use of Agroindustrial Byproducts as Substrate for Production of Carotenoids with Antioxidant Potential by Wild Yeasts. Biocatal. Agric. Biotechnol. 2019, 20, 101208. [Google Scholar] [CrossRef]
  15. Chopra, J.; Sen, R. Process Optimization Involving Critical Evaluation of Oxygen Transfer, Oxygen Uptake and Nitrogen Limitation for Enhanced Biomass and Lipid Production by Oleaginous Yeast for Biofuel Application. Bioprocess Biosyst. Eng. 2018, 41, 1103–1113. [Google Scholar] [CrossRef]
  16. Dias, C.; Santos, J.; Reis, A.; da Silva, T.L. Yeast and Microalgal Symbiotic Cultures Using Low-Cost Substrates for Lipid Production. Bioresour. Technol. Rep. 2019, 7, 100261. [Google Scholar] [CrossRef]
  17. Wen, Z.; Zhang, S.; Odoh, C.K.; Jin, M.; Zhao, Z.K. Rhodosporidium toruloides—A Potential Red Yeast Chassis for Lipids and Beyond. FEMS Yeast Res. 2020, 20, foaa038. [Google Scholar] [CrossRef]
  18. Dias, C.; Reis, A.; Santos, J.A.L.; da Silva, T.L. Concomitant Wastewater Treatment with Lipid and Carotenoid Production by the Oleaginous Yeast Rhodosporidium toruloides Grown on Brewery Effluent Enriched with Sugarcane Molasses and Urea. Process. Biochem. 2020, 94, 1–14. [Google Scholar] [CrossRef]
  19. Kot, A.M.; Błażejak, S.; Kieliszek, M.; Gientka, I.; Bryś, J. Simultaneous Production of Lipids and Carotenoids by the Red Yeast Rhodotorula from Waste Glycerol Fraction and Potato Wastewater. Appl. Biochem. Biotechnol. 2019, 189, 589–607. [Google Scholar] [CrossRef]
  20. Pereira, R.N.; da Silveira, J.M.; de Burkert, J.F.M.; da Ores, J.C.; Burkert, C.A.V. Simultaneous Lipid and Carotenoid Production by Stepwise Fed-Batch Cultivation of Rhodotorula Mucilaginosa with Crude Glycerol. Braz. J. Chem. Eng. 2019, 36, 1099–1108. [Google Scholar] [CrossRef]
  21. Gong, G.; Zhang, X.; Tan, T. Simultaneously Enhanced Intracellular Lipogenesis and β-Carotene Biosynthesis of Rhodotorula Glutinis by Light Exposure with Sodium Acetate as the Substrate. Bioresour. Technol. 2020, 295, 122274. [Google Scholar] [CrossRef] [PubMed]
  22. Tkáčová, J.; Klempová, T.; Čertík, M. Kinetic Study of Growth, Lipid and Carotenoid Formation in β-Carotene Producing Rhodotorula Glutinis. Chem. Pap. 2018, 72, 1193–1203. [Google Scholar] [CrossRef]
  23. Bonatsos, N.; Marazioti, C.; Moutousidi, E.; Anagnostou, A.; Koutinas, A.; Kookos, I.K. Techno-Economic Analysis and Life Cycle Assessment of Heterotrophic Yeast-Derived Single Cell Oil Production Process. Fuel 2020, 264, 116839. [Google Scholar] [CrossRef]
  24. Parsons, S.; Abeln, F.; McManus, M.C.; Chuck, C.J. Techno-Economic Analysis (TEA) of Microbial Oil Production from Waste Resources as Part of a Biorefinery Concept: Assessment at Multiple Scales under Uncertainty. J. Chem. Technol. Biotechnol. 2019, 94, 701–711. [Google Scholar] [CrossRef]
  25. Karamerou, E.E.; Parsons, S.; McManus, M.C.; Chuck, C.J. Using Techno-Economic Modelling to Determine the Minimum Cost Possible for a Microbial Palm Oil Substitute. Biotechnol. Biofuels 2021, 14, 57. [Google Scholar] [CrossRef]
  26. Liu, Z.; Natalizio, F.; Dragone, G.; Mussatto, S.I. Maximizing the Simultaneous Production of Lipids and Carotenoids by Rhodosporidium Toruloides from Wheat Straw Hydrolysate and Perspectives for Large-Scale Implementation. Bioresour. Technol. 2021, 340, 125598. [Google Scholar] [CrossRef]
  27. Mussagy, C.U.; Winterburn, J.; Santos-Ebinuma, V.C.; Pereira, J.F.B. Production and Extraction of Carotenoids Produced by Microorganisms. Appl. Microbiol. Biotechnol. 2019, 103, 1095–1114. [Google Scholar] [CrossRef]
  28. Igreja, W.S.; Maia, F.d.A.; Lopes, A.S.; Chisté, R.C. Biotechnological Production of Carotenoids Using Low Cost-Substrates Is Influenced by Cultivation Parameters: A Review. Int. J. Mol. Sci. 2021, 22, 8819. [Google Scholar] [CrossRef]
  29. Dursun, D.; Koulouris, A.; Dalgıç, A.C. Process Simulation and Techno Economic Analysis of Astaxanthin Production from Agro-Industrial Wastes. Waste Biomass Valorization 2020, 11, 943–954. [Google Scholar] [CrossRef]
  30. Vieira, J.P.F.; Ienczak, J.L.; Costa, P.S.; Rossell, C.E.V.; Franco, T.T.; Pradella, J.G.C. Single Cell Oil Production Integrated to a Sugarcane-Mill: Conceptual Design, Process Specifications and Economic Analysis Using Molasses as Raw Material. Ind. Crops Prod. 2016, 89, 478–485. [Google Scholar] [CrossRef]
  31. Maina, S.; Pateraki, C.; Kopsahelis, N.; Paramithiotis, S.; Drosinos, E.H.; Papanikolaou, S.; Koutinas, A. Microbial Oil Production from Various Carbon Sources by Newly Isolated Oleaginous Yeasts. Eng. Life Sci. 2017, 17, 333–344. [Google Scholar] [CrossRef] [PubMed]
  32. Ayadi, I.; Belghith, H.; Gargouri, A.; Guerfali, M. Screening of New Oleaginous Yeasts for Single Cell Oil Production, Hydrolytic Potential Exploitation and Agro-Industrial by-Products Valorization. Process Saf. Environ. Prot. 2018, 119, 104–114. [Google Scholar] [CrossRef]
  33. Tsakona, S.; Papadaki, A.; Kopsahelis, N.; Kachrimanidou, V.; Papanikolaou, S.; Koutinas, A. Development of a Circular Oriented Bioprocess for Microbial Oil Production Using Diversified Mixed Confectionery Side-Streams. Foods 2019, 8, 300. [Google Scholar] [CrossRef] [PubMed] [Green Version]
  34. AOAC. Official Methods of Analysis of AOAC International; AOAC International: Gaithersburg, MD, USA, 2005. [Google Scholar]
  35. Megazyme Total Starch Assay Procedure (Amyloglucosidase/Alpha-Amylase Method). AOAC Method 996.11. 2020. Available online: https://www.megazyme.com/documents/Assay_Protocol/K-TSHK_DATA.pdf (accessed on 20 October 2020).
  36. Ribeiro, J.E.S.; Sant’Ana, A.M.d.S.; Martini, M.; Sorce, C.; Andreucci, A.; de Melo, D.J.N.D.; da Silva, F.L.H. Rhodotorula glutinis Cultivation on Cassava Wastewater for Carotenoids and Fatty Acids Generation. Biocatal. Agric. Biotechnol. 2019, 22, 101419. [Google Scholar] [CrossRef]
  37. Kot, A.M.; Błażejak, S.; Kieliszek, M.; Gientka, I.; Piwowarek, K.; Brzezińska, R. Production of Lipids and Carotenoids by Rhodotorula gracilis ATCC 10788 Yeast in a Bioreactor Using Low-Cost Wastes. Biocatal. Agric. Biotechnol. 2020, 26, 101634. [Google Scholar] [CrossRef]
  38. Mishra, S.K.; Suh, W.I.; Farooq, W.; Moon, M.; Shrivastav, A.; Park, M.S.; Yang, J.W. Rapid Quantification of Microalgal Lipids in Aqueous Medium by a Simple Colorimetric Method. Bioresour. Technol. 2014, 155, 330–333. [Google Scholar] [CrossRef]
  39. Elfeky, N.; Elmahmoudy, M.; Zhang, Y.; Guo, J.L.; Bao, Y. Lipid and Carotenoid Production by Rhodotorula Glutinis with a Combined Cultivation Mode of Nitrogen, Sulfur, and Aluminium Stress. Appl. Sci. 2019, 9, 2444. [Google Scholar] [CrossRef] [Green Version]
  40. Dubois, M.; Gilles, K.A.; Hamilton, J.K.; Rebers, P.A.; Smith, F. Colorimetric Method for Determination of Sugars and Related Substances. Anal. Chem. 1956, 28, 350–356. [Google Scholar] [CrossRef]
  41. Lie, S. The Ebc-Ninhydrin Method for Determination of Free Alpha Amino Nitrogen. J. Inst. Brew. 1973, 79, 37–41. [Google Scholar] [CrossRef]
  42. Candioti, L.V.; De Zan, M.M.; Cámara, M.S.; Goicoechea, H.C. Experimental Design and Multiple Response Optimization. Using the Desirability Function in Analytical Methods Development. Talanta 2014, 124, 123–138. [Google Scholar] [CrossRef]
  43. Leyton, A.; Flores, L.; Mäki-Arvela, P.; Lienqueo, M.E.; Shene, C. Macrocystis pyrifera Source of Nutrients for the Production of Carotenoids by a Marine Yeast Rhodotorula mucilaginosa. J. Appl. Microbiol. 2019, 127, 1069–1079. [Google Scholar] [CrossRef] [PubMed]
  44. Kot, A.M.; Błażejak, S.; Kieliszek, M.; Gientka, I.; Bryś, J.; Reczek, L.; Pobiega, K. Effect of Exogenous Stress Factors on the Biosynthesis of Carotenoids and Lipids by Rhodotorula Yeast Strains in Media Containing Agro-Industrial Waste. World J. Microbiol. Biotechnol. 2019, 35, 157. [Google Scholar] [CrossRef] [PubMed] [Green Version]
  45. Chaturvedi, S.; Tiwari, R.; Bhattacharya, A.; Nain, L.; Khare, S.K. Production of Single Cell Oil by Using Cassava Peel Substrate from Oleaginous Yeast Rhodotorula glutinis. Biocatal. Agric. Biotechnol. 2019, 21, 101308. [Google Scholar] [CrossRef]
  46. Li, J.; Ma, C.; Ma, Y.; Li, Y.; Zhou, W.; Xu, P. Medium Optimization by Combination of Response Surface Methodology and Desirability Function: An Application in Glutamine Production. Appl. Microbiol. Biotechnol. 2007, 74, 563–571. [Google Scholar] [CrossRef]
  47. Liu, Z.; van den Berg, C.; Weusthuis, R.A.; Dragone, G.; Mussatto, S.I. Strategies for an Improved Extraction and Separation of Lipids and Carotenoids from Oleaginous Yeast. Sep. Purif. Technol. 2021, 257, 117946. [Google Scholar] [CrossRef]
  48. Passarinho, P.C.; Oliveira, B.; Dias, C.; Teles, M.; Reis, A.; da Silva, T.L. Sequential Carotenoids Extraction and Biodiesel Production from Rhodosporidium toruloides NCYC 921 Biomass. Waste Biomass Valorization 2020, 11, 2075–2086. [Google Scholar] [CrossRef] [Green Version]
  49. Sinha, S.; Singh, G.; Arora, A.; Paul, D. Carotenoid Production by Red Yeast Isolates Grown in Agricultural and “Mandi” Waste. Waste Biomass Valorization 2021, 12, 3939–3949. [Google Scholar] [CrossRef]
  50. Elfeky, N.; Elmahmoudy, M.; Bao, Y. Manipulation of Culture Conditions: Tool for Correlating/Improving Lipid and Carotenoid Production by Rhodotorula glutinis. Processes 2020, 8, 140. [Google Scholar] [CrossRef] [Green Version]
  51. Ibarruri, J.; Cebrián, M.; Hernández, I. Solid State Fermentation of Brewer’s Spent Grain Using Rhizopus Sp. to Enhance Nutritional Value. Waste Biomass Valorization 2019, 10, 3687–3700. [Google Scholar] [CrossRef]
  52. Paz, A.; Sabo, S.d.S.; Vallejo, M.; Marguet, E.; Oliveira, R.P.d.S.; Domínguez, J.M. Using Brewer’s Spent Grain to Formulate Culture Media for the Production of Bacteriocins Using Patagonian Strains. LWT 2018, 96, 166–174. [Google Scholar] [CrossRef]
  53. Haque, M.A.; Kachrimanidou, V.; Koutinas, A.; Lin, C.S.K. Valorization of Bakery Waste for Biocolorant and Enzyme Production by Monascus purpureus. J. Biotechnol. 2016, 231, 55–64. [Google Scholar] [CrossRef] [PubMed]
  54. López-Gómez, J.P.; Venus, J. Potential Role of Sequential Solid-State and Submerged-Liquid Fermentations in a Circular Bioeconomy. Fermentation 2021, 7, 76. [Google Scholar] [CrossRef]
  55. Tsakona, S.; Kopsahelis, N.; Chatzifragkou, A.; Papanikolaou, S.; Kookos, I.K.; Koutinas, A.A. Formulation of Fermentation Media from Flour-Rich Waste Streams for Microbial Lipid Production by Lipomyces starkeyi. J. Biotechnol. 2014, 189, 36–45. [Google Scholar] [CrossRef] [PubMed]
  56. Li, X.; Mettu, S.; Martin, G.J.O.; Ashokkumar, M.; Lin, C.S.K. Ultrasonic Pretreatment of Food Waste to Accelerate Enzymatic Hydrolysis for Glucose Production. Ultrason. Sonochem. 2019, 53, 77–82. [Google Scholar] [CrossRef]
  57. Han, W.; Liu, Y.; Xu, X.; He, H.; Chen, L.; Tian, X.; Hou, P.; Tang, J. A Novel Combination of Enzymatic Hydrolysis and Microbial Fuel Cell for Electricity Production from Bakery Waste. Bioresour. Technol. 2020, 297, 122387. [Google Scholar] [CrossRef] [PubMed]
  58. Papadaki, A.; Fernandes, K.V.; Chatzifragkou, A.; Aguieiras, E.C.G.; da Silva, J.A.C.; Fernandez-Lafuente, R.; Papanikolaou, S.; Koutinas, A.; Freire, D.M.G. Bioprocess Development for Biolubricant Production Using Microbial Oil Derived via Fermentation from Confectionery Industry Wastes. Bioresour. Technol. 2018, 267, 311–318. [Google Scholar] [CrossRef]
  59. Petrides, D.; Carmichael, D.; Siletti, C.; Koulouris, A. Biopharmaceutical Process Optimization with Simulation and Scheduling Tools. Bioengineering 2014, 1, 154. [Google Scholar] [CrossRef]
  60. Kwan, T.H.; Pleissner, D.; Lau, K.Y.; Venus, J.; Pommeret, A.; Lin, C.S.K. Techno-Economic Analysis of a Food Waste Valorization Process via Microalgae Cultivation and Co-Production of Plasticizer, Lactic Acid and Animal Feed from Algal Biomass and Food Waste. Bioresour. Technol. 2015, 198, 292–299. [Google Scholar] [CrossRef]
  61. Carberry, J.J.; Walker, W.H.; White, A.H.; Jackson, D.D.; James, J.H.; Lewis, W.K.; Curtis, H.A.; Parmelee, H.C. Plant Design and Economics for Chemical Engineers; McGraw-Hill: New York, NY, USA, 2003. [Google Scholar]
  62. El-Halwagi, M.M. Overview of Process Economics. In Sustainable Design through Process Integration; El-Halwagi, M.M., Ed.; Butterworth-Heinemann: Oxford, UK, 2012; pp. 15–61. ISBN 978-1-85617-744-3. [Google Scholar]
  63. Koutinas, A.A.; Chatzifragkou, A.; Kopsahelis, N.; Papanikolaou, S.; Kookos, I.K. Design and Techno-Economic Evaluation of Microbial Oil Production as a Renewable Resource for Biodiesel and Oleochemical Production. Fuel 2014, 116, 566–577. [Google Scholar] [CrossRef]
  64. Masri, M.A.; Garbe, D.; Mehlmer, N.; Brück, T.B. A Sustainable, High-Performance Process for the Economic Production of Waste-Free Microbial Oils That Can Replace Plant-Based Equivalents. Energy Environ. Sci. 2019, 12, 2717–2732. [Google Scholar] [CrossRef]
  65. Cheng, C.; Zhou, Y.; Lin, M.; Wei, P.; Yang, S.T. Polymalic Acid Fermentation by Aureobasidium Pullulans for Malic Acid Production from Soybean Hull and Soy Molasses: Fermentation Kinetics and Economic Analysis. Bioresour. Technol. 2017, 223, 166–174. [Google Scholar] [CrossRef] [PubMed]
  66. Han, W.; Fang, J.; Liu, Z.; Tang, J. Techno-Economic Evaluation of a Combined Bioprocess for Fermentative Hydrogen Production from Food Waste. Bioresour. Technol. 2016, 202, 107–112. [Google Scholar] [CrossRef] [PubMed]
  67. Kumar, L.R.; Yellapu, S.K.; Tyagi, R.D.; Drogui, P. Cost, Energy and GHG Emission Assessment for Microbial Biodiesel Production through Valorization of Municipal Sludge and Crude Glycerol. Bioresour. Technol. 2020, 297, 122404. [Google Scholar] [CrossRef]
  68. Braunwald, T.; French, W.T.; Claupein, W.; Graeff-Hönninger, S. Economic Assessment of Microbial Biodiesel Production Using Heterotrophic Yeasts. Int. J. Green Energy 2016, 13, 274–282. [Google Scholar] [CrossRef]
  69. Freitas, C.; Parreira, T.M.; Roseiro, J.; Reis, A.; Da Silva, T.L. Selecting Low-Cost Carbon Sources for Carotenoid and Lipid Production by the Pink Yeast Rhodosporidium toruloides NCYC 921 Using Flow Cytometry. Bioresour. Technol. 2014, 158, 355–359. [Google Scholar] [CrossRef] [Green Version]
Figure 1. Flow diagram of the bioprocess for microbial oil and carotenoids production (SuperPro Designer ®).
Fermentation 08 00258 g001
Figure 2. Simultaneous production of lipids and carotenoids by oleaginous yeast. (a) Carotenoids (P) and lipid production (L). (b) Carotenoids yield per biomass (YP/X) and lipid content per biomass (YL/X). Carotenoids (yellow bar), lipids (green circle). Superscript letters a, b, c, d, and e indicate significant differences at p < 0.05.
Fermentation 08 00258 g002
Figure 3. Oleaginous yeast global desirability on simultaneous carotenoids and microbial oil production performance. Significance difference (p < 0.05) is marked with subscript letters a,b,c.
Fermentation 08 00258 g003
Figure 4. Equipment occupancy chart. (a) Base-case; (b) elimination of bottlenecks.
Fermentation 08 00258 g004
Figure 5. Effect of microbial oil price and batch throughput on (a) ROI (%) and (b) payback time (years).
Fermentation 08 00258 g005
Figure 6. (a) Break-even point of annual revenues and costs. (b) Batches per year as a function of the process throughput.
Fermentation 08 00258 g006
Figure 7. Annual operating cost breakdown (%): Scenario 3—3 USD/g—3.7 kg/batch.
Fermentation 08 00258 g007
Table 1. Incubation time and origin of yeast strains used in screening experiments to simultaneously produce microbial oil and carotenoids.
StrainIncubation Time, hOriginCode
Xanthophyllomyces dendrorhous ATCC 2420296Purchased ATCC, USAXd
Rhodotorula mucilaginosa L472Isolated from aguamiel.
Saltillo, Mexico
L4
Sporobolomyces johnsonii ATCC 2049096Purchased. ATCC, USASj
Rhodotorula mucilaginosa L872Isolated from aguamiel.
Saltillo, Mexico
L8
Cystobasidium minutum CFGU-S-02296Isolated from Lake of Salinas. Arequipa, PerúP22
Rhodotorula glutinis PM42272Isolated from sotol. Saltillo, MexicoRg
Sakaguchia lamellibrachiae CFGU-S-01096Isolated from Lake of Salinas. Arequipa, PerúP10
Rhodotorula sp. JR172Isolated from aguamiel. Saltillo, MexicoJR1
Sporobolomyces roseus CFGU-S00596Isolated from Lake of Salinas. Arequipa, PerúP5
Table 2. Agro-food residues characterization (% w/w, dry weight basis).
ComponentBrewer´s Spent GrainPasta Processing WasteBread Waste
Moisture4.91 ± 0.1912.17 ± 0.038.77 ± 0.68
Ash3.06 ± 0.032.33 ± 0.042.77 ± 0.19
Protein19.68 ± 0.279.83 ± 0.169.48 ± 0.33
Lipids6.08 ± 0.026.40 ± 0.1212.29 ± 0.02
Starch19.67 ± 2.0433.25 ± 0.6720.10 ± 2.04
Hemicellulose32.51 ± 6.118.65 ± 0.617.28 ± 1.77
Lignin7.32 ± 0.843.48 ± 0.474.93 ± 0.898
Cellulose13.03 ± 5.080.1 ± 04.42 ± 0.90
Table 3. Agro-food byproducts hydrolysates composition.
ComponentHydrolysate
Brewer´s Spent GrainPasta Processing WasteBread Waste
Total sugar, g/L18.43 ± 1.230.57 ± 1.0312.89 ± 0.79
FAN 1, mg/L127.85 ± 1.84106.97 ± 0.3697.66 ± 0.67
IP 2, mg/L111.16 ± 4.9866.70 ± 2.7950.30 ± 1.21
Total sugar/Starch conversion yield, %33.3380.8528.90
FAN/TKN 3 conversion yield, %12.0732.6421.55
1 Free amino nitrogen, FAN; 2 IP = Inorganic phosphorous; 3 Total kjeldahl nitrogen, TKN.
Table 4. Microbial oil and carotenoid production by P5 and JR1 strains in nitrogen-limited media and hydrolysates media.
YeastMediaYP/X, µg/gP, µg/LL, g/LYL/X, % w/w
P5NL 1210.76 ± 13.44 c1559.69 ± 99.47 bc2.65 ± 0.07 a35.84 ± 1.79 a
PPWH 2216.05 ± 26.37 c1339.53 ± 163.53 cd0.74 ± 0.12 cde12.11 ± 2.65 def
BSGH 3269.58 ± 19.38 b1761.24 ± 126.64 b0.93 ± 0.09 bcde13.79 ± 1.18 cdef
PPWH + TE 4317.83 ± 2.85 a2161.24 ± 19.36 a1.22 ± 0.02 bc18.01 ± 0.29 bcd
BSGH + TE266.85 ± 8.04 b1618.60 ± 33.4 b0.53 ± 0.08 e8.79 ± 1.48 ef
JR1NL131.00 ± 11.44 e951.94 ± 80.20 e1.45 ± 0.22 b23.08 ± 3.15 b
PPWH171.67 ± 3.88 d1258.91 ± 28.42 d0.99 ± 0.13 bcde13.60 ± 1.77 cdef
BSGH128.87 ± 6.57 e936.43 ± 47.74 e1.16 ± 0.47 bcd15.65 ± 5.75 cde
PPWH + TE140.55 ± 5.04 de958.14 ± 73.83 e1.38 ± 0.27 b19.97 ± 1.82 bc
BSGH + TE105.07 ± 3.68 e812.40 ± 23.41 e0.59 ± 0.06 de7.68 ± 0.75 f
1 Nitrogen limited—NL; 2 pasta processing waste hydrolysate—PPWH; 3 brewer´s spent grain hydrolysate—BSGH; 4 trace elements—TE. Marked superscript letters a, b, c, d, e, and f indicate significant differences (p < 0.05).
Table 5. Economic evaluation under different scenarios.
Project IndicesScenario 1Scenario 2Scenario 3Scenario 4
Extra bioreactor0123
Investment, USD76,174.00 1,081,494.00 1,401,240.00 1,715,270.00
Annual Operating cost, USD/year222,946.00366,596.00508,855.00589,877.00
Annual Revenues, USD/year263,284.00472,568.00705,102.00772,612.00
Gross Margin, %5.6522.4227.8323.65
ROI, %10.0014.7917.3015.30
Payback Time, years106.765.786.54
NPV at 7.00%, USD−247,745.00 14,993.00271,697.0086,518.00
Batches/year63126188206
Table 6. Economic evaluation: Scenario 3—3 USD/g—batch throughput 3.7 kg/batch.
Economic Indices
Total Investment, USD2,268,000
Total Revenues, USD2,032,000
Operating Cost, USD/year820,000
Batch Size, kg MP3.70
Net Unit Production Cost, USD kg MP1210.76
Unit Production Revenue, USD kg MP3000.43
Gross Margin, %59.65
Return On Investment, %40.95
Payback Time, years2.44
IRR After Taxes, %29.45
NPV at (7.00%), USD4,235,000.00
Table 7. Major equipment specification: Scenario 3—batch throughput 3.7 kg/batch.
UnitsNameDescriptionSizeUnit Cost (USD)Total Cost (USD)
1PPF-101Plate & Frame Filter2 m220002000
3G-101Centrifugal compressor4 kW10003000
3AF-101Air Filter<0.01 m3/s10003000
3AF-102Air Filter0.01 m3/s10003000
1HG-101Homogenizer12 L/h30003000
1DC-101Decanter Centrifuge0.1 m3/h30003000
1MSX-101Mixer-Settler Extractor75 L/h20002000
1V-102Blending Tank300 L29,00029,000
4V-103Batch Distillation Vessel180 L600024,000
1V-104Blending Tank700 L80008000
3FR-102Bioreactor1500 L60,000180,000
1R-101Fermentor (148.98 L)150 L23,00023,000
1V-101Batch Distillation Vessel (155.64 L)16060006000
1V-105Flat Bottom Tank (171.03 L)18010001000
1HX-101Heat Exchanger (0.01 m2)0.01 m210001000
Unlisted equipment 72,000
TOTAL358,000
Table 8. Raw material cost breakdown for microbial oil and carotenoids production.
Bulk MaterialUnit Cost (USD)Annual Amount (kg)Annual Cost (USD)%
HCl (37% w/w)0.03791,10033713.02
Hexane2.370168940033.58
Ethanolic KOH 1.1 M1.00837,32637,61933.67
Production Medium0.316197,18562,40455.85
YM medium0.20121,61443363.88
Total 111,733100
Publisher’s Note: MDPI stays neutral with regard to jurisdictional claims in published maps and institutional affiliations.

