Article

Effect of Pretreatment by Freeze Vacuum Drying on Solid-State Anaerobic Digestion of Corn Straw

1
College of Mechanical and Electronic Engineering, Northwest A&F University, Yangling 712100, China
2
Northwest Research Center of Rural Renewable Energy, Exploitation and Utilization of Ministry of Agriculture, Northwest A&F University, Yangling 712100, China
*
Author to whom correspondence should be addressed.
Fermentation 2022, 8(6), 259; https://doi.org/10.3390/fermentation8060259
Submission received: 14 April 2022 / Revised: 12 May 2022 / Accepted: 15 May 2022 / Published: 30 May 2022
(This article belongs to the Special Issue Energy Converter: Anaerobic Digestion)

Abstract

:
As a common agricultural waste, corn straw (CS) has a refractory structure, which is not conducive to anaerobic digestion (AD). Appropriate pretreatment is crucial for addressing this problem. Thus, freeze vacuum drying (FVD) was proposed. In this study, fresh CS (F-CS) pretreated (5 h, −40 °C) by FVD and naturally dried CS (D-CS) were compared. Differences in substrate surface structure and nutrient composition were first investigated. Results show that a loose and porous structure, crystallinity, and broken chemical bonds, as well as higher proportions of VS, C, N, cellulose, hemicellulose, and crude proteins in F-CS show a potential for methane production. Besides, process performance and stability were also examined in both high (4, VS basis) and low (1, VS basis) S/I ratio AD. A higher degradation ratio of hemicellulose as well as richer dissolved microbial metabolites, coenzymes, tyrosine-like proteins, and hydrolysis rate of particulate organic matter in the F-CS system enhanced the efficiency of methane conversion. The cumulative methane yield increased from 169.66 (D-CS) to 209.97 (F-CS) mL/gVS in the high S/I ratio system (p = 0.02 < 0.05), and 156.97 to 171.89 mL/gVS in the low S/I ratio system. Additionally, 16S-rRNA-gene-based analysis was performed. Interestingly, the coordination of key bacteria (Clostridium_sensu_stricto_1, Bacillus, Terrisporobacter, Clostridium_sensu_stricto_7, Thermoclostrium, UCG-012, and HN-HF0106) was more active. Poorer Methanosarcina and Methanomassiliicoccus as well as richer Methanobrevibacter and Methanoculleus stimulated the co-relationship of key archaea with diverse methanogenesis pathways. This study aims to verify the positive effect of FVD pretreatment on AD of CS, so as to provide a reference for applications in waste management.

1. Introduction

Corn straw (CS) is a common agricultural waste which is always disposed of in unreasonable ways (e.g., burning and discarding) [1]. Improper disposal methods not only waste biological resources, but also pollute the environment of rural areas [2]. Thus, achieving a rational utilization and harmless treatment of CS is necessary. Anaerobic digestion (AD) has been proven to be an efficient strategy for waste disposal, as well as bioenergy conversion [3]. In China, the annual yield of CS is about 216 million tons and there is great potential in biogas production by using CS as a substrate of AD [4]. However, CS is often used as a substrate in a natural air-dried status, which is not easily degraded due to its nature (the internal lignin, cellulose, and hemicellulose are closely connected). Besides, the low content of nutrient in dried CS leads to inefficiency in AD [5].
Pretreatment can destroy the structure of lignocellulose, increase the contact area and enhance the efficiency of biogas production [6]. The pretreatment methods of cellulose materials mainly include chemical, biological, physicochemical, and physical methods [7]. Chemical pretreatment requires high-cost chemical reagents, complicated operations, and the easy generation of inhibitors. Biological pretreatment has a high cost in terms of time, biological enzymes, and inoculants, which makes it difficult to put into production on a large scale. Physicochemical pretreatment is prone to loss or denaturation of organic components, while being accompanied by problems such as the generation of inhibitors [8,9]. In contrast, physical pretreatment can reduce the biomass density or crystallinity, destroy the binding layer of hemicellulose and lignin, increase the specific surface area of the material, and improve the enzymatic conversion rate of cellulose [8,9]. Thus, it is important to find a physical pretreatment method that can cope with the difficulties in the degradation of lignocellulosic structure and enhance the efficiency of AD.
Freeze vacuum drying (FVD) is considered as a technology which can overcome the problems caused by traditional pretreatment under high-temperature and high-intensity operating conditions (loss and transformation of organic chemical components) [10]. It uses the three-phase principle of water to achieve the purpose of sublimation and drying of water and ice crystals under high vacuum and low temperatures, which can not only effectively maintain the nutritional components of materials [11], but also leave ice crystal pores in the sublimation process and maintain the appearance of materials [12]. FVD technology can not only better enrich nutrients such as protein, fat, and total phenol, increase the content of reducing sugar, but also maintain a loose and porous tissue structure [13]. In addition to maintaining the characteristics and structure of materials, FVD technology also plays a certain role in the degradation of cellulose [14]. Rooni et al. [15] concluded that FVD technology had no obvious effect on AD of wheat straw, but that it could significantly increase the degradation ability of cellulose. Qi et al. [16] found that after FVD, cells were stratified and stripped, which enhanced the efficiency of biomass recovery. Although FVD technology is widely used in the field of food and traditional medicine processing [17], there are few relevant studies on the use of FVD technology in assisting the transformation of agricultural waste into efficient and clean biomass energy.
In this study, green CS was pretreated by FVD and used as the substrate of solid-state AD. Naturally dried CS was also used as a control. Analyses of the variations of surface structure, compositions, nutrients, and elements of the two substrates were first performed. High (4, VS basis) and low (1, VS basis) S/I ratio systems were used to evaluate the effect on FVD pretreatment in different conditions. Process performance and stability were comprehensively examined. By comparing the methanogenic potential of the two, the advantages of FVD were preliminarily verified. Additionally, a full 16S-rRNA-gene-based analysis was performed. By integrating these results, this study aimed to verify the effect of FVD pretreatment on AD of CS, so as to provide a reference for the application of FVD technology in the field of AD and resource utilization.

2. Materials and Methods

2.1. Sources of Corn Straw and Inoculum

Green and naturally dried CS were all collected from Yangling, Shaanxi, and chopped with a steel sanctioning knife to reduce the particle size to about 5 cm. Naturally dried CS was dewatered in a 40 °C oven, then milled with a crusher through a 20-mesh sieve and stored as D-CS. Green CS was frozen at −40 °C for 24 h as F-CS. Activated sludge was taken from an industrial wastewater field near Yangling, Shaanxi, and stored at 4 °C until use.

2.2. Freeze Vacuum Drying Pretreatment

In this experiment, a freeze dryer (SCIENTZ-18N, Ningbo Xinzhi Biotechnology Co., Ltd., Ningbo, China) was used for sample FVD pretreatment. The equipment is mainly composed of a refrigeration system, vacuum system, heating system, and an electrical instrument control system. The F-CS frozen at −40 °C was evenly spread on the freezer tray, and freeze-dried to constant weight under the conditions of the lowest pressure (20 Pa) and temperature (−40 °C). After being taken out, it was pulverized to the same particle size (20 mesh) as D-CS.

2.3. Experimental Design

According to Boulanger et al. [18], a high S/I ratio (4, VS basis) and a low S/I ratio (1, VS basis) were both used in 500 mL batch digesters whose working volume was 350 mL at lab scale. The batch experiment was performed at 55 ± 1 °C (thermophilic condition) in an incubator to accelerate AD. The total solid (TS) of mixed substrate and inoculum was set as 12% for dry digestion. According to H. Benbelkacem [19], AD technology can be classified into two categories, namely dry AD (TS contents in the reactor: 12–40%) and wet AD (TS contents in the reactor <12%). A blank group with only water and the same amount of inoculum was also used to measure the gas composition and volume, which would be deducted when calculating daily methane production, daily biogas production, and cumulative methane production. Table 1 shows the addition formulas of S/I ratio and substrates. All the digesters were flushed with pure N2 gas (99.9999%) to maintain the anaerobic condition. All digesters were applied in batch experiments with triplicate for each condition, and the incubation time was 28 days, following the protocol. A 2 L gas collecting bag was connected to each reactor, and the gas volume and composition as well as pH of digesters were measured every two days.

2.4. Analytical Methods

TS and VS were estimated according to the standard methods [20]. The elemental compositions, including C, H, N, and O, were tested by an elemental analyzer (Vario EL cube, Elementar, Hanau, Germany). Cellulose, hemicellulose, and lignin composition were tested using a strong hydrolysis method [21]. Crude protein was measured with a Kjeltec8200 auto distillation unit (FOSS, Scandinavia, Sweden). Scanning electron microscopy (SEM) was obtained by scanning the apparent morphology with an S-4800 scanning electron microscope made in Japan. The Fourier transform infrared spectrometer (FTIR) of biomass samples was obtained by using PerkinElmer, FT-IR spectrum GX. The biomass (10 mg) was mixed well with 200 mg of KBr and the mixture was compressed for preparation of pellets. Each spectrum was the average of 32, with the co-addition of scans with a total scan time of 15 s in the IR range of 400–4000 cm−1 at 2 cm−1. X-ray diffraction (XRD) analysis was performed using a Rigaku diffractometer (Rigaku, Tokyo, Japan) using Cu Karadiation at 40 kV and 130 mA, with a scanning angle of 5–50° at a scanning speed of 0.5° min−1. The gas volume was expressed at room temperature and standard pressure (25 °C, 101 kPa) and measured by using the drainage method. Biogas composition was measured by using a GC-2014c gas chromatograph equipped with a thermal conductivity detector (TCD). The parameters were as follows: the inlet temperature was 100 °C; the detector temperature was 150 °C. Cumulative methane production was calculated as the sum of the daily methane production. The pH in each digester was measured using a pH meter (Mettler Toledo, Shanghai, China). The volatile fatty acid (VFA) concentration, including formic acid, acetic acid, propionic acid, butyric acid, and lactic acid were measured by gas chromatography–mass spectrometry (Agilent GC-MS) [22]. Three-dimensional excitation-emission matrix (3D-EEM) fluorescence spectroscopy (HI-TACHI F-7000) was used to determine the evolution of dissolved organic matter during AD. The conditions were: tube voltage of 700 V, excitation (Ex) and emission (Em) wavelengths of 200–500 nm and 250–500 nm, respectively, in 10 nm increments, a slit width of 10 nm, and scanning speed of 1200 nm/min. Total ammonia nitrogen (TAN) concentration was analyzed with a Flow Injection Analyser (FIA) (Lachat QuickChem 8000, Lachat instrument, Milwaukee). The concentration of free ammonia nitrogen (FAN) was estimated using the following equation [23]
F A N = T A N 1 + 10 p H K α
Kα = 10−(0.09018 + 1729.92/T(K))
where TAN was total ammonia nitrogen, and pH was the instant value in the reactors. Kα was a dissociation constant reflecting on temperature Equation (2); the value for 55 °C is 3.91 × 10⁻⁹.
The high throughput sequence was analyzed through the Majorbio Cloud Platform (www.majorbio.com, accessed on 11 October 2021). Samples for microbial analysis were taken at day 10 (stable period, named as S_T) and 28 (end period, named as E_T), respectively. A total of 20 mL of the test solution was centrifuged at 4 °C for 30 min; the precipitate was used for gene sequencing. The total DNA of the microbial community in the precipitate was extracted using E.Z.N.A. ® Soil DNA Kit (Omega Bio-tek, Norcross, GA, USA), and the concentration and purity of the extracted DNA were measured using an ultra-micro spectrophotometer (NanoDrop 2000). The extracted DNA was stored at −80 °C prior to analysis. For bacteria, the primer pairs 338F (5′-ACTCCTACGGGAGGCAGCAG-3′) and the reverse primer 806R (5′-GGACTACHVGGGTWTCTAAT-3′) were used for the amplification. The PCR amplification was performed in the V4 and V5 region of the 16S rRNA gene. The primer pairs of 524F (5′-TGYCAGCCGCCGCGGTAA-3′) and 985R (5′-YCCGGCGTTGAVTCCAATT-3′) were used to amplify archaea. The PCR products were recovered by agarose gel (2%) electrophoresis and purified using an AxyPrep DNA Gel Extraction Kit. The DNA library was constructed using the NEXTfies®Rapid DNA-Seq Kit and sequenced using the MiSeq PE300 (Illumina, San Diego, CA, USA) platform. The quality control, splicing, operational taxonomic units (OTU) clustering, and species annotation of the original data were performed as described previously [14].

2.5. Kinetic Model

Considering that straw is a solid waste, this study adopts a first-order kinetic model to simulate the hydrolysis kinetics of F-CS and D-CS during AD [24]. Methane production from AD of F-CS with D-CS can be predicted using Equation (3) [25,26].
M ( t ) = M max × ( 1 e k t )
Equation (3) can be linearized as Equation (4), which is an equation for a straight line. The magnitude is the hydrolysis rate constant [27]
- K t = I n [ 1 M ( t ) M max ]
where M(t) is the cumulative methane production at time t (mL/gVS); Mmax is the potential maximum methane production (mL/gVS); K is the hydrolysis rate constant (d−1) and t is time (d).
Apart from K, the maximum methane production rate (Rmax) and lag phase (λ), which can be calculated using the modified Gompertz model, are also important factors. This is considered to be a typical “S-shape” style curve equation [25,26]:
M ( t ) = M max exp { exp [ R max e M max ( λ t ) + 1 ] }
where Rmax is the maximum methane production rate (mL/g VS-d); λ is the lag phase (d); and e is the exp(1) = 2.7183. The parameters Mmax, M(t), and t are obtained from the batch experiments. OriginPro 2021 and IBM SPSS Statistics 24 were used for data analysis.

3. Results and Discussion

3.1. Variations in Surface Structure and Compositions during FVD Pretreatment

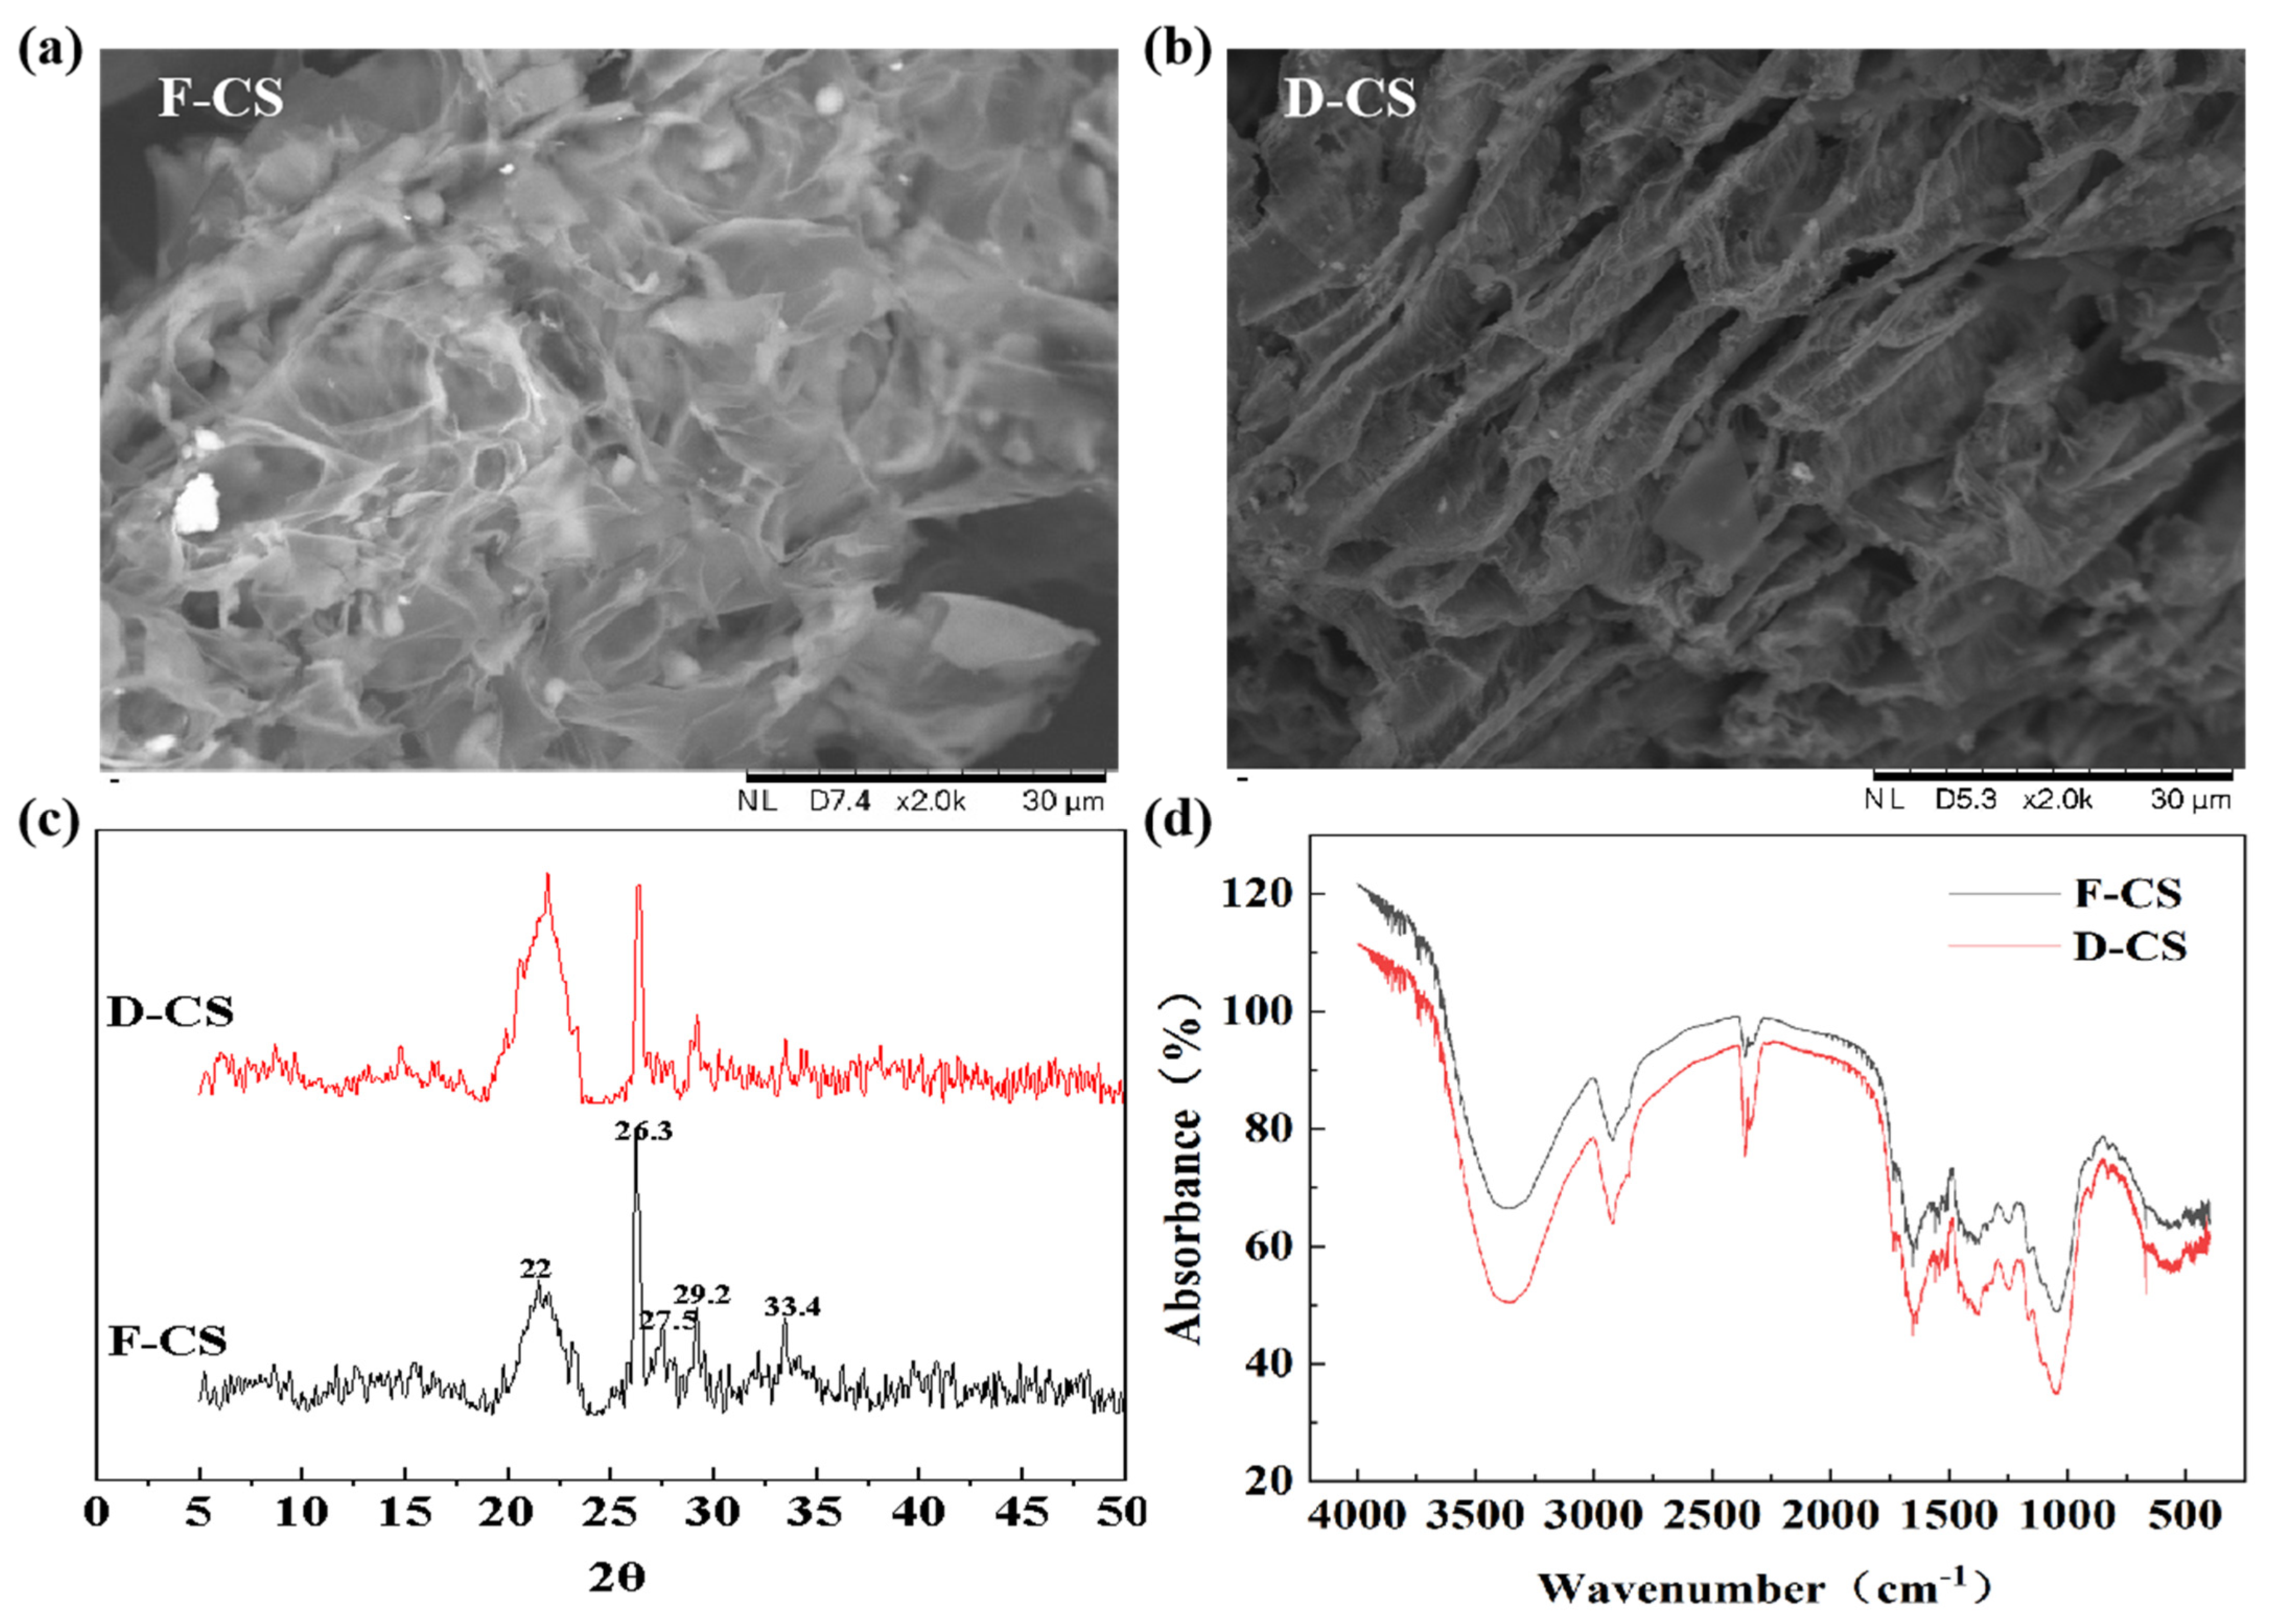
3.1.1. Surface Structure Analysis

SEM results for F-CS and D-CS are shown in Figure 1a,b. The surface texture of D-CS was full and neat, and the internal lignin, cellulose, and hemicellulose were closely connected, which hinders the degradation of materials by microorganisms and enzymes [15]. Differently, the surface of F-CS became wrinkled and curled, and presented a loose and porous physical structure, which effectively increases the area of contact with microorganisms [11]. Under low temperature, heat-sensitive substances are not easily deformed, and volatile organic substances are not easily volatilized, which is conducive to fully maintaining the organic content and original characteristics of materials [21]. Results for XRD are shown in Figure 1c. The typical diffraction patterns of F-CS and D-CS with a prominent 2θ peak at round 22.0° and a minor peak at around 15.5° were assigned to (002) and (101) planes, which is basically consistent with the characteristic peaks of natural cellulose [28]. The peak position was not significantly different between F-CS and D-CS, suggesting that the crystalline region of both was not destroyed [29]. The weakening of the typical diffraction peaks of F-CS indicates that more cellulose macromolecules were converted into small molecules, which were then degraded [30]. Thus, the crystallinity of F-CS makes it more suitable as a substrate for AD [31]. The groups and chemical bonds in the lignin structure can be intuitively characterized using FTIR [23], which shows a curve from wavenumbers 400 to 4000 cm−1 (Figure 1d). The characteristic absorption peaks of the infrared spectra of F-CS and D-CS are roughly the same, indicating that the basic chemical structure of the two changes insignificantly and only the internal lignocellulose changed, which showed that the characteristic absorption peaks are enhanced or weakened. There is a strong absorption peak at 3370 cm−1 generated by O-H stretching vibration, and 2919 cm−1 represents methylene (-CH2) and methyl (-CH3) in cellulose [22]. The two absorption peaks weakened, indicating that some hydrogen bonds, methyl groups and methylene groups in F-CS cellulose were broken, the molecular structure of the fiber was destroyed, and the cellulose was degraded. The characteristic absorption peak at 1726 cm−1 is a non-conjugated hydrogen bond, which represents the xylan acetyl group in hemicellulose [14]. The characteristic absorption peak of F-CS was weakened here, which proves that its internal acetyl group was broken and hemicellulose was degraded. The values of 1416 cm−1 and 1373 cm−1 are respectively related to the vibration of aromatic rings and C-H bonds in lignin [28], and the two characteristic absorption peaks did not change significantly, indicating that lignin was basically unchanged. The absorption peaks at 1162 and 1050 cm−1 represent the presence of C-O-C bonds of cellulose and hemicellulose, which generally indicate the presence of neutral polysaccharides [32], where the absorption peaks show a weakening trend, indicating that, in F-CS, C-O-C breakage as more pronounced in hemicellulose than cellulose. Some of the chemical bonds inside F-CS were broken, increasing the dissolution of glucose and xylose to achieve the purpose of degrading cellulose, but this has no degradation effect on macromolecular structures such as lignin, which is consistent with the study of Semenov et al. [33].

3.1.2. Nutrient and Elemental Analyses of F-CS, D-CS, and AD Digestate

The physicochemical characteristics of F-CS, D-CS, and inoculum are listed in Table 2. The TS of F-CS and D-CS was 94.04 ± 0.40% and 99.11 ± 0.79%, while VS was 86.42 ± 1.11% and 85.34 ± 0.48%, respectively. The opposing result of TS and VS verified that drying will cause partial loss of nutrients, and FVD pretreatment will retain some of the lost nutrients. Compared with D-CS, the content of total C (38.27 ± 7.73% vs. 38.03 ± 5.90%) and N (2.25 ± 0.71% vs. 1.82 ± 0.26%), as well as cellulose (37.49 ± 1.52% vs. 34.62 ± 0.21%), hemicellulose (31.22 ± 1.67% vs. 26.25 ± 0.51%) and crude protein (19.63 ± 0.37% vs. 12.36 ± 0.15%), was also higher in the F-CS, implying pretreatment by FVD could retain the organic compounds in CS to a greater extent. Hydrolytic bacteria can decompose cellulose and hemicellulose into smaller organic acids, which can be further utilized in microbial cells to generate methane [29]. Crude protein is also utilized by anaerobic bacteria and archaea, which is related to the efficiency of methane conversion. Thus, more enriched nutrients in F-CS highlight its methanogenic potential. Besides, the nutrient composition in inoculum shows that it has also potential for methane production, which was deduced from calculating daily methane production and cumulative methane production.
The utilization ratio of the substrate is listed in Table 3. After considering the standard deviation, the difference in degradation ratio of hemicellulose (T3 and T4), cellulose, and crude protein in a low S/I ratio system is almost negligible. Only the degradation ratio of hemicellulose in a high S/I ratio AD (T1 and T2) of F-CS is richer than for D-CS, which shows the effect of FVD pretreatment. In the hydrolysis stage, the hydrolytic bacteria could decompose hemicellulose into smaller molecules of organic acids, which were further utilized after entering the microbial cells. Finally, methane was generated under the action of the methanogens [34]. From this point, the F-CS digester showed greater methanogenic potential.

3.2. Methane Production during AD of F-CS and D-CS

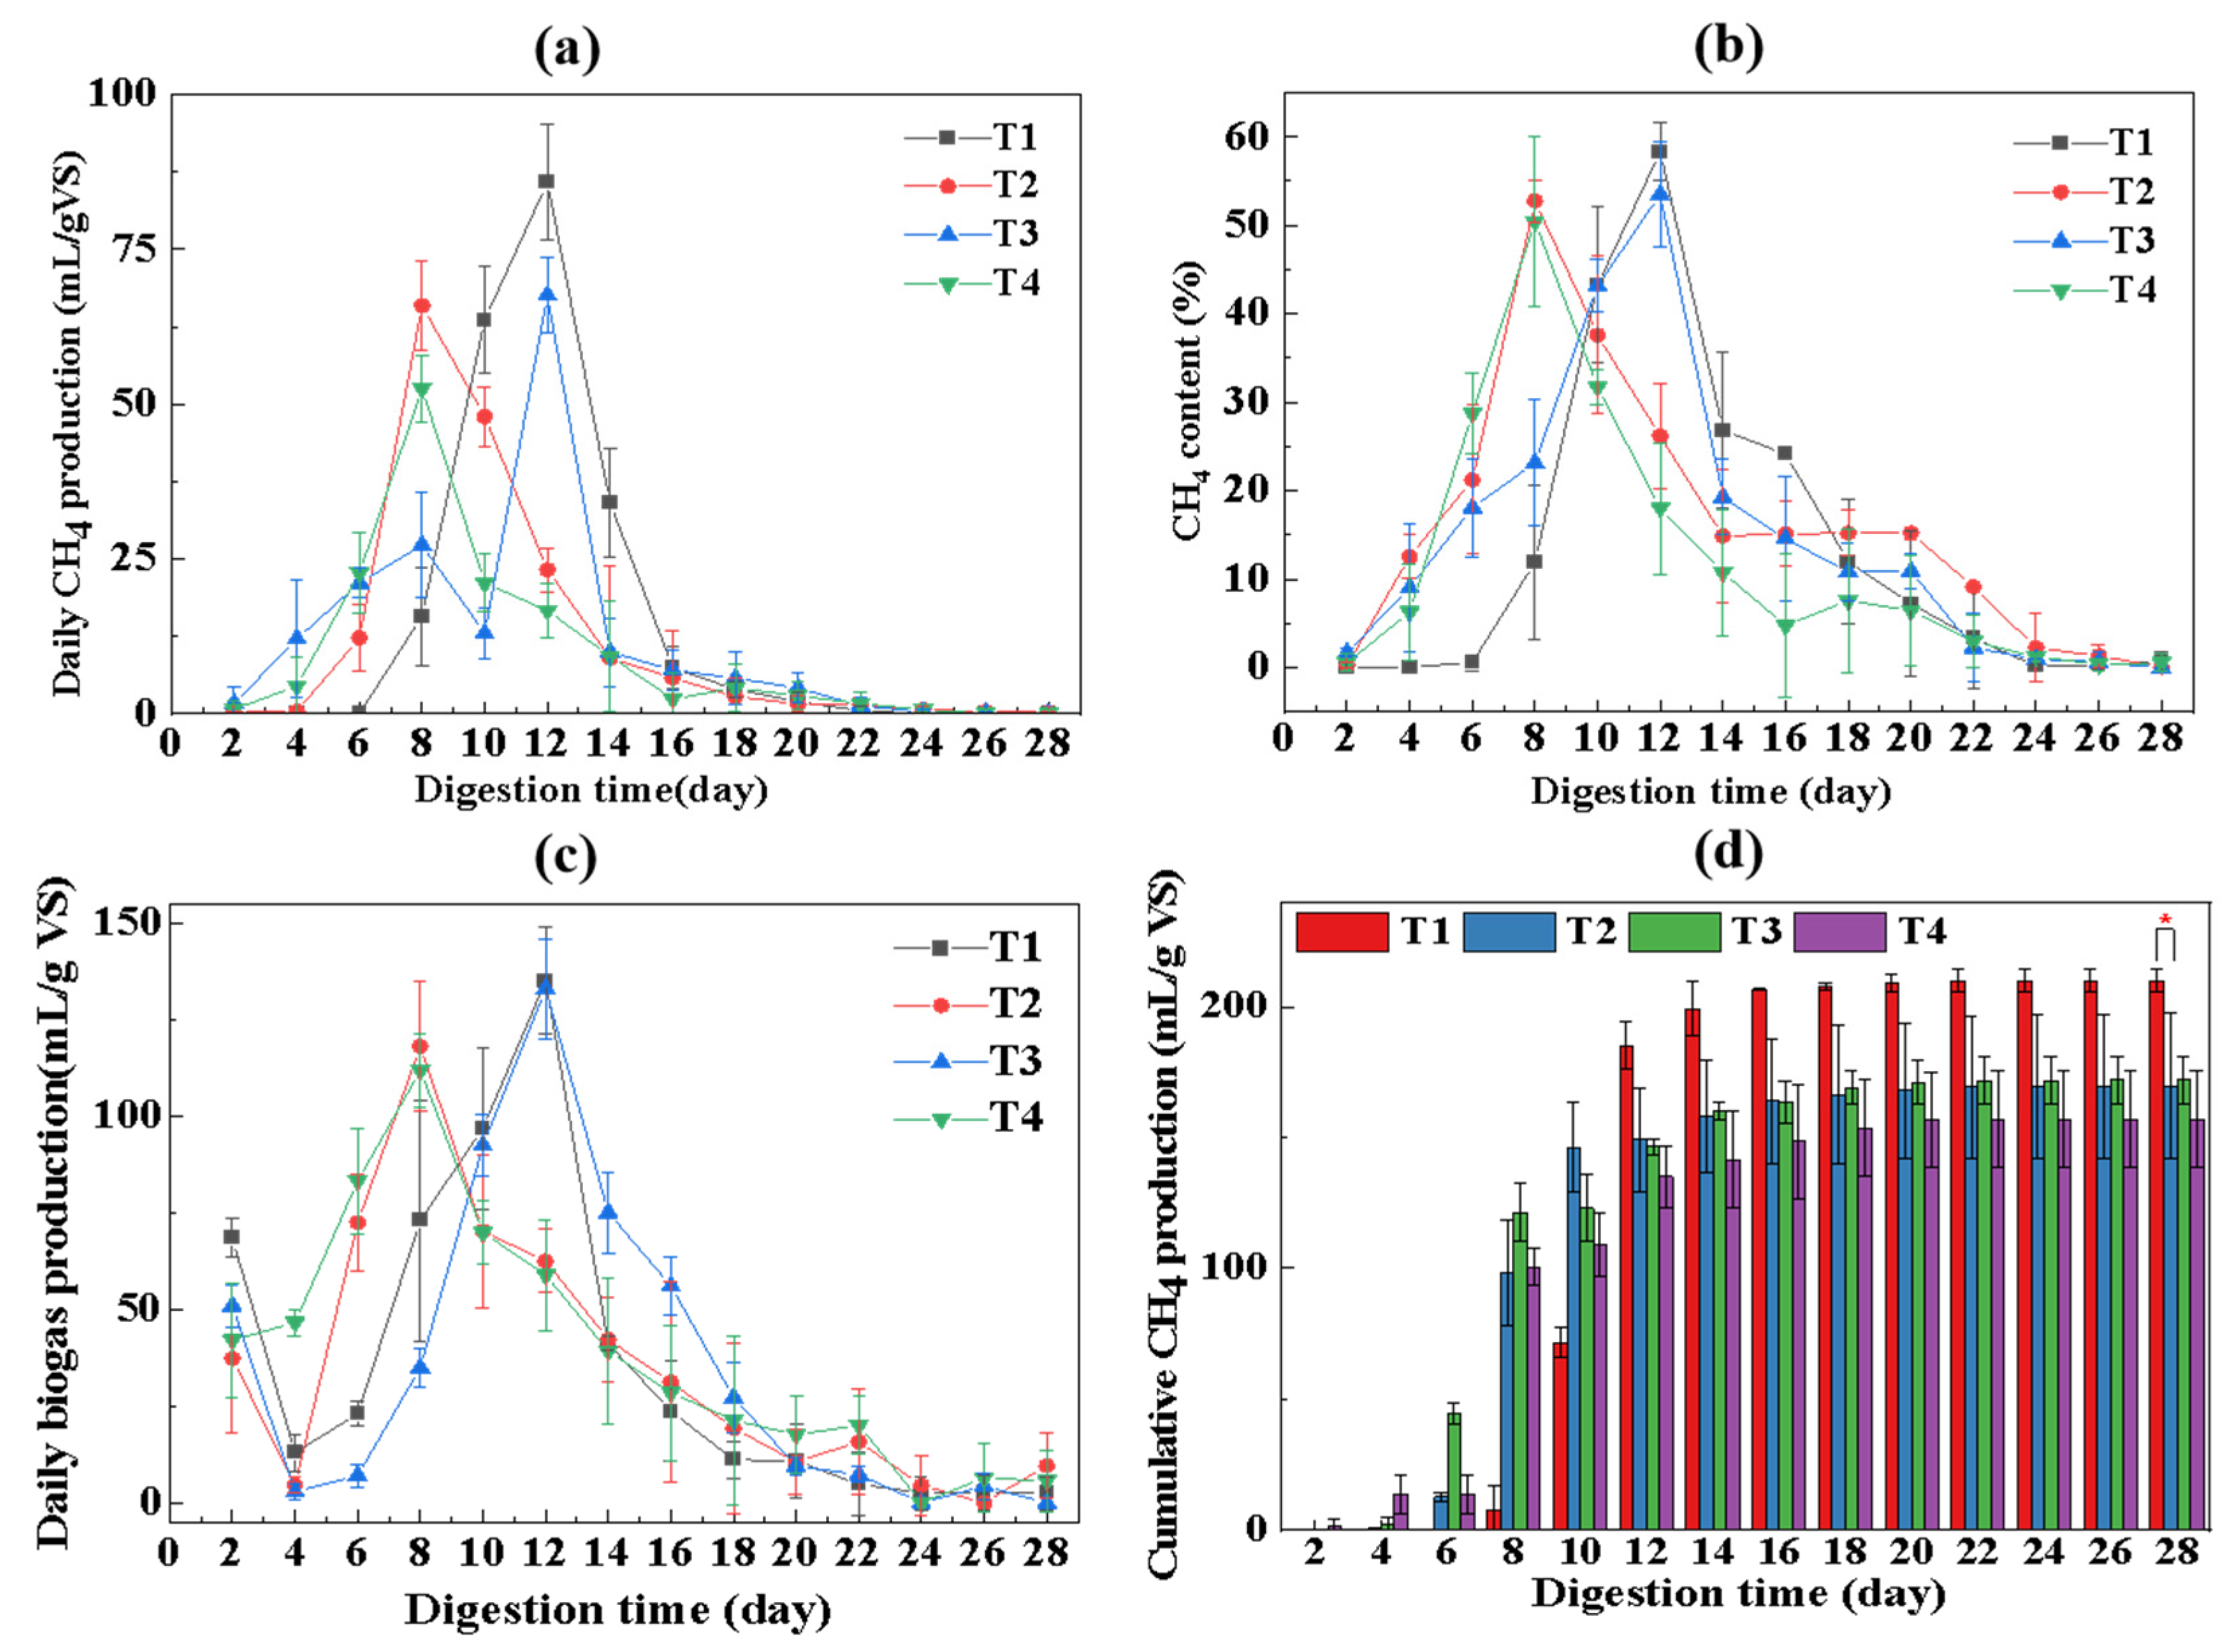
3.2.1. Daily and Cumulative Methane Production

The daily methane production, methane content, and daily biogas production of F-CS and D-CS after 28 days of AD are shown in Figure 2a–c. The trend of daily methane production in all treatments firstly shows a rapid increase in the early stage, and a slow decline after reaching peak gas production. In the early stage of AD, hydrolytic acidifying bacteria multiply rapidly after a short adaptation period and decompose organic substances such as cellulose and hemicellulose. They are converted into organic substances that can be directly utilized by methanogens. After the processes of hydrolysis and acidification, the relatively refractory organics are gradually decomposed. The peak of methane production (65.88 mL/gVS vs. 52.46 mL/gVS) and biogas production (118.02 mL/gVS vs. 111.72 mL/gVS) of D-CS in high (T2) or low (T4) S/I ratio systems all appeared on the 8th day, and the methane content also reached a peak on this day (52.76% vs. 50.44%). After pretreatment with FVD, F-CS in high (T1) or low (T3) S/I ratio systems reached both methane production (85.81 mL/gVS vs. 67.54 mL/gVS) and biogas production peaks (135.01 mL/gVS vs. 132.96 mL/gVS) on the 12th day, and the methane content also reached its maximum (58.33% vs. 53.48%). The maximum daily methane/biogas yield of the F-CS system (T1, T3) was reached 4 days later than that of D-CS (T2, T4). According to Sun et al. [28], the long lag time of F-CS is probably due to VFAs.
The cumulative methane production of high (T1, T2) and low (T3, T4) S/I ratio systems after deducting the effect of the inoculum is shown in Figure 2d. Results show that the high S/I ratio system achieved a better methanogenic potential for both F-CS and D-CS. Furthermore, the F-CS system possesses the higher cumulative methane production with both high (T1, 209.97 mL/gVS > T2, 169.66 mL/gVS, p = 0.02 < 0.05) and low (T3, 171.89 mL/gVS > T4, 156.97 mL/gVS) S/I ratios. Particularly, in the high S/I ratio system, F-CS remarkably enhanced the methane yield by 23.76% (40.31 mL/gVS). The water in F-CS after FVD treatment sublimed directly from ice crystals, and the occupied space remained. The material was loose and porous, and the shrinkage was small. This loose and porous honeycomb structure is conducive to contact between microorganisms and the material, and is conducive to the degradation of straw. Therefore, the cumulative methane production of F-CS after FVD was greater than that of D-CS.

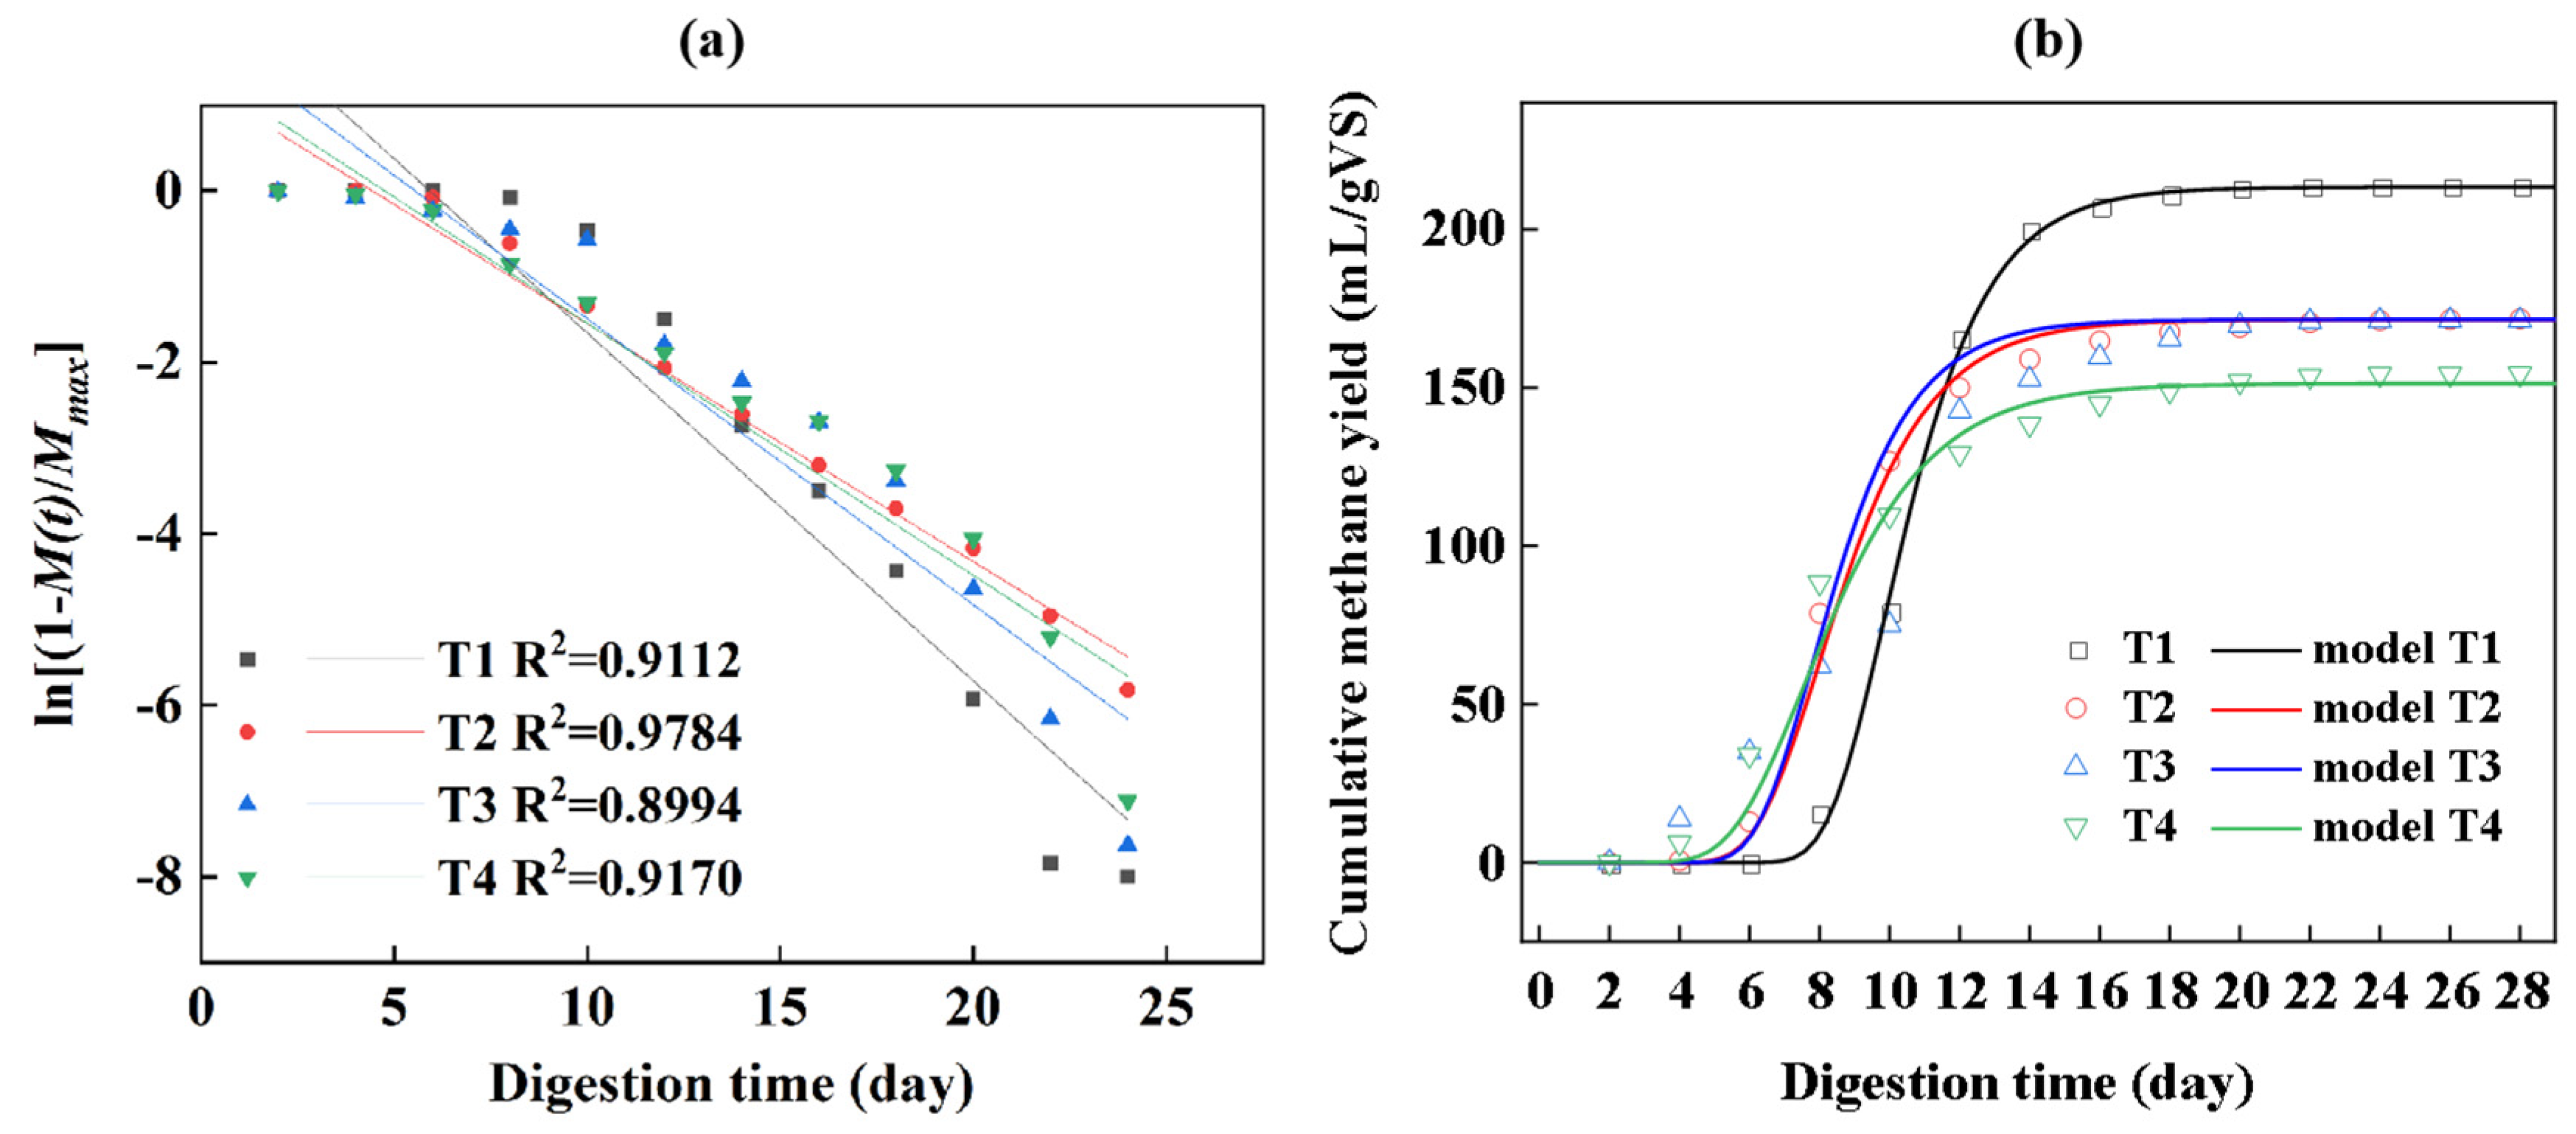
3.2.2. Kinetic Model

The hydrolysis of particulate organic matter is described by a linearized first-order kinetic model and a modified Gompertz model in Figure 3. The parameters R2 (correlation coefficient), K (hydrolysis constants, d−1), Rmax (maximum methane production rate, mL/g VS-d), and λ (lag phase, d) are significant factors for reflecting the efficiency of AD. Figure 3a describes linear regression fits for the estimation of K. R2 and K (the slope) of four systems are listed in Table 4. In the high S/I ratio system, the K value for T1 (0.41 d−1, R2 = 0.9300) was 1.4 times higher than that of T2 (0.29 d−1, R2 = 0.9776). For comparison, the K values reported in previous studies were in the range of 0.02–0.56 d−1 [27,35], which reflects that the K values in this experiment are consistent with other studies. In the low S/I ratio system, the K value for T3 (0.33 d−1, R2 = 0.8994) was 1.1 times higher than that of T4 (0.31 d−1, R2 = 0.9299), and also in the reasonable range. In both high or low S/I ratio systems, F-CS achieved higher K values. This suggests that FVD pretreatment significantly enhanced the bioavailability of the organic content in F-CS.
The modified Gompertz equation from the batch assay data for AD of F-CS and D-CS is presented in Figure 3b. R2, Rmax, and λ of four systems are listed in Table 4. Rmax is the maximum methane production rate, which showed a similar change rule as the hydrolysis constant (K). That is, T1 (47.9 mL/gVS-d) > T2 (35.3 mL/gVS-d) and T3 (33.7 mL/gVS-d) > T4 (26.2 mL/gVS-d), illustrating that Rmax of the F-CS system was always higher (improved by 35.69% and 28.63%) than D-CS. Among them, the lowest Rmax was obtained in the low S/I ratio AD of D-CS (T4). Athanasoulia et al. [35] found that due to the refractory lignocellulose microcrystalline structure of the substrate, the conversion rate was limited. This also reflects that due to an active microbial activity in the comfortable metabolism conditions supported by degradable structure, abundant elements, surface functional groups and crystallinity, the AD of F-CS accelerated the mixing of the substrate’s conversation rate. Similarly to this result, Xie et al. [27] also reported that the co-digestion of PM with grass improved the conversion rate of organic matter. Additionally, λ also played a significant role in substrate biodegradability and utilization rate [27], which was consistent with Rmax.
In conclusion, the modified Gompertz model shows that the results of this experiment are suitable. To assess the robustness of the model results in the modified Gompertz model, the predicted methane production was plotted against the measured values, as plotted in Figure 3b. R2 values were in the range of 0.9428–0.9993. Similarly, Kafle et al. [25] also confirmed a better fit of the improved Gompertz model during the co-digestion of apple waste and pig manure.

3.3. Variation of Intermediate Metabolism during AD of F-CS and D-CS

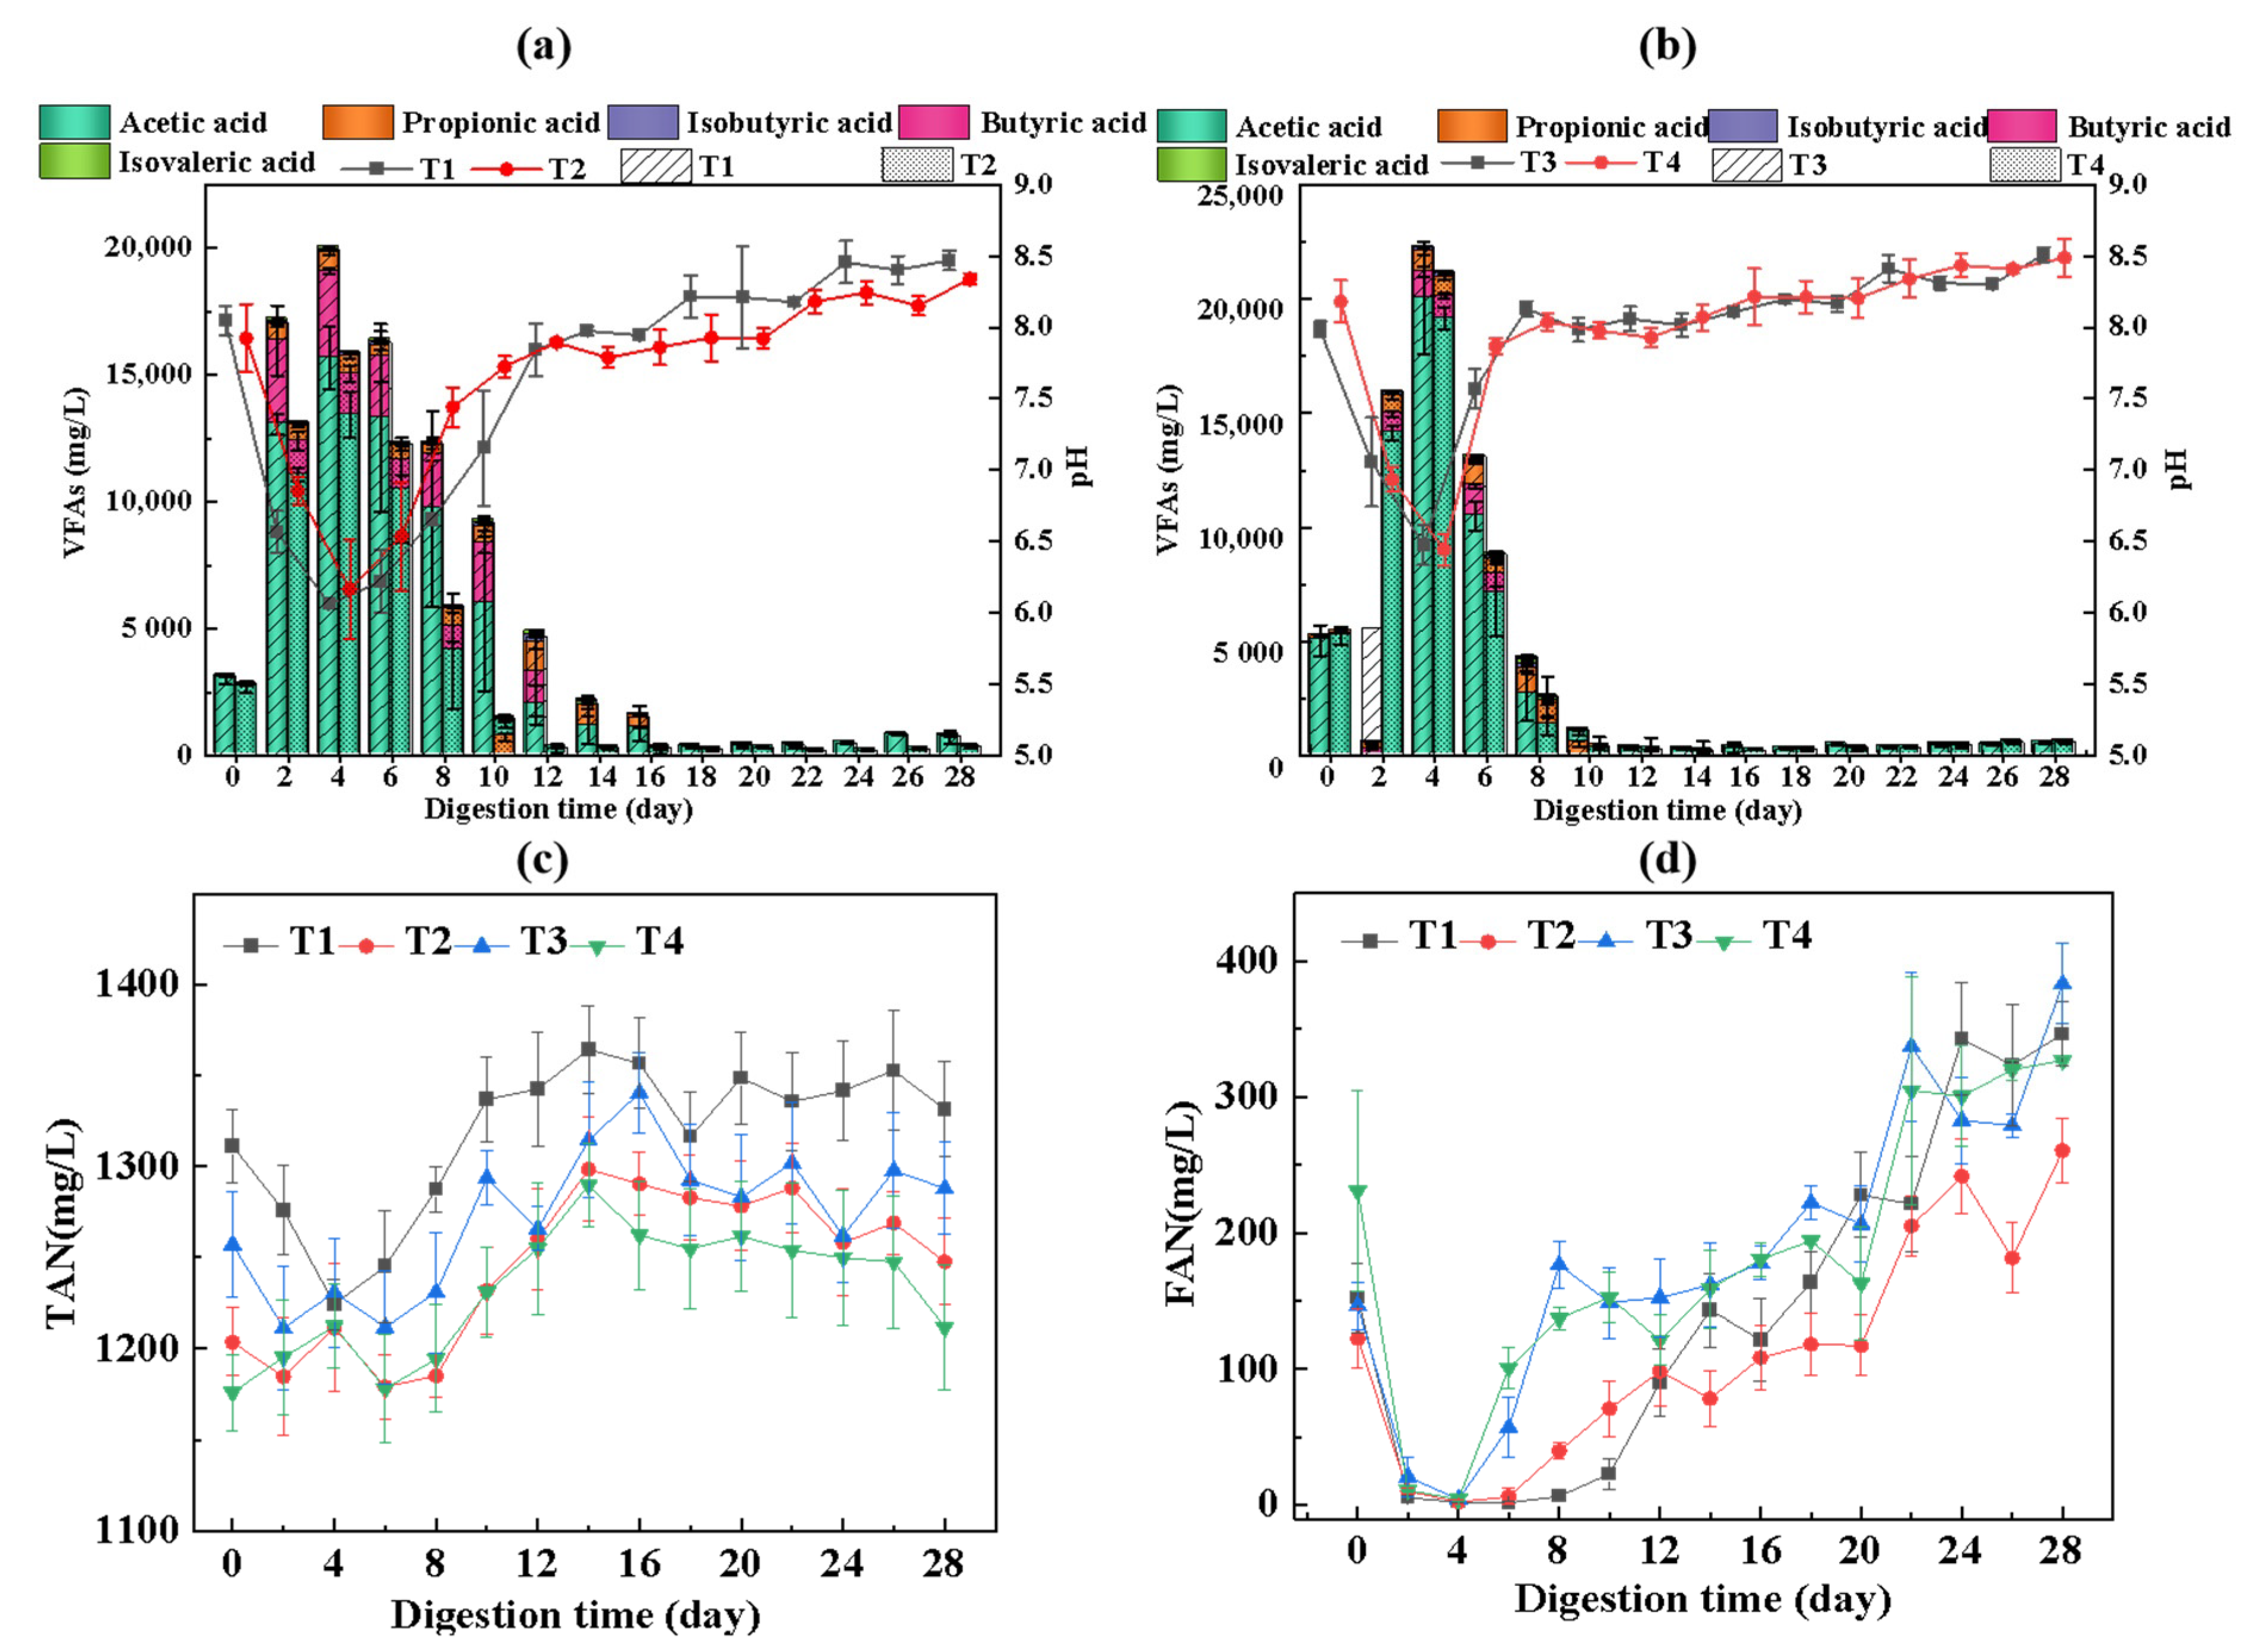
3.3.1. VFA Production

Acetic (HAc), propionic (HPr), iso-butyric, n-butyric, iso-valeric, and n-valeric acid were the main intermediates in the acidogenesis step [7]. The dynamic of pH and VFA concentration are shown in Figure 4a,b, respectively. Results show a pH drop at the initial stage, which then returns to neutral and remains stable until the end of AD. A higher efficient degradation of organic matter in the F-CS system (T1) at the initial stage accelerated VFA accumulation. Consequently, the accumulation of organic acid led to a pH drop and unbalanced the stability of the system, finally resulting in prolonging the buffer time (Figure 2d). Furthermore, pH in the high S/I ratio system was maintained at 5.94–8.51, while it was 6.53–8.52 in the low S/I ratio system. At the peak of daily methane/biogas yield in D-CS (8th day), the value for the high (7.24) S/I ratio system was lower than for the low ratio (8.26). The same trend appeared in F-CS (12th day), which was 7.84 in the high S/I ratio system and 8.11 in the low ratio system. Many studies show that pH at a seriously low level (<5.50) might inhibit methanogenic activity, which is also considered to be the cause of long lag time [31]. According to Sun et al. [36], with a pH = 5.10, methanogenic activity is 10 times lower than for the pH = 7.00, which is corroborated by the results. However, the inhibition did not occur in this study due to the relatively high pH (≥5.94). Moreover, an appropriately lower pH (suitable pH range for most methanogenic archaea, 6.80–7.80 [7]) is considered to be more conducive to methane production.
The variation in VFA production happened in response to changes in pH. For AD of F-CS (T1, T3) from the 0th–12th day, the VFA concentration increased from initial (3133.21 mg/L, T1; 5271.03 mg/L, T3) to peak (4th day, 19,952.21 mg/L, T1; 4th day, 22,297.18 mg/L, T3) and finally dropped down to 4689.95 mg/L (T1) and 376.52 mg/L (T3). For D-CS (T2, T4) (0th–8th day), VFA concentration increased from initial (2800.30 mg/L, T2; 5442.45 mg/L, T4) to peak (4th day, 15,910.04 mg/L, T2; 4th day, 21,206.1 mg/L, T4) and finally dropped down to 12,280.44 mg/L (T2) and 2583.77 mg/L (T4). At the initial stage, large amounts of organic matter were degraded by hydrolytic bacteria, resulting in a short-term acidification of the system. The maximum VFA production in both F-CS and D-CS systems all appeared on the 4th day, where the F-CS system presented a higher concentration than the D-CS system (T1 > T2, T3 > T4). After the peak, the content of VFAs began to decline, and majority acids were successfully further converted to methane. However, the final concentration of VFAs in F-CS was lower than in the D-CS system (T1 < T2, T3 < T4). The opposite trend indicates that the F-CS system converted the richer cellulose, hemicellulose, crude protein and other organic matter to a higher content of VFAs at the initial stage. Its loose structure provided a suitable environment for the attachment and growth of microorganisms, which was more favorable for methanogens to convert methane.
Large amounts of acetic, propionic, and butyric (HBu) acid were generated on the 4th day. Previous studies demonstrated that acetic acid consists of 70% VFAs and that it is the main precursor to synthesizing methane through acetoclastic methanogenesis (AM) or syntrophic acetate oxidation combined with hydrogentrophic methanogenesis (SAO-HM) [34,37]. HPr has also been considered as an inhibitor in thermophilic conditions due to its slow biodegradation rate, which consequently requires a long hydraulic retention time [28]. Several researchers have shown that an excessive accumulation of HPr affected the growth, diversity, and activity of methanogens [38,39]. R.Gourdon et al. [40] studied the effect of HPr concentration on AD, with an emphasis on the acidogenic step. Results show that, when the content of HPr was 4 g/L or more, the rate of the acidogenic step was reduced, but the effect was small. In this study, the concentration of HPr did not reach the inhibitory concentration, and there was no strong inhibitory effect. Thus, HPr accumulation in AD must be considered mainly as a warning, and not as a cause of a disturbance. During the AD process, a higher content of HAc in F-CS (T1, T3) than in D-CS (T1, T3) was found, which is consistent with the results of total VFA variation. The short-term accumulation of HAc and HBu in each system led to system instability (low pH, 5.94), while it was immediately consumed through an obligatory syntrophic partnership of methanogens (AM or SAO-HM pathway) [41,42], and desirable methane production performances were achieved completely.

3.3.2. Variation of TAN and FAN

Organic acids generated during AD could be neutralized by ammonia to achieve an appropriate pH for AD, which could effectively relieve the risk of acid accumulation, maintain the pH, and avoid inhibition [43]. However, an excessively high content of TAN and FAN are considered as strong inhibitors to methanogens due to the interruption to the specific enzyme and microbial activity [44,45]. Kanehisa et al. [46] found that a concentration of TAN that reached more than 3000 mg/L could cause a reduction of methane production, and levels above 1700 mg/L of FAN concentration in the aqueous phase could inhibit methanogenesis. The concentrations of TAN shown in Figure 4c were all less than 1400 mg/L in each digester, which caused no obvious inhibition to enzymes and microbial communities. The variation in FAN concentration calculated by Equation (1) is presented in Figure 4d. Result show that there was less than 400 mg/L in all the digesters. Hence, the increase of FAN was negligible in impeding the activity of methanogenesis. Xie et al. [47] treated CS by using solid-state urea as the substrate of an AD system. Result show that the TAN ranges of different digesters (198.19–263.45 mg/L, 309.13–348.29 mg/L, 234.08–299.35 mg/L, 222.66–256.92 mg/L, and 214.50–305.87 mg/L, respectively) were all stable for efficient biogas production, which is consistent with this work. Due to the influence of digested substrates (lignocellulosic biomass), the nitrogen level of the system is always kept at a relative suitable range (250–1100 mg/L, Steinhaus et al. [48]), which is also related to the stable operation of the system.

3.3.3. D-EEM Fluorescence Spectra Analysis

The digestion supernatant could be divided into five regions based on the specific ranges of the Ex and Em wavelength by EEM spectra. The five different regions were: tyrosine-like proteins (Region I), tryptophan-like (Region II), fulvic acid-like (Region III), soluble microbial by-product (Region IV), and humic acid-like (Region V) substances [49]. Among these organics, tyrosine-like proteins and soluble microbial by-product-like substances were considered as biodegradable substrates, while tryptophan-like, fulvic acid-like, and humic acid-like substances were regarded as the non-biodegradable substrates. Figure 5 shows four digesters (T1-T4) in the stable (named as S_T1-S_T4, Figure 5a) and end (named as E_T1-E_T4, Figure 5b) stages.
During the stable period (peak methane production), the fluorescence intensity in the Region IV of F-CS (S_T1, S_T3) was significantly higher than that of the D-CS system (S_T2, S_T4) in both high and low S/I ratio systems, indicating more abundant dissolved microbial metabolites in the F-CS system. Parts related to methane conversion (such as proteins, coenzymes, small molecular organic acids, and pigments) also showed greater abundance, verifying that F-CS had a significant increment of biodegradable substrate contents. Moreover, there were more species in the community of the high S/I ratio system, which could improve the environmental tolerance of the community and methane production. Secondly, F-CS also showed higher fluorescence intensity of Region I and II in both the high and low S/I ratio system, indicating a richer abundance of tyrosine-like and tryptophan-like proteins, which is also consistent with the crude protein data (Table 2). Thirdly, the fluorescence intensity of Region III and V was at a relatively low level, and presents negligible difference in the F-CS and D-CS systems (VFAs analysis, Figure 4a,b). Furthermore, a large amount of organic matter was consumed and transformed at the end period. Thus, the fluorescence intensity of each region in E_T1, E_T2, E_T3, and E_T4 was at a lower level, particularly in Regions I, II, and IV. Along with the gradual utilization of aromatic protein substances and soluble protein microorganisms, the cumulative methane production was enhanced.

3.4. Microbial Community Analysis

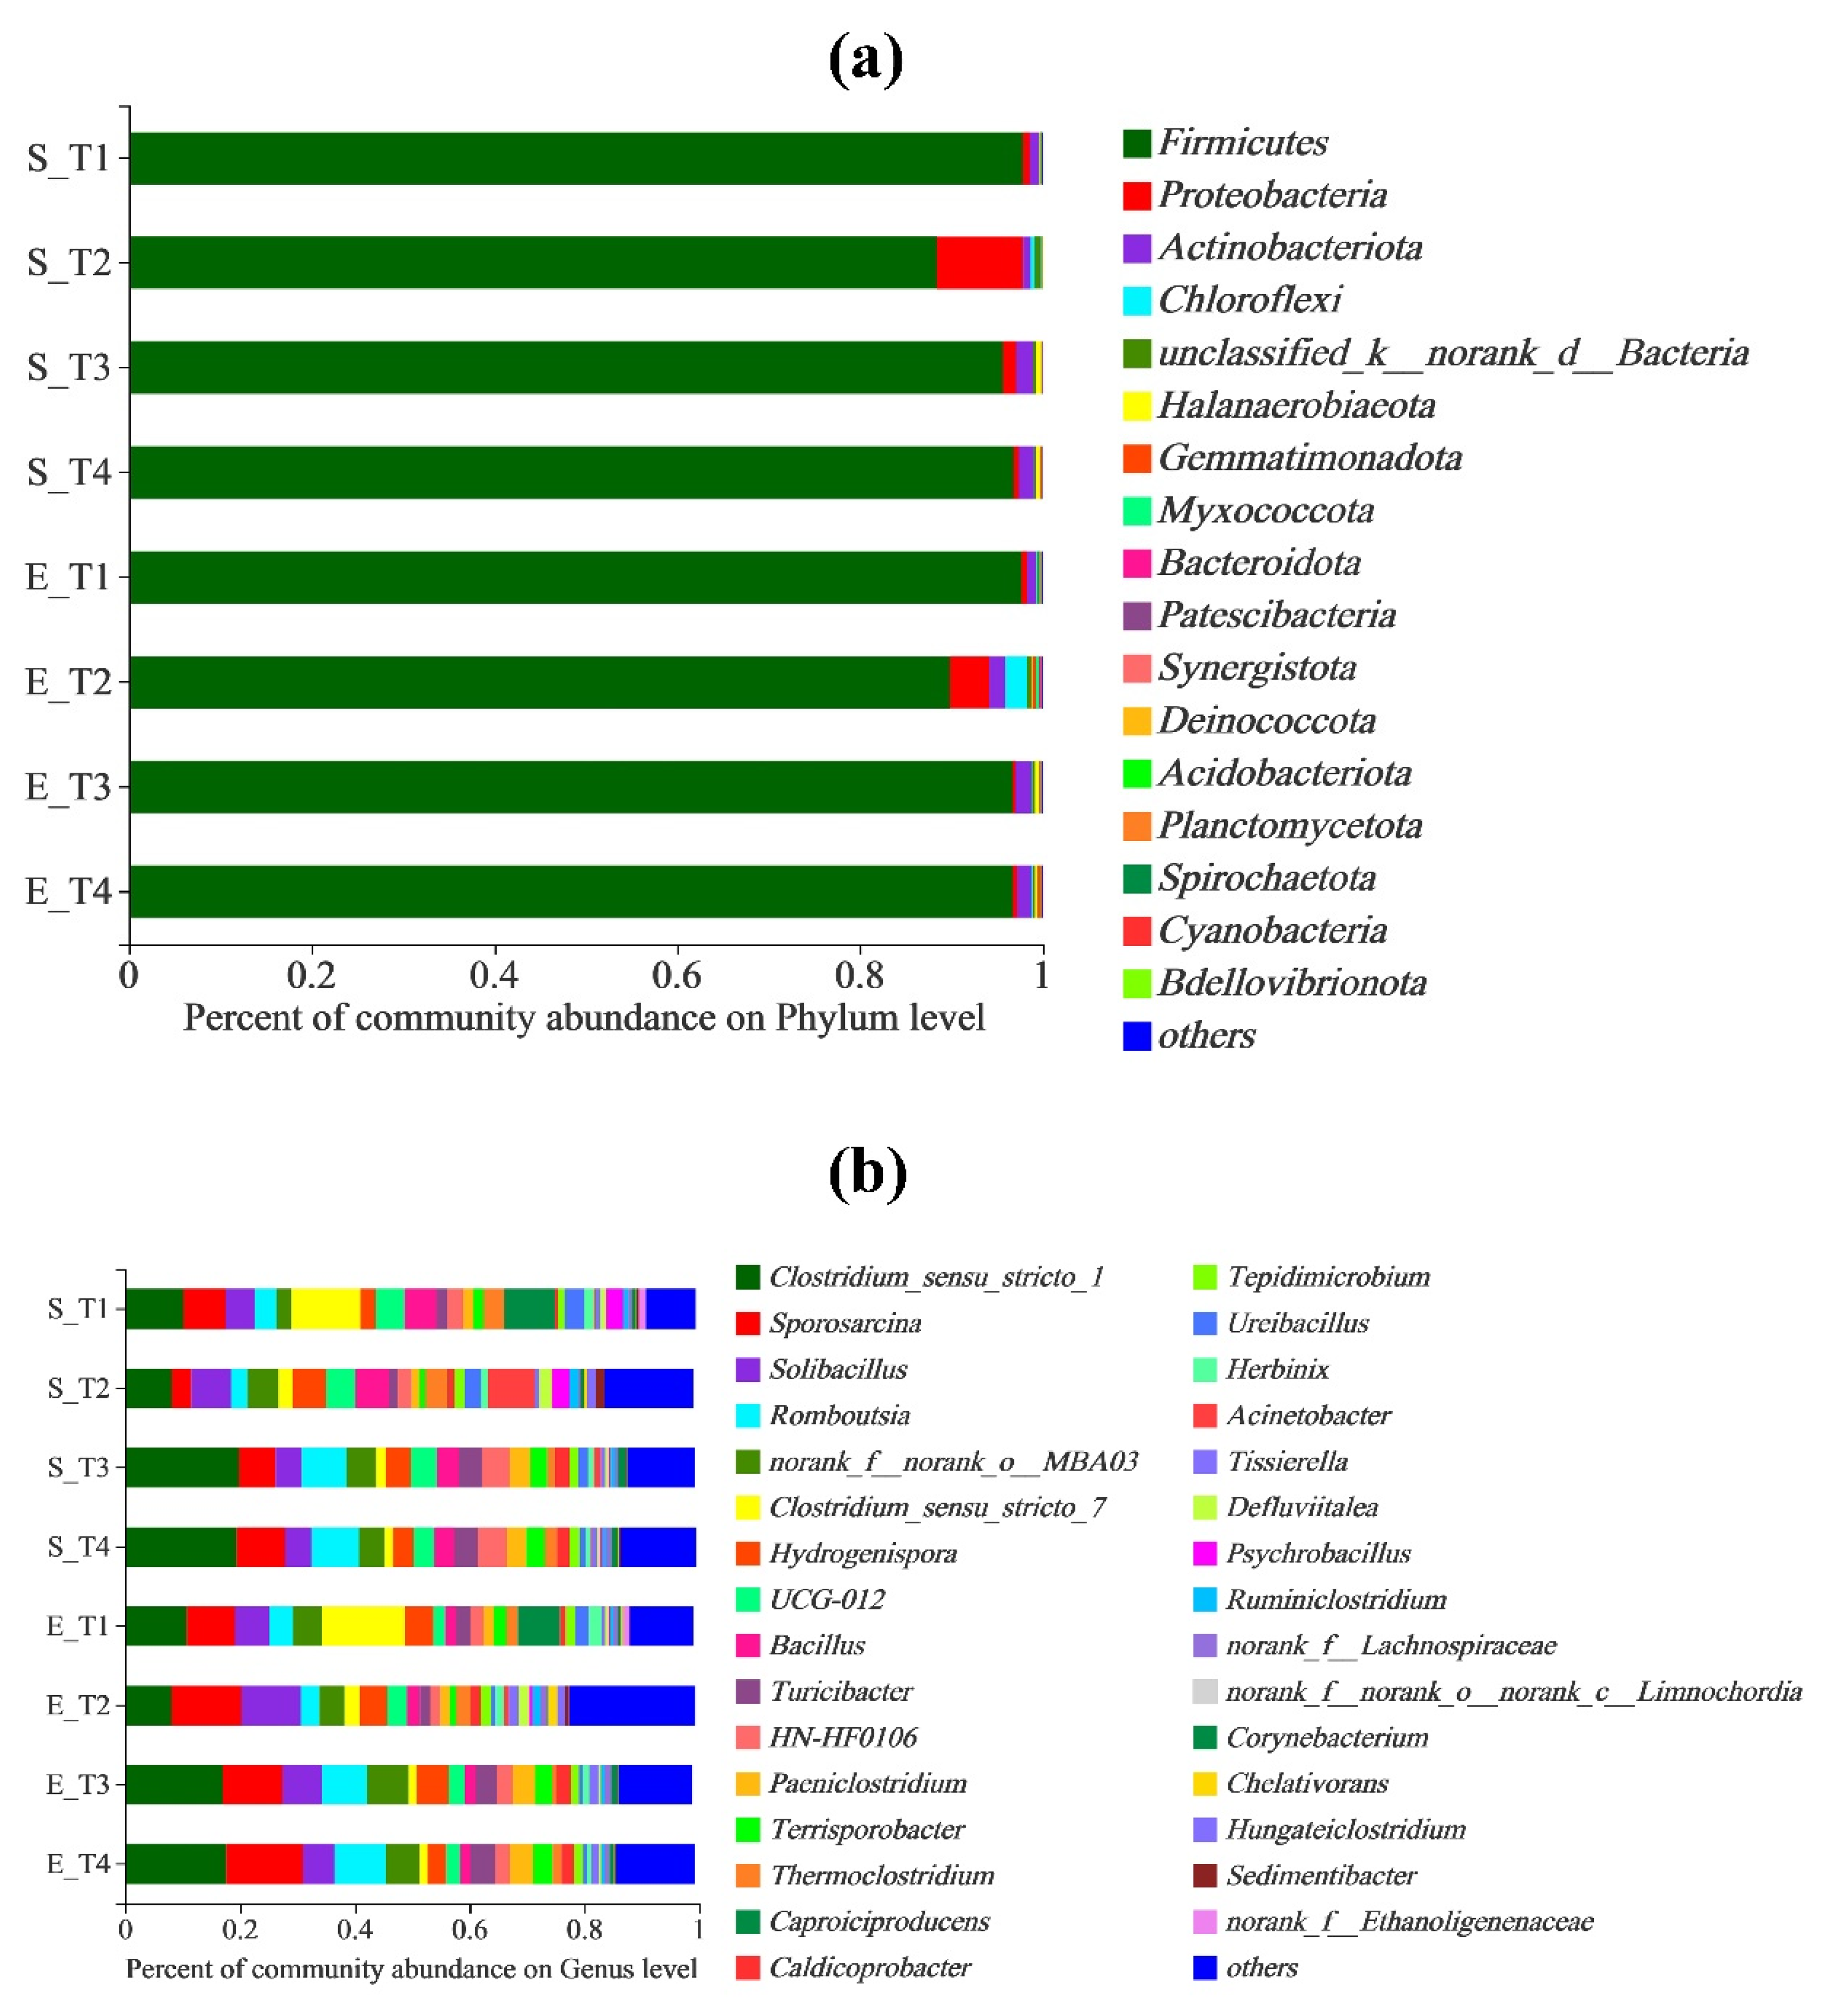
3.4.1. Analysis of Bacterial Community

Alpha diversity was firstly tested to estimate the difference of microbial species from the same group [50] (Table S1). Results show over 98% of sequence coverage in each system, displaying a comprehensive detection ratio of bacterial communities. Ace and Chao1 can illustrate the richness of the microbial community, both of which were higher in the F-CS system (T1 > T2, T3 > T4), meaning that the bacteria communities of the two F-CS reactors showed greater richness. The Simpson/Shannon index shows an opposite (T1 < T2, T3 < T4) or similar (T1 > T2, T3 > T4) trend, implying a more even distribution in F-CS digesters. Additionally, Ace, Chao1, and Shannon (F-CS > D-CS) as well as Simpson (F-CS < D-CS) of the high S/I ratio system presented a richer and more even distribution than for the low S/I ratio system. All of the above verified the positive effect of a high S/I ratio and FVD pretreatment on solid AD of CS.
The bacterial community structure is shown in Figure 6. The dominant bacteria in each system were mainly composed of Firmicutes. Firmicutes formed the dominant phyla contributing to the hydrolysis and acidification stage of AD, which massively enriched in anaerobic reactors for sludge, wastewater, feces, and food waste [51]. It generated multifunctional extracellular enzymes, including cellulose, lipase, protein, and lipids of organic matters [52], acting as acid-producing bacteria. A higher population in the F-CS system (S_T1, 97.66% > S_T2, 90.54%; S_T3, 95.35% > S_T4, 92.11%) verified the function of pretreatment by FVD (richer nutrients, Table 2 and Table 3; higher VFA concentration, Figure 4a,b). Differences in Firmicutes were mainly represented by the following top genera, including Clostridium_sensu_stricto_1, Bacillus and Terrisporobacter, Clostridium_sensu_stricto_7 is a typical cellulose-decomposing and acid-producing bacterium. It can effectively secrete related enzymes to degrade cellulose and hemicellulose and sequentially consume the hydrolytic sugars to organic acids [53]. In this study, Clostridium_sensu_stricto_1 commonly existed in the F-CS system (more than 50%), verifying that F-CS contained more cellulose and hemicellulose (37.49% and 31.22%, Table 2) and had a higher degradation ratio of each (Table 3). Terrisporobacter can use digested hydrolysates such as glucose, fructose, maltose, xylose, and other substrates to produce acetic acid and CO2 in AD [54]. It was only detected in the F-CS system, showing a strong relationship with methane production. In addition, other key genera were also studied. Thermoclostrium, UCG-012, and HN-HF0106 were the key bacteria which also dominated the interaction of the system and cooperated with other bacterial genera to achieve degradation. Thermoclostrium is a unique microorganism that degrades polysaccharides under high temperature conditions [55]. The relative abundance of T1 was always higher than that in other systems, showing a certain positive correlation with the high content of intermediate metabolites (VFAs and soluble organic compounds).
In conclusion, the high S/I ratio AD of F-CS (T1) showed a higher abundance of the key bacteria, including Clostridium_sensu_stricto_1, Bacillus, Terrisporobacter, Clostridium_sensu_stricto_7, Thermoclostrium, UCG-012, and HN-HF0106. The coordination of key bacteria is critical for the process of hydrolysis and acidification in AD systems, contributing to greater methanogenic potential. Therefore, the co-relationship of high S/I ratio and pretreatment by FVD in solid-state AD of CS have a profound impact on bacteria structure.

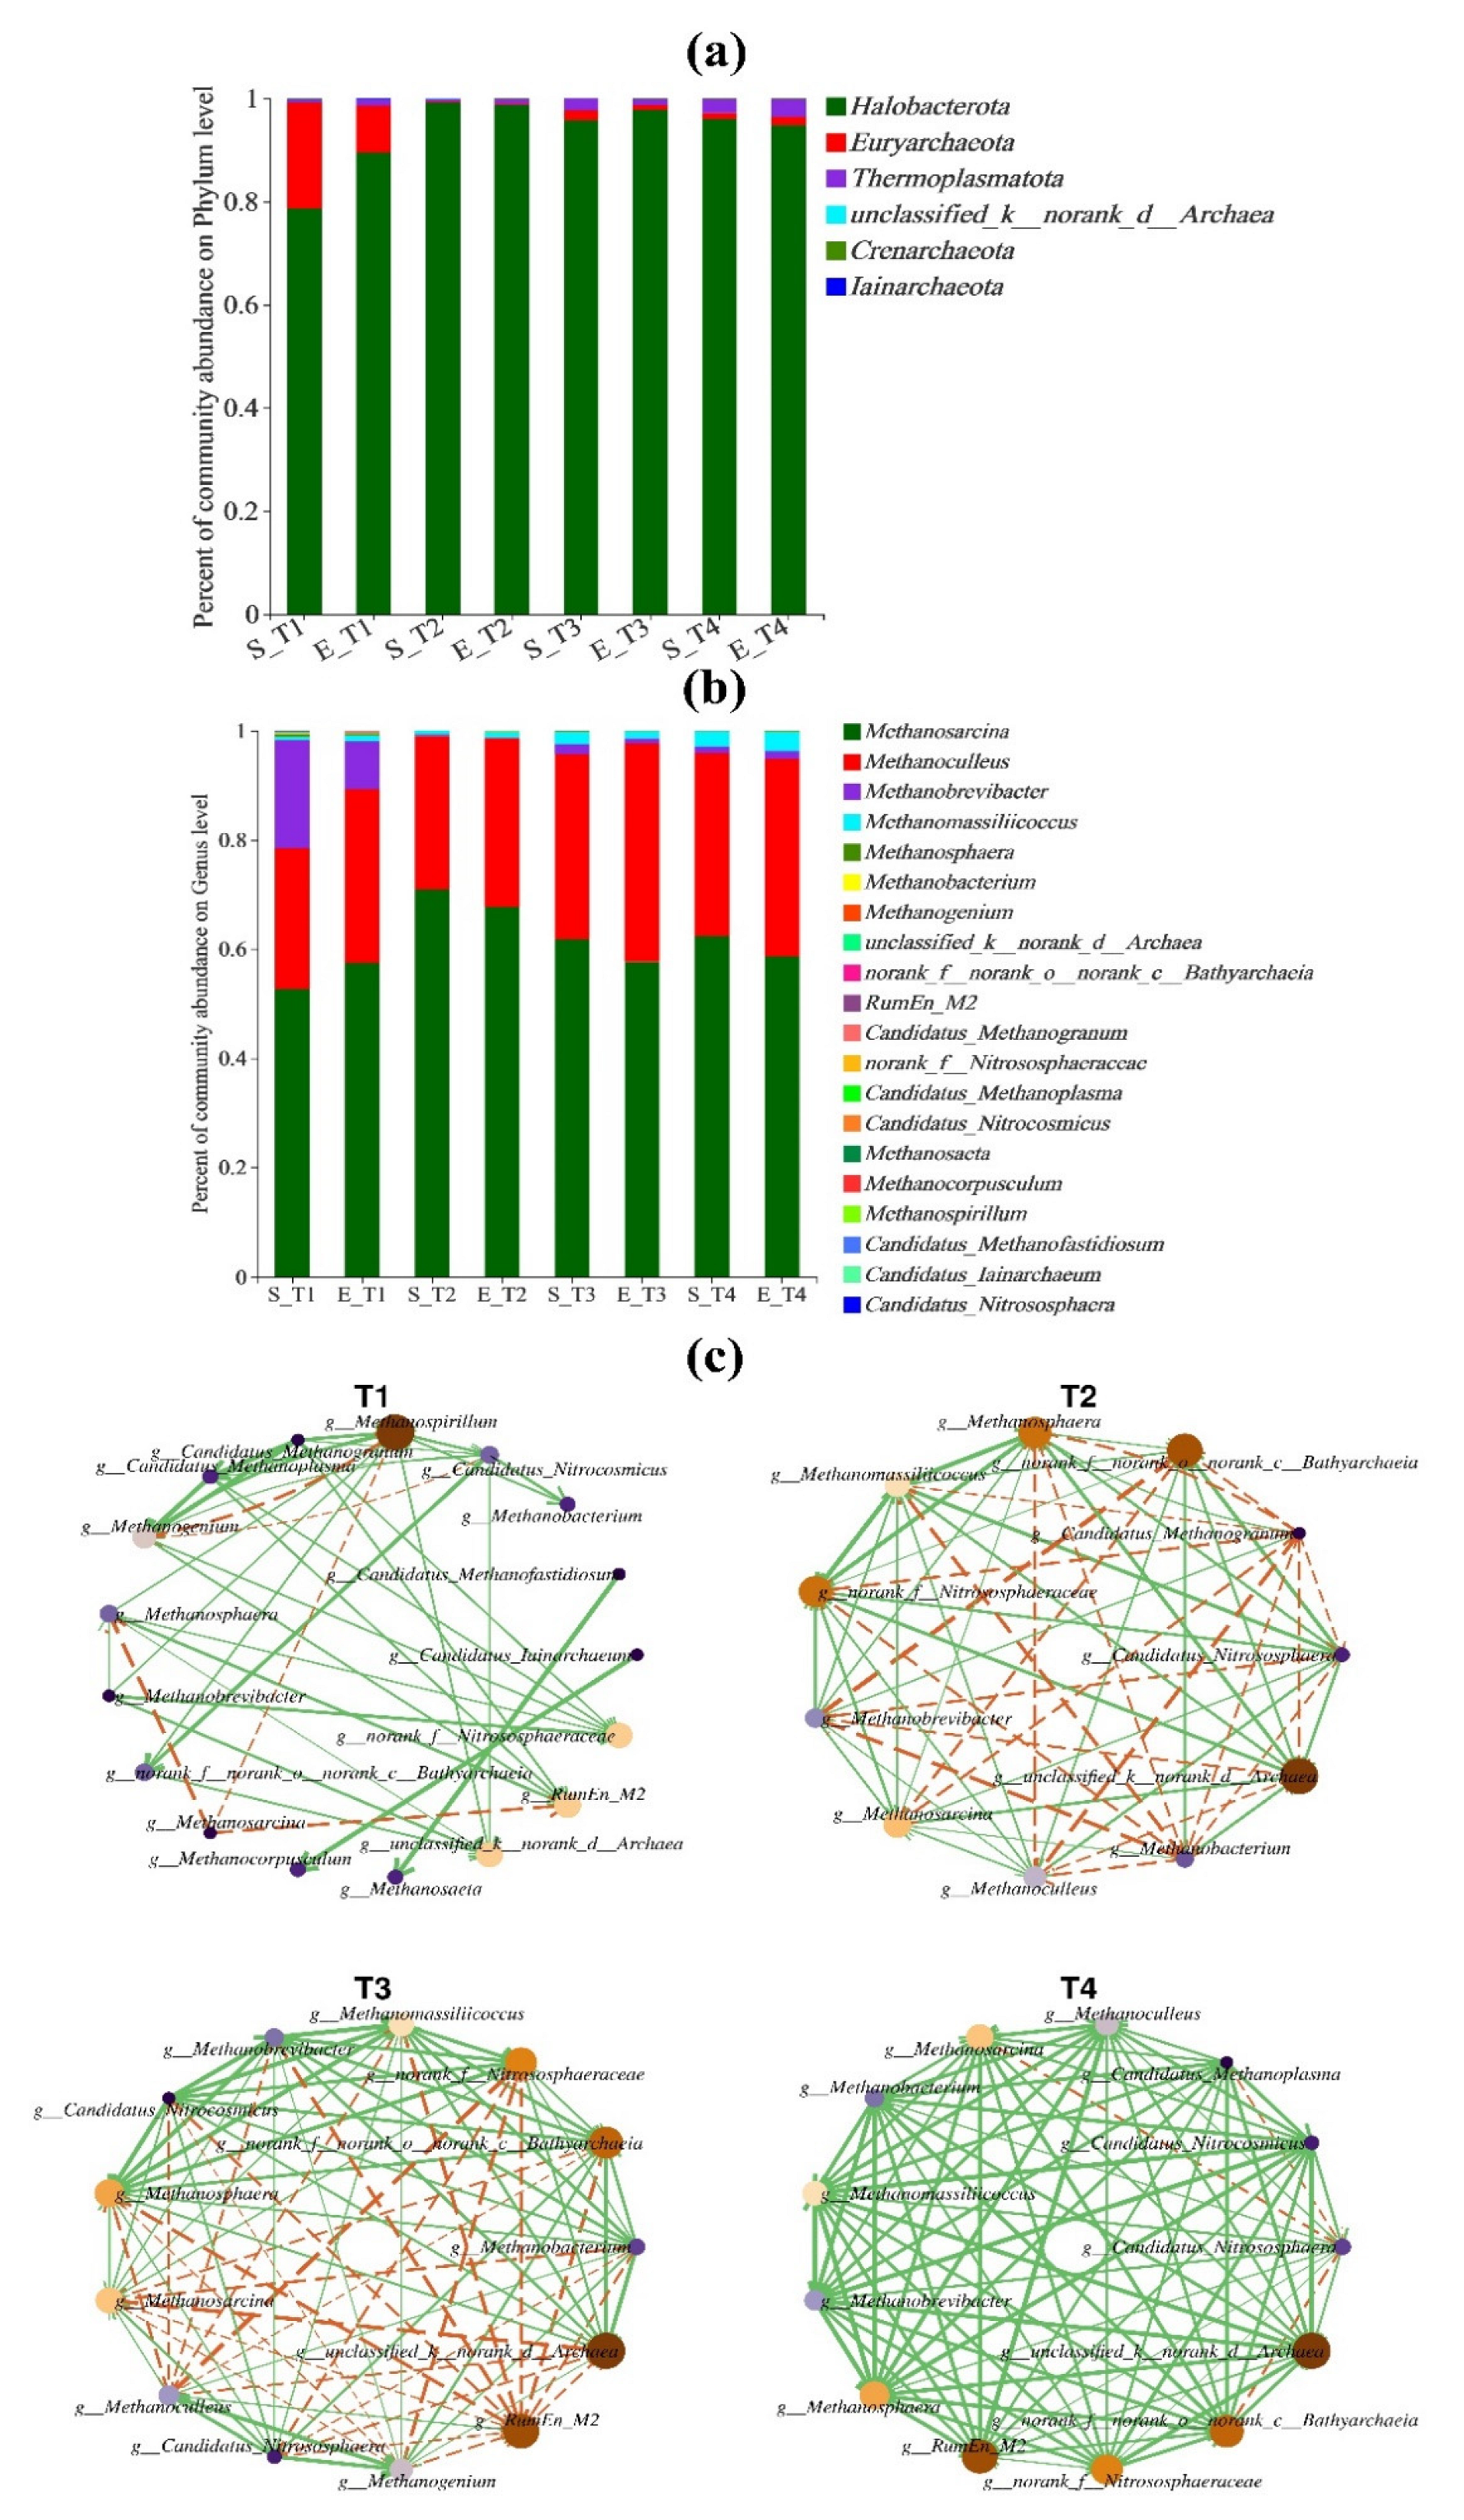
3.4.2. Analysis of Archaeal Community

The alpha diversity of archaea is shown in Table S2. The Simpson index of archaea in F-CS systems was relatively lower than that of D-CS systems, while the Shannon index showed an opposite trend, illustrating that archaeal flora in the two F-CS digesters were more evenly distributed, which is related to the richness of available organic substances [56]. Ace and Chao1 showed a similar trend (T2, T4 < T1, T3), representing that the F-CS system had the richest system (consistent with Section 3.3.3).
Bar plots for archaea at the phylum level are shown in Figure 7a. Result show that, on the phylum level, Halobacterota, Euryarchaeota, and Thermoplasmatota were the most abundant phyla in each system. Interestingly, the structure of the T1 system showed absolute differences compared with other systems (T2, T3 and T4). Halobacterota occupied a lower percentage in both S_T1 (78.65%) and E_T1 (89.47%) systems, while they occupied 94.76–99.06% in other systems. Thus, the proportion of Thermoplasmatota in the T1 system was relatively enhanced. Besides, the occupation of Halobacterota in the low S/I ratio system was much poorer, while more Thermoplasmatota appeared.
On the genus level (Figure 7b), Methanosarcina and Methanoculleus were the two typical genera of Halobacterota, which participate in methane conversion process [57,58]. According to correlation network analysis (Figure 7c), Methanosarcina and Methanoculleus played a positive effect in all systems. The versatile genus Methanosarcina is the most common archaeon observed in thermophilic reactors, with abundances ranging up to 98.98% [59]. In this study, it occupied 52.69% and 61.76% in S_T1 and S_T3 systems, respectively, as well as 57.48% and 57.66%in E_T1 and E_T3 systems, respectively, while being more abundant in T2 (70.87%, 67.74%) and T4 (62.60%, 58.68%) systems. Methanosarcina is a multifunctional methanogen which has a high tolerance of VFA accumulation and high organic loading rate [60]. It generates methane through various pathways, including hydrogenotrophic, acetotrophic, and methylotrophic [9]. Along with the change of environment, the pathway will be different [61]. When the content of TAN or acetic acid rose to 3000 mg/L, the pathway would vary from an aceticlastic reaction to hydrogenotrophic. Thus, Methanosarcina in the F-CS and D-CS system during the 2nd–12th days (acetic acid was far more than 3000 mg/L) mainly acted as a hydrogenotrophic methanogen. Methanoculleus and Methanobrevibacter are two hydrogenotrophic methanogens which mainly utilize H2/CO2 or formic acid to generate methane. Compared with aceticlastic methanogenesis, they are more tolerant of high ammonia concentrations, high organic load, and uncertain changes in the environment [62,63]. A large amount of VFAs (acetic acid) accumulated, seriously limiting the activity of aceticlastic methanogenesis. In the F-CS system (T1, T3), a higher proportion of Methanoculleus (S_T1, 28.18%, E_T1, 31.82%; S_T3, 33.90%, E_T3, 40.05%) as well as Methanobrevibacter (S_T1, 19.89%; E_T1, 8.82%; S_T3, 1.87%, E_T3, 1.49%) work together with the synthetic effect of Methanosarcina, while Methanoculleus (S_T2, 25.77%; E_T2, 30.90%; S_T4, 33.53%, E_T4, 36.09%) and Methanobrevibacter (S_T2, 0.23%; E_T2, 0.16%; S_T4, 1.18%, E_T4, 0.90%) showed the opposite trend in the D-CS system. Methanobacterium and Methanosphaera are two common genera that participate in AD processes (up to 20%, [64,65]). According to the phylogenetic tree (Figure S1), Methanobacterium and Methanosphaera are more closely related, and the two have a closer common ancestor, and could therefore be considered as sister groups. Methanomassiliicoccus is one of the typical genera of Thermoplasmatota. Previous studies found that it was a new branch of methanogens that evolved independently in phylogeny [64,65], and could convert methanol, methyl-amine, dimethylamine, and others to methane at mesophilic temperatures, acting as a methylotrophic methanogen [66,67]. A higher proportion of Methanomassiliicoccus in the T2 and T4 system led us to speculate that methanol/methylamine conversion appeared more frequently in the D-CS system.
Obviously, the F-CS system showed a different structure from D-CS, especially in the high S/I ratio (T1). Fewer Methanosarcina and Methanomassiliicoccus as well as more Methanobrevibacter and Methanoculleus stimulated the co-relationship of key archaea, which was considered as a beneficial way to enhance the efficiency of methane production (higher cumulative methane production in F-CS, Figure 2d). Thus, with the relationship of high S/I ratio and pretreatment by FVD, the community structure changed and was more conducive to the improvement of methanogenic potential.

4. Conclusions

FVD pretreatment of CS broke down its compact structure and reduced lignin content, presenting a loose and porous structure. Meanwhile, the nutrient and elemental composition (VS, C, N, cellulose, hemicellulose, and crude protein) of F-CS was preserved more completely. In a solid-state AD system, FVD pretreatment achieved a higher degradation ratio of cellulose and hemicellulose as well as intermediate metabolites (dissolved microbial metabolites, VFAs, coenzymes, tyrosine-like proteins, and soluble microbial byproducts). The coordination of key bacteria (Clostridium_sensu_stricto_1, Bacillus, Terrisporobacter, Clostridium_sensu_stricto_7, Thermoclostrium, UCG-012, and HN-HF0106) and methanogens (poorer Methanosarcina and Methanomassiliicoccus as well as richer Methanobrevibacter and Methanoculleus) in F-CS also changed with the effect of FVD pretreatment. Thus, FVD pretreatment is an efficient way for enhancing the AD performance of cellulosic substrates, which makes it a potential choice for application in biomass energy utilizations.

Supplementary Materials

The following supporting information can be downloaded at: https://www.mdpi.com/article/10.3390/fermentation8060259/s1, Table S1: diversity index of bacteria microorganisms in different groups, Table S2: diversity index of archaea microorganisms in different groups; Figure S1: Phylogenetic tree of archaea on genus level. Energy conversion is also shown in the Supplementary Materials. References [68,69,70,71] are cited in the supplementary materials.

Author Contributions

Z.L.: data curation, formal analysis, writing—original draft, writing—review and editing. J.H.: investigation, methodology, visualization. Y.Y.: conceptualization, writing—review and editing. M.W.: writing—review and editing. A.L.: investigation, methodology. All authors have read and agreed to the published version of the manuscript.

Funding

This research received no external funding.

Institutional Review Board Statement

Not applicable.

Informed Consent Statement

Not applicable.

Data Availability Statement

Not applicable.

Acknowledgments

This work is supported by the Shaanxi Youth Thousand Talents Project (A279021901), the scientific and technological activities for overseas researchers in Shaanxi province (20200002), the Chinese Universities Scientific Fund (2452021112), the Key Research and Development Project of Shaanxi Province (2020NY-114), the double first-class construction project funded by Northwest A&F University, and the Northwest A&F University Young Talent Project (Z111021902).

Conflicts of Interest

The authors declare no conflict of interest.

References

  1. Li, W.; Habiba, K.; Zhe, Z.; Zhang, R.; Liu, G.; Chang, C.; Eva, T. Methane production through anaerobic digestion: Participation and digestion characteristics of cellulose, hemicellulose and lignin. Appl. Energy 2018, 226, 1219–1228. [Google Scholar] [CrossRef]
  2. Romero-Güiza, M.S.; Wahid, R.; Hernández, V.; Møller, H.; Fernández, B. Improvement of wheat straw anaerobic digestion through alkali pre-treatment: Carbohydrates bioavailability evaluation and economic feasibility. Sci. Total Environ. 2017, 595, 651–659. [Google Scholar] [CrossRef] [PubMed]
  3. Li, L.; Chen, C.; Zhang, R.; He, Y.; Wang, W.; Liu, G. Pretreatment of Corn Stover for Methane Production with the Combination of Potassium Hydroxide and Calcium Hydroxide. Energy Fuel. 2015, 29, 2082561664. [Google Scholar] [CrossRef]
  4. Yfw, A.; Hry, A.; Acw, B.; Xjl, A. Anaerobic co-digestion of cattle manure and liquid fraction of digestate (LFD) pretreated corn stover: Pretreatment process optimization and evolution of microbial community structure. Bioresour. Technol. 2020, 296, 122282. [Google Scholar]
  5. Ji, J.; Zhang, J.; Yang, L.; He, Y.; Zhang, R.; Liu, G.; Chen, C. Impact of co-pretreatment of calcium hydroxide and steam explosion on anaerobic digestion efficiency with corn stover. Environ. Technol. 2016, 38, 1465–1473. [Google Scholar] [CrossRef]
  6. Ma, S.; Wang, H.; Li, L.; Gu, X.; Zhu, W. Enhanced biomethane production from corn straw by a novel anaerobic digestion strategy with mechanochemical pretreatment. Renew. Sustain. Energy Rev. 2021, 146, 111099. [Google Scholar] [CrossRef]
  7. You, Z.; Pan, S.Y.; Sun, N.; Kim, H.; Chiang, P.C. Enhanced corn-stover fermentation for biogas production by NaOH pretreatment with CaO additive and ultrasound. J. Clean. Prod. 2019, 238, 117813. [Google Scholar] [CrossRef]
  8. Rouches, E.; Escudie, R.; Latrille, E.; Carrere, H. Solid-state anaerobic digestion of wheat straw: Impact of S/I ratio and pilot-scale fungal pretreatment. Waste Manag. 2019, 85, 464–476. [Google Scholar] [CrossRef]
  9. Wu, Y.; Song, K. Anaerobic co-digestion of waste activated sludge and fish waste: Methane production performance and mechanism analysis. J. Clean. Prod. 2020, 279, 123678. [Google Scholar] [CrossRef]
  10. Yu, J.; Zhao, Y.; Liu, B.; Zhao, Y.; Wu, J.; Yuan, X.; Zhu, W.; Cui, Z. Accelerated acidification by inoculation with a microbial consortia in a complex open environment. Bioresour. Technol. 2016, 216, 294–301. [Google Scholar] [CrossRef]
  11. Pakarinen, O.; Lehtomki, A.; Rissanen, S.; Rintala, J. Storing energy crops for methane production: Effects of solids content and biological additive. Bioresour. Technol. 2008, 99, 7074–7082. [Google Scholar] [CrossRef] [PubMed]
  12. Tabacco, E.; Righi, F.; Quarantelli, A.; Borreani, G. Dry matter and nutritional losses during aerobic deterioration of corn and sorghum silages as influenced by different lactic acid bacteria inocula. J. Dairy Sci. 2011, 94, 1409–1419. [Google Scholar] [CrossRef] [PubMed]
  13. Harguindeguy, M.; Fissore, D. On the effects of freeze-drying processes on the nutritional properties of foodstuff: A review. Dry. Technol. 2019, 38, 846–868. [Google Scholar] [CrossRef]
  14. Zhao, Y.; Yu, J.; Zhao, X.; Zheng, Z.; Cai, Y.; Hu, Y.; Cui, Z.; Wang, X. The macro- and micro-prospects of the energy potential of the anaerobic digestion of corn straw under different storage conditions. Bioresour. Technol. Rep. 2019, 7, 100189. [Google Scholar] [CrossRef]
  15. Rooni, V.; Raud, M.; Kikas, T. The Freezing Pre-Treatment of Lignocellulosic Material: A Cheap Alternative for Nordic Countries. Energy 2017, 139, 1–7. [Google Scholar] [CrossRef]
  16. Qi, N.; Hu, X.; Xin, X.; Ye, S.; Zhao, X. Mechanisms of biohydrogen recovery enhancement from peanut shell by C. guangxiense: Temperature pretreatment ranges from -80 to 100 °C. Bioresour. Technol. 2020, 304, 123026. [Google Scholar] [CrossRef]
  17. Rui, X.; Yang, Z.H.; Wang, Q.P.; Yang, B.; Fan, C.Z. Rapid startup of thermophilic anaerobic digester to remove tetracycline and sulfonamides resistance genes from sewage sludge. Sci. Total Environ. 2017, 612, 788. [Google Scholar]
  18. Boulanger, A.; Pinet, E.; Bouix, M.; Bouchez, T.; Mansour, A.A. Effect of inoculum to substrate ratio (I/S) on municipal solid waste anaerobic degradation kinetics and potential. Waste Manag. 2012, 32, 2258–2265. [Google Scholar] [CrossRef]
  19. Benbelkacem, H.; Bollon, J.; Bayard, R.; Escudié, R.; Buffière, P. Towards optimization of the total solid content in high-solid (dry) municipal solid waste digestion. Chem. Eng. J. 2015, 273, 261–267. [Google Scholar] [CrossRef]
  20. APHA. Standard Methods for the Examination of Water and Wastewater, 21st ed.; American Public Health Association: Washington, DC, USA, 2005. [Google Scholar]
  21. Sluiter, A.; Hames, B.; Ruiz, R.; Scarlata, C.; Sluiter, J.; Templaton, D.; Crocker, D. Determination of Structural Carbohydrates and Lignin in Biomass; Technical Report NREL/TP-510-42618; National Renewable Energy Laboratory: Golden, CO, USA, 2010. [Google Scholar]
  22. Casado, A.G.; Hernández, E.; Espinosa, P.; VíLchez, J.L. Determination of total fatty acids (C8–C22) in sludges by gas chromatography–mass spectrometry. J. Chromatogr. A 1998, 826, 49–56. [Google Scholar] [CrossRef]
  23. Siles, J.A.; Brekelmans, J.; Martín, M.A.; Chica, A.F.; Martín, A. Impact of ammonia and sulphate concentration on thermophilic anaerobic digestion. Bioresour. Technol. 2010, 101, 9040–9048. [Google Scholar] [CrossRef] [PubMed]
  24. Rao, M.S.; Singh, S.P.; Singh, A.K.; Sodha, M.S. Bioenergy conversion studies of the organic fraction of MSW: Assessment of ultimate bioenergy production potential of municipal garbage. Appl. Energy 2000, 66, 75–87. [Google Scholar] [CrossRef]
  25. Kafle, G.K.; Sang, H.K. Anaerobic treatment of apple waste with swine manure for biogas production: Batch and continuous operation. Appl. Energy 2013, 103, 61–72. [Google Scholar] [CrossRef]
  26. Kafle, G.K.; Sang, H.K.; Sung, K.I. Ensiling of fish industry waste for biogas production: A lab scale evaluation of biochemical methane potential (BMP) and kinetic. Bioresour. Technol. 2013, 127, 326–336. [Google Scholar] [CrossRef]
  27. Xie, S.; Wu, G.; Lawlor, P.G.; Frost, J.P.; Zhan, X. Methane production from anaerobic co-digestion of the separated solid fraction of pig manure with dried grass silage. Bioresour. Technol. 2012, 104, 289–297. [Google Scholar] [CrossRef]
  28. Cs, A.; Fang, L.B.; Zs, A.; Jing, W.B.; Yl, C.; Yu, P.A.; Tao, S.A.; Ll, A. Feasibility of dry anaerobic digestion of beer lees for methane production and biochar enhanced performance at mesophilic and thermophilic temperature. Bioresour. Technol. 2019, 276, 65–73. [Google Scholar]
  29. Menardo, S.; Balsari, P.; Tabacco, E.; Borreani, G. Effect of Conservation Time and the Addition of Lactic Acid Bacteria on the Biogas and Methane Production of Corn Stalk Silage. Bioenerg. Res. 2015, 8, 1810–1823. [Google Scholar] [CrossRef]
  30. Miryahyaei, S.; Das, T.; Othman, M.; Batstone, D.; Eshtiaghi, N. Anaerobic co-digestion of sewage sludge with cellulose, protein, and lipids: Role of rheology and digestibility. Sci. Total Environ. 2020, 731, 139214. [Google Scholar] [CrossRef]
  31. Shi, X.S.; Yuan, X.Z.; Wang, Y.P.; Zeng, S.J.; Qiu, Y.L.; Guo, R.B.; Wang, L.S. Modeling of the methane production and pH value during the anaerobic co-digestion of dairy manure and spent mushroom substrate. Chem. Eng. J. 2014, 244, 258–263. [Google Scholar] [CrossRef]
  32. Jing, Z.A.; Yu, L.A.; Gjwea, B. Effect of bioaugmentation combined with activated charcoal on the mitigation of volatile fatty acids inhibition during anaerobic digestion. Chem. Eng. J. 2021, 428, 131015. [Google Scholar]
  33. Semenov, G.V.; Krasnova, I.S.; Khvylia, S.I.; Balabolin, D.N. Freezing and freeze-drying of strawberries with an additional effect of micro-vibrations. J. Food Sci. Technol. 2020, 58, 3192–3198. [Google Scholar] [CrossRef] [PubMed]
  34. Wang, D.; Huang, Y.; Xu, Q.; Liu, X.; Yang, Q.; Li, X. Free ammonia aids ultrasound pretreatment to enhance short-chain fatty acids production from waste activated sludge. Bioresour. Technol. 2018, 275, 163–171. [Google Scholar] [CrossRef] [PubMed]
  35. Athanasoulia, E.; Melidis, P.; Aivasidis, A. Optimization of biogas production from waste activated sludge through serial digestion. Renew Energy. 2012, 47, 147–151. [Google Scholar] [CrossRef]
  36. Meng, S.A.; Bing, L.B.; Ky, A.; Nth, C.; Rg, D.; Mt, A.; Hy, A. Effects of low pH conditions on decay of methanogenic biomass—ScienceDirect. Water Res. 2020, 179, 115883. [Google Scholar]
  37. Gc, A.; Gzb, C.; Mza, D.; Nan, L.; Rwa, D.; Cl, E.; Jla, D.; Xp, A. Syntrophic butyrate-oxidizing methanogenesis promoted by anthraquinone-2-sulfonate and cysteine: Distinct tendencies towards the enrichment of methanogens and syntrophic fatty-acid oxidizing bacteria. Bioresour. Technol. 2021, 332, 125074. [Google Scholar]
  38. Barredo, M.S.; Evison, L.M. Effect of propionate toxicity on methanogen-enriched sludge, Methanobrevibacter smithii, and Methanospirillum hungatii at different pH values. Appl. Environ. Microbiol. 1991, 57, 1764. [Google Scholar] [CrossRef] [Green Version]
  39. Dhaked, R.K.; Waghmare, C.K.; Alam, S.I.; Kamboj, D.V.; Singh, L. Effect of propionate toxicity on methanogenesis of night soil at phychrophilic temperature. Bioresour. Technol. 2003, 87, 299–303. [Google Scholar] [CrossRef]
  40. Gourdon, R.; Vermande, P. Effects of propionic acid concentration on anaerobic digestion of pig manure. Biomass 1987, 13, 1–12. [Google Scholar] [CrossRef]
  41. Wang, Z.; Wang, T.; Si, B.; Watson, J.; Zhang, Y. Accelerating anaerobic digestion for methane production: Potential role of direct interspecies electron transfer. Renew. Sustain. Energy Rev. 2021, 145, 111069. [Google Scholar] [CrossRef]
  42. Salama, E.S.; Saha, S.; Kurade, M.B.; Dev, S.; Jeon, B.H. Recent trends in anaerobic co-digestion of lipidic-waste: Fat, oil, and grease (FOG) for enhanced biomethanation. Prog. Energy Combust. 2019, 70, 22–42. [Google Scholar] [CrossRef]
  43. Liang, J.; Zhang, H.; Zhang, P.; Cai, Y.; Ding, Y. Transformation of bacterial community structure in rumen liquid anaerobic digestion of rice straw. Environ. Pollut. 2020, 269, 116130. [Google Scholar] [CrossRef] [PubMed]
  44. Kainthola, J.; Kalamdhad, A.S.; Goud, V.V. Enhanced methane production from anaerobic co-digestion of rice straw and hydrilla verticillata and its kinetic analysis. Biomass Bioenergy 2019, 125, 8–16. [Google Scholar] [CrossRef]
  45. Poirier, S.; Quéméner, E.D.; Madigou, C.; Bouchez, T.; Chapleur, O. Anaerobic digestion of biowaste under extreme ammonia concentration: Identification of key microbial phylotypes. Bioresour. Technol. 2016, 207, 92–101. [Google Scholar] [CrossRef] [PubMed]
  46. Kanehisa, M.; Goto, S. KEGG: Kyoto encyclopedia of genes and genomes. Artif. Intell. 2006, 28, 27–30. [Google Scholar] [CrossRef] [PubMed]
  47. Zhong, X.A.; Hua, Z.; Yi, Z.C.; Sffa, B. Improving anaerobic digestion of corn straw by using solid-state urea pretreatment. Chemosphere 2022, 293, 133559. [Google Scholar]
  48. Steinhaus, B.; Garcia, M.L.; Shen, A.Q.; Angenent, L.T. A Portable Anaerobic Microbioreactor Reveals Optimum Growth Conditions for the Methanogen Methanosaeta concilii. Appl. Environ. Microbiol. 2007, 73, 1653. [Google Scholar] [CrossRef] [Green Version]
  49. Yu, L.; Bian, C.; Zhu, N.; Shen, Y.; Yuan, H. Enhancement of methane production from anaerobic digestion of waste activated sludge with choline supplement. Energy 2019, 173, 1021–1029. [Google Scholar] [CrossRef]
  50. Jiang, C.; Peces, M.; Andersen, M.H.; Kucheryavskiy, S.; Nierychlo, M.; Yashiro, E.; Andersen, A.; Kirkegaard, R.H.; Hao, L.; Høgh, J.; et al. Characterizing the growing microorganisms at species level in 46 anaerobic digesters at Danish wastewater treatment plants: A six-year survey on microbial community structure and key drivers. Water Res. 2021, 193, 116871. [Google Scholar] [CrossRef]
  51. Xu, Y.; Geng, H.; Chen, R.; Liu, R.; Dai, X. Enhancing methanogenic fermentation of waste activated sludge via isoelectric-point pretreatment: Insights from interfacial thermodynamics, electron transfer and microbial community. Water Res. 2021, 197, 117072. [Google Scholar] [CrossRef]
  52. Zamanzadeh, M.; Hagen, L.H.; Svensson, K.; Linjordet, R.; Horn, S.J. Anaerobic digestion of food waste—Effect of recirculation and temperature on performance and microbiology. Water Res. 2016, 96, 246–254. [Google Scholar] [CrossRef]
  53. Li, Y.; Tang, Y.; Xiong, P.; Zhang, M.; Deng, Q.; Liang, D.; Zhang, Y. High-efficiency methanogenesis via kitchen wastes served as ethanol source to establish direct interspecies electron transfer during anaerobic Co-digestion with waste activated sludge. Water Res. 2020, 176, 115763. [Google Scholar] [CrossRef] [PubMed]
  54. Wainaina, S.; Awasthi, M.K.; Horvath, I.S.; Taherzadeh, M.J. Anaerobic digestion of food waste to volatile fatty acids and hydrogen at high organic loading rates in immersed membrane bioreactors. Renew. Energy 2020, 152, 1140–1148. [Google Scholar] [CrossRef]
  55. Zhao, Y.; Yu, J.; Liu, J.; Yang, H.; Gao, L.; Yuan, X.; Wang, X. Material and microbial changes during corn stalk silage and their effects on methane fermentation. Bioresour. Technol. 2016, 222, 89–99. [Google Scholar] [CrossRef] [PubMed]
  56. Lang, K.; Schuldes, J.; Klingl, A.; Poehlein, A.; Daniel, R.; Brune, A. New mode of energy metabolism in the seventh order of methanogens as revealed by comparative genome analysis of “Candidatus Methanoplasma termitum”. Appl. Environ. Microbiol. 2015, 81, 1338. [Google Scholar] [CrossRef] [Green Version]
  57. Qian, P.; Xiao, L.; Ming, Z.; Li, Y. Effect of CaO addition on anaerobic digestion of waste activated sludge at different temperatures and the promotion of valuable carbon source production under ambient condition. Bioresour. Technol. 2018, 265, 247. [Google Scholar]
  58. Liu, L.; Tong, Z.; Wan, H.; Chen, Y.; Ren, G. Anaerobic co-digestion of animal manure and wheat straw for optimized biogas production by the addition of magnetite and zeolite. Energy Convers. Manag. 2015, 97, 132–139. [Google Scholar] [CrossRef]
  59. Nobu, M.K.; Narihiro, T.; Kuroda, K.; Mei, R.; Liu, W.T. Chasing the elusive Euryarchaeota class WSA2: Genomes reveal a uniquely fastidious methyl-reducing methanogen. ISME J. 2016, 10, 2478–2487. [Google Scholar] [CrossRef]
  60. Ni, B.J.; Batstone, D.; Zhao, B.H.; Yu, H.Q. Microbial Internal Storage Alters the Carbon Transformation in Dynamic Anaerobic Fermentation. Environ. Sci. Technol. 2015, 49, 9159–9167. [Google Scholar] [CrossRef]
  61. Ki, B.M.; Kim, Y.M.; Jeon, J.M.; Ryu, H.W.; Cho, K.S. Characterization of odor emissions and microbial community structure during degradation of pig carcasses using the soil burial-composting method. Waste Manag. 2018, 77, 30–42. [Google Scholar] [CrossRef]
  62. Chen, H.; Rao, Y.; Cao, L.; Shi, Y.; Hao, S.; Luo, G.; Zhang, S. Hydrothermal conversion of sewage sludge: Focusing on the characterization of liquid products and their methane yields. Chem. Eng. J. 2019, 357, 367–375. [Google Scholar] [CrossRef]
  63. Wandera, S.M.; Westerholm, M.; Qiao, W.; Yin, D.; Jiang, M.; Dong, R. The correlation of methanogenic communities’ dynamics and process performance of anaerobic digestion of thermal hydrolyzed sludge at short hydraulic retention times. Bioresour. Technol. 2019, 272, 180–187. [Google Scholar] [CrossRef] [PubMed]
  64. Solli, L.; Velsrud, O.H.; Horn, S.; Rike, A. A metagenomic study of the microbial communities in four parallel biogas reactors. Biotechnol. Biofuels 2014, 7, 146. [Google Scholar] [CrossRef] [PubMed]
  65. Zhang, Z.; Gao, P.; Cheng, J.; Liu, G.; Zhang, X.; Feng, Y. Enhancing anaerobic digestion and methane production of tetracycline wastewater in EGSB reactor with GAC/NZVI mediator. Water Res. A J. Int. Water Assoc. 2018, 136, 54–63. [Google Scholar] [CrossRef] [PubMed]
  66. Zhang, J.C.; Xu, Y.Q.; Lu, Y.H. Microbial mechanisms of methane production and oxidation in terrestrial ecosystems. Acta Ecol. Sin. 2015, 35, 6592–6603. [Google Scholar]
  67. Park, J.G.; Lee, B.; Park, H.R.; Jun, H.B. Long-term evaluation of methane production in a bio-electrochemical anaerobic digestion reactor according to the organic loading rate—ScienceDirect. Bioresour. Technol. 2019, 273, 478–486. [Google Scholar] [CrossRef]
  68. Cengel, A.Y.; Boles, A.M. Thermodynamics: An Engineering Approach, 9th ed.; McGraw-Hill: New York, NY, USA, 2019; ISBN 9781259822674. [Google Scholar]
  69. GE POWER. 2016. Available online: https://www.gepower.com/content/dam/gepower-pgdp/global/en_US/documents/product/Reciprocating%20E-ngines/Jenbacher/Type%202/jenbacher-type-2-fs-en-metric-2016.pdf (accessed on 25 January 2018).
  70. GERONIMO 2 BIOGAS. Available online: http://www.cea.org.cy/TOPICS/Renewable%20Energy/2013/Biogas_Plants_Europe_GeronimoII.pdf (accessed on 25 January 2018).
  71. Pitts, D.; Sissom, L.E. Schaum’s Outline of Heat Transfer, 2nd ed.; McGraw-Hill: New York, NY, USA, 2011. [Google Scholar]
Figure 1. Nutritional structure of F-CS and D-CS, based on (a) SEM of F-CS (×2000 times), (b) SEM of D-CS (×2000 times), (c) FTIR of F-DS and D-CS, and (d) XRD of F-DS and D-CS.
Fermentation 08 00259 g001
Figure 2. Comparison of F-CS and D-CS digester performance during AD, based on (a) daily methane production, (b) methane content, (c) daily biogas production, and (d) cumulative methane production. * p = 0.02 < 0.05.
Fermentation 08 00259 g002
Figure 3. Analysis of kinetic model, which included (a) linear regression fits for estimation of hydrolysis constants (K) and (b) modified Gompertz equation from the batch assay data for AD of F-CS and D-CS.
Fermentation 08 00259 g003
Figure 4. Physicochemical characteristics of F-CS and D-CS digesters during AD, which includes (a) changes of VFAs concentration in high S/I ratio system, (b) changes of VFAs concentration in low S/I ratio system, (c) changes of TAN concentration, (d) changes of FAN concentration.
Fermentation 08 00259 g004
Figure 5. 3D-EEM of F-CS and D-CS digesters (a) at the stable period, and (b) at the end period.
Fermentation 08 00259 g005
Figure 6. Analysis of bacterial community, based on (a) community structure on the phylum level, and (b) community structure on the genus level.
Fermentation 08 00259 g006
Figure 7. Analysis of archaeal community, based on (a) community structure on the phylum level, (b) community structure on the genus level, and (c) co-networks.
Fermentation 08 00259 g007
Table 1. Experimental design scheme.
TypeTreatment GroupsS/I Ratio Substrate
High S/I ratio systemT14F-CS
T2D-CS
Low S/I ratio systemT31F-CS
T4D-CS
Table 2. Basic physicochemical characteristic parameters of raw materials.
ParametersF-CSD-CSInoculum
TS (%)94.04 ± 0.4099.11 ± 0.797.07 ± 0.02
VS ((% of TS))86.42 ± 1.1185.34 ± 0.485.27 ± 0.08
C (% of TS)38.27 ± 7.7338.03 ± 5.9034.90 ± 5.41
N (% of TS)2.25 ± 0.711.82 ± 0.262.11 ± 0.72
C/N (% of TS)16.98 ± 1.5220.89 ± 1.3416.55 ± 2.30
Cellulose (% of TS)37.49 ± 1.5234.62 ± 0.2124.70 ± 0.98
Hemicellulose (% of TS)31.22 ± 1.6726.25 ± 0.5121.52 ± 1.23
Lignin (% of TS)16.88 ± 0.2219.03 ± 0.325.39 ± 1.92
Crude protein (% of TS)19.63 ± 0.3712.36 ± 0.1513.92 ± 0.30
Table 3. Utilization efficiency of each component in different systems.
Degradation Ratio of Cellulose (%)Degradation Ratio of Hemicellulose (%)Degradation Ratio of Lignin (%)Initial Crude Protein (%)End Crude Protein (%)
T130.01 ± 0.2727.02 ± 1.59−1.34 ± 0.1011.96 ± 1.6018.13 ± 0.50
T229.78 ± 1.3223.64 ± 1.74−0.95 ± 00511.20 ± 2.6217.18 ± 2.01
T344.62 ± 0.6313.72 ± 1.561.45 ± 0.3612.14 ± 0.5715.91 ± 0.69
T445.97 ± 2.3115.68 ± 1.890.37 ± 0.3111.86 ± 1.9216.59 ± 0.62
Table 4. Parameters of the first-order kinetic and modified Gompertz model.
ModelParametersT1T2T3T4
First order kinetic modelcorrelation coefficient R20.93000.97760.89940.9299
K (1/day)0.410.290.330.31
Modified Gompertz modelcorrelation coefficient R20.99930.99410.94280.9884
Rmax (mL/gVS-d)47.935.333.726.2
λ (d)8.26.26.25.2
Publisher’s Note: MDPI stays neutral with regard to jurisdictional claims in published maps and institutional affiliations.

