Article

Strategy Development for Microalgae Spirulina platensis Biomass Cultivation in a Bubble Photobioreactor to Promote High Carbohydrate Content

by
Rohit Saxena
1,
Rosa M. Rodríguez-Jasso
1,*,†,
Mónica L. Chávez-Gonzalez
1,
Cristóbal N. Aguilar
1,
Guillermo Quijano
2 and
Héctor A. Ruiz
1,*,†
1
Biorefinery Group, Food Research Department, School of Chemistry, Autonomous University of Coahuila, Saltillo 25280, Mexico
2
Laboratory for Research on Advanced Processes for Water Treatment, Instituto de Ingeniería, Unidad Académica Juriquilla, Universidad Nacional Autónoma de México, Blvd. Juriquilla 3001, Querétaro 76230, Mexico
*
Authors to whom correspondence should be addressed.
webpage: www.biorefinerygroup.com.
Fermentation 2022, 8(8), 374; https://doi.org/10.3390/fermentation8080374
Submission received: 10 July 2022 / Revised: 2 August 2022 / Accepted: 5 August 2022 / Published: 7 August 2022
(This article belongs to the Special Issue Algae—the Medium of Bioenergy Conversion)

Abstract

:
As a counter to climate change, energy crises, and global warming, microalgal biomass has gained a lot of interest as a sustainable and environmentally favorable biofuel feedstock. Microalgal carbohydrate is considered one of the promising feedstocks for biofuel produced via the bioconversion route under a biorefinery system. However, the present culture technique, which uses a commercial medium, has poor biomass and carbohydrate productivity, creating a bottleneck for long-term microalgal-carbohydrate-based biofuel generation. This current investigation aims toward the simultaneous increase in biomass and carbohydrate accumulation of Spirulina platensis by formulating an optimal growth condition under different concentrations of nitrogen and phosphorous in flasks and a bubble photobioreactor. For this purpose, the lack of nitrogen (NaNO3) and phosphorous (K2HPO4) in the culture medium resulted in an enhanced Spirulina platensis biomass and total carbohydrate 0.93 ± 0.00 g/L and 74.44% (w/w), respectively. This research is a significant step in defining culture conditions that might be used to tune the carbohydrate content of Spirulina.

1. Introduction

With the rapid development of industries, the world’s population increases day by day, and the depletion of mineral oil reserves and rise in atmospheric CO2 require the development of carbon-neutral renewable alternatives. Over the past decade, the demand for energy, mainly derived from fossil fuels, has dramatically increased [1,2,3]. Furthermore, the hunt for alternative energy supplies to fulfill global demand while also replacing fossil fuels has increased year after year. The urgency of combatting global warming motivates various research projects worldwide to reduce the number of harmful gases in the atmosphere via the production of biofuels or the bio-fixation of gases by plants and microorganisms [4]. Among distinct sources, biofuel appears to be a viable alternative for existing energy resources due to biofuels’ renewability and environment-friendly nature. Various renewable feedstocks, such as vegetable oil (palm and jatropha) and lignocellulosic biomass (straw and wood), can be used to produce biofuel. Plants are capable of converting solar energy into chemical form via the photosynthetic pathway [5].
In this scenario, microalgae are thought to be an effective biological system for collecting solar energy and uptaking atmospheric CO2 to create organic compounds, including biofuels, food supplements, pigments, and antioxidants [1]. Microalgae have a superior photosynthetic efficiency capacity to terrestrial plants [1,6]. Microalgal biomass includes multiple components that may be manipulated by modifying culture conditions, including lipids, carbohydrates, pigments, and so on. The concept of biorefinery can be effectively applied to the use of microalgal biomass in industrial processes due to the possibilities of producing a variety of exciting chemicals or biofuels and CO2 fixation by those microorganisms [4]. Additionally, the CO2 capturing capacity of microalgae also makes the cultivation of microalgae an attractive option for mitigating the greenhouse effect [7]. Biofuels, such as bioethanol and biodiesel, are potential alternative sources that might possibly reduce the dependence on fossil fuels [1,2,3]. The carbohydrates, lipids, and protein composition of the microalgal biomass determine the kind of biofuel that can be generated. The intracellular carbohydrates of microalgae are utilized to produce bioethanol [1,8]. Bioethanol production from microalgae has many advantages over the first and second-generation biofuels due to the fast biomass growth rate, ability to grow on wastelands for cultivation, and avoidance of food security issues. Moreover, microalgae cells lack lignin content, making the disruption stage easier when compared to lignocellulosic materials [2]. Primarily microalgae are used as a protein source when grown under circumstances that include all nutrients. However, changes in the concentration of nutrients in culture media can modify biomass composition, thus converting proteins into energy storage compounds, such as carbohydrates and lipids [9]. Research on this promising species for enhancing carbohydrate accumulation capability might increase its viability as a sustainable bioethanol feedstock. Many culture conditions can be used to promote the accumulation of carbohydrates in microalgae, such as nutrient stress (nitrogen and phosphorous), temperature, light intensity, photoperiod, and pH [4,7,10,11].
Phosphorous is an essential nutrient for microalgae development. It is involved in cellular metabolic activities such as energy transfer, signal transduction, membrane phospholipids (in photosynthetic organisms), respiration, and different functional polyphosphates [10]. Similarly, all organisms require nitrogen because it is an essential nutrient for protein synthesis and is necessary for microalgae cell division and growth. It has been highlighted that there is a metabolic balance between the rate of carbon fixation and the rate of nitrogen absorption at sufficient nitrogen concentrations that is required for cellular metabolism [10,12]. Nitrogen deficiency significantly impacts protein synthesis and photosynthetic rates, resulting in a shift in metabolic flux to lipid production. Proteins and nucleic acids are believed to contain roughly 13 and 15% nitrogen, respectively, demonstrating the significance of this element for organisms [10,12].
Sodium bicarbonate (NaHCO3) is used as an inorganic carbon source that influences the growth rate and biomass production of Spirulina platensis [4,13]. Although organic materials can be used as a carbon source for this specie, NaHCO3 is the most frequent carbon source for Spirulina platensis growth. The pH of the culture media steadily rises after the beginning of cultivation. The rise in pH has no adverse effects on Spirulina platensis development and improves the existing carbon source for the microalgae by converting bicarbonate to carbonate, which happens at an alkaline pH, resulting in enhanced biomass productivity. Given the benefits indicated above, it is appropriate to utilize NaHCO3 as the primary inorganic carbon source in Spirulina platensis growth [4].
Spirulina platensis biomass is used as a feedstock for biofuel development, but optimum production is crucial. Given the need for advances in large-scale biorefinery processes, Spirulina species are used worldwide for the production of biocompounds extracted from their biomass (primarily antioxidants). The present study aimed to evaluate the growth of Spirulina platensis LEB-52 in Zarrouk’s medium, with different concentrations of nitrogen and phosphorous, to determine the feasibility of the growth rate in Spirulina platensis biomass. Furthermore, the accumulation of biomolecules in biomass was examined, emphasizing the increase in carbohydrate content.

2. Materials and Methods

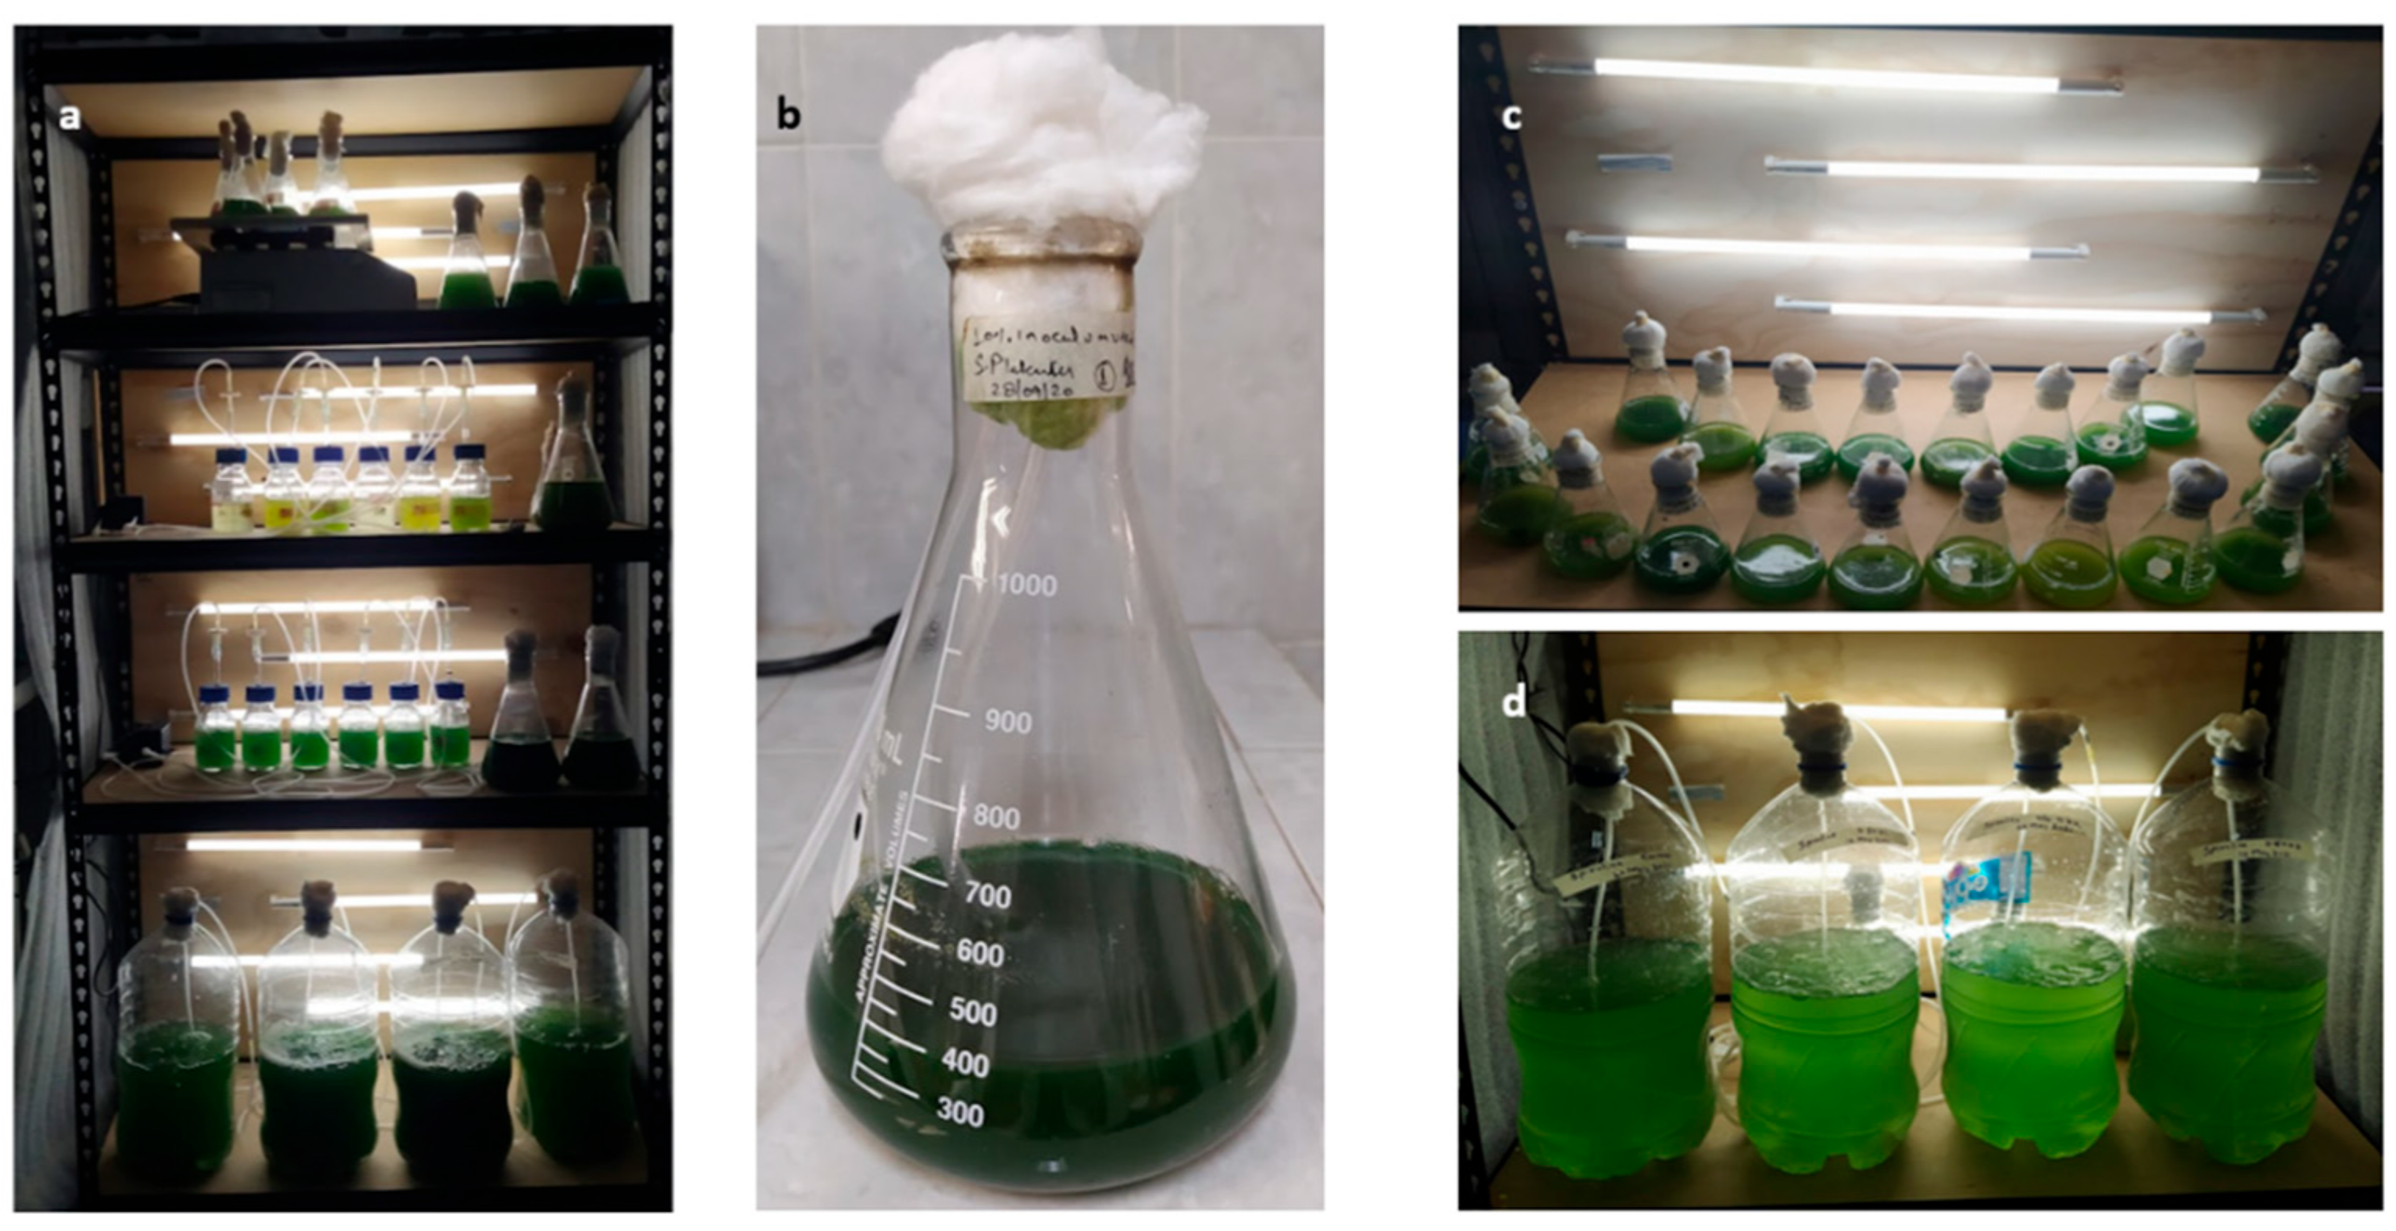
2.1. Microalgae Strain, Maintenance, and Inoculum Preparation

The strain of cyanobacterium Spirulina platensis LEB-52 was provided by the University of Passo Fundo, Brazil (Passo Fundo, RGS, Brazil), maintained in an Erlenmeyer flask (250 mL) with Zarrouk’s medium at an uncontrolled temperature in a cultivation chamber (length 69.5 inch and width 36.25 inch) equipped 13:11 h light/dark photoperiod cycle with a photoperiod controlled by a timer, and light intensity 2500–3500 Lux obtained with cool white fluorescent tubular lamps (Figure 1a). Every 10–14 days, the subculture was performed in the proportion of 10 mL of the previous culture (Figure 1b) to 100 mL of new autoclaved Zarrouk’s medium in Erlenmeyer flask (250 mL). Flasks were shaken manually 3–4 times a day, and each flask was shaken for 1–2 min. These conditions were used as the control in the biomass optimization experiment for the first experimental step.

2.2. Experimental Design for Nutrient Stress Optimization

The strain of microalgae Spirulina platensis LEB-52 was grown in Zarrouk’s medium and in various nutrient-stressed conditions. Enhanced carbohydrate accumulation was evaluated, considering carbohydrate content as a growth parameter. The experiment design consisted of seven nutrient stress conditions: sodium nitrate (nitrogen source) and dipotassium phosphate (phosphorous source). Other cultivation parameters were kept constant. All the experiments were performed in 250 mL flasks for small-scale and a bubble photobioreactor (10.1 L) made of transparent polyethylene terephthalate (utilized wastewater bottle for the cultivation of microalgae). Table 1 depicts the seven different nutrient stress variables for cultivation. In the experimental design, all the experiments were performed in triplicate. For maintained sterility, flasks were autoclaved at 121 °C for 15 min to prevent contamination, and wastewater bottles were chlorinated and neutralized with sodium thiosulfate (Na2S2O3) (Jalmek, Mexico) [4].
The initial experiments were carried out in Erlenmeyer flasks (250 mL) with working volumes of 100 mL of Zarrouk’s medium (Figure 1c) in a cultivation chamber at room temperature (24–32 °C) with 13/11 H. Light/Dark photoperiod under 3500 Lux intensity of LED lights. Macro-and micronutrients raise the capital cost of culture. Because of that, those nutrients were not employed in Zarrouk’s medium to produce Spirulina platensis LEB-52 biomass. Erlenmeyer flasks with Zarrouk’s medium were sterilized and inoculated with 10% fresh inoculum (10–14 days old) of microalgae culture with higher cell concentration. All flasks were shaken manually 3–4 times a day. The inoculum cell concentration (nearby 0.80–1.00 g/L) was determined using a pre-established standard absorbance curve at 670 nm versus dry mass.
After defining the most suitable cultivation conditions by considering the carbohydrate content of biomass, new cultivation was carried out in a 10.1 L bubble photobioreactor, with height and width of 17.00 and 7.50 inches, respectively (Figure 1d), with 8–9 L of practical volume after inoculation. The cultivation system is comprised of an air pump and a rotameter to control the flow of sterile air to the photoreactor. After inoculation, the initial biomass concentration was approximately 0.13 g/L and provided air for mixing uninterruptedly for 14–21 days. The temperature was not controlled, but the controller managed the light and maintained a 13:11 h light/dark photoperiod. The temperature and light intensity averages in the experiment’s region are 22–32 °C and 2500–3500 Lux, respectively.
During the experiments, samples were taken every two days (48 h) to analyze growth kinetic such as cell concentration by optical density, dry weight, chlorophyll test, protein essay, lipid essay, and carbohydrates essay. After the cultivation period, flasks biomass was harvested by using a centrifuge (Hermle Labortechnik GmbH, Wehingen, Germany), but large-scale biomass (cultivated in wastewater) was harvested by a vacuum filter with the help of a pre-weighted cellulose filter. After filtration, biomass was separated with a spatula, transferred in fresh 50 mL Falcon™ tubes, and kept in an incubator for drying at 60–70 °C. In the current studies, dry biomass was selected to analyze the total carbohydrate estimation.

2.3. Analytical Methods

2.3.1. Determination of the Growth Kinetics Parameters, pH, and Identification of Microalgae

Microalgal cell concentration was monitored by measuring the optical density of the culture at the wavelength 670 nm using the spectrophotometric method at a 3–4 day interval. Prior to the studies, Zarrouk’s medium used for the standard curve was established, which related the optical density of the inoculum of Spirulina platensis LEB52 (X = (OD670 − 0.1439)/0.1093 with R2 = 0.99) [14]. Biomass was estimated by gravimetric method at early, middle, and late log phases of microalgal growth. Biomass productivity was calculated gravimetrically at the late log phase using Equation (1) [15]. Determination of specific growth rate (µ) and the doubling time in the different concentrations of nitrogen and phosphorous in Zarrouk’s medium was calculated using Equations (2) and (3), respectively. The pH was also monitored while sampling with the aid of a digital pH meter (OAKTON Instruments, Vernon Hills, IL, USA). Identification of Spirulina platensis was observed by using microscopy (Labomed Microscope, Hicksville, NY, USA) based on morpho-taxonomic descriptions. Microscopic observation revealed that the cells were a free-floating filamentous spiral of multicellular trichomes with easily visible cross walls as in the shape of microalgae, showing typical morphological characteristics. Biomass was harvested using a centrifuge and oven-dried using incubators (Quincy Lab Incubators, Chicago, IL, USA) for further analysis.
Biomass   productivity   mg / L / d = Biomass   yield   mg / L Number   of   days
  Specific   growth   rate ,   μ   1 / day = 1 t Ln X m X 0
Xm and X0 are the optical density at the exponential phase and the beginning of a batch run, respectively, with t (in days) the time duration of the batch run.
Doubling   time   Dt = μ Ln 2

2.3.2. Extraction of Chlorophyll-a and Chlorophyll-b, Total Carotenoids, and Phycocyanin

The analysis of Chlorophyll-a and Chlorophyll-b and total carotenoids in microalgal strain was performed as described by [16] using a spectrophotometer (Tecan spectroscopy, Mannedorf, Switzerland). In-depth, 10 mL samples were collected in 15 mL Falcon™ and centrifuged at 6000 rpm for 10 min at 4 °C. The aliquots were discarded, and the pellet was washed with distilled water twice. After that, the pellet was mixed with pure methanol (99.80%) (Fermont, Sonora, Mexico) and vortexed for 1 min. The resulting mixture was kept in a shaking incubator at 45 °C at 150 rpm for 24 h in sealed Falcon™ [17]. After 24 h incubation, falcons were centrifuged, and aliquots were taken for analysis of pigments. The absorbance of the aliquots was measured at 470, 652.4, and 665.2 nm. Pigments (Chlorophyll-a, Chlorophyll-b, and total carotenoids) were measured using the following Formulas (4)–(6):
Chlorophyll   a   μ g / mL = 16.72 ×   A 665.2   9.16 ×   A 652.2
Chlorophyll   b   μ g / mL = 34.09 ×   A 652.4 15.28 ×   A 665.2
Total   carotenoids   μ g / mL = 1000 × A 470 1.63 × Chl   a 104.9 × Chl   b 221
where A665.2, A652.4, A470 are the absorbances at 665.2, 652.4, and 470 nm.
Phycocyanin is a blue natural colorant with multiple health benefits extracted from microalgae. The Spirulina biomass (100 mg) was hydrated into 2 mL of sodium phosphate buffer (0.1 M) with pH between 6.5 and 7.0 in a 15 mL Falcon™’ tube and vortexed appropriately for 1 min [18]. After the vortex, the final result was kept at -20 °C for cell disruption via the freeze-thawing method. This process was repeated 2–3 times. After the freeze-thawing cell disruption period, samples were centrifuged, and aliquots were separated to analyze phycocyanin by UV–Vis spectroscopy (Thermo Fisher Scientific, Waltham, MA, USA) [19]. A UV-Vis spectrophotometer was used to measure the absorbance of the extracts at wavelengths 280, 615, 620, and 652 nm, respectively. The purity was determined using the A620/A280 absorbance ratio. The concentration of phycocyanin (mg/mL) and the yield were determined by the formulas in Equations (7) and (8), as described in [20].
C P C   mg / mL = A 615 0.474 × A 652 5.34
Phycocyanin   Yield   mg / g = C PC × Solvent   volume Dried   biomass

2.3.3. Total Carbohydrate Quantification

The carbohydrates (starch) present in the cell wall of the microalgal biomass must be hydrolyzed to monosaccharides (glucose) for conversion to bioethanol. Sugar release was measured as the number of monosaccharides in hydrolysates after each pretreatment, as determined by the Anthrone technique, per g of total solid (TS) in dry weight (DW) of biomass treated [21]. Dried microalgae Spirulina platensis (100 mg) sample was taken in test tubes, added to 5 mL of 2.5 N HCl, and kept in a boiling water bath for 3 h for hydrolysis. After hydrolysis, test tubes were allowed to cool down, and the acidic nature of the solution was neutralized with sodium carbonate. The biomass was collected by using a centrifuge at 6000 rpm for 15 min. After that, flasks were completed with distilled water until a final volume of 100 mL. After centrifuging, 100 μL aliquots were taken for analysis, and 400 μL of Anthrone reagent was added, vortexed properly, and kept in a boiling water bath for 10 min. Then, the solution was cooled rapidly with iced water, and the absorbance at 630 nm was read. The optical density (OD) values of the standard solutions were used to draw the standard graph, and the number of carbohydrates was estimated using the equation below (9). Glucose was used as a standard for the preparation of the calibration curve, and distilled water was used as a blank [4,22,23,24].
Calculation   of   total   amount   of   carbohydrate   present   in   100   mg   of   dried   microalgae   biomass = mg   of   glucose Volume   of   the   test   sample × 100

2.3.4. Quantification of Total Lipid in Dried Spirulina Platensis Biomass by Sulpho-Phospho-Vanillin (SPV) Method

Sulfo-phospho vanillin (SPV) is a colorimetric technique used to quantify lipids in Spirulina platensis biomass rapidly. In SPV, a small quantity of biomass (in milligrams or less) is required, no drying or extraction steps are necessary, and the process is considerably simpler and faster than any other known technology [25,26]. This method entails the following steps: (a) making phospho-vanillin reagent with phosphoric acid (Alquime, Saltillo, Mexico) and vanillin (Sigma-Aldrich, St. Louis, MO, USA), (b) adding concentrated sulfuric acid (Jalmek, San Nicolás de los Garza, Mexico) to a sample containing unsaturated lipids of interest and heating the mixture, (c) adding phospho-vanillin reagent, and (d) 15 min of incubation at 37 °C and 220 rpm, and absorbance was recorded at the 530 nm wavelength using a microplate reader (Tecan Sunrise Basic Microplate Reader, Austria GmbH) [25,26,27].

2.3.5. Microalgae Protein Extraction from Dried Biomass

Protein was extracted from the dry biomass sample by dissolving 100 mg pulverized sample in 3.00 mL 1 M NaOH (CTR, Monterrey, Mexico). The mixture was vortexed for 60 s before incubation at boiling point for 20 min [28,29]. The protein extract was recovered by centrifuging at 6000 rpm for 10 min, the upper part was used for protein quantification, and the remaining pellet was discarded. The Bradford method was implemented to test the protein content in the extracted microalgae biomass with Coomassie Brilliant Blue [30,31]. Bradford reagent (2.50 mL) was combined with a 0.25 mL biomass sample in the dark. For analysis of protein, a UV–Visible spectrophotometer was used at 595 nm. Bovine serum albumin was used to create a calibration curve with values ranging from 0 to 10 mg/mL [32]. Blank samples were prepared for all measurements with 1000 µL deionized water and 250 µL of Bradford reagent. Measurements were conducted in triplicate.

2.4. Statistical Analysis

One statistical test was analyzed to compare and demonstrate the efficiency of treatment of G (without nitrogen and phosphorous) compared to the control. To ensure that the results were significant, an analysis of variance (ANOVA) was used. The statistical software package (version for Windows) developed by Prof. Emilio Olivares-Sáenz at the School of Agronomy, Universidad Autónoma de Nuevo León (UANL, San Nicolás de los Garza, Mexico) was used to performed statistical analyses with p < 0.05 as the significance level. The average and standard deviation of triplicates are used to show the experimental results. The standard deviation is shown by the error bars.
According to the ANOVA result for total carbohydrate percentage, using a factor as a medium composition showed a significant effect on the total carbohydrate with a significant value (p-value) under the significance level p < 0.05. Furthermore, according to the statistical analysis, the significance value of the nutrient media as a factor represents significance (as represented in Table 2), which reflects that the treatment gave a statistical difference in all the experiments with respect to the total carbohydrate percentage. Media used as a factor reflects a significant effect on the cultivation process (carbohydrates concentration). The results of ANOVA on a small scale provide an average value of all the experimental treatments, which clearly represents the statistical difference in average values of all the seven media composition factors. The statistical difference on behalf of the evaluation of the deviation of the values was clearly composed to select a value to scale up the process. On evaluating the conditions on behalf of ANOVA, treatment G or 7 were able to provide the maximum percentage of carbohydrate using a significant amount of nitrogen and phosphorous, and the experiment was scaled up using treatment G (without nitrogen and phosphorous).

3. Results and Discussion

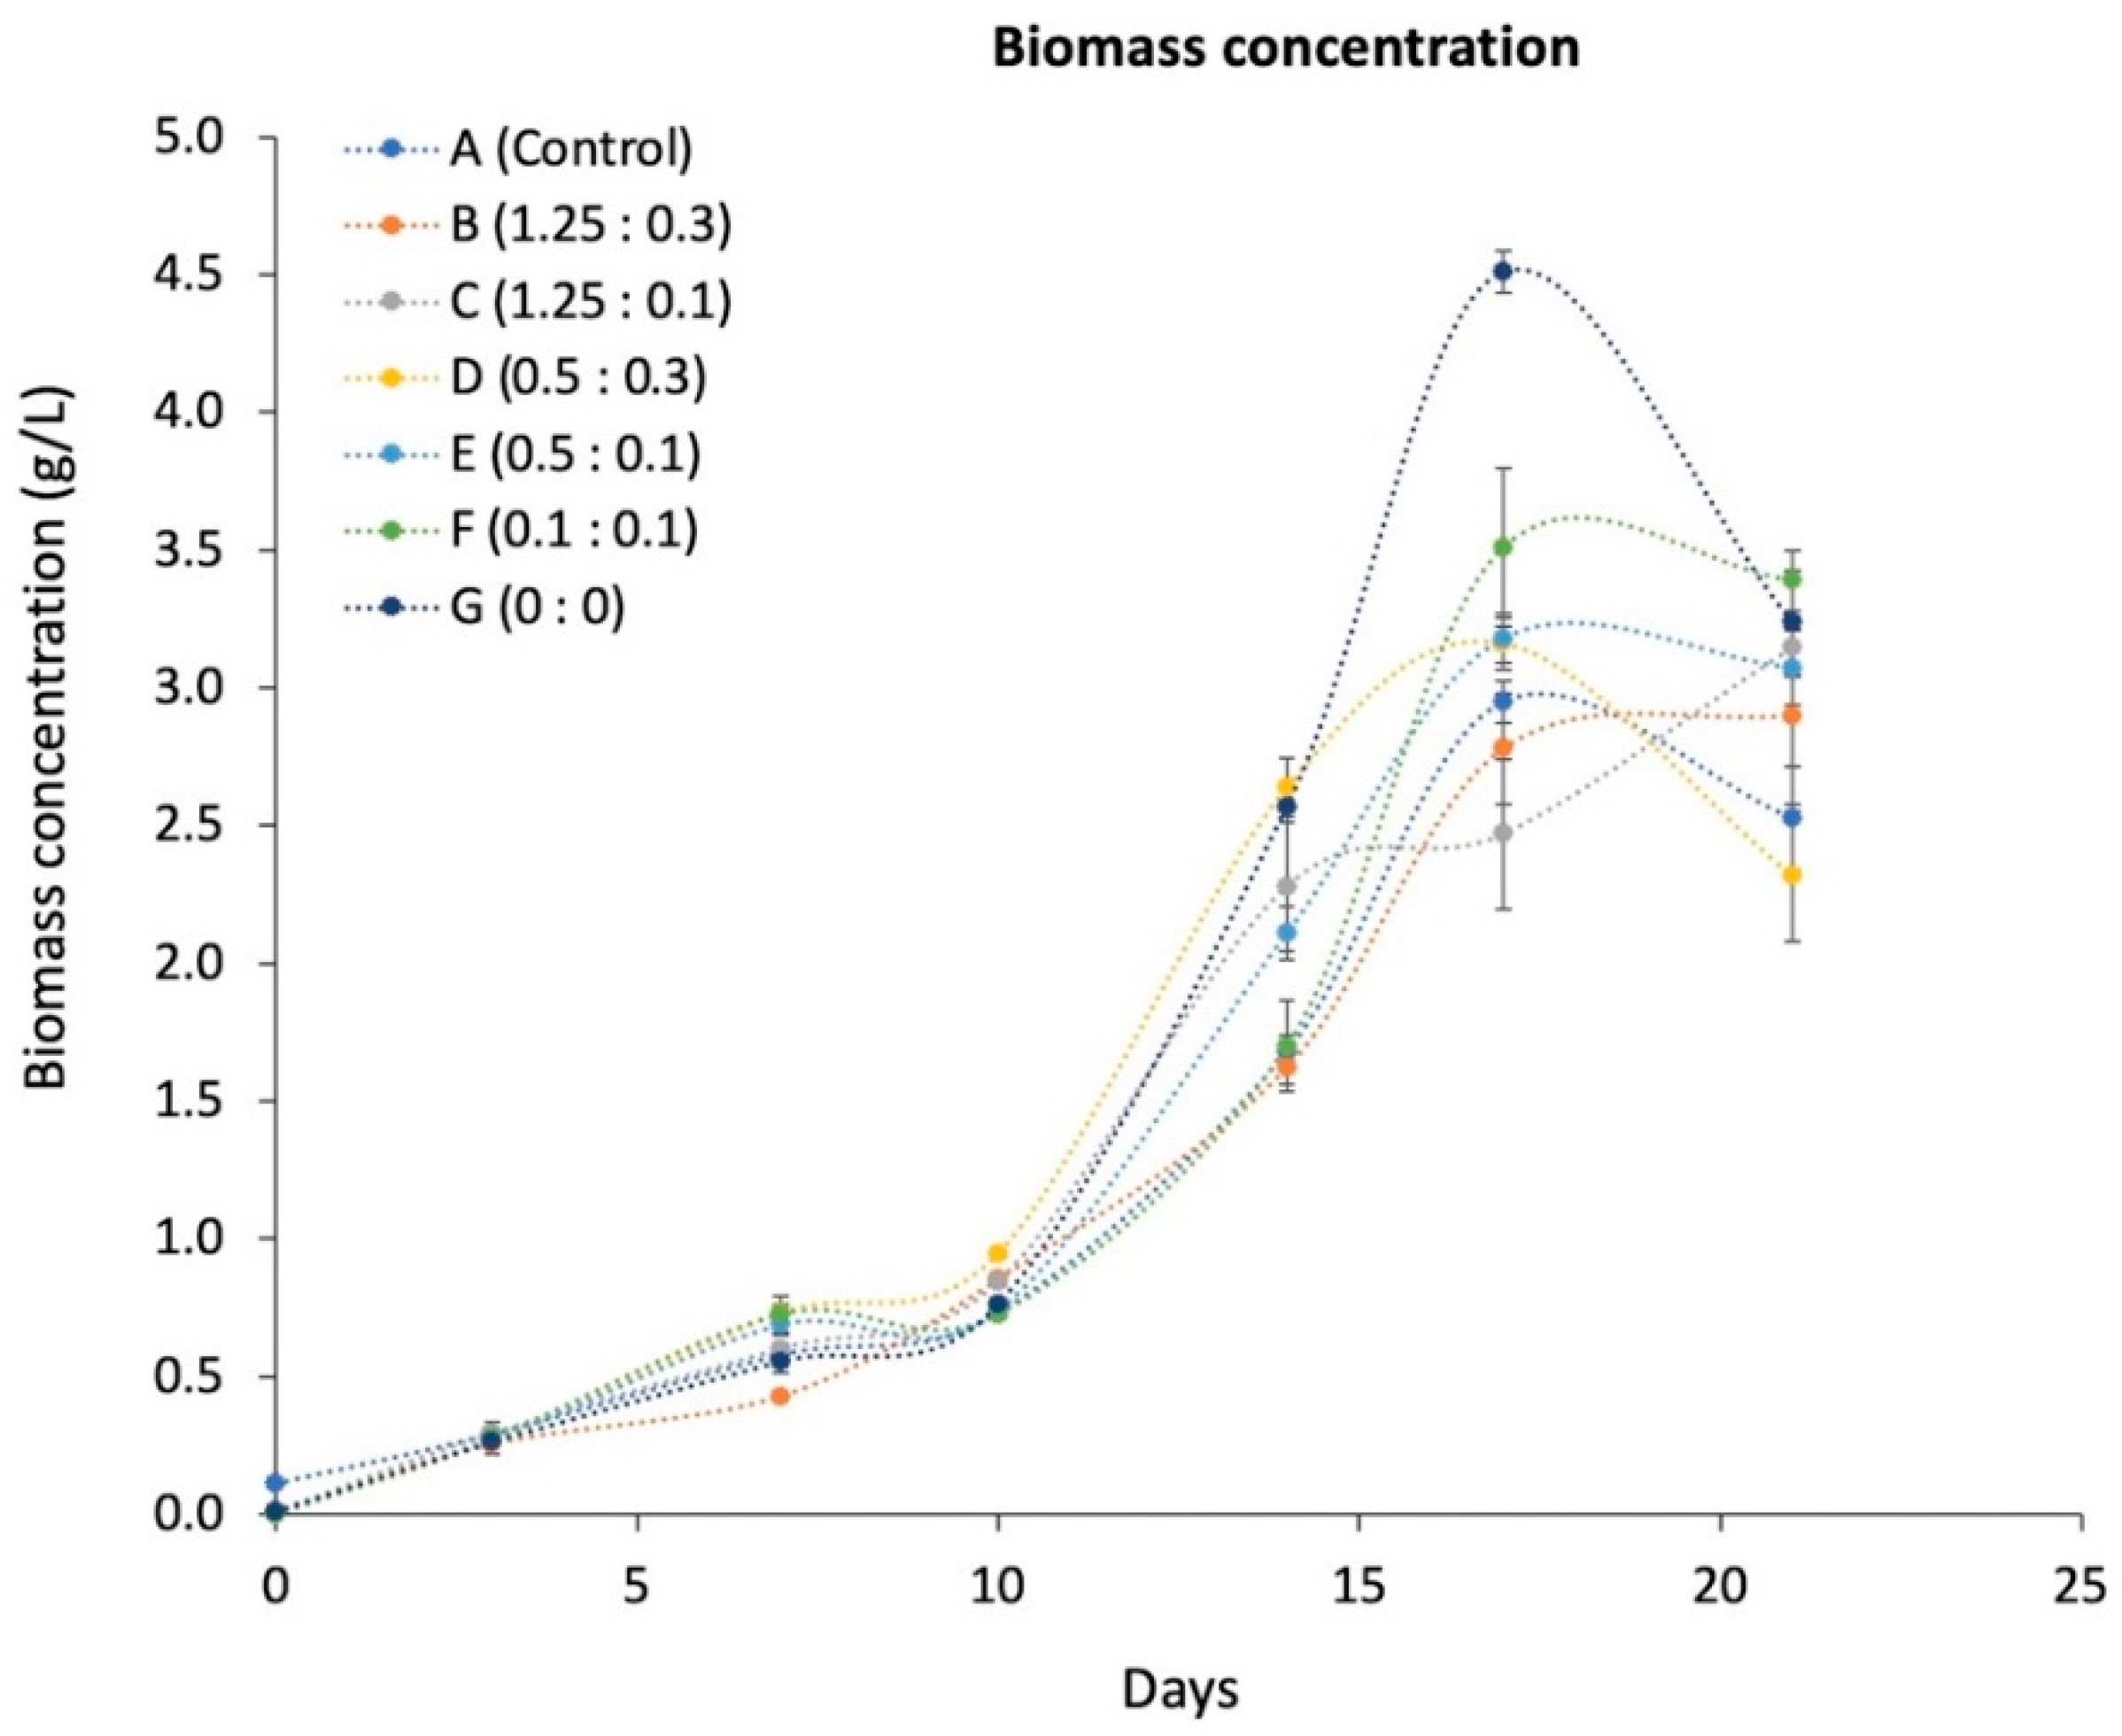
3.1. Evaluating the Parameters That Influence Biomass and pH Determination

Microalgal biomass concentration is a valuable indicator of growth and biomass productivity [33]. The presence of an appropriate quantity of macronutrients, namely phosphorus, nitrogen, and other micronutrients such as iron, manganese, and other trace elements, is required for microalgal cell proliferation. As a result, stress caused by excessive nutrient intake or deprivation has been shown to favorably modify microalgae cellular physiology, which can negatively impact the growth [26].
In the first step, the experimental design employed seven treatments (Table 1), including control (standard Zarrouk’s medium) of selected nutrient stresses with the triplicate, such as nitrogen and phosphorous. Figure 2 depicts the growth curves of Spirulina platensis LEB-52 under different concentrations of nitrogen (NaNO3) and phosphorous (K2HPO4). For the first ten days, all seven treatments were slow because it took time for adaptation, but cultures were triggered, and growth was resumed after ten days. For ten days, all biomass treatments were almost similar compared with the control flask, but after ten days, without nitrogen and phosphorous, the flask culture grew very fast compared with the control. S. platensis was able to grow satisfactorily in all the culture media tested in the flasks. The lag phase was observed in F, G, D, and E treatments that lasted 7–10 days, which is the period necessary for the strain to adapt to the culture conditions [34]. These experiments with treatment G (without nitrogen and phosphorous) showed higher cell density at 14 days than others, including control flasks, enabling two values to be calculated for the maximum Spirulina platensis biomass productivity (g/L/d) and specific growth rate (μ, /d). Treatment G (without nitrogen and phosphorous) expressed a higher specific growth rate and maximum productivity 1.32 ± 0.10/d and 2.57 ± 0.14 g/L/d) than other treatments. The highest cell concentration (Xmax) was reached in runs G, F, E, and D (Figure 2). In these experiments, the cell growth in treatments F and G started the decline phase after 14 days. The results revealed that the growth of S. platensis was considerably inhibited in salt stress compared to control. When S. platensis was exposed to high salt concentrations, the growth was immediately blocked, which reduced the production of biomass. Before a new steady-state growth was reached, there was an initial lag period. After exposure to high salt concentrations, this lag phase is associated with decreased chlorophyll and biomass content due to photosynthetic and respiratory system inhibition. Chlorophyll has also been found to be the principal target of salt toxicity, lowering the net absorption rate and resulting in decreased photosynthesis and growth [35,36]. Both nitrogen and phosphorous under limitation conditions influence microalgal biomass production, and nitrogen has a greater impact on the enhancement of microalgae growth than phosphorous [37].
In the second step (cultivation on a large scale), the best condition that favors total carbohydrates present in Spirulina platensis under minimal medium for saving capital cost and with higher biomass productivity was selected. This condition was selected by using the data of statistical analysis. The second step of cultivation was followed up as similar to the first one (at the flask stage). Figure 3 shows the treatment of the control flask, and the other one was without nitrogen and phosphorous, which were labeled as control and treatment G, respectively, and involved the same growth pattern but without the lag phase. To scale up the process, treatment G achieved low biomass after 14 days compared to the control. Table 3 expresses that treatment G achieved maximum biomass (0.93 ± 0.0 g/L), maximum productivity (0.92 ± 0.0 mg/L/d), and maximum specific growth rate (0.07 ± 0.0 1/d) compared to the control, but doubling time was low (9.32 ± 0.40) compared to the control (15.93 ± 0.98). Similarly, Arbib et al. [38] selected Scenedesmus obliquus, which was cultivated in wastewater at different nitrogen and phosphorous ratios, from 1:1 to 35:1. A lower proportion of N:K was shown to be the ideal N:P ratio for maximizing biomass production and output.
Therefore, many factors affect microalgal cell growth and other value-added products, such as temperature, light, and agitation. The typical climate and light intensity favor the cultivation of Spirulina platensis in Zarrouk’s medium. Both parameters are linked to cell growth of microalgae. On the other hand, the thermophilic characteristic of Spirulina strains has a significant impact on carbohydrate growth at the temperature scale 30–37 °C [36]. In addition, pH plays a significant role during the cultivation of microalgae in the medium. Other kinds of microalgae and microbes may be prevented by the pH value in Zarrouk’s medium. As a result, higher biomass concentration was achieved at a pH value between 9 and 10. Similarly, Cardoso et al. [39] obtained higher biomass concentrations with higher values of pH [39].
As a result, in this study, Spirulina platensis LEB-52 productivity, specific growth, and biomass production were due to synergistic effects, with nutrient limitation in Zarrouk’s medium, favorable environmental conditions, hydrodynamics, and light intensity in the flask and airlift photobioreactor as factors that were combined for result optimization.

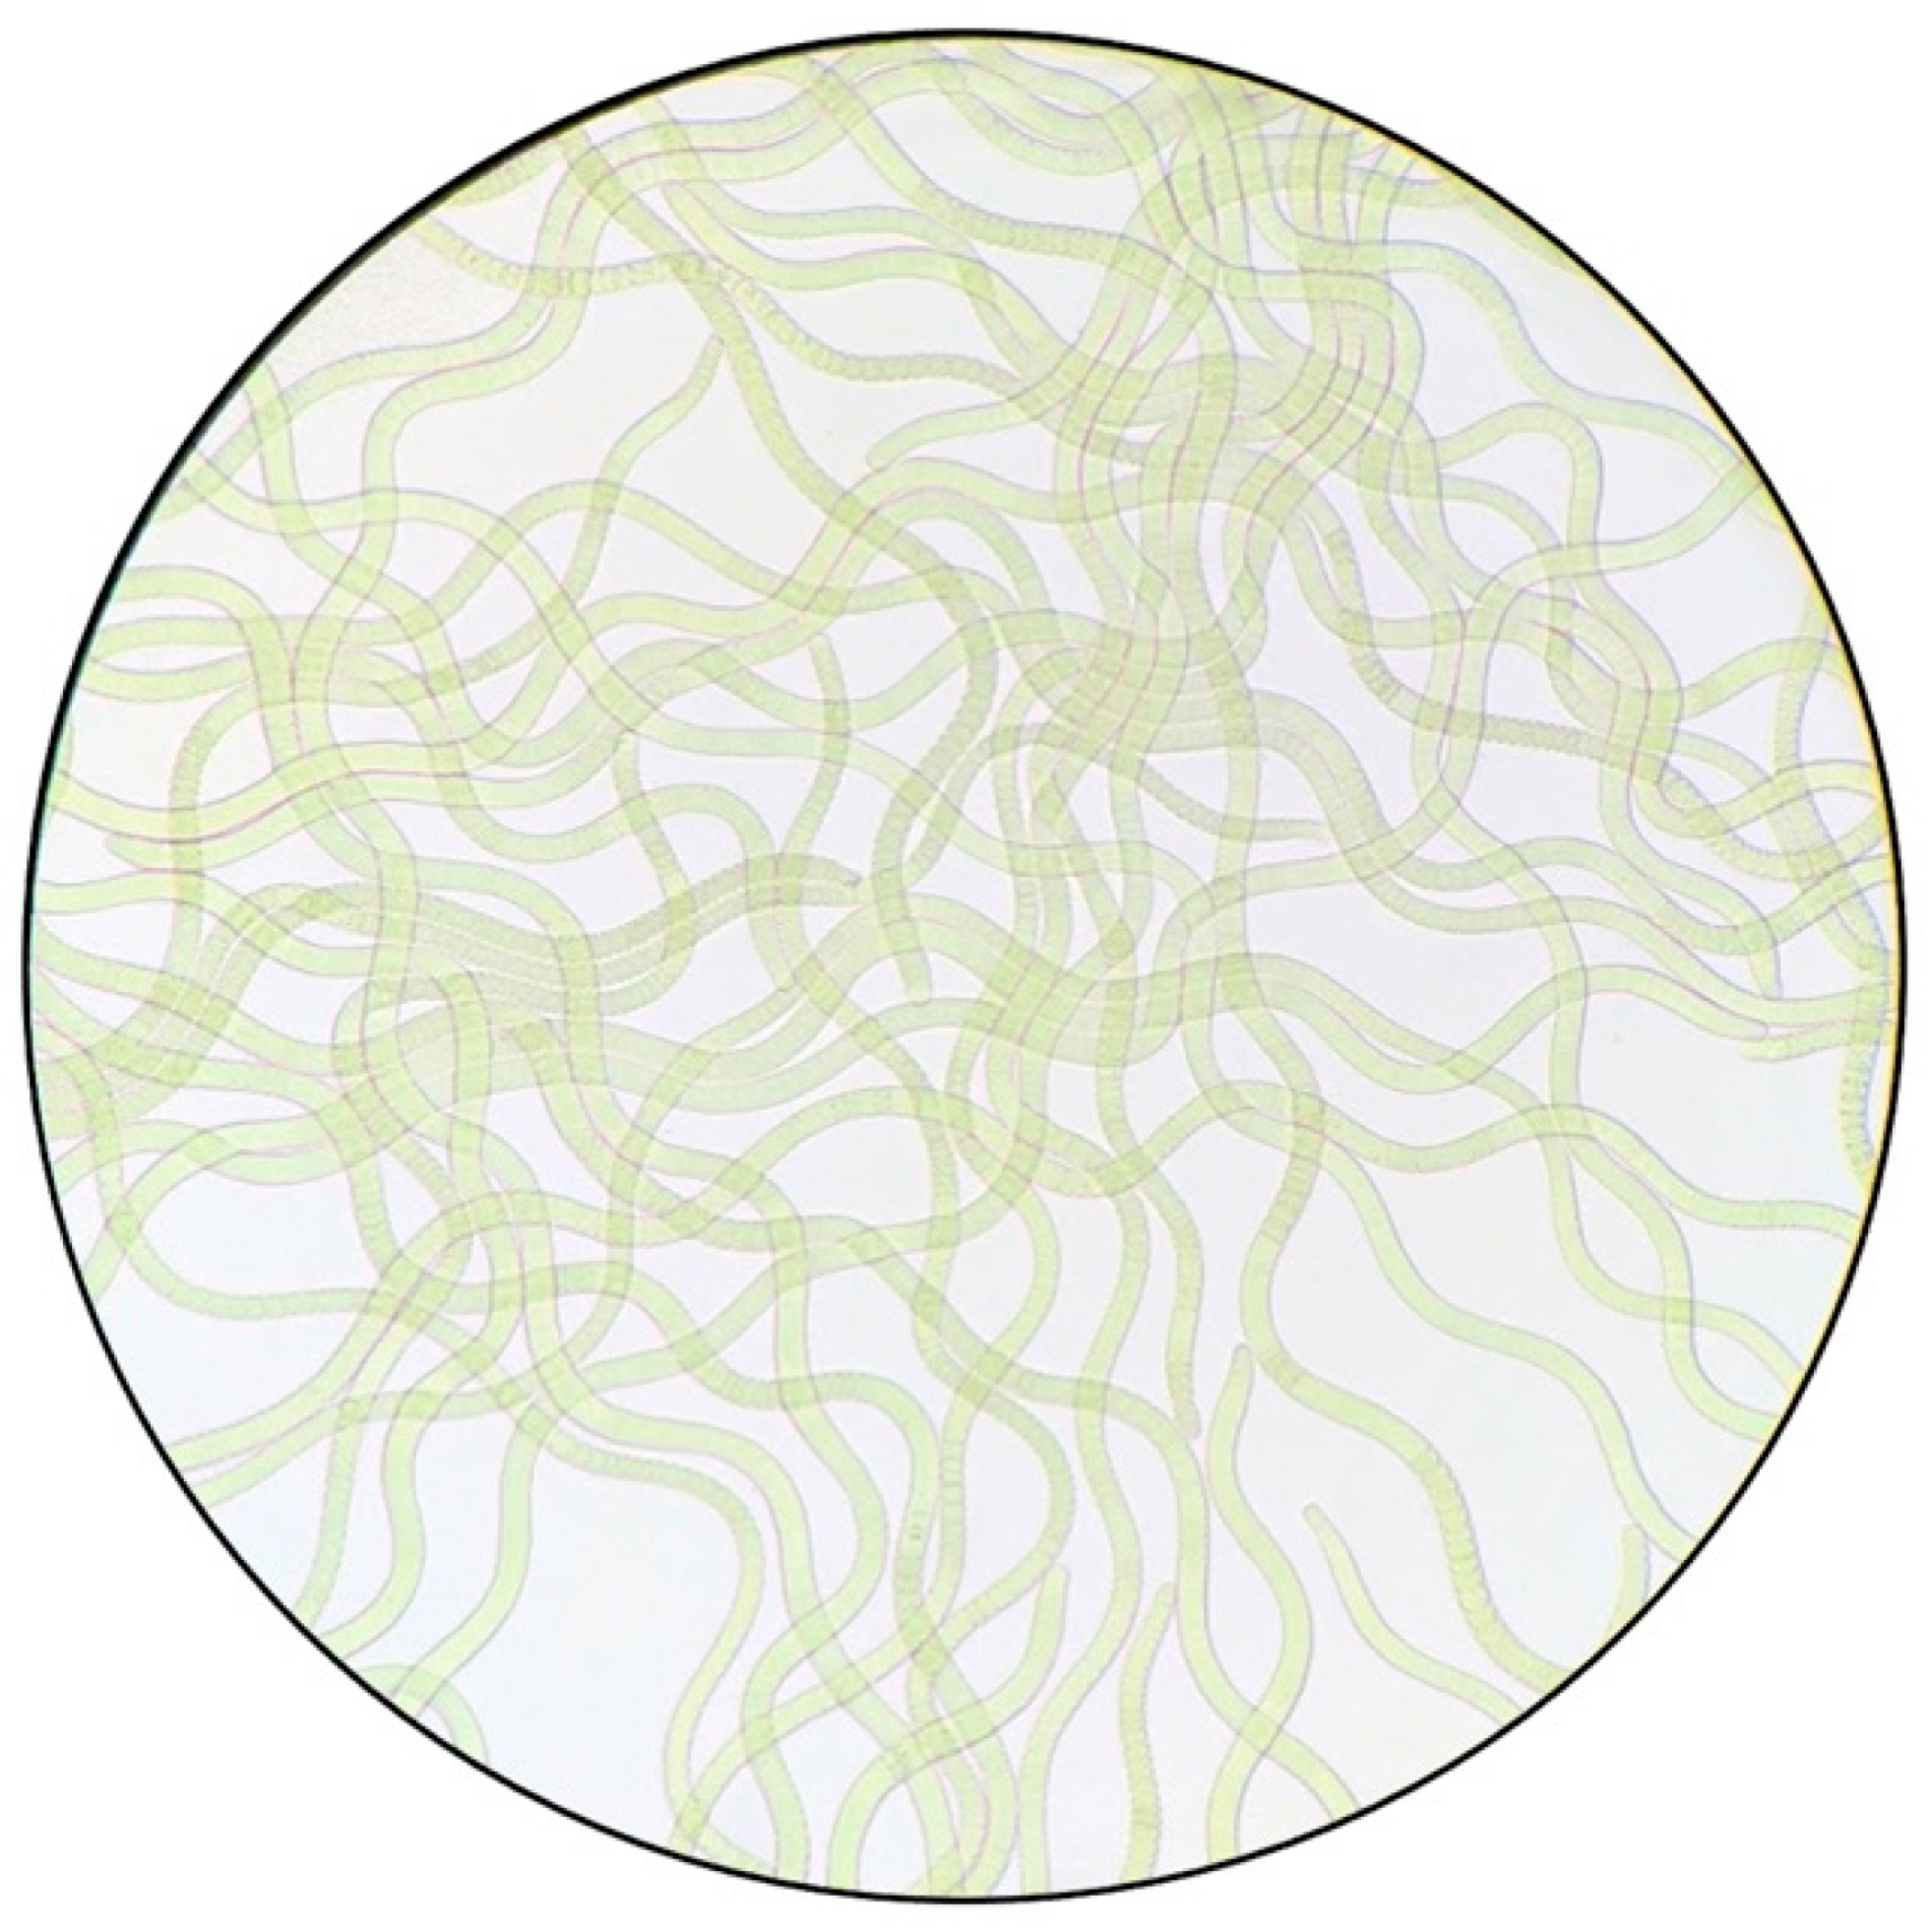
3.2. Morphological Behavior

Under the microscope, Spirulina platensis is a spiral with green color. After ten days of cultivation, the green color of Spirulina was converted into a light faded green color due to nutrient starvation, which is related to nitrogen and phosphorous (Figure 4). This result is in accordance with Paes et al. [40], who cultivated Chlorella sp. and Nannochloropsis oculata under nitrogen starvation conditions. Chlorophyll decreased when nutrients were consumed in the medium.

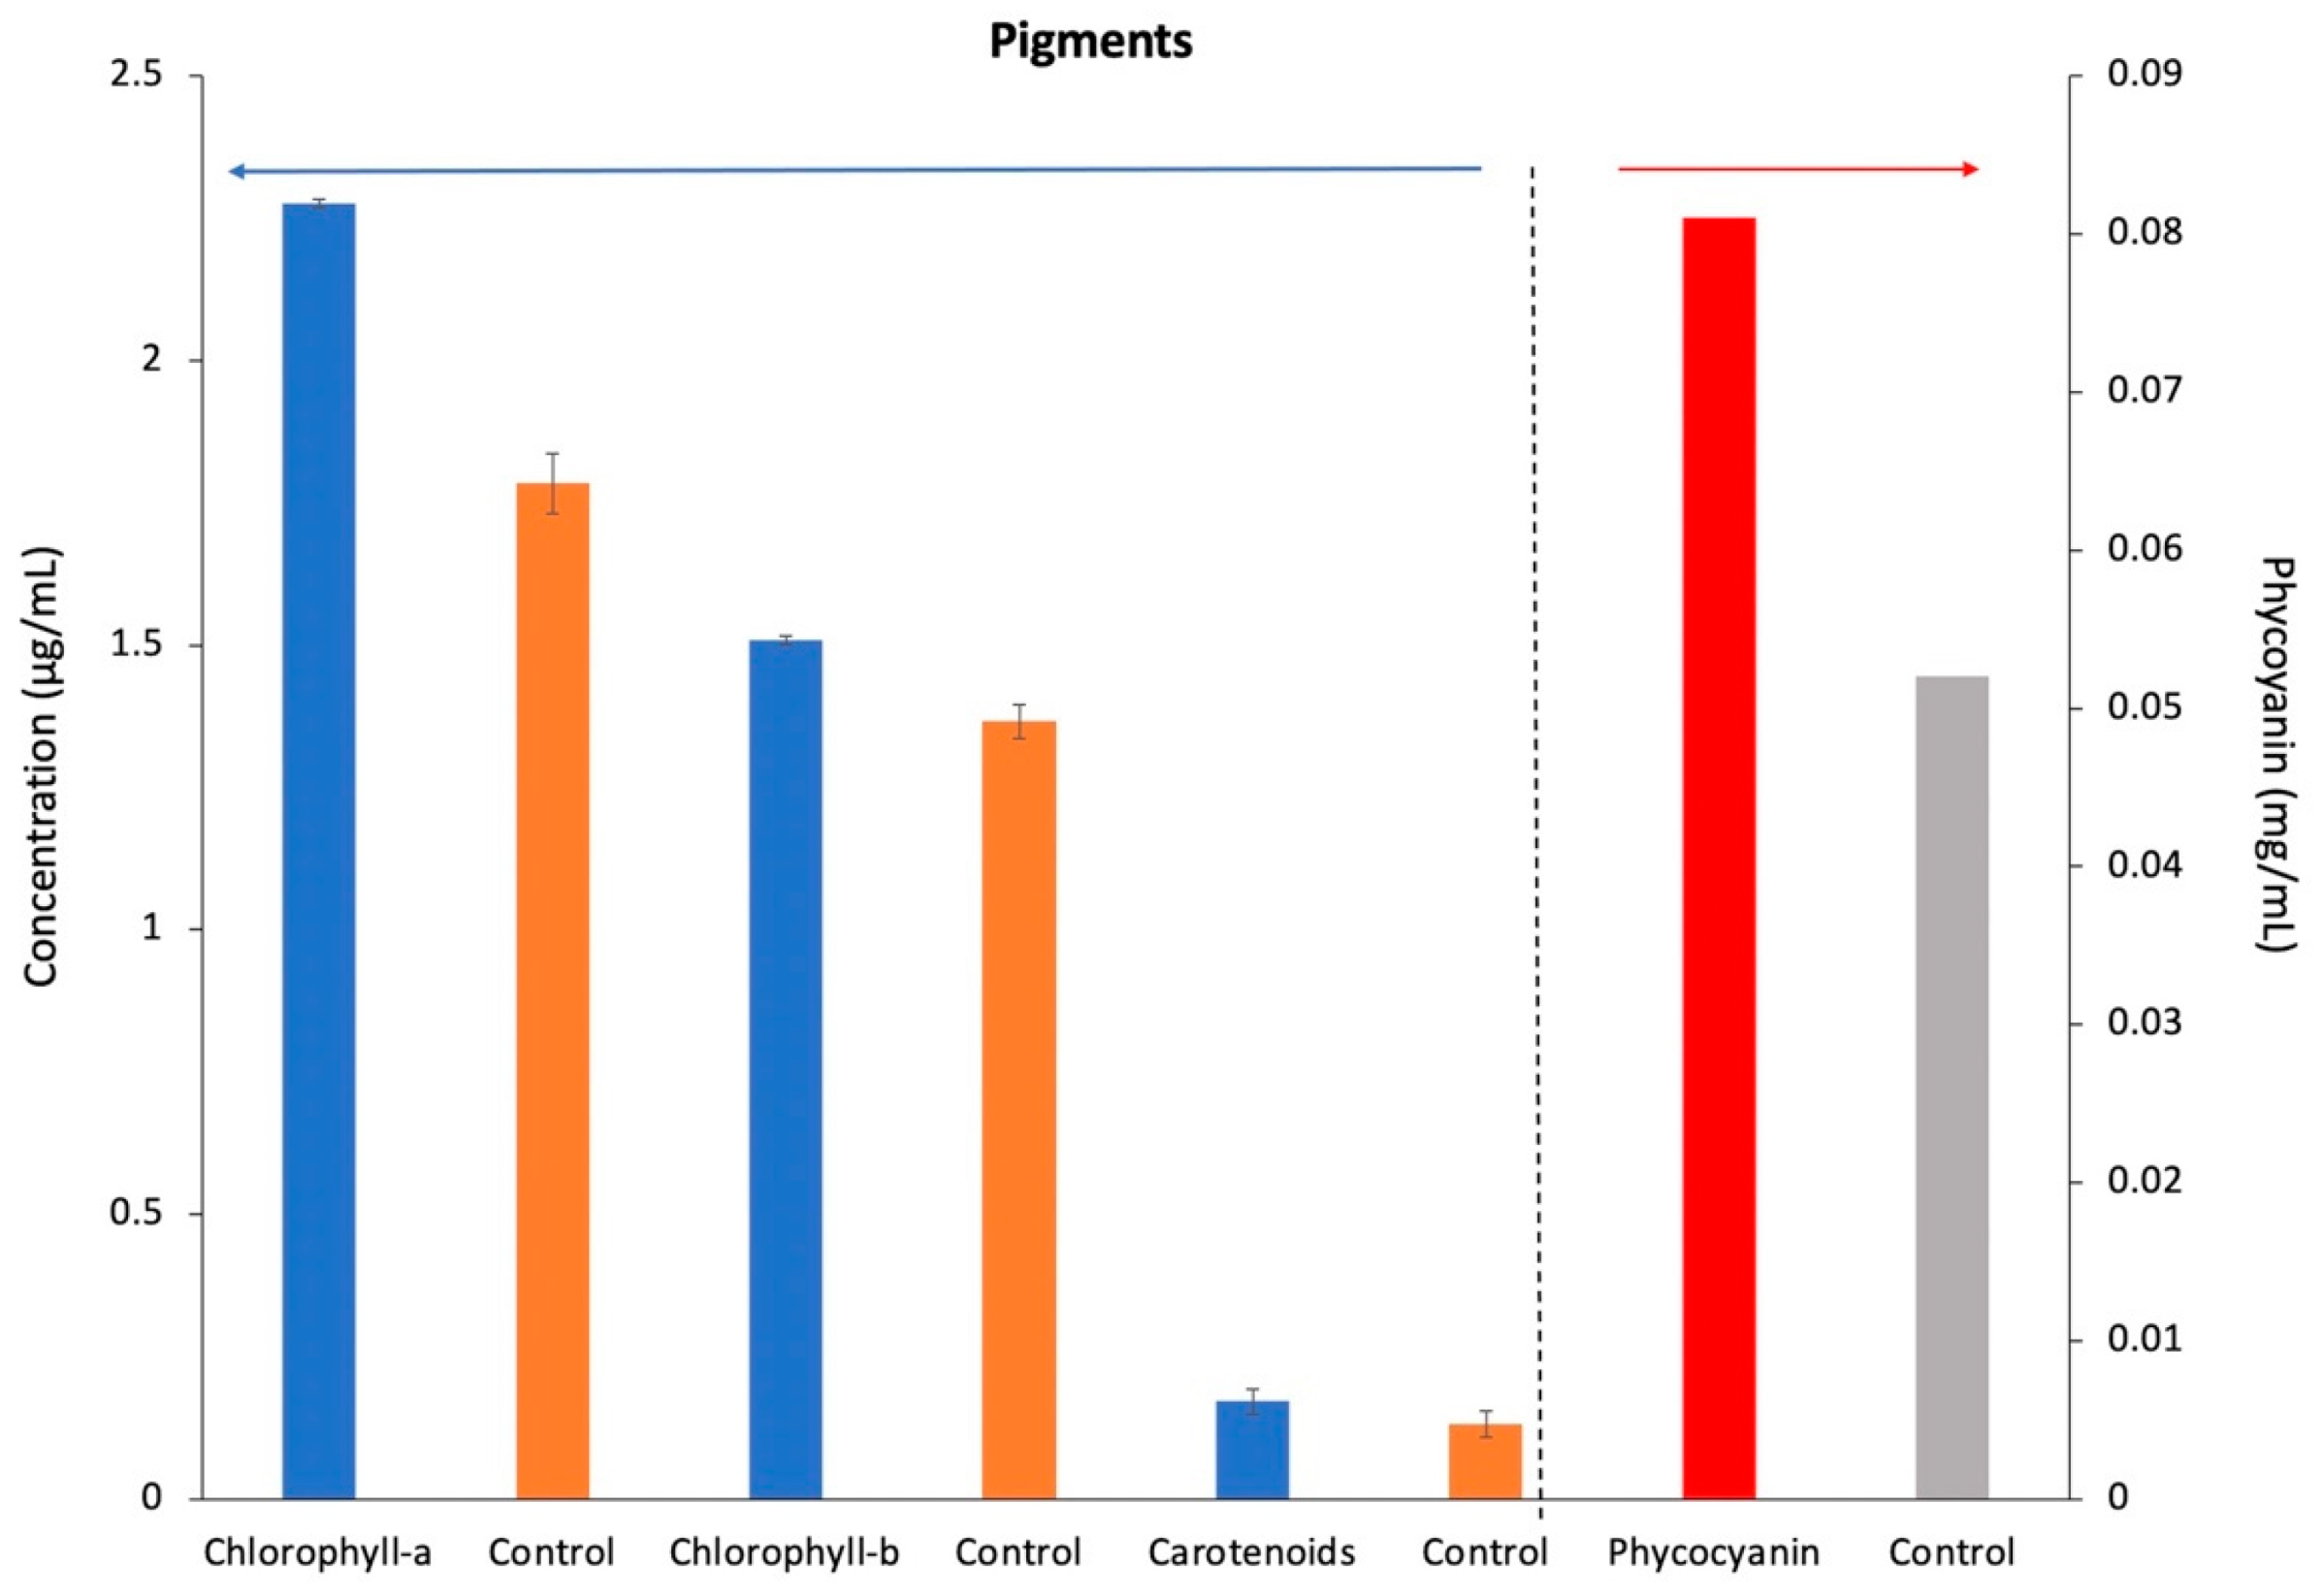
3.3. Extraction of Pigments (Chlorophyll-a, Chlorophyll-b, Total Carotenoids, and Phycocyanin)

After optimizing the best medium that favors carbohydrates, we analyzed the pigments. Treatment G (without nitrogen and phosphorous) had significantly higher concentrations of all pigments, such as Chlorophyll-a (2.27 ± 0.05 μg/mL), Chlorophyll-b (1.51 ± 0.01 μg/mL), carotenoids (0.17 ± 0.02 μg/mL), than the control (Figure 5). The decrease in Chlorophyll levels might be linked to the photosynthesis process and an increase in reactive oxygen species (ROS) produced by the electron transport chain. Under oxidative stress, cells can lower their ROS baseline by reducing chlorophyll content [39]. Cardoso et al. [41] also documented pigment decreases in T25 treatment from the small-scale photobioreactors (5 L) for Chlorophyll-a (12.48 μg/mL), b (1.41 μg/mL), and carotenoids (9.68 μg/mL). Chlorophyll-a and carotenoids had lower amounts of 10.00 μg/mL and 1.62 μg/mL, respectively, compared to the photobioreactor finding. In contrast, Chlorophyll b showed a slight increase (1.05 μg/mL) [41]. Ajayan et al. [42] previously found a decrease in Chlorophyll-a levels, implying that light penetration directly influences the production of this pigment, resulting from the surface-to-volume ratio of large-scale reactors [42].
Among the pigments analyzed in this study, the carotenoids were the most synthesized by Spirulina in the treatment of G (0.17 ± 0.02 μg/mL) and control (0.13 ± 0.02 μg/mL). The nutrient stresses can explain the low carotenoid levels in the medium and region where cultivation was carried out. The cell creates antioxidant chemicals to protect its chloroplasts as a defensive strategy. Photoinhibition, oxidative stress, and damage to photosynthetic units are all prevented by antioxidant substances. As a result, strong associations between oxidative stress levels in microalgal cells and antioxidant chemicals such as carotenoids are predicted [39].
In addition, the generation of photosynthetic pigments such as carotenoids and chlorophyll is hampered by hunger. Because of the lack of nitrogen, the carbon flow that was planned to be fixed photosynthetically is converted to the lipid or carbohydrate synthesis metabolic route from the protein synthesis metabolic pathway, resulting in the accumulation of carbs or lipids [26].
The phycocyanin content in treatment G was 0.05 mg/mL lower than that in the control (0.08 mg/mL) (Figure 5). The lower value of phycocyanin was attributed to the deficiency of nitrogen and phosphorous present in Zarrouk’s medium. Phycocyanin levels are influenced by a variety of environmental conditions, including light intensity and quality, changes in the light route, and reactor temperatures, due to the diverse contributions of ecological conditions in outdoor cultures. Similarly, Garcia-Lopez et al. [43] found complicated reactions of Arthrospira cultures under external circumstances, owing to a variety of variables impacting phycocyanin production metabolism [43].

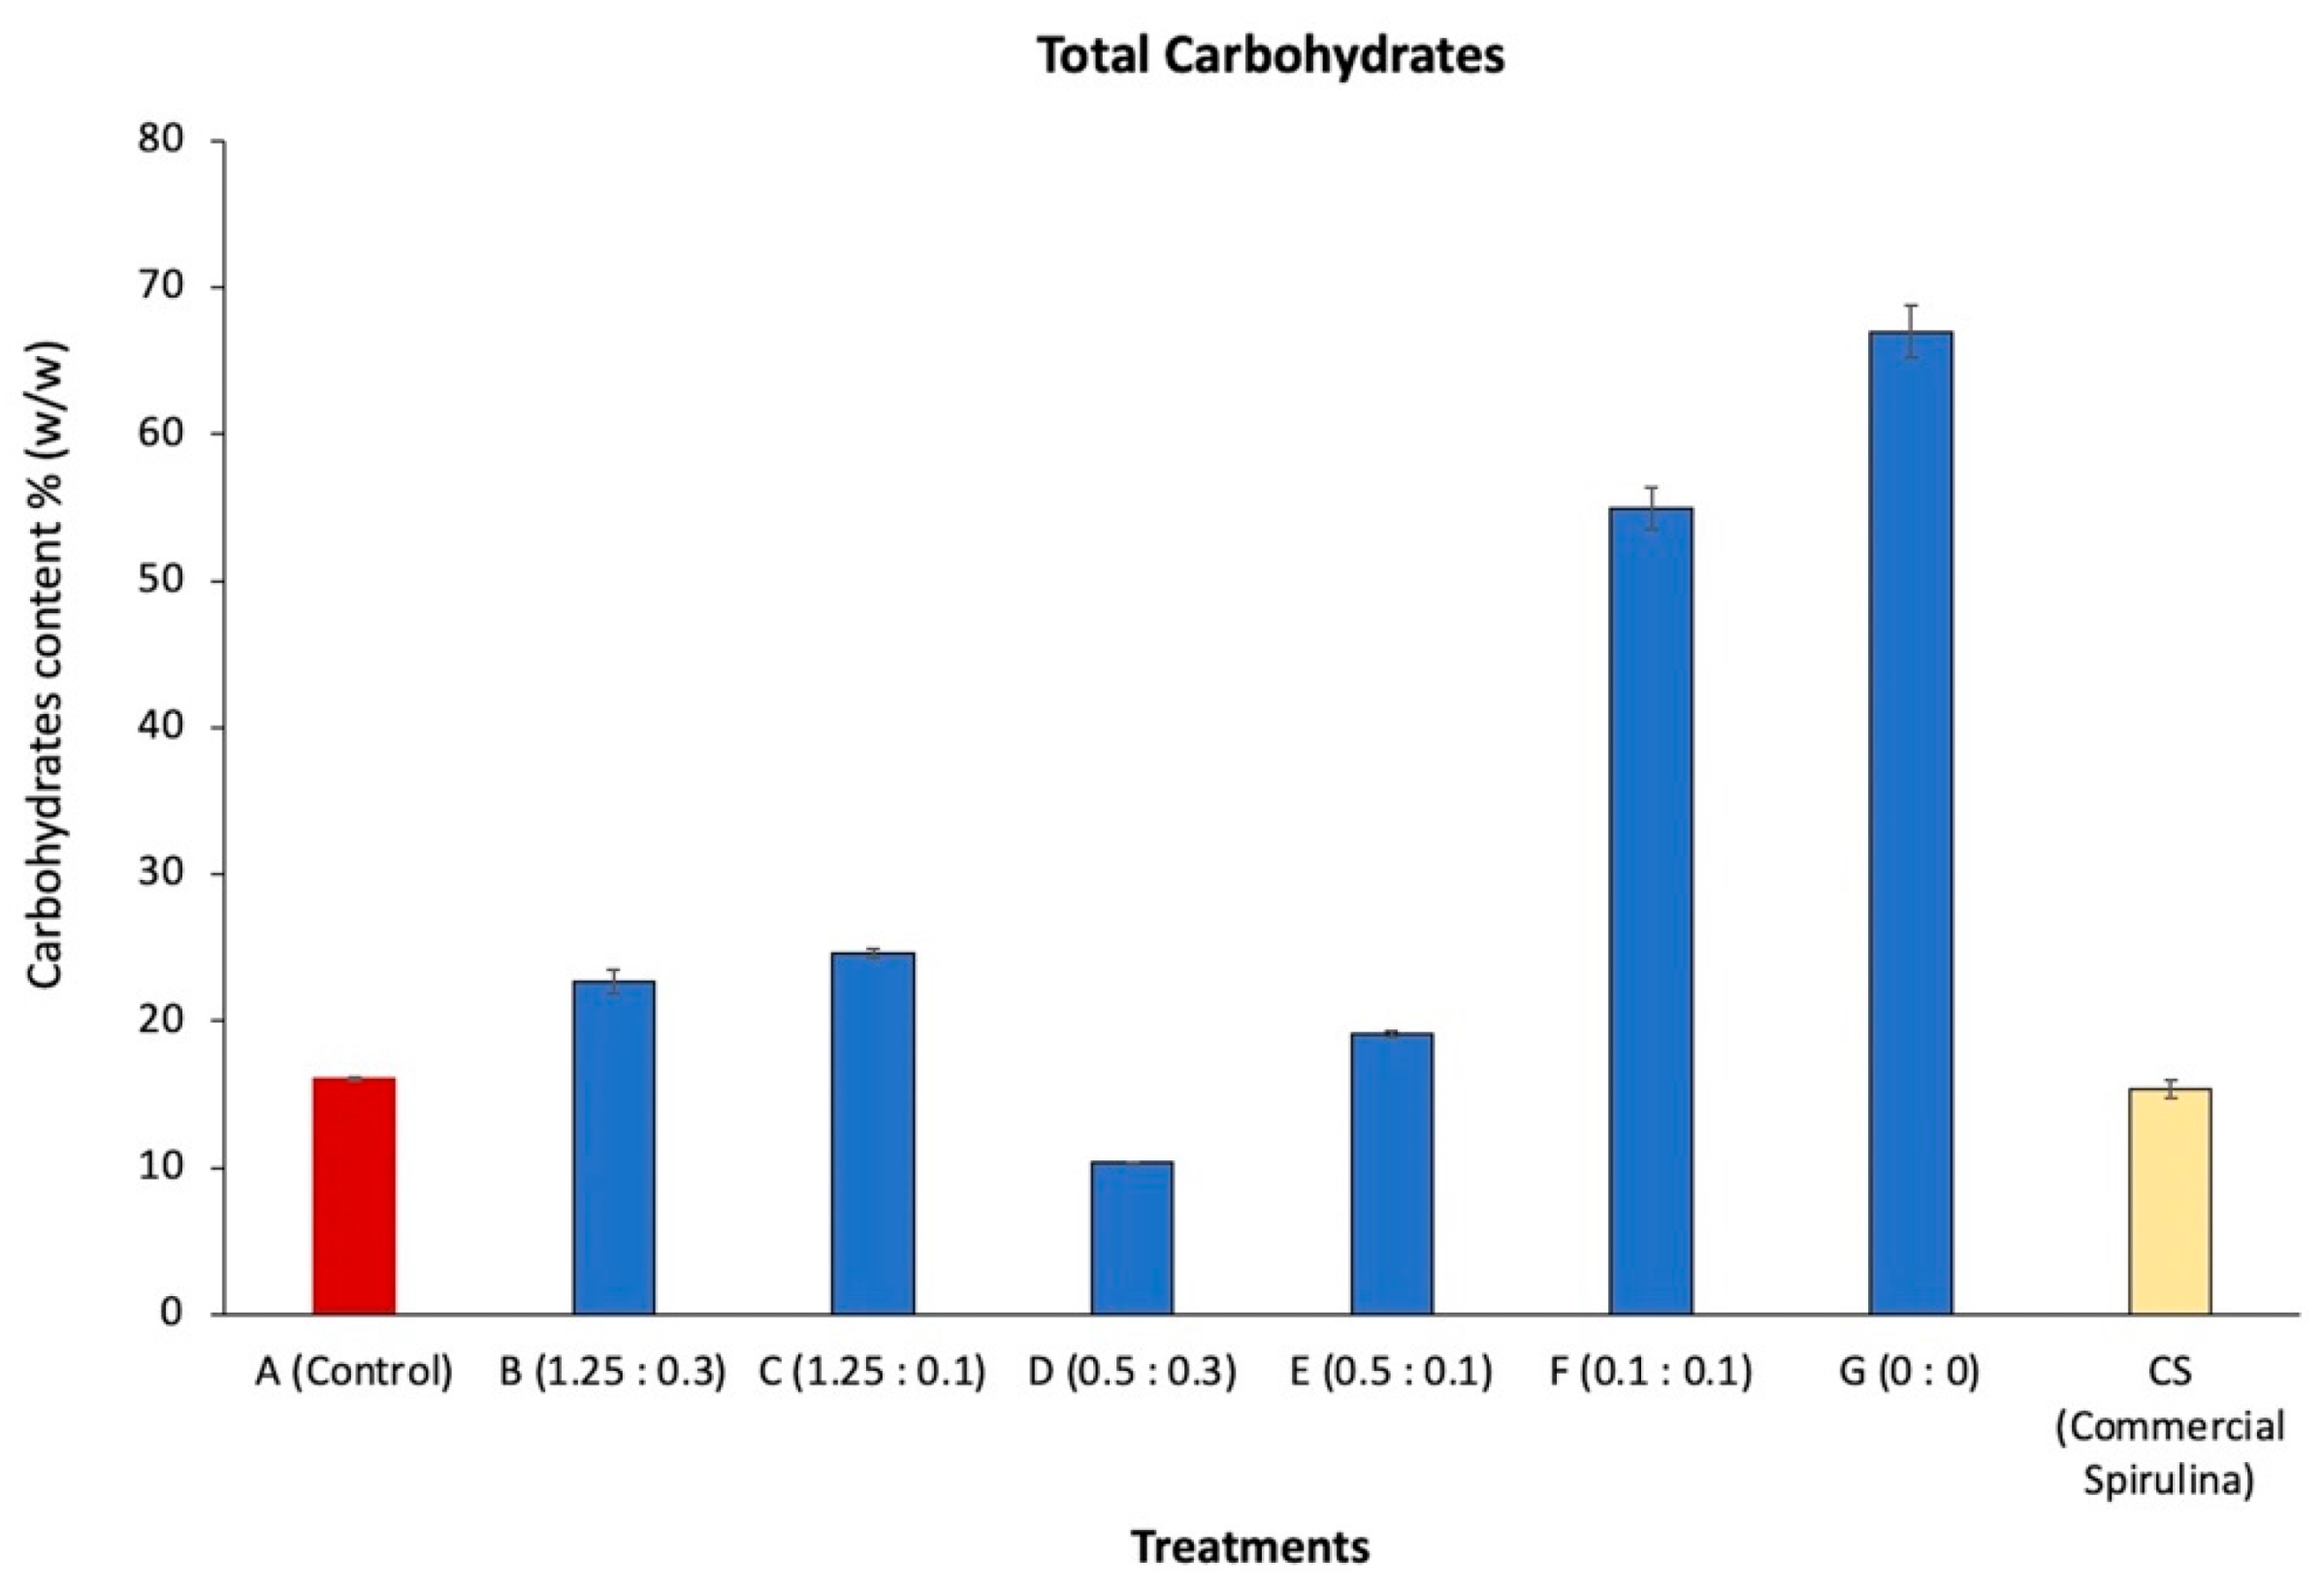
3.4. Carbohydrate Accumulation

Spirulina platensis was higher in proteins (above 60%) and lower in carbohydrates (12–17%) and lipids (around 5–7%) as in past reports [44]. Microalgae showed a remarkable growth rate of 1.32 ± 0.10 1/d and a final biomass concentration of 4.50 ± 0.27 g/L at the flask scale. In the beginning, carbohydrate content was about 16% (w/w) as in the control flasks, which started to increase when the external nitrogen source was completely consumed, provided by the inoculum, reaching a value of about 67% (w/w) at the end of the stationary phase duration of 14 days, as shown in Figure 6. These results agree with those obtained by Liu et al. [45], who cultivated Spirulina platensis in an industrial-scale outdoor open raceway pond under nitrogen limitations, reaching a maximum carbohydrate content of about 64.30% DW. Similarly, Ho et al. [46] cultivated C. vulgaris FSP-E in batch mode and reached a carbohydrate content of nearly 50% when the external nitrogen source was depleted. Werlang et al. [44] cultivated Spirulina platensis semi-continuously in an open raceway pond and reached a high carbohydrate level of nearly 40%.
In the scale-up process, we chose the best conditions for the flask scale that favored the total carbohydrates present in Spirulina platensis under minimal medium for reduced capital cost and higher biomass productivity. The statistical analysis of obtained data was used to perform statistical analyses with p < 0.05 as the significance level. Table 4 expressed that treatment G achieved a higher total carbohydrate content of 74.43 ± 0.63% (w/w) than the control of 16.07 ± 0.07% (w/w). Production on a large scale reached higher carbohydrate content as compared to the flask scale experiment. Many factors affect the carbohydrate content, such as mixing and temperature. Manual shaking was performed in the flask scale experiment, but aeration was provided for mixing in a large-scale investigation.
For proper confirmation of experimental results regarding carbohydrates, we purchased commercial Spirulina (CS); the company’s name is “Organicos Monterrey” from Saltillo, Mexico. The company reported 15 g of carbohydrates present in 100 g of biomass. A total of 100 mg biomass was taken for carbohydrate analysis, and finally, the result achieved the same as claimed by the company 15% (w/w) by Anthrone test, as shown in Figure 6 for the flask scale and Table 4 for the large scale (10.1 L). Commercial Spirulina and the control were found to have almost similar total carbohydrate content.
Primarily, a fresh culture that was 7–10 days old was utilized as an inoculum to show the viability of producing carbohydrate-enriched biomass from Spirulina platensis without nitrogen and phosphorus in Zarrouk’s medium at the lab scale. In large-scale flask experiments without nitrogen and phosphorus, a small quantity of inoculum nitrogen and phosphorus stimulated growth and generated carbohydrate-rich biomass (wastewater bottle 10.1 L). Because of its ability to store nutrients in times of scarcity, lipids are a significant component of the cell membrane’s structural makeup. During microalgae cultivation, the production of carbohydrate-rich biomass is possibly due to the fixation of inorganic carbon units in metabolic pathways in nutrient stress conditions. These lipids are stored in minute amounts inside cell organelles and used by the cell for survival and other metabolic functions in an unfavorable environment [26].

3.5. Lipid Determination

Table 4 shows, interestingly, under nutrient stress conditions, such as nitrogen and phosphorous (Treatment G) in Zarrouk’s medium, that Spirulina platensis accumulated the highest amount of total lipid (26.25 ± 0.46 μg/mg) compared to the control (17.87 ± 0.33 μg/mg). Similarly, Rehman et al. [47] selected Chlorococcum sp TISTR 8583 microalgae, cultivated in BG-11 medium under nitrogen limitation and under-optimized light intensity and achieved a high lipid content of 29.59% under nitrogen limitation compared with a control of 17.05%. Singh et al. [10] selected an oleaginous microalgal stain (Ankistrodesmus falcatus KJ671624) for potential feedstock for biodiesel, cultivated in BG-11 medium under stress conditions such as nitrogen, phosphorous, and iron. Under nutrient stress of nitrogen 750 mg/L, phosphorous 0 mg/L, and iron 9 mg/L, this resulted in the highest lipid content of 59.6% and lipid productivity of 74.07 mg/L/d compared to standard BG-11 medium. Campenni’ et al. [48] also investigated higher lipid content under nutritional stress conditions than the control and achieved lower lipid productivity [48].
Micro-macro nutrients are essential for algal species development, fatty acid metabolism, and cell reproduction. As a result, nutrient stress is one of the most widely used and cost-effective lipid-increase techniques. Several investigations on specific algae species are being undertaken in order to close the information gap and better understand the role of salinity stress for a better biochemical profile [26].

3.6. Protein Quantification

The Bradford protein assay in Table 4 estimated that a higher amount of protein was produced in the control (40.35 ± 1.05 μg/mL) compared to treatment G (without nitrogen and phosphorous) (16.84 ± 1.58 μg/mL). Less protein production depends on the nitrogen availability in the medium. A higher amount of nitrogen promotes high protein content. Phosphorous showed little influence on nitrogen assimilation and conversion efficiencies. It was noticed that nitrogen significantly affected the metabolic pathway involving the dominant fraction of protein [37]. In this experiment, soluble proteins were recovered in the protein isolate, resulting in a decreased recovery in the remaining biomass. In fact, when adverse conditions were applied to microalgae, the protein content decreased. Although protein turnover may offer a carbon skeleton for carbohydrate buildup in Spirulina platensis, its contribution should be restricted because protein concentrations did not fall significantly in this study [45]. According to Eze et al. [28], nitrogen sources and light intensities are important parameters that affect protein accumulation by many species of microalgae [28].
Protein content also depends on the pH value. Cultivation of Spirulina under stress medium increased the pH. Higher pH blocked the photosynthesis process in microalgae. Under oxidative stress, cells can lower their ROS baseline by reducing chlorophyll content [39]. According to Soni et al. [49], the development of microalgae, pigment synthesis, and protein content of Spirulina species are affected by pH [49].

4. Conclusions

Spirulina platensis LEB-52 cells were grown under a modified stressful medium with the ultimate goal of increasing biomass growth and carbohydrate enrichment. It was concluded that treatment G (without nitrogen and phosphorous) was the best media composition for treating Spirulina platensis to produce a significant amount of total carbohydrates (74.43 ± 0.63%, w/w) and higher biomass (0.93 g/L) compared to the control. Spirulina under the optimized medium (without nitrogen and phosphorous) also yielded 26.25 ± 0.46 μg/mg of lipid, which was the highest compared to the control. Therefore, presenting multiple stress induction processes for a short period of time as an alternative to long-term stress-induced experiments can reduce the capital cost. As a result, this research provides an effective cultivation technique for stimulating the synthesis of carbohydrates as a feedstock for biofuel, primarily bioethanol or other high value-added compounds, through biochemical platforms as a fermentation process in terms of biorefinery concept. This study determined the optimal medium composition for Spirulina platensis growth and carbohydrate enrichment biomass for a viable biofuel generation strategy with low capital cost.

Author Contributions

Conceptualization, R.S., R.M.R.-J. and H.A.R.; methodology, R.S., R.M.R.-J., M.L.C.-G., C.N.A., G.Q., H.A.R.; software, R.S., R.M.R.-J. and H.A.R.; validation, R.M.R.-J. and H.A.R.; formal analysis, R.S., R.M.R.-J. and H.A.R.; investigation, R.S., R.M.R.-J. and H.A.R.; resources, R.M.R.-J. and H.A.R.; data curation, R.S., R.M.R.-J., M.L.C.-G., C.N.A., G.Q., H.A.R.; writing—original draft preparation, R.S.; writing—review and editing, R.S., R.M.R.-J., M.L.C.-G., C.N.A., G.Q., H.A.R.; visualization, R.M.R.-J. and H.A.R.; supervision, R.M.R.-J. and H.A.R.; project administration, R.M.R.-J. and H.A.R.; funding acquisition, R.M.R.-J. and H.A.R. All authors have read and agreed to the published version of the manuscript.

Funding

This research was funded by the Mexican Science and Technology Council (CONACYT, Mexico) Infrastructure Project—FOP02-2021-04, grant number 317250.

Institutional Review Board Statement

Not applicable.

Informed Consent Statement

Not applicable.

Data Availability Statement

Not applicable.

Acknowledgments

Author Rohit Saxena would like to thank the Mexican Science and Technology Council (CONACYT, Mexico) for his Ph.D. Fellowship (grant number: 1013150). The authors thank Luciane M. Colla (University of Passo Fundo, Brazil) for kindly providing the Spirulina platensis microalgae strain. Furthermore, the authors thank Cristina González-Fernández (Biotechnological Processes Unit, IMDEA Energy, Spain) for her reviews and comments on this manuscript.

Conflicts of Interest

The authors declare no conflict of interest.

Sample Availability

Samples of the compounds are available from the authors.

References

  1. Velazquez-Lucio, J.; Rodríguez-Jasso, R.M.; Colla, L.M.; Sáenz-Galindo, A.; Cervantes-Cisneros, D.E.; Aguilar, C.N.; Fernandes, B.D.; Ruiz, H.A. Microalgal biomass pretreatment for bioethanol production: A review. Biofuel Res. J. 2018, 5, 780–791. [Google Scholar] [CrossRef]
  2. Aparicio, E.; Rodríguez-Jasso, R.M.; Pinales-Márquez, C.D.; Loredo-Treviño, A.; Robledo-Olivo, A.; Aguilar, C.N.; Kostas, E.T.; Ruiz, H.A. High-pressure technology for Sargassum spp. biomass pretreatment and fractionation in the third generation of bioethanol production. Bioresour. Technol. 2021, 329, 124935. [Google Scholar] [CrossRef]
  3. Ruiz, H.A.; Conrad, M.; Sun, S.N.; Sanchez, A.; Rocha, G.J.; Romaní, A.; Castro, E.; Torres, A.; Rodríguez-Jasso, R.M.; Andrade, L.P.; et al. Engineering aspects of hydrothermal pretreatment: From batch to continuous operation, scale-up and pilot reactor under biorefinery concept. Bioresour. Technol. 2020, 299, 122685. [Google Scholar] [CrossRef]
  4. Rosero-Chasoy, G.; Rodríguez-Jasso, R.M.; Aguilar, C.N.; Buitrón, G.; Chairez, I.; Ruiz, H.A. Growth kinetics and quantification of carbohydrate, protein, lipids, and chlorophyll of Spirulina platensis under aqueous conditions using different carbon and nitrogen sources. Bioresour. Technol. 2022, 346, 126456. [Google Scholar] [CrossRef] [PubMed]
  5. Kostas, E.T.; Adams, J.M.M.; Ruiz, H.A.; Durán-Jiménez, G.; Lye, G.J. Macroalgal biorefinery concepts for the circular bioeconomy: A review on biotechnological developments and future perspectives. Renew. Sustain. Energy Rev. 2021, 151, 111553. [Google Scholar] [CrossRef]
  6. Saxena, R.; Rosero-Chasoy, G.; Aparicio, E.; Lara, A.; Loredo, A.; Robledo, A.; Kostas, E.T.; Rodríguez-Jasso, R.M.; Ruiz, H.A. Third generation biorefineries using micro-macro-alge. In Production of Biofuels and Chemicals from Sustainable Recycling of Organic Solid Waste; Fang, Z., Smith, R.L., Jr., Xu, L., Eds.; Springer: Singapore, 2022; pp. 373–411. [Google Scholar]
  7. Rosero-Chasoy, G.; Rodríguez-Jasso, R.M.; Aguilar, C.N.; Buitrón, G.; Chairez, I.; Ruiz, H.A. Microbial co-culturing strategies for the production high value compounds, a realiable framework towards sustainable biorefinery implementation—An overview. Bioresour. Technol. 2021, 321, 124458. [Google Scholar] [CrossRef]
  8. Rempel, A.; Machado, T.; Treichel, H.; Colla, E.; Margarites, A.C.; Colla, L.M. Saccharification of Spirulina Platensis biomass using free and immobilized amylolytic enzymes. Bioresour. Technol. 2018, 263, 163–171. [Google Scholar] [CrossRef] [PubMed]
  9. Ruiz, H.A.; Rodriguez, R.M.; Fernandes, B.D.; Vicente, A.; Teixeira, A. Hydrothermal processing, as an alternative for upgrading agriculture residues and marine biomass according to the biorefinery concept: A review. Renew. Sustain. Energy Rev. 2013, 21, 35–51. [Google Scholar] [CrossRef]
  10. Singh, P.; Guldhe, A.; Kumari, S.; Rawat, I.; Bux, F. Investigation of combined effect of nitrogen, phosphorus and iron on lipid productivity of microalgae Ankistrodesmus Falcatus KJ671624 using response surface methodology. Biochem. Eng. J. 2015, 94, 22–29. [Google Scholar] [CrossRef]
  11. Qin, L.; Alam, M.A.; Wang, Z. Open pond culture systems and photobioreactors for microalgal biofuel production. In Microalgae Biotechnology for Development of Biofuel and Wastewater Treatment; Springer: Singapore, 2019; pp. 45–74. [Google Scholar]
  12. Tamburic, B.; Evenhuis, C.R.; Crosswell, J.R.; Ralph, P.J. An empirical process model to predict microalgal carbon rates in photobioreactors. Algal Res. 2018, 31, 334–346. [Google Scholar] [CrossRef]
  13. Costa, J.A.V.; Colla, L.M.; Filho, P.D.; Kabke, K.; Weber, A. modelling of Spirulina Platensis growth in fresh water using response surface methodology. World J. Microbiol. Biotechnol. 2002, 18, 603–607. [Google Scholar] [CrossRef]
  14. Vieira Costa, J.A.; Colla, L.M.; Duarte Filho, P.F. Improving Spirulina Platensis biomass yield using a fed-batch process. Bioresour. Technol. 2004, 92, 237–241. [Google Scholar] [CrossRef]
  15. Ansari, F.A.; Singh, P.; Guldhe, A.; Bux, F. Microalgal cultivation using aquaculture wastewater: Integrated biomass generation and nutrient remediation. Algal Res. 2017, 21, 169–177. [Google Scholar] [CrossRef]
  16. Lichtenthaler, H.K.; Buschmann, C. Chlorophylls and carotenoids: Measurement and characterization by UV-VIS spectroscopy. Curr. Protoc. Food Anal. Chem. 2001, 1, F4.3.1–F4.3.8. [Google Scholar] [CrossRef]
  17. Sarkar, S.; Manna, M.S.; Bhowmick, T.K.; Gayen, K. Extraction of chlorophylls and carotenoids from dry and wet biomass of isolated Chlorella Thermophila: Optimization of process parameters and modelling by artificial neural network. Process Biochem. 2020, 96, 58–72. [Google Scholar] [CrossRef]
  18. Mata, S.N.; de Souza Santos, T.; Cardoso, L.G.; Andrade, B.B.; Duarte, J.H.; Costa, J.A.V.; Oliveira de Souza, C.; Druzian, J.I. Spirulina sp. LEB 18 cultivation in a raceway-type bioreactor using wastewater from desalination process: Production of carbohydrate-rich biomass. Bioresour. Technol. 2020, 311, 123495. [Google Scholar] [CrossRef]
  19. Julianti, E.; Susanti; Singgih, M.; Neti Mulyani, L. Optimization of extraction method and characterization of phycocyanin pigment from Spirulina Platensis. J. Math. Fundam. Sci. 2019, 51, 168–176. [Google Scholar] [CrossRef]
  20. Bennett, A.; Bogobad, L. Complementary chromatic adaptation in a filamentous blue-green Aaga. J. Cell Biol. 1973, 58, 419–435. [Google Scholar] [CrossRef]
  21. Hernández, D.; Riaño, B.; Coca, M.; García-González, M.C. Saccharification of carbohydrates in microalgal biomass by physical, chemical and enzymatic pretreatments as a previous step for bioethanol production. Chem. Eng. J. 2015, 262, 939–945. [Google Scholar] [CrossRef]
  22. Waghmare, A.G.; Salve, M.K.; LeBlanc, J.G.; Arya, S.S. Concentration and characterization of microalgae proteins from Chlorella Pyrenoidosa. Bioresour. Bioprocess. 2016, 3, 16. [Google Scholar] [CrossRef]
  23. Dreywood, R. Qualitative test for carbohydrate material. Ind. Eng. Chem. Anal. Ed. 1946, 18, 499. [Google Scholar] [CrossRef]
  24. Loewus, F.A. Improvement in Anthrone method for determination of carbohydrates errors in volumetric analysis arising from adsorption. Anal. Chem. 1952, 24, 219. [Google Scholar] [CrossRef]
  25. Mishra, S.K.; Suh, W.I.; Farooq, W.; Moon, M.; Shrivastav, A.; Park, M.S.; Yang, J.W. Rapid quantification of microalgal lipids in aqueous medium by a simple colorimetric method. Bioresour. Technol. 2014, 155, 330–333. [Google Scholar] [CrossRef] [PubMed]
  26. Anand, V.; Kashyap, M.; Sharma, M.P.; Bala, K. Impact of hydrogen peroxide on microalgae cultivated in varying salt-nitrate-phosphate conditions. J. Environ. Chem. Eng. 2021, 9, 105814. [Google Scholar] [CrossRef]
  27. Knight, J.A.; Anderson, S.; Rawle, J.M. Chemical basis of the sulfo-phospho-vanillin reaction for estimating total serum lipids. Clin. Chem. 1972, 18, 199–202. [Google Scholar] [CrossRef] [PubMed]
  28. Eze, C.N.; Ogbonna, I.O.; Aoyagi, H.; Ogbonna, J.C. Comparison of growth, protein and carotenoid contents of some freshwater microalgae and the effects of urea and cultivation in a photobioreactor with reflective broth circulation guide on Desmodesmus Subspicatus LC172266. Braz. J. Chem. Eng. 2022, 39, 23–33. [Google Scholar] [CrossRef]
  29. Rausch, T. The estimation of micro-algal protein content and its meaning to the evaluation of algal biomass. Hydrobiologia 1981, 78, 237–251. [Google Scholar] [CrossRef]
  30. Bradford, M.M. A Rapid and sensitive method for the quantitation of microgram quantities of protein utilizing the principle of protein-dye binding. Anal. Biochem. 1976, 72, 248–254. [Google Scholar] [CrossRef]
  31. Slocombe, S.P.; Ross, M.; Thomas, N.; McNeill, S.; Stanley, M.S. A Rapid and general method for measurement of protein in micro-algal biomass. Bioresour. Technol. 2013, 129, 51–57. [Google Scholar] [CrossRef]
  32. Peter, A.P.; Chew, K.W.; Koyande, A.K.; Yuk-Heng, S.; Ting, H.Y.; Rajendran, S.; Munawaroh, H.S.H.; Yoo, C.K.; Show, P.L. Cultivation of Chlorella Vulgaris on dairy waste using vision imaging for biomass growth monitoring. Bioresour. Technol. 2021, 341, 125892. [Google Scholar] [CrossRef]
  33. Lu, W.; Liu, S.; Lin, Z.; Lin, M. Enhanced microalgae growth for biodiesel production and nutrients temoval in raw swine wastewater by carbon sources supplementation. Waste Biomass Valoriz. 2021, 12, 1991–1999. [Google Scholar] [CrossRef]
  34. Andrade, B.B.; Cardoso, L.G.; de Jesus Assis, D.; Costa, J.A.V.; Druzian, J.I.; da Cunha Lima, S.T. Production and characterization of Spirulina Sp. LEB 18 cultured in reused Zarrouk’s medium in a raceway-type Bioreactor. Bioresour. Technol. 2019, 284, 340–348. [Google Scholar] [CrossRef] [PubMed]
  35. Kandasamy, S.; Nagarajan, P. Optimization of growth conditions for carotenoid production from Spirulina Platensis (Geitler). Int. J. Curr. Microbiol. Appl. Sci. 2013, 2, 325–328. [Google Scholar]
  36. Vonshak, A. Spirulina: Growth, physiology and biochemistry. In Spirulina Platensis Arthrospira; Vonshak, A., Ed.; CRC Press: Boca Raton, FL, USA, 1997; pp. 43–65. [Google Scholar] [CrossRef]
  37. Huang, Y.; Lou, C.; Luo, L.; Wang, X.C. Insight into nitrogen and phosphorus coupling effects on mixotrophic Chlorella Vulgaris growth under stably controlled nutrient conditions. Sci. Total Environ. 2021, 752, 141747. [Google Scholar] [CrossRef]
  38. Arbib, Z.; Ruiz, J.; Álvarez-Díaz, P.; Garrido-Pérez, C.; Barragan, J.; Perales, J.A. Photobiotreatment: Influence of nitrogen and phosphorus ratio in wastewater on growth kinetics of Scenedesmus Obliquus. Int. J. Phytoremediat. 2013, 15, 774–788. [Google Scholar] [CrossRef]
  39. Cardoso, L.G.; Lombardi, A.T.; de Jesus Silva, J.S.; Lemos, P.V.F.; Costa, J.A.V.; de Souza, C.O.; Druzian, J.I.; Chinalia, F.A. Scaling-up production of Spirulina Sp. LEB18 grown in aquaculture wastewater. Aquaculture 2021, 544, 737045. [Google Scholar] [CrossRef]
  40. Paes, C.R.P.S.; Faria, G.R.; Tinoco, N.A.B.; Castro, D.J.F.A.; Barbarino, E.; Lourenço, S.O. Growth, nutrient uptake and chemical composition of Chlorella Sp. and Nannochloropsis Oculata under nitrogen starvation. Lat. Am. J. Aquat. Res. 2016, 44, 275–292. [Google Scholar] [CrossRef]
  41. Cardoso, L.G.; Duarte, J.H.; Andrade, B.B.; Lemos, P.V.F.; Costa, J.A.V.; Druzian, J.I.; Chinalia, F.A. Spirulina sp. LEB 18 cultivation in outdoor pilot scale using aquaculture wastewater: High biomass, carotenoid, lipid and carbohydrate production. Aquaculture 2020, 525, 735272. [Google Scholar] [CrossRef]
  42. Ajayan, K.V.; Selvaraju, M.; Thirugnanamoorthy, K. Enrichment of chlorophyll and phycobiliproteins in Spirulina Platensis by the use of reflector light and nitrogen sources: An in-vitro Study. Biomass Bioenergy 2012, 47, 436–441. [Google Scholar] [CrossRef]
  43. García-López, D.A.; Olguín, E.J.; González-Portela, R.E.; Sánchez-Galván, G.; De Philippis, R.; Lovitt, R.W.; Llewellyn, C.A.; Fuentes-Grünewald, C.; Parra Saldívar, R. A novel two-phase bioprocess for the production of Arthrospira (Spirulina) Maxima LJGR1 at pilot plant scale during different seasons and for phycocyanin induction under controlled conditions. Bioresour. Technol. 2020, 298, 122548. [Google Scholar] [CrossRef]
  44. Werlang, E.B.; Julich, J.; Muller, M.V.G.; de Farias Neves, F.; Sierra-Ibarra, E.; Martinez, A.; Schneider, R. Bioethanol from hydrolyzed Spirulina (Arthrospira Platensis) biomass using ethanologenic bacteria. Bioresour. Bioprocess. 2020, 7, 27. [Google Scholar] [CrossRef]
  45. Liu, Q.; Yao, C.; Sun, Y.; Chen, W.; Tan, H.; Cao, X.; Xue, S.; Yin, H. Production and structural characterization of a new type of polysaccharide from nitrogen-limited Arthrospira Platensis cultivated in outdoor industrial-scale open raceway ponds. Biotechnol. Biofuels 2019, 12, 131. [Google Scholar] [CrossRef] [PubMed]
  46. Ho, S.H.; Huang, S.W.; Chen, C.Y.; Hasunuma, T.; Kondo, A.; Chang, J.S. Characterization and optimization of carbohydrate production from an indigenous microalga Chlorella Vulgaris FSP-E. Bioresour. Technol. 2013, 135, 157–165. [Google Scholar] [CrossRef] [PubMed]
  47. Rehman, Z.U.; Anal, A.K. Enhanced lipid and starch productivity of microalga (Chlorococcum Sp. TISTR 8583) with nitrogen limitation following effective pretreatments for biofuel production. Biotechnol. Rep. 2019, 21, e00298. [Google Scholar] [CrossRef] [PubMed]
  48. Campenni’, L.; Nobre, B.P.; Santos, C.A.; Oliveira, A.C.; Aires-Barros, M.R.; Palavra, A.M.F.; Gouveia, L. Carotenoid and lipid production by the autotrophic microalga Chlorella Protothecoides under nutritional, salinity, and luminosity stress conditions. Appl. Microbiol. Biotechnol. 2013, 97, 1383–1393. [Google Scholar] [CrossRef] [PubMed]
  49. Soni, R.A.; Sudhakar, K.; Rana, R.S. Spirulina—From growth to nutritional product: A review. Trends Food Sci. Technol. 2017, 69, 157–171. [Google Scholar] [CrossRef]
Figure 1. (a) Spirulina platensis LEB-52 cultivation in cultivation chamber equipped with light sources, (b) Inoculum grew in Zarrouk’s medium, (c) Spirulina platensis cultivation in different concentrations of nitrogen and phosphorous in Zarrouk’s medium, and (d) large-scale cultivation after optimized best parameter and medium condition with enriching carbohydrate biomass.
Fermentation 08 00374 g001
Figure 2. Shows the cell concentration curves of Spirulina platensis LEB-52 under different concentrations of nitrogen (NaNO3) and phosphorous (K2HPO4) at the flask scale where A to G are treatments with different nitrogen (N) concentrations and phosphorous (P) in Zarrouk’s medium. N:K (g/L), A (Control), B (1.25:0.3), C (1.25:0.1), D (0.5:0.3), E (0.5:0.1), F (0.1:0.1) and G (0:0).
Fermentation 08 00374 g002
Figure 3. Shows the biomass concentration curves of Spirulina platensis LEB-52 after defining the most favorable condition by considering the carbohydrate content of biomass at a large scale in a 10.1 L bubble photobioreactor where G is the nitrogen and phosphorous ratio in g/L in Zarrouk’s medium.
Fermentation 08 00374 g003
Figure 4. Morphological structure of Spirulina platensis under microscopic view on 40×.
Fermentation 08 00374 g004
Figure 5. The concentration of pigments (Chlorophyll-a, Chlorophyll-b, Carotenoids, and phycocyanin) of Spirulina platensis LEB-52 cultivated in Zarrouk’s medium, without nitrogen and phosphorous (G), and control (standard medium) in a bubble photobioreactor with a volume of 10.1 L. The ratio shows nitrogen and phosphorous in g/L.
Fermentation 08 00374 g005
Figure 6. Total carbohydrates present in Spirulina platensis under different concentrations of nitrogen and phosphorous in Zarrouk’s medium. Mean ± standard deviation. All treatments (A-G) showed significant differences between the values with a p < 0.05 confidence level. CS is commercial Spirulina (purchased). Ratio valve of nitrogen and phosphorous in g/L.
Fermentation 08 00374 g006
Table 1. Different concentrations of nitrogen (NaNO3) and phosphorous (K2HPO4) in Zarrouk’s medium.
TreatmentABCDEFG
Chemicalg/L
NaHCO316.8016.8016.8016.8016.8016.8016.80
NaNO32.501.251.250.500.500.100.00
K2HPO40.500.300.100.300.100.100.00
K2SO41.001.001.001.001.001.001.00
NaCl1.001.001.001.001.001.001.00
MgSO4.7H2O0.200.200.200.200.200.200.20
CaCl2.2H2O0.040.040.040.040.040.040.04
FeSO4.7H2O0.010.010.010.010.010.010.01
EDTA0.080.080.080.080.080.080.08
The letters (A–G) represent the treatments in the microalgae culture medium.
Table 2. Representation of ANOVA of carbohydrate percentage in treatment of nutrient stress medium.
Source of VariationDegrees of FreedomSum SquaresMean SquaresF-Testp-Value
Treatment68312.471385.411674.520.00
Error1411.580.82
Total208324.06
Table 3. Maximum biomass yield (Xmax), specific growth rate (μ), maximum productivity (Pmax) and doubling time (Dt) of Spirulina platensis LEB-52 in selected favorable conditions of Zarrouk medium in 14-day cultivation.
TreatmentXmax (g/L) Pmax (g/L/d)μ (1/d)Dt
Control0.90 ± 0.000.89 ± 0.000.04 ± 0.0015.93 ± 0.98
G0.93 ± 0.000.92 ± 0.000.07 ± 0.009.32 ± 0.40
Mean ± standard deviation.
Table 4. Total carbohydrate, lipid, and protein determination of Spirulina platensis LEB-52 in the selected favorable condition from statistical analysis in Zarrouk medium in a 14-day cultivation.
TreatmentCarbohydrates Content
% (w/w)
Lipid
(μg/mg)
Protein
(μg/mL)
Control16.07 ± 0.0717.87 ± 0.3340.35 ± 1.05
G (0:0)74.43 ± 0.6326.25 ± 0.4616.84 ± 1.58
Commercial Spirulina15.36 ± 0.62--
Mean ± standard deviation.
Publisher’s Note: MDPI stays neutral with regard to jurisdictional claims in published maps and institutional affiliations.

