Article

Kinetic Model for Enzymatic Hydrolysis of Cellulose from Pre-Treated Rice Husks

1
Departement of Chemical Engineering, Faculty of Engineering, Universitas Sriwijaya, Inderalaya 30662, Sumatera Selatan, Indonesia
2
Biofuel Research Group, Universitas Sriwijaya, Inderalaya 30662, Sumatera Selatan, Indonesia
*
Author to whom correspondence should be addressed.
Fermentation 2022, 8(9), 417; https://doi.org/10.3390/fermentation8090417
Submission received: 19 July 2022 / Revised: 17 August 2022 / Accepted: 19 August 2022 / Published: 23 August 2022

Abstract

:
Rice husks contain cellulose as a raw material for manufacturing second-generation bioethanol. Cellulose from pre-treated rice husks was converted into reducing sugars through enzymatic hydrolysis using enzymes derived from Aspergillus niger. This study aims to determine the kinetics of enzymatic hydrolysis at enzyme concentrations of 10, 15, and 20% (v/w) and hydrolysis times of 5, 10, 15, 20, and 25 h. The results showed that cellulose was hydrolyzed to form reducing sugars. The CMCase activity and FPase activity reached 548.940 and 314.892 U mL−1, respectively, much higher than most previous reports on this genus. From the calculation of the reaction rate using the Michaelis–Menten kinetic model, the value of the Michaelis constant ranges from 0.001 to 0.0007, and the maximum rate is 1.3 × 10⁻⁷ to 2.7 × 10⁻⁷ Mol L−1 s−1. The highest reducing sugar concentration was obtained (1.80 g L−1) at an enzyme concentration of 20% (v/w) and a hydrolysis time of 25 h.

1. Introduction

Indonesia produces large amounts of rice husks, particularly in South Sumatra, which produces 2.743 million tons of rice and about 549 tons of waste rice husks [1]. Rice husks are a by-product of the rice industry [2]. Agricultural residues such as corn stover, rice straw, and wheat and rice husks contain 30–40% cellulose, 20–30% hemicellulose, and 10–20% lignin, depending on the plant species and type, climate, soil conditions, and fertilization procedures [3,4,5].
Different polysaccharides consist of cellulose and hemicellulose, which can be decomposed into glucose and other reducing sugars with the help of enzymes [6]. Cellulose is the most abundant organic compound on earth and accounts for about 30–60% of the total dry mass of lignocellulose [4,7,8]. Therefore, the concentration of this glucose monomer has great potential for bioethanol production. On the other hand, hemicellulose has a slightly amorphous structure with a low molecular weight [9] and serves as a supporting material in the cell wall and an adhesive between individual cells on the plant’s stem.
Meanwhile, lignin consists of tissues that strengthen the bonds between hemicellulose fibers and cellulose, which are difficult to separate. Lignin can inhibit enzymatic hydrolysis and must be eliminated before cellulose hydrolysis [10]. Lignin removal can be achieved physically, chemically, or biologically through pre-treatment [5]. Previously, Novia et al. reported that ammonia pre-treatment eliminated lignin [11]. They observed the optimal glucose result with treatment at 100 °C under 20% NH3 for 5 h. Ammonia compounds have high selectivity for lignin and retain carbohydrates in their original form [12]. H2O2 solutions can damage lignin in biomass [13] and improve the enzymatic digestion of primary and secondary residues of agricultural products [14]. In a previous study, Novia et al. investigated the kinetics of lignin removal from rice husks pre-treated with aqueous ammonia hydrogen peroxide [15]. However, they did not calculate the kinetics of the enzymatic hydrolysis of cellulose obtained from pre-treated rice husks.
Aspergillus niger produces the cellulase enzyme, which reduces the glycosidic bonds of cellulose at the reducing or non-reducing end [16]. β-glucosidase hydrolyzes cellulose materials and produces glucose in the liquid phase, which is used as a substrate for industrial fermentation [17]. In addition, β-1,4-glucosidase is induced in large quantities from this fungus by inoculation and isolation at optimum temperature conditions of 27–35 °C [18]. Cutting bond chains using cellulase enzymes involves endoglucanase, exoglucanase, and β–glucosidase [19]. To reduce the cost of enzyme production, the pre-treatment of lignocellulose should allow for more efficient and cost-effective hydrolysis [20,21,22]. Efficient and comprehensive use of enzymes is also crucial. Enzymatic kinetics must accurately measure the conversion of raw materials and the hydrolytic rate and determine the reason for the slowdown in the rate during hydrolysis [21]. To improve the conversion efficiency and lower the costs, it is necessary to obtain experimental data as a basis for perfect enzymatic hydrolysis.
The kinetic models predict substrate degradation, biomass growth, and product formation [23]. The objective of kinetic models is to simulate biomass growth, substrate utilization, and product formation processes while considering their time dependence. Therefore, a system of ordinary differential equations derived from a mass balance equation represents the processes. Under suitable initial conditions and given kinetic and stoichiometric parameters, these equations can be solved by numerical integrations. Michaelis–Menten kinetics is a widely recognized rate representation obtained from elementary reactions. It describes enzyme kinetics when the substrate concentration is considerably more significant than the enzyme concentration. Recently, Bisswanger provided a comprehensive analysis of the Michaelis–Menten prediction and its correlation with the fundamental dynamic model of elementary reactions [24]. Simplicity kinetics is an extension of Michaelis–Menten models [25], which relates to arbitrary reaction stoichiometries. It is derived from a non-structured enzyme mechanism assuming rapid equilibrium among the enzyme, its substrates, and its products [26]. The simplicity of its kinetics differs from previous rate laws since it is saturable and can accommodate concentrations close to zero, a condition that creates problems for kinetics comprising logarithmic functions [27].
According to the classical Michaelis–Menten theory of enzymatic catalysis, the substrate (cellulose) generates the end-product (reducing sugars) by forming an enzyme–substrate complex. The formation rate constant k1, breakdown rate constant k−1, and formation rate constant k2 of end-product P characterize the formation reaction of the enzyme–substrate complex. The following chemical reaction equation describes such a mechanism:
S + E k 1 k 1   E S k 2   E + P
The Michaelis–Menten model approach calculates the kinetics of the enzymatic hydrolysis rate using the following equations [24]:
d [ S ] d t = k 1 [ S ] [ E ] + k 1 [ E S ]
d [ E ] d t = k 1 [ S ] [ E ] + k 1 [ E S ] + k 2 [ E S ]
d [ E S ] d t = k 1 [ S ] [ E ] ( k 1 + k 2 ) [ E S ]
d [ P ] d t = k 2 [ E S ] = v
where v is the formation rate of straight-sided products with the number of enzyme–substrate complex being ES. The ES depends on the concentration of reactants.
d [ E S ] d t = d [ E ] d t = 0
k 1 [ S ] [ E ] = ( k 1 + k 2 ) [ E S ]
while [ E ] 0 = [ E ] + [ E S ] ,
v = d [ P ] d t = k 2 [ E S ] = k 2 [ S ] [ E ] 0 [ S ] + k 1 + k 2 k 1
In this equation, v is the reaction rate and VM is the maximum rate. The Michaelis–Menten relationship and the double inverse coordinates method are used to calculate the initial rate of reducing sugar formation:
K M = k 1 + k 2 k 1
V M = k 2 [ E ] 0
v = d [ S ] d t = V M [ S ] K M + [ S ]
The integration of Equations (8)–(10) results in:
K M   l n [ S ] 0 [ S ] + [ S ] 0 [ S ] = V M · t
[ S ] 0     [ S ] ln [ S ] 0 [ S ] = K M + k 2 · E 0 t ln [ S ] 0 [ S ]
where
[P] = [S]0 − [S]
[P] is equal to the concentration of the product at time t, and [P] is the con-centration of the final product of the reaction at t = ∞. At the end of the reaction, [S]0 is assumed to equal [P].
[ P ] ln [ P ] [ P ] [ P ] = K M + k 2 · E 0 t ln [ P ] [ P ] [ P ]
The Michaelis–Menten kinetic model uses hydrolysis and incorporates the reaction conditions and the product inhibition effect. Experimental data under established conditions have validated the Michaelis–Menten model. A semi-mechanistic approach used this model with pseudo-homogeneous parameters. Although the reaction occurs in heterogeneous systems, the substrate is a soluble reactant. Many publications [25,26] have proven this classical model’s validity for determining the initial reaction speed and how the reaction rate increases. Miao et al. [25] used Avicel hydrolysis data from T. reesei Cel7A on 24 other substrate–enzyme ratios to validate eight Michaelis–Menten models. Models involving competitive inhibition by cellobiose were the most suitable for their data. Their results also showed that the rate of decrease was insignificant compared to substrate depletion and competitive inhibition. These include nonproductive cellulase binding, parabolic inhibition, and enzyme deactivation.
Several researchers have studied the enzymatic hydrolysis kinetics of biomass, in particular with coffee silver [27], bagasse [28,29], sugarcane straw [30], shredded seed shells of Colocynthis Vulgaris [31], mixed shells [32], wheat straw [33], wild ryegrass creeping [34], Miscanthus and wheat clots [35], and corn stover [36]. Another study investigated the enzymatic hydrolysis kinetics of NaOH pre-treated rice [37]. However, there are no documented studies on the Michaelis–Menten model to investigate the enzymatic hydrolysis of pre-treated rice husks with H2O2-NH4OH. Therefore, this study aims to determine the enzymatic hydrolysis kinetics of cellulose from rice husks using a semi-mechanistic model. We used the integrated Michaelis–Menten equation to examine the kinetics of the enzymatic hydrolysis of cellulose from rice husks. The statistical, theoretical, and experimental data manipulation confirmed the mathematical model’s adequacy.

2. Materials and Methods

Rice husk samples were collected from Sakatiga Indralaya, Ogan Ilir, South Sumatra, then dried in the sun for 1 day and reduced to 40 mesh. The chemicals used for pre-treatment and hydrolysis were from Merck (Indonesia). Aspergillus niger was obtained from the Microbial March Gallery, Indonesia. The culture was routinely maintained for 4–6 days at 30 °C on a potato dextrose agar plate. The harvested spores were suspended in distilled water to achieve a final concentration of 1 × 10⁶ spores mL−1.

2.1. H2O2–Aqueous Ammonia Pretreatment (Previous Author Modification)

In total, 200 g of rice hull was put into a glass beaker (covered with aluminum foil), and then a 3% solution of H2O2 (1:10) was added and heated to a temperature of 85 °C for 6 h at a rate of 150 RPM. The slurry, which had a pH of 11.5, was separated using a vacuum filter and washed with distilled water. Next, the sample was treated with aqueous ammonia with a concentration of 20% for 5 h at 100 °C. The solution was washed with distilled water and filtered through a vacuum filter. Each experiment was repeated three times under the same conditions [15].

2.2. Cellulase Enzyme Preparation from Aspergillus niger (Modification of Previous Studies)

A 100 mL liquid medium consisting of 12.5% sucrose, 0.25% (NH4)2SO4, and 0.2% KH2PO4 was arranged by adjusting the liquid pH to 3. An autoclave was used to sterilize both liquids and instruments. Aspergillus niger spores were collected on PDA media with the help of a cork borer and were then transferred to a liquid medium and incubated at 30 °C for 24 h. Then, 80 mL of deionized water with a pH of 5 was added to 20 g of pre-treated rice hull, 0.03 g of urea, 0.005 g of MgSO4·7H2O, and 0.0023 g of KH2PO4. The medium was inoculated with 10 mL of the prepared inoculum. The flask was incubated at 30 °C for 96 h. The fermented product was extracted with 100 mL of deionized water and shaken at 150 RPM for 1 h. The sample was centrifuged at 4000 RPM for 30 min at 4 °C. The crude enzyme solution was used for hydrolysis and evaluated for endo glucanase and exoglucanase activity [11].

2.3. Enzymatic Hydrolysis

The enzymatic hydrolysis of pre-treated rice husk was performed as previously described with modifications [15]. A total of 20 g of pre-treated rice husks was introduced into a 250mL Erlenmeyer flask, and a crude cellulase enzyme from Aspergillus niger was added at a ratio of 1:10 at pH 5. The mixture consisted of crude enzymes at concentrations of 10%, 15%, and 20% (total enzyme fraction in mL per gram of biomass). The Erlenmeyer flasks were equipped with a lid laid out on a hot plate stirrer at 50 °C at a speed of 200 RPM. The hydrolysis time was 5, 10, 15, 20, or 25 h. The sample was cooled and filtered. Each experiment was repeated three times under the same conditions. The enzymatic kinetics were studied using Equation (14).

2.4. Analytical Methods

The composition of the rice hull (cellulose, hemicellulose lignin) before and after treatment was analyzed using the Chesson method [38]. The element composition of untreated and pre-treated samples was examined using a JEOL scanning electron microscope (SEM-EDS) of the JED-2200 SERIES model.
Each cellulase enzyme has a different activity ability; therefore, cellulase activity (U mL−1) means the amount of enzyme required to break down one μmol of cellulose into a reduction in sugars per minute under test conditions [6,39,40]. The activity of the cellulase enzyme was determined quantitatively using a UV–vis spectrophotometer. Enzyme activity has optimal conditions ranging from pH 4.5 to 6.5 [41]. The glucose group reacts with DNS, dinitro salicylic acid, as an oxidizing agent to form 3-amino-5-nitro salicylic acids, resulting in a red color [36]. The activity of this enzyme was measured by colorimetric readings using a spectrophotometer. A UV–vis spectrophotometer with the Bradford method tested levels of cellulase-soluble proteins [10]. The total protein concentration in solution with Coomassie brilliant blue dye was used for colorimetric measurements at 595 nm.

2.4.1. Evaluation of Endoglucanase Activity

About 0.1 mL of cellulase enzyme filtrate and 0.1 mL of 1% CMC solution were combined to form a citrate buffer (pH 4.8) and incubated at 50 °C for 30 min. To complete the reaction, 3 mL of DNS reagent was added, followed by 10 min warming in boiling water (T = 100 °C). After cooling to ambient temperature, the absorbance at 540 nm was recorded. Absorbance values were plotted on a glucose standard curve. Citrate buffer and DNS reactions were employed to generate blanks and evaluate the absorbance zero value, and the absorbance zero point was determined using the citrate buffer and DNS reaction. One unit of CMCase enzyme activity equates to one mole of glucose created per minute based on the glucose released by the cellulase enzyme. The production of 1 mg of glucose per mL after 30 min of incubation was: 1/(30 × 0.180) = 0.185 units, where 0.180 represents glucose (μmol). One CMCase unit (IU mL−1) is equivalent to one mg of glucose multiplied by 0.185 per mL. The experiment was conducted three times for each condition [42].

2.4.2. Evaluation of Exoglucanase Activity

After placing approximately 0.1 mL of cellulase enzyme filtrate into a test tube that contained 1 cm × 6 cm of Whatman No. 1 filter paper (50 mg) and 1 mL of citrate buffer with a pH of 4.8, the mixture was allowed to incubate at a temperature of 50 °C for 30 min. Approximately 3 mL of DNS reagents were fed, and the mixture was then heated for 10 min in boiling water to end the reaction. Furthermore, the absorbance was measured at a wavelength of 540 nm after it had been cooled. The amount of glucose produced per minute was used to calculate the FPase enzyme activity. One unit of FPase activity was equal to one μmole of glucose created per min. If the incubation was for 30 min, 1 mg of glucose produced for every mL was: 1/(30 × 0.180) = 0.185 units, where 0.180 = glucose μmole. This means that Fpase (IU mL−1) = mg glucose × 0.185/mL. The test was carried out three times under each condition [42].
Using a spectrophotometer (Visible-A & ELAB, China) and 3,5-dinitrosalicylic acid (DNS) reagent, the concentration of reducing sugars measured as glucose in the hydrolyzate was calculated. This method reduces DNS by reducing sugar to 3-amino-5-nitrosalicylic acid, which is then measured spectrophotometrically at 540 nm [43]. The absolute error in evaluating the reducing sugar concentration was 0.02 g L−1 in 0.2 to 2.0 g L−1.

3. Results

3.1. Effect of Hydrogen Peroxide–Aqueous Ammonia Pretreatment on the Composition of Rice Husks

The composition of rice husks before and after pre-treatment is presented in Table 1. The percentage composition of the parameters obtained in each pre-treatment shows a significant relationship. For example, pre-treatment with hydrogen peroxide and aqueous ammonia reduced the lignin content from 36.24% to 20.47%. Furthermore, the cellulose content in the rice husk increased from 29.26% to 43.80%. The reduction in the lignin content helps to avoid inhibiting enzymatic hydrolysis. Thus, it can allow enzymes to more easily decompose cellulose into glucose. According to previous research [39], the low content of lignin in substrates can increase enzyme efficiency and microbial activity to reduce enzyme needs. These results align with previous research [40], where the more hemicellulose and cellulose there is, the higher the glucose produced. In addition, pre-treatment hydrogen peroxide and aqueous ammonia increased lignin removal from 37.85% to 55.76%. Furthermore, the cellulose recovery was about 37.55% to 47.68%. High cellulose recovery and proper lignin removal are necessary to achieve effective enzymatic hydrolysis and high glucose concentrations [39].
Table 2 shows that the SEM-EDS analysis confirmed the presence of different components (carbon, oxygen, and silicon). From Table 2, it can be seen that the number of C atoms increased after pre-treatment with H2O2 and aqueous ammonia. This phenomenon indicates an increase in cellulose content in the biomass. On the other hand, after pre-treatment with H2O2 and aqueous ammonia, the number of O and Si atoms was reduced. The reduced silica content in biomass indicates that the delignification process has taken place successfully. Before pretreatment, the lignocellulosic surface is protected from cellulose degradation by silica frames resistant to breakdown [44]. Silica is a problem in industrial processes because it forms insoluble precipitates as a physical barrier to cellulase action [45]. In order to obtain realistic hydrolysis yields from silica-rich biomasses such as rice husks, it is essential to employ effective pretreatments to remove silica, which is solubilized in an alkali medium (pH > 9) [46].

3.2. Characterization of Cellulase Enzyme Extract

The enzyme used in the pretreated rice husk is a crude extract; therefore, the stated measurements aimed to determine their level. The results of the natural enzyme extract showed 80% water and protein content of 4029 mg/mL. These results are reasonably similar to those of other studies [41], which found the highest protein content was 0.3148 mg/mL with 50% water, and the lowest was 0.1054 mg/mL with 20% water. The enzyme cocktail used for saccharification in the current investigation includes endoglucanase (314.892 U mL−1) and exoglucanase activity (548.940 U mL−1). Table 3 compares the activities of crude cellulase enzymes of Aspergillus niger. The cellulase enzyme hydrolyzes cellulose into reducing sugar with a moisture content of 80%. This value is higher than the reported value [47], where the activity of the exoglucanase enzyme is 10.9 U mL−1. In addition, isolating Aspergillus niger on dry leaves produced 230.68 U L−1 exoglucanase and 413.49 U L−1 endoglucanase [48]. The different enzyme activity values are due to the different types and concentrations of biomass used as a substrate source to produce cellulase enzymes. Despite using a crude enzyme, the value of cellulase activity in this study tends to be higher than in the work of Kaur et al. [47]. The concentration of cellular biomass is directly proportional to the enzyme loading.

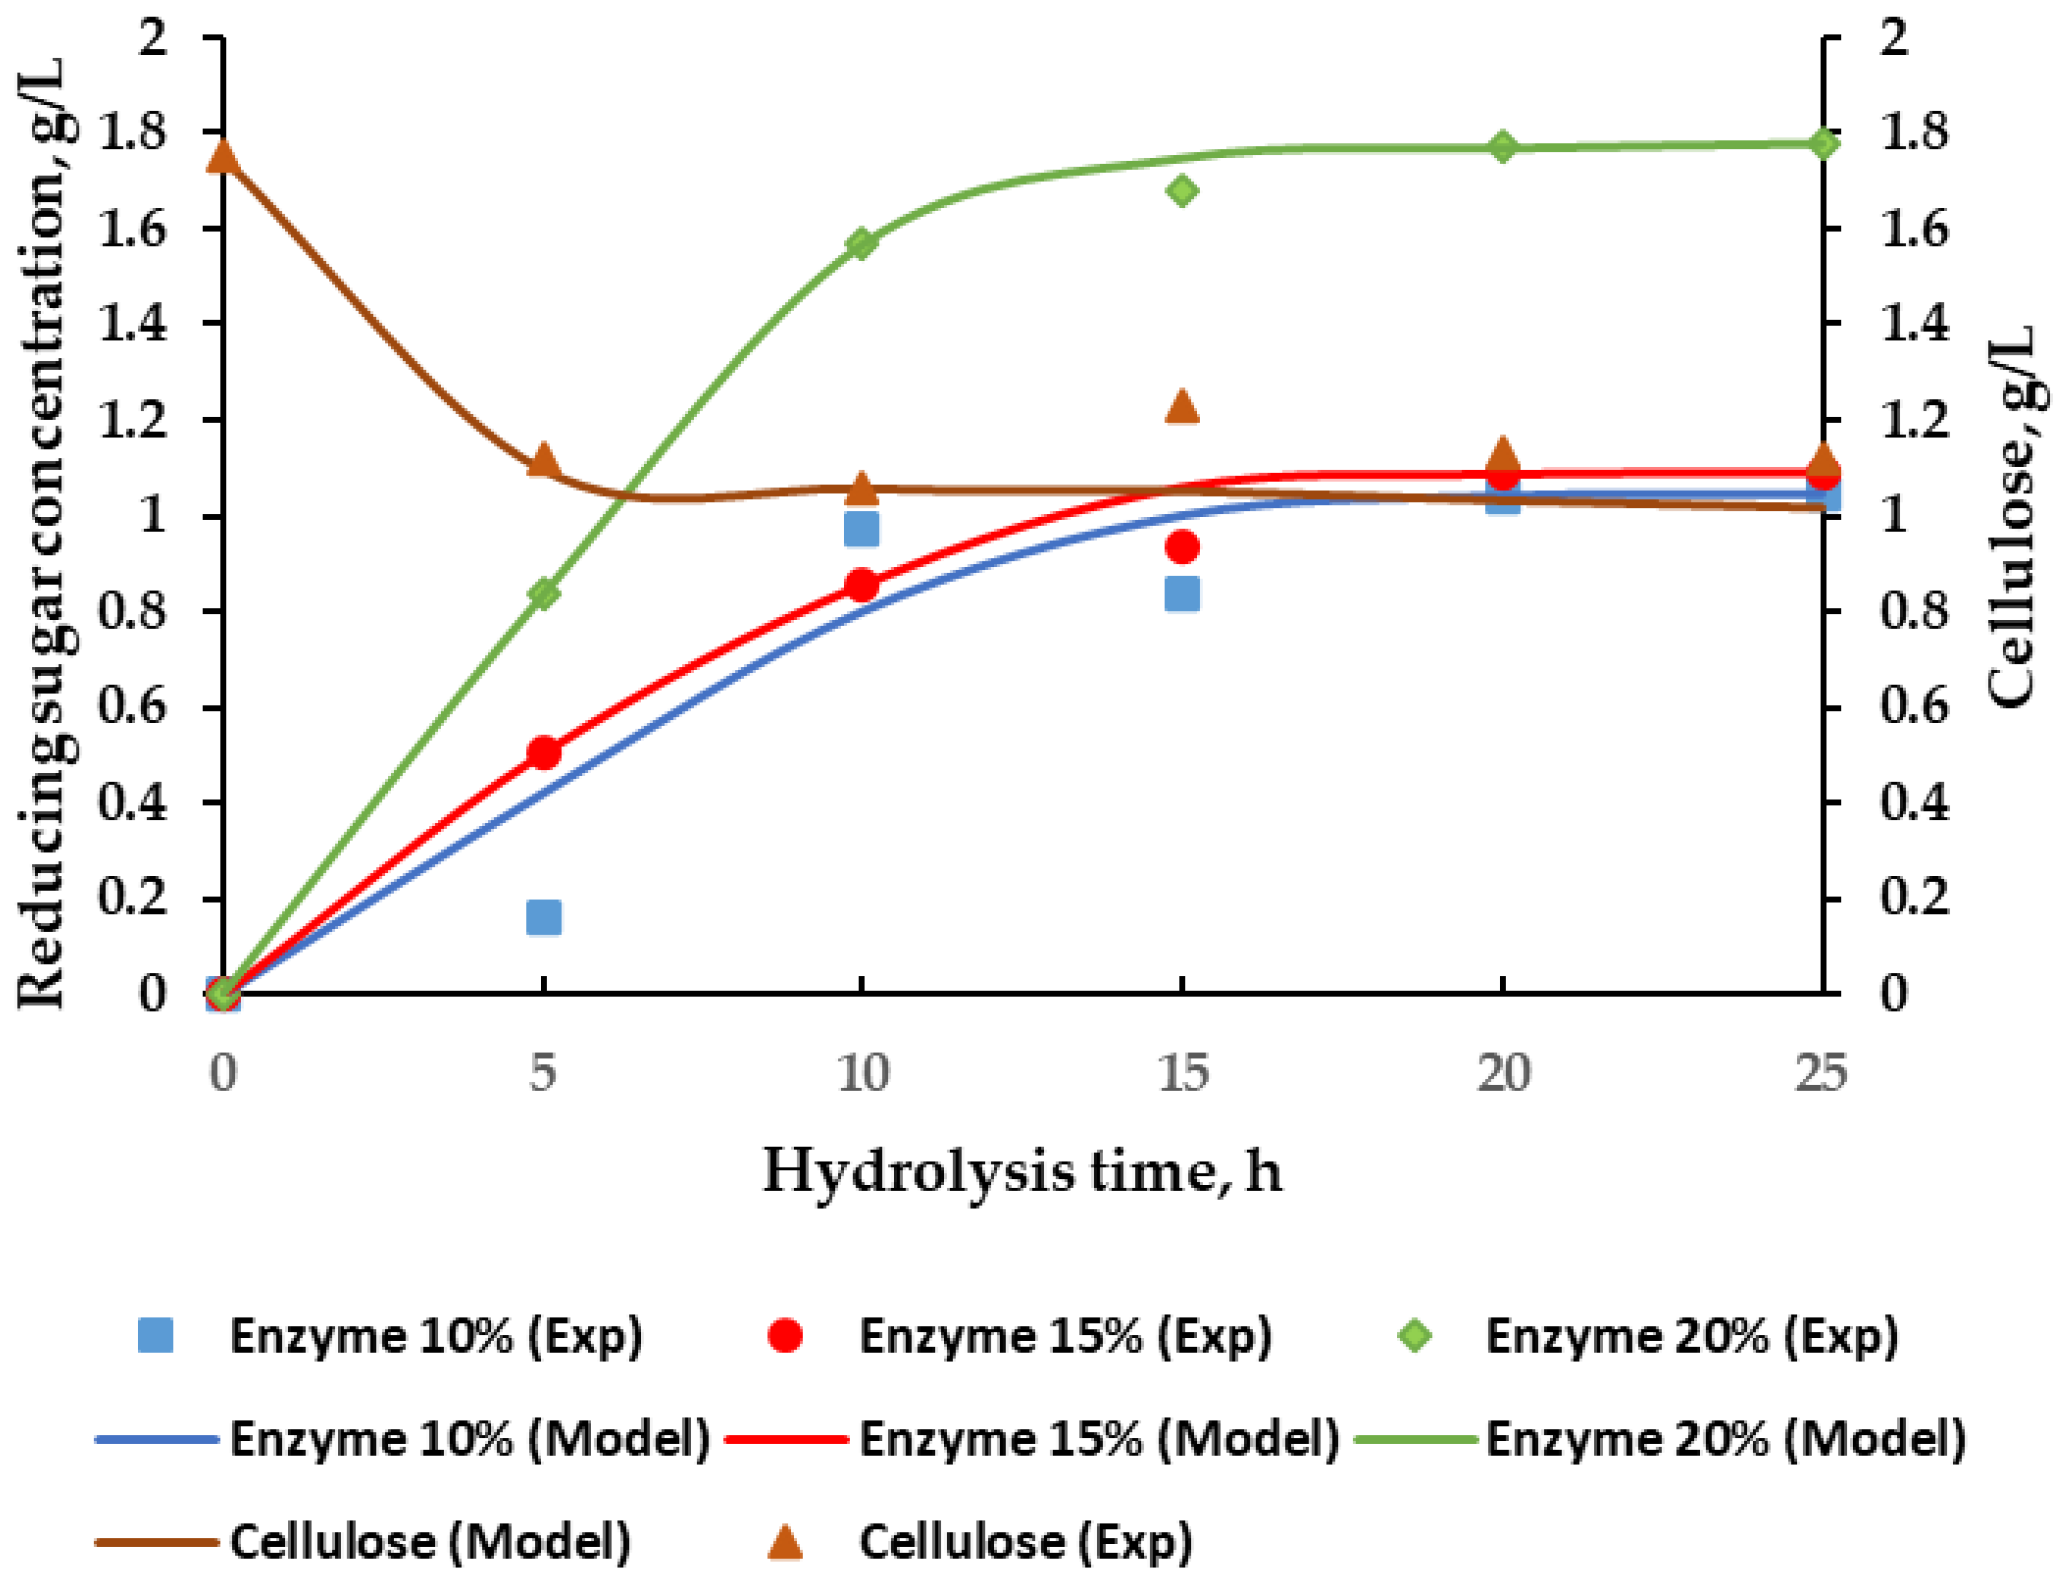
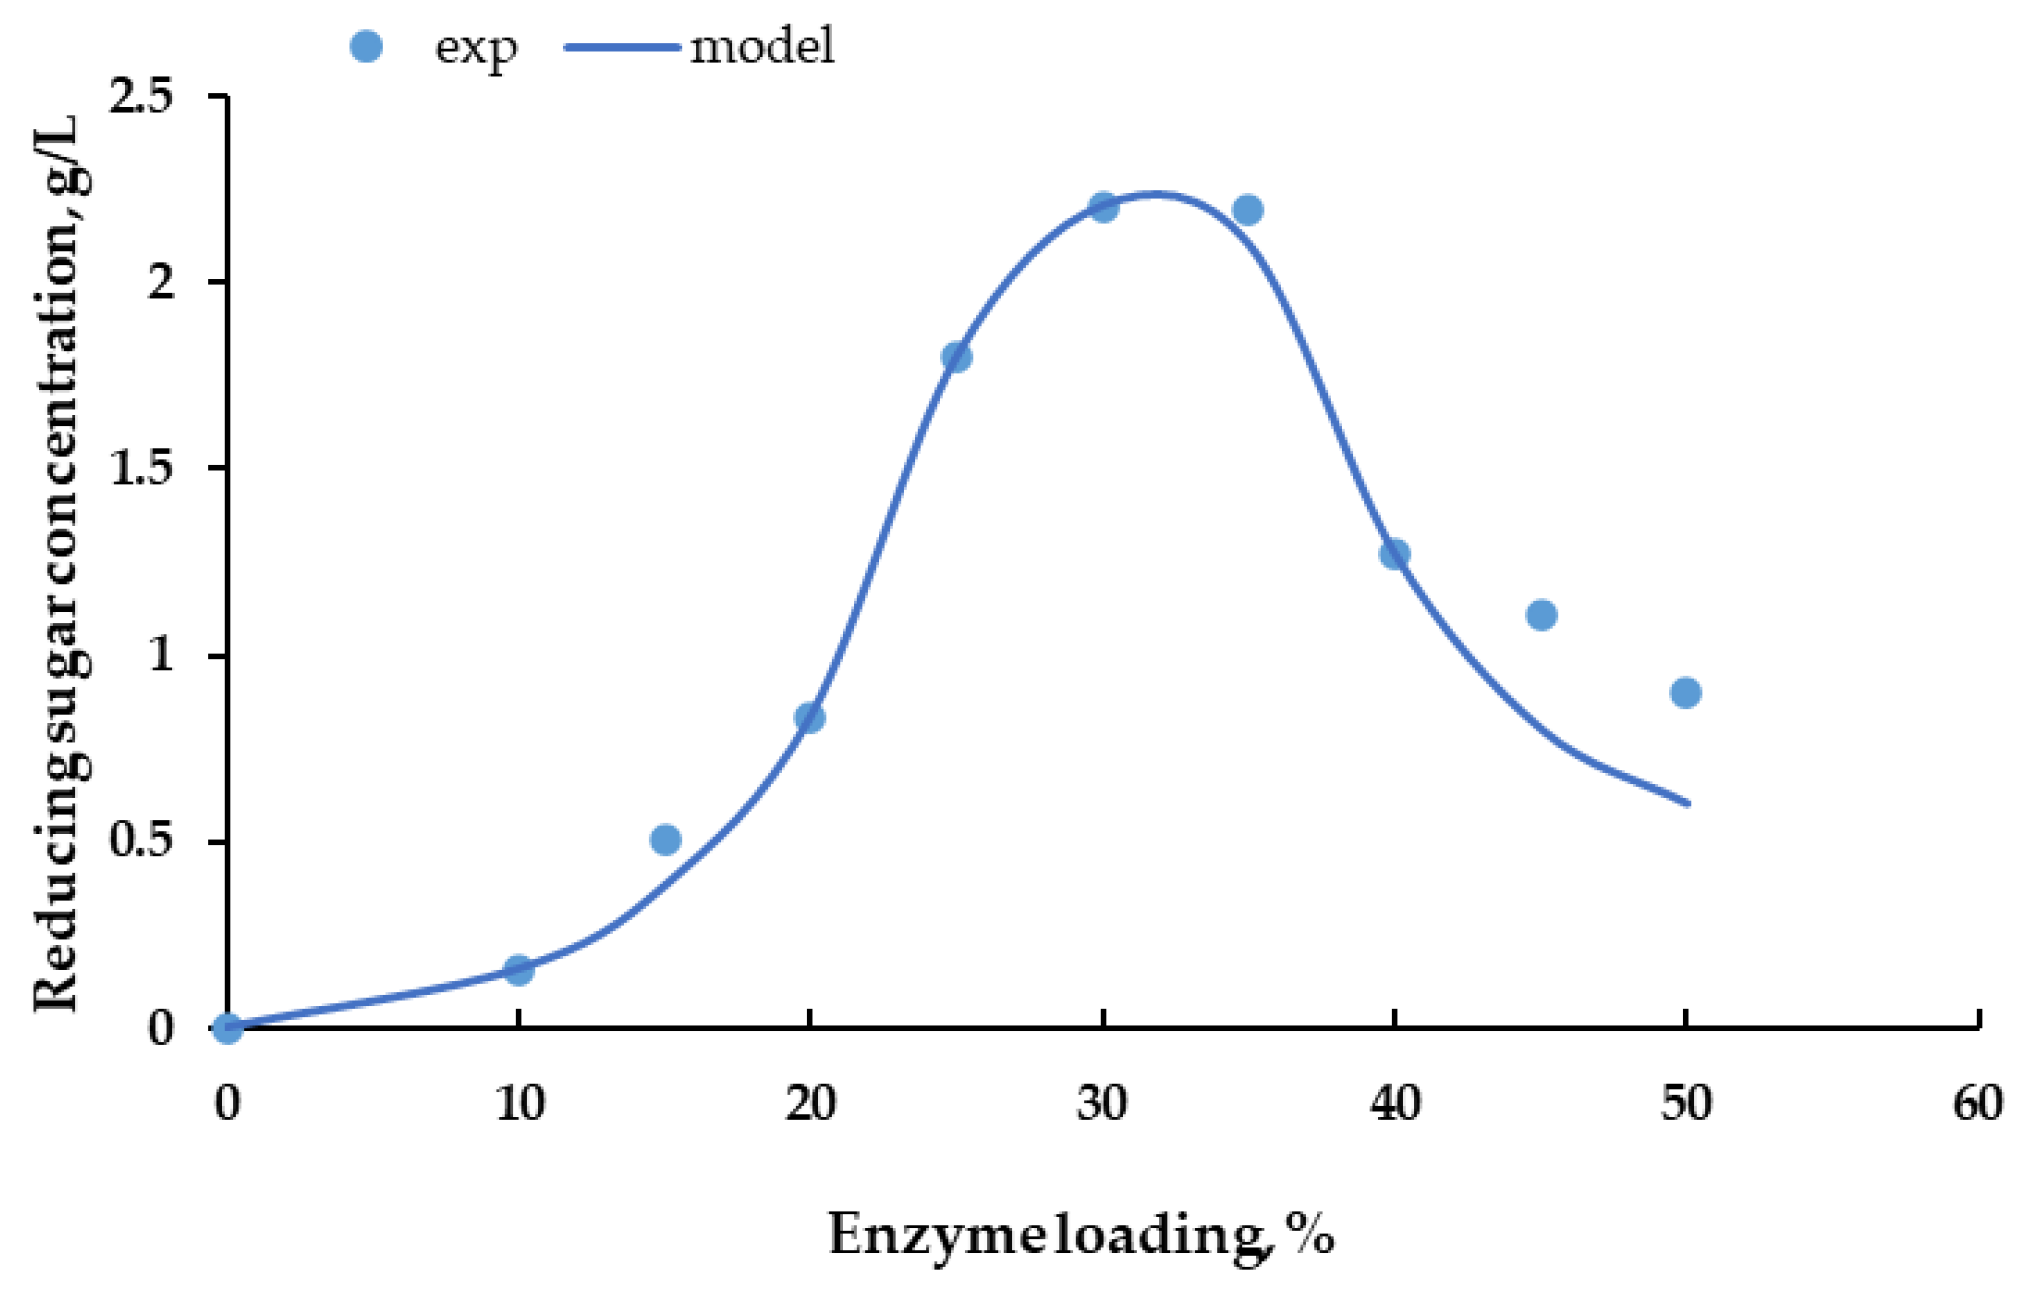
3.3. Effect of Hydrolysis Time and Enzyme Concentration on the Reducing Sugar Concentration

Figure 1 presents the test results of the effect of hydrolysis time on the reducing sugar levels at various enzyme concentrations. Figure 2 depicts the predicted results of the enzymatic hydrolysis of pre-treated rice husks under typical conditions. Based on Figure 1, the reducing sugar levels rose sharply from 1 to 10 h. The increase slows down from 10 to 25 h, with the highest reducing sugar concentration being 1.78 g/L. Due to the cellulase enzyme’s activity entering the moderate phase and depletion, there is a decline in the levels of reducing sugar. At an intermediate stage, cellulose is degraded into reducing sugar on a large scale. The concentration of enzymes increases proportionally to the concentration of reducing sugar as enzyme activity increases. Previous researchers [35] have demonstrated comparable findings.
Overall, the proposed model accurately predicted the enzymatic hydrolysis behavior. We attempted to compare our kinetic parameters to those reported in prior publications [33,52,53]. Sakimoto et al. implemented the Langmuir adsorption, Michaelis–Menten, and Shuler models into the kinetic model of the hydrolysis reactions [53]. Their kinetic parameters were comparable to ours, despite our distinct experimental conditions and model schemes. They developed the simultaneous saccharification and fermentation (SSF) model for cellulose degradation. Other researchers [33] investigated the hydrolysis kinetics of wheat straw treated with cellulase NS 50013 enzyme complex and β -glucosidase NS 50010. They used models of heterogeneous catalytic reactions to describe the kinetics of enzymatic hydrolysis. In addition, their findings on the time dependence of the amount of reducing sugars followed by varying the amount of enzyme introduced were similar. Wojtusik et al. investigated a two-step approach to estimating kinetic parameters using a low-BG activity enzymatic cocktail (Celluclast 1.5 L) [52]. Our result is consistent with that of their model, which corresponds to the experimental evolution of cellulose, cellobiose, and glucose.

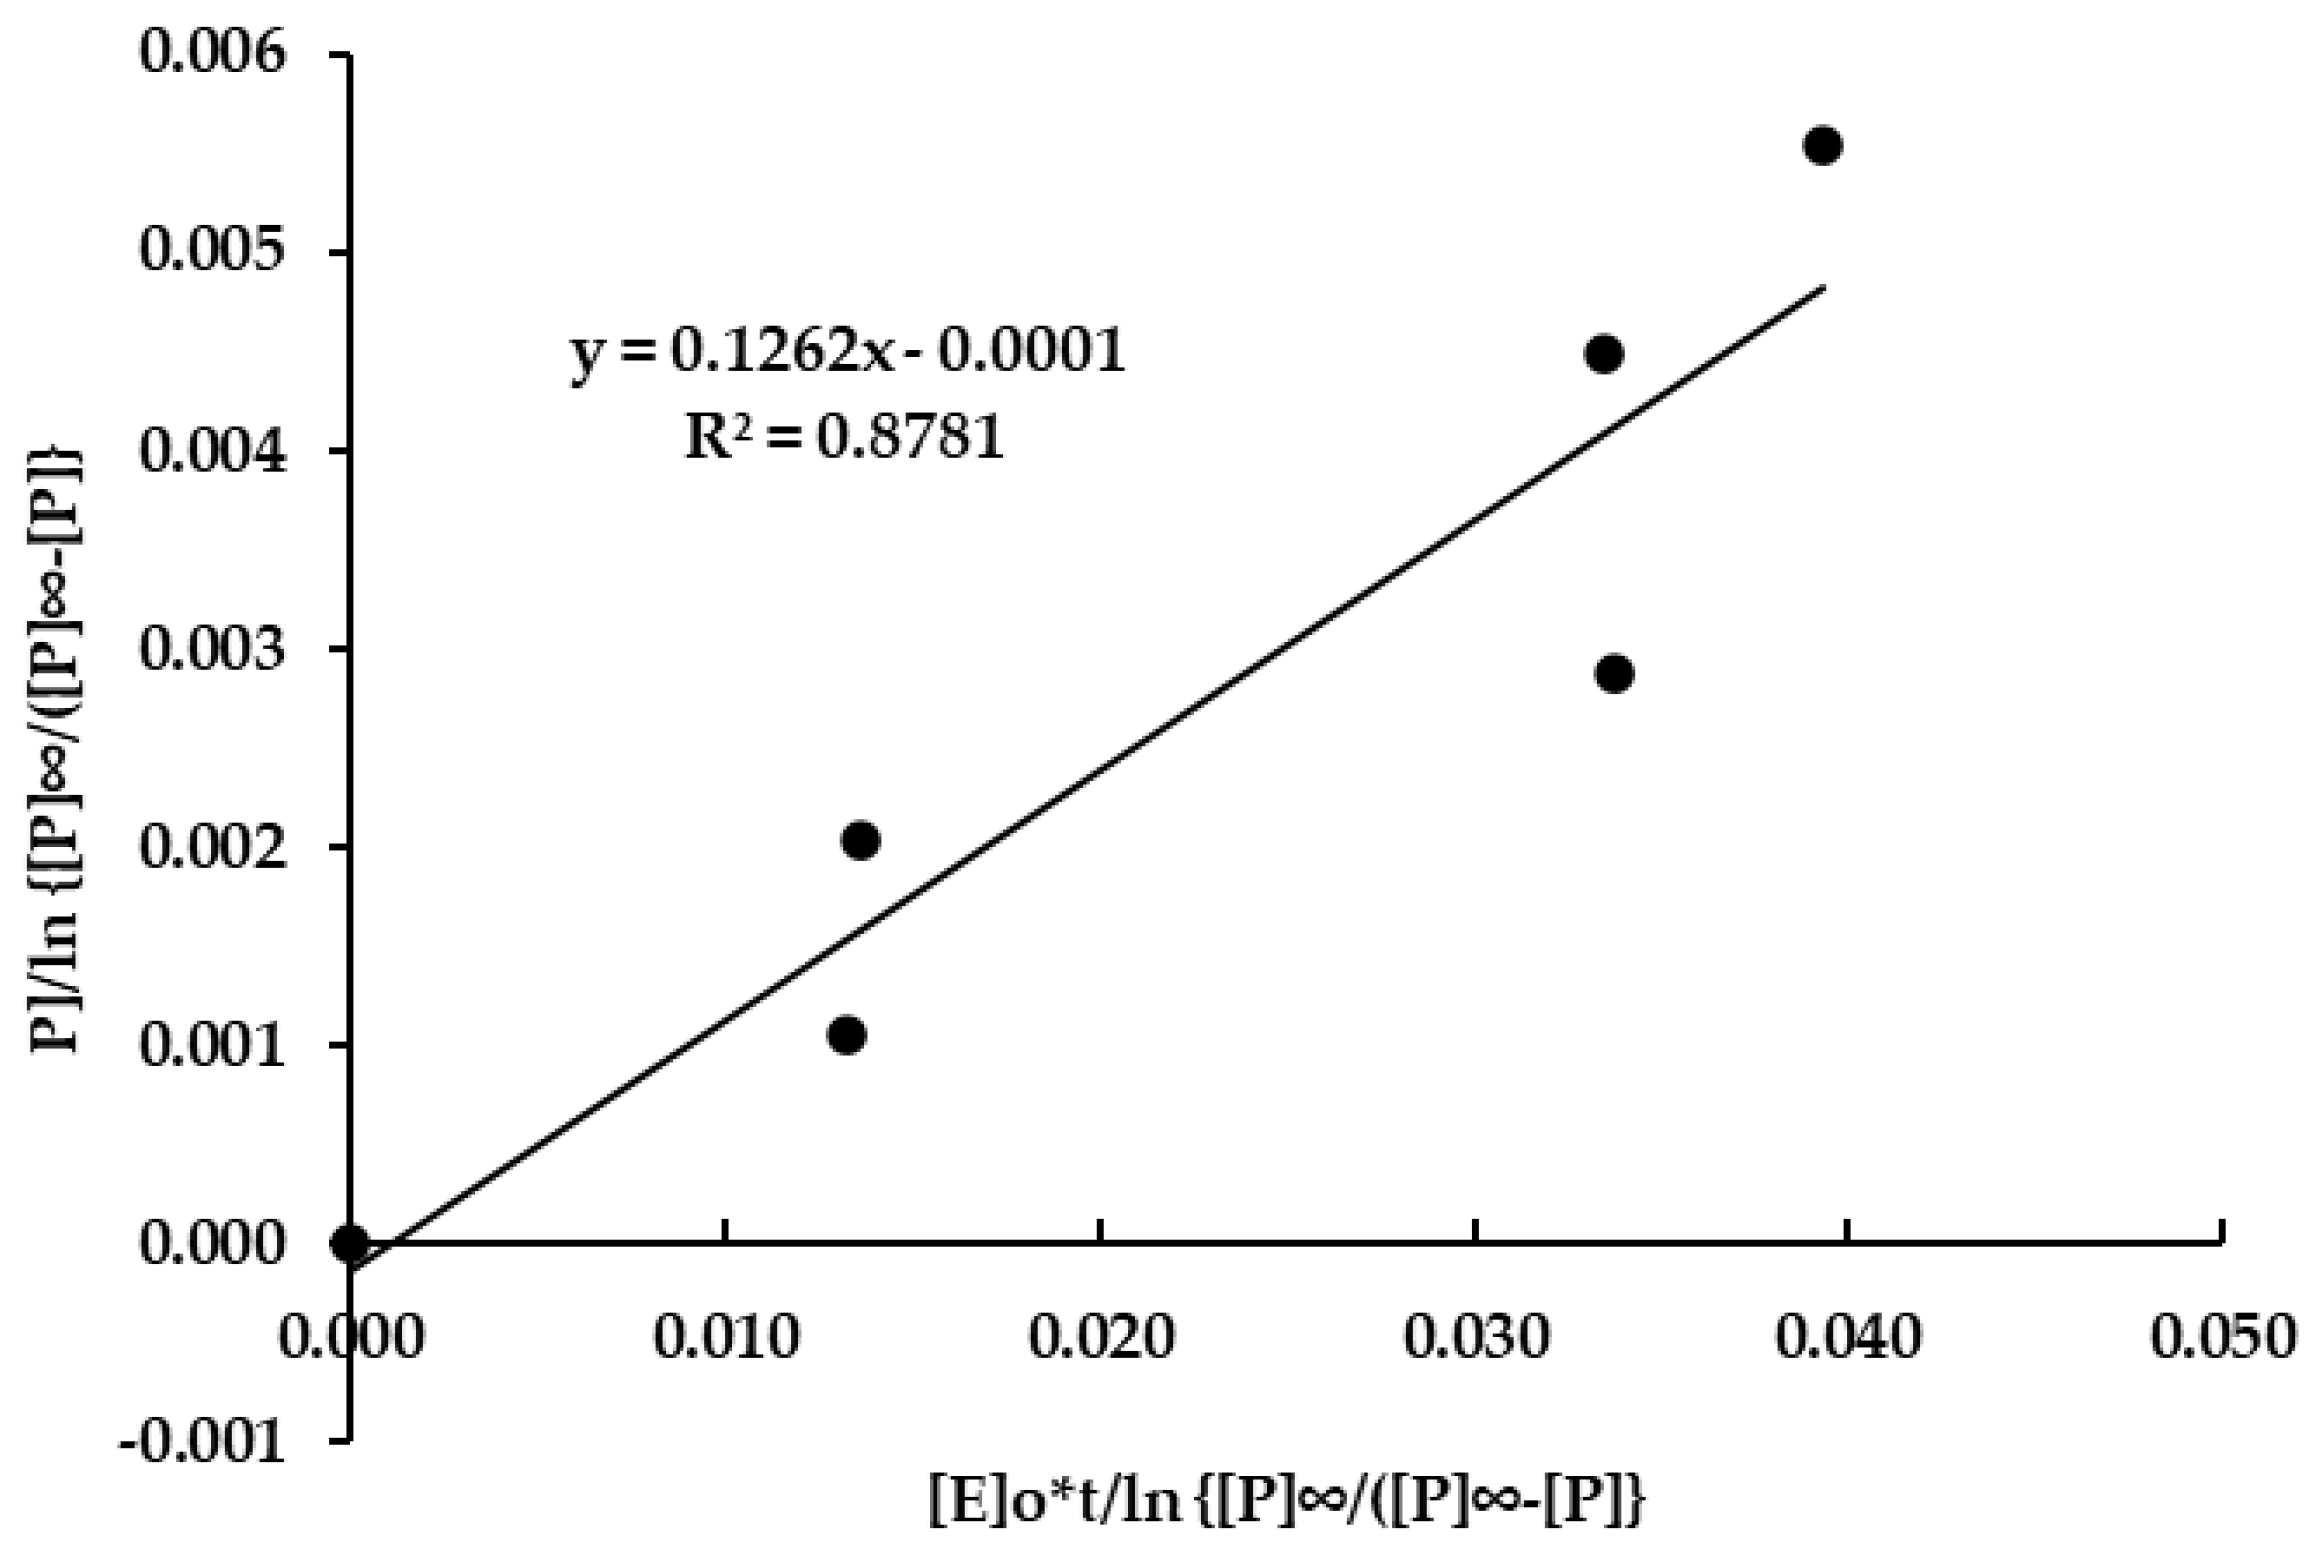
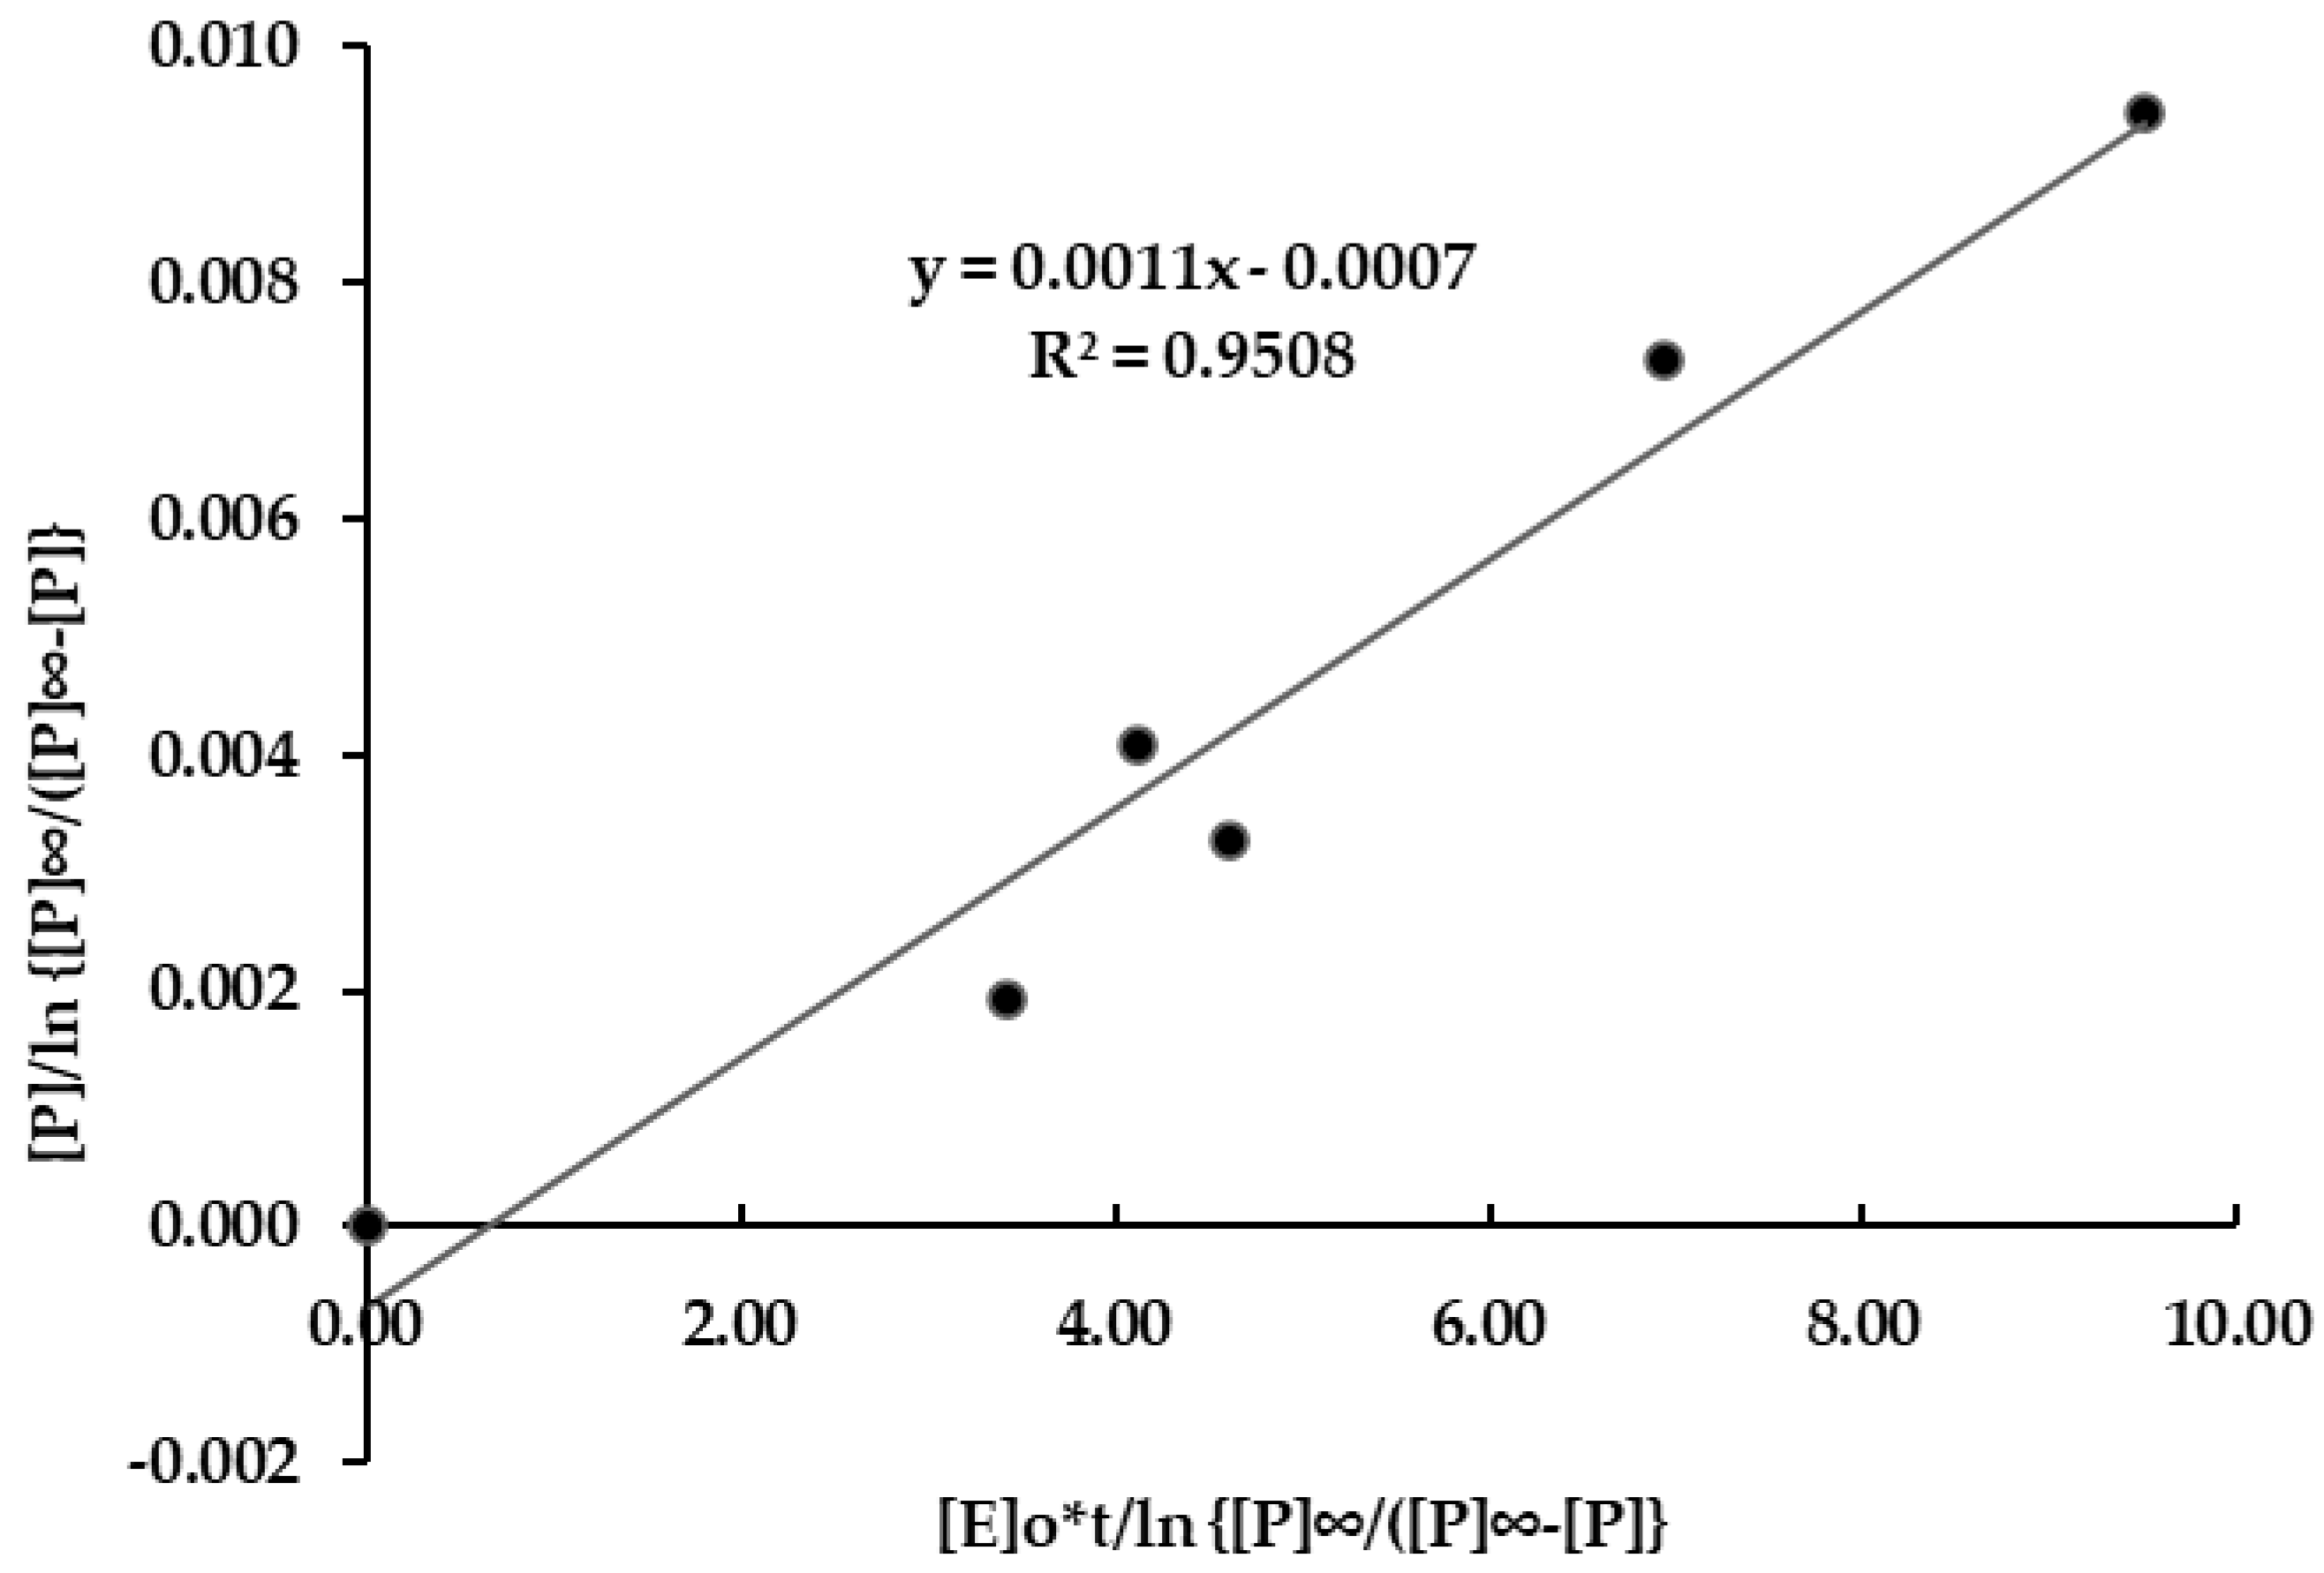
3.4. Cellulase Enzyme Reaction Kinetics

According to [24], the enzymatic hydrolysis substrates’ kinetics were determined by a modified version of the Michaelis–Menten equation, and then the results were validated with experimental data. The enzymatic hydrolysis reaction was carried under transient conditions because the excess substrate inhibited hydrolysis. Under such conditions, it is unacceptable to neglect the change in the concentration of the enzyme–substrate complex. Several factors, including the chemical components of the reactant molecule, the product, the concentration of the reacting substance or substrate, the temperature, and the catalyst, influence the kinetics of the reaction. The kinetics of the reaction was determined based on Equation (14). Figure 2, Figure 3 and Figure 4 show the relationship between [P]/ln{[P]/([P] − [P]} and [E]0.t/[P]/In{[P]/[P] − [P]} at various enzyme concentrations.
The kinetic model of enzymatic hydrolysis determined the amount of reducing sugar released from pre-treated rice husks throughout the hydrolysis period. Linear regression produced the reaction kinetics, in which the slope value represents the reaction rate constant (k2) and the interception represents the Michaelis–Menten constant (KM) [24]. The reaction rate constant (k2) was about 0.0011 to 0.1262. The value of VM indicates the reactant’s degree of saturation of the enzyme. In contrast, KM indicates the efficiency of the catalyst or the size of the enzyme dissociation constant. The Michaelis–Menten constant was 0.001 to 0.0007, and VM was 1.3 × 10⁻⁷ to 2.7 × 10⁻⁷ Mol L−1 s−1. These values indicated that cellulase catalyzes the cellulose of rice husks into sugar. The values of the constant reaction rate, the Michaelis–Menten constant, and the formation rate of the product in this study are similar to those found in previous research [53]. Table 4 presents the cellulose enzymatic hydrolysis kinetic constants proposed by various authors.
Figure 5 presents the effect of enzyme concentration on the reducing sugar levels for 5 h of hydrolysis time. According to Figure 5, during the 5 h enzymatic hydrolysis reaction, the optimal reducing sugar concentration was about 2.21 g/L, obtained at enzyme concentrations of 30%. For enzyme concentrations of less than 30% (v/w), the enzyme concentration was directly proportional to the resulting reducing sugar. The optimal enzyme loading for the cellulase-mediated enzymatic hydrolysis of pre-treated rice husk was 30% (v/w), which enhances the sugar concentration. As the enzyme loading was increased to between 35 and 50% (v/w), the reducing sugar concentration decreased dramatically. This two-phase response of sugar concentration to different enzyme loading is observed because hydrolysis is an enzyme-limited activity at low enzyme to substrate loading (i.e., 25% (v/w) enzyme loading). In comparison, excess enzymes at enzyme loading > 30% (v/w) sped up the hydrolysis rate and made products (glucose and other reducing sugars) that inhibited the free enzymes in the liquid phase by binding to them. The substrate–enzyme complexes hindered the cellulase’s catalytic activity and reduced the concentration of reducing sugars [56]. For enzyme concentrations of more than 30% (v/w), the lowest reducing sugar concentration (0.89 g L−1) was obtained.
Table 5 compares the reducing sugar levels reported for various pre-treatments and microorganisms with those of the present study. Based on Table 5, the reducing sugar level was 1.80 g L−1. This value is lower than in previous studies [15] due to this study’s lower pre-treatment time for hydrogen peroxide. Differences in the types of biomass as a source of cellulose, enzyme concentration, and pre-treatment processes also change factors that affect the yield. Jeoh et al. concluded that pre-treatment significantly affects the reduction in lignin, inhibiting the activity of enzymes [16].

4. Conclusions

Aspergillus niger’s cellulase enzyme contains endoglucanase (314.892 U mL−1) and exoglucanase activity (548.940 U mL−1). The kinetics of the cellulosic hydrolysis of rice husk cellulose after hydrogen peroxide–aqueous ammonia pre-treatment were studied. The kinetic equation provided a good interpretation of cellulase action. The time dependence of the amount of reducing sugars was investigated by varying the amount of enzyme. The findings of this study led to an improved method for the enzymatic hydrolysis of pretreated rice husks, which was shown to follow the Michaelis–Menten kinetic model and for which the kinetic parameters KM and VM were determined to be 0.001 to 0.0007 Mol L−1 and 1.3 × 10⁻⁷ to 2.7 × 10⁻⁷ Mol L−1 s−1, respectively. The results showed that enzyme loading is directly proportional to the reducing sugar. The optimal reducing sugar level was 1.80 g L−1, which was obtained at 20% (v/w) enzyme loading and a hydrolysis time of 25 h. Additional research is necessary to develop a comprehensive model of the enzymatic hydrolysis of cellulose to provide a valuable tool for future engineering applications.

Author Contributions

Conceptualization, N.N. and E.M.; methodology, N.N.; software, N.N., E.M. and W.E.; validation, N.N., E.M. and W.E.; formal analysis, N.N. and E.M.; investigation, WE; resources, N.N. and W.E.; data curation, W.E.; writing—original draft preparation, W.E.; writing—review and editing, N.N. and E.M.; visualization, N.N.; supervision, N.N. and E.M.; project administration, W.E.; funding acquisition, N.N. All authors have read and agreed to the published version of the manuscript.

Funding

This research was funded by DIPA, the public service agency of Sriwijaya University (SP DIPA-023.17.2.677515/2022) on 13 December 2021 based on the Rector’s Decree Number 0109/UN9.3.1/SK/2022 dated 28 April 2022.

Acknowledgments

The authors gratefully acknowledge the financial support provided by DIPA, the public service agency of Sriwijaya University (SP DIPA-023.17.2.677515/2022) on 13 December 2021 based on the Rector’s Decree Number 0109/UN9.3.1/SK/2022 dated 28 April 2022.

Conflicts of Interest

The authors declare no conflict of interest.

References

  1. Rosita, N. Book 5: Province of South Sumatra. In Business Directory/Companies of Rice Milling Industry; Bahagia, M.Q., Ed.; Central Bureau of Statistics: Jakarta, Indonesia, 2020; pp. 1–318. [Google Scholar]
  2. Cacua, A.; Gelvez, J.J.; Rodríguez, D.C.; Parra, J.W. Production of bioethanol from rice husk pre-treated with alkalis and hydrolyzed with acid cellulase at pilot scale. J. Phys. Conf. Ser. 2018, 1126, 12034. [Google Scholar] [CrossRef]
  3. Brémond, U.; de Buyer, R.; Steyer, J.P.; Bernet, N.; Carrere, H. Biological pre-treatments of biomass for improving biogas production: An overview from lab scale to full-scale. Renew. Sustain. Energy Rev. 2018, 90, 583–604. [Google Scholar] [CrossRef]
  4. Plácido, J.; Capareda, S. Ligninolytic enzymes: A biotechnological alternative for bioethanol production. Bioresour. Bioprocess. 2015, 2, 23. [Google Scholar] [CrossRef] [Green Version]
  5. Zabed, H.; Sahu, J.N.; Boyce, A.N.; Faruq, G. Fuel ethanol production from lignocellulosic biomass: An overview on feedstocks and technological approaches. Renew. Sustain. Energy Rev. 2016, 66, 751–774. [Google Scholar] [CrossRef]
  6. Gonçalves, F.A.; Ruiz, H.A.; Nogueira, C.D.C.; Dos Santos, E.S.; Teixeira, J.A.; De Macedo, G.R. Comparison of delignified coconuts waste and cactus for fuel-ethanol production by the simultaneous and semi-simultaneous saccharification and fermentation strategies. Fuel 2014, 131, 66–76. [Google Scholar] [CrossRef] [Green Version]
  7. Chukwuma, O.B.; Rafatullah, M.; Tajarudin, H.A.; Ismail, N. Lignocellulolytic enzymes in biotechnological and industrial processes: A review. Sustainability 2020, 12, 7282. [Google Scholar] [CrossRef]
  8. Axelsson, J. Separate Hydrolysis and Fermentation of Pretreated Spruce. Master’ Thesis, Linköping University, Örnsköldsvik Sweden, 2011. [Google Scholar]
  9. Jȩdrzejczyk, M.; Soszka, E.; Czapnik, M.; Ruppert, A.M.; Grams, J. Physical and chemical pre-treatment of lignocellulosic biomass. In Second and Third Generation of Feedstocks: The Evolution of Biofuels; Elsevier Inc.: Amsterdam, The Netherlands, 2019; pp. 143–196. [Google Scholar]
  10. Albuquerque, E.D.; Torres, F.A.G.; Fernandes, A.A.R.; Fernandes, P.M.B. Combined effects of high hydrostatic pressure and specific fungal cellulase improve coconut husk hydrolysis. Process. Biochem. 2016, 51, 1767–1775. [Google Scholar] [CrossRef]
  11. Novia, N.; Said, M.; Jannah, A.M.; Pebriantoni, P.; Bayu, M. Aqueous Ammonia Soaking-Dilute Acid Pretreatment to Produce Bioethanol from Rice Husk. Technol. Reports Kansai Univ. 2020, 62, 891–900. [Google Scholar]
  12. Kim, J.S.; Lee, Y.Y.; Kim, T.H. A review on alkaline pre-treatment technology for bioconversion of lignocellulosic biomass. Bioresour. Technol. 2016, 199, 42–48. [Google Scholar] [CrossRef]
  13. Xia, Y.; Liu, Q.; Hu, X.; Li, X.; Huang, Y.; Li, W.; Ma, L. Structural evolution during corn stalk acidic and alkaline hydrogen peroxide pre-treatment. Ind. Crop. Prod. 2022, 176, 114386. [Google Scholar] [CrossRef]
  14. Ali, N.; Giwa, A.S.; Abdalla, M.; Liu, X. Alkaline hydrogen peroxide pre-treatment of bamboo culm for improved enzymatic release of reducing sugars using recombinant cellulases. Cellulose 2020, 27, 769–779. [Google Scholar] [CrossRef]
  15. Novia, N.; Hasanudin, H.; Hermansyah, H.; Fudholi, A. Kinetics of Lignin Removal from Rice Husk Using Hydrogen Peroxide and Combined Hydrogen Peroxide–Aqueous Ammonia Pretreatments. Fermentation 2022, 8, 157. [Google Scholar] [CrossRef]
  16. Jeoh, T.; Cardona, M.J.; Karuna, N.; Mudinoor, A.R.; Nill, J. Mechanistic Kinetic Models of Enzymatic Cellulose Hydrolysis — A Review. Biotechnol. Bioeng. 2017, 114, 1369–1385. [Google Scholar] [CrossRef] [PubMed]
  17. Niglio, S.; Procentese, A.; Russo, M.E.; Piscitelli, A.; Marzocchella, A. Integrated enzymatic pre-treatment and hydrolysis of apple pomace in a bubble column bioreactor. Biochem. Eng. J. 2019, 150, 107306. [Google Scholar] [CrossRef]
  18. Abdella, A.; Mazeed, T.E.; El-baz, A.F.; Yang, S. Production of β-glucosidase from wheat bran and glycerol by Aspergillus niger in stirred tank and rotating fibrous bed bioreactors. Process. Biochem. 2016, 51, 1331–1337. [Google Scholar] [CrossRef]
  19. Lynd, L.R.; Weimer, P.J.; Van Zyl, W.H.; Isak, S. Microbial Cellulose Utilization: Fundamentals and Biotechnology. Microbiol. Mol. Biol. Rev. 2002, 66, 506–577. [Google Scholar] [CrossRef] [Green Version]
  20. Bychkov, A.; Podgorbunskikh, E.; Bychkova, E.; Lomovsky, O. Current achievements in the mechanically pre-treated conversion of plant biomass. Biotechnol. Bioeng. 2019, 116, 1231–1244. [Google Scholar] [CrossRef]
  21. Nill, J.; Karuna, N.; Jeoh, T. The impact of kinetic parameters on cellulose hydrolysis rates. Process. Biochem. 2018, 74, 108–117. [Google Scholar] [CrossRef]
  22. Fabbrizi, G.; Giannoni, T.; Lorenzi, L.; Nicolini, A.; Iodice, P.; Coccia, V.; Cavalaglio, G.; Gelosia, M. High Solid and Low Cellulase Enzymatic Hydrolysis of Cardoon Stems Pretreated by Acidified γ-Valerolactone/Water Solution. Energies 2022, 15, 2600. [Google Scholar] [CrossRef]
  23. Policastro, G.; Luongo, V.; Frunzo, L.; Fabbricino, M. A comprehensive review of mathematical models of photo fermentation. Crit. Rev. Biotechnol. 2021, 41, 628–648. [Google Scholar] [CrossRef]
  24. Bisswanger, H. Enzyme Kinetics: Principles and Methods. In Psychology in the Brain, 3rd ed.; Wiley-VCH: Weinheim, Germany, 2017; pp. 1–21. [Google Scholar]
  25. Bezerra, R.M.F.; Dias, A.A. Discrimination among eight modified Michaelis-Menten kinetics models of cellulose hydrolysis with a large range of substrate/enzyme ratios: Inhibition by cellobiose. Appl. Biochem. Biotechnol. Part A Enzym. Eng. Biotechnol. 2004, 112, 173–184. [Google Scholar] [CrossRef]
  26. Miao, Y.; Chen, J.Y.; Jiang, X.; Huang, Z. Kinetic studies on the product inhibition of enzymatic lignocellulose hydrolysis. Appl. Biochem. Biotechnol. 2012, 167, 358–366. [Google Scholar] [CrossRef] [PubMed]
  27. Russo, M.E.; Procentese, A.; Montagnaro, F.; Marzocchella, A. Effect of enzymes adsorption on enzymatic hydrolysis of coffee silverskin: Kinetic characterization and validation. Biochem. Eng. J. 2022, 180, 108364. [Google Scholar] [CrossRef]
  28. Carvalho, M.L.; Sousa, R.; Rodríguez-Zúñiga, U.F.; Suarez, C.A.G.; Rodrigues, D.S.; Giordano, R.C.; Giordano, R.L.C. Kinetic study of the enzymatic hydrolysis of sugarcane bagasse. Braz. J. Chem. Eng. 2013, 30, 437–447. [Google Scholar] [CrossRef] [Green Version]
  29. Zhang, Y.; Zhang, Y.; Song, M.; Topakas, E.; Yu, Q.; Yuan, Z.; Wang, Z.; Guo, Y. Combining Michaelis-Menten theory and enzyme deactivation reactions for the kinetic study of enzymatic hydrolysis by different pre-treated sugarcane bagasse. Process. Biochem. 2021, 105, 72–78. [Google Scholar] [CrossRef]
  30. Angarita, J.D.; Souza, R.B.A.; Cruz, A.J.G.; Biscaia, E.C.; Secchi, A.R. Kinetic modeling for enzymatic hydrolysis of pre-treated sugarcane straw. Biochem. Eng. J. 2015, 104, 10–19. [Google Scholar] [CrossRef]
  31. Nnaemeka, I.C.; Egbuna Samuel, O.; Onoh Maxwell, I.; Christain, A.O.; Onyekwulu Chinelo, S. Optimization and kinetic studies for enzymatic hydrolysis and fermentation of colocynthis vulgaris Shrad seeds shell for bioethanol production. J. Bioresour. Bioprod. 2021, 6, 45–64. [Google Scholar] [CrossRef]
  32. Ude, M.U.; Oluka, I.; Eze, P.C. Optimization and kinetics of glucose production via enzymatic hydrolysis of mixed peels. J. Bioresour. Bioprod. 2020, 5, 283–290. [Google Scholar] [CrossRef]
  33. Radeva, G.; Valchev, I.; Petrin, S.; Valcheva, E.; Tsekova, P. Kinetic model of enzymatic hydrolysis of steam-exploded wheat straw. Carbohydr. Polym. 2012, 87, 1280–1285. [Google Scholar] [CrossRef]
  34. Zheng, Y.; Pan, Z.; Zhang, R.; Jenkins, B.M. Kinetic modeling for enzymatic hydrolysis of pre-treated creeping wild ryegrass. Biotechnol. Bioeng. 2009, 102, 1558–1569. [Google Scholar] [CrossRef]
  35. Makarova, E.I.; Budaeva, V.V.; Kukhlenko, A.A.; Orlov, S.E. Enzyme kinetics of cellulose hydrolysis of Miscanthus and oat hulls. 3 Biotech. 2017, 7, 317. [Google Scholar] [CrossRef] [PubMed]
  36. Wei, H.; Chen, X.; Shekiro, J.; Kuhn, E.; Wang, W.; Ji, Y.; Kozliak, E.; Himmel, M.E.; Tucker, M.P. Kinetic Modelling and Experimental Studies for the Effects of Fe2+ Ions on Xylan Hydrolysis with Dilute-Acid Pre-treatment and Subsequent Enzymatic Hydrolysis. Catalysts 2018, 8, 39. [Google Scholar] [CrossRef] [Green Version]
  37. Nikzad, M.; Talebnia, F.; Movagharnejad, K.; Najafpour, G.; Esfahanian, M. Kinetic modeling of enzymatic hydrolysis of pre-treated sorghum bicolor and rice husk. Int. J. Eng. Trans. B Appl. 2017, 30, 1622–1630. [Google Scholar] [CrossRef]
  38. Datta, R. Acidogenic fermentation of lignocellulose–acid yield and conversion of components. Biotechnol. Bioeng. 1981, 23, 2167–2170. [Google Scholar] [CrossRef]
  39. Yao, F.; Tian, D.; Shen, F.; Hu, J.; Zeng, Y.; Yang, G.; Zhang, Y.; Deng, S.; Zhang, J. Recycling solvent system in phosphoric acid plus hydrogen peroxide pre-treatment towards a more sustainable lignocellulose biorefinery for bioethanol. Bioresour. Technol. 2019, 275, 19–26. [Google Scholar] [CrossRef]
  40. Kim, T.H.; Lee, Y.Y. Pretreatment of corn stover by soaking in aqueous ammonia at moderate temperatures. Appl. Biochem. Biotechnol. 2007, 137–140, 81–92. [Google Scholar] [CrossRef]
  41. Nathan, V.K.; Rani, M.E.; Rathinasamy, G.; Dhiraviam, K.N.; Jayavel, S. Process optimization and production kinetics for cellulase production by Trichoderma viride VKF3. Springerplus 2014, 3, 92. [Google Scholar] [CrossRef] [Green Version]
  42. Darwesh, O.M.; El-Maraghy, S.H.; Abdel-Rahman, H.M.; Zaghloul, R.A. Improvement of paper wastes conversion to bioethanol using novel cellulose degrading fungal isolate. Fuel 2020, 262, 116518. [Google Scholar] [CrossRef]
  43. Miller, G.L. Use of Dinitrosalicylic Acid Reagent for Determination of Reducing Sugar. Anal. Chem. 1959, 31, 426–428. [Google Scholar] [CrossRef]
  44. Kim, T.H.; Taylor, F.; Hicks, K.B. Bioethanol production from barley hull using SAA (soaking in aqueous ammonia) pretreatment. Bioresour. Technol. 2008, 99, 5694–5702. [Google Scholar] [CrossRef]
  45. Moreira, B.R.; Breitkreitz, M.C.; Simister, R.; McQueen-Mason, S.J.; Gomez, L.D.; Rezende, C.A. Improved hydrolysis yields and silica recovery by design of experiments applied to acid-alkali pretreatment in rice husks. Ind. Crops Prod. 2021, 170, 113676. [Google Scholar] [CrossRef]
  46. Le, H.D.M.; Sørensen, R.; Knudsen, N.O.; Meyer, A.S. Implications of silica on biorefi neries – interactions with organic material and mineral elements in grasses. Biofuels Bioprod. Biorefining 2014, 9, 109–121. [Google Scholar] [CrossRef]
  47. Kaur, B.; Oberoi, H.S.; Chadha, B.S. Enhanced cellulase producing mutants developed from heterokaryotic Aspergillus strain. Bioresour. Technol. 2014, 156, 100–107. [Google Scholar] [CrossRef] [PubMed]
  48. Santos, G.B.; de Sousa Francisco Filho, Á.; Rêgo da Silva Rodrigues, J.; Rodrigues de Souza, R. Cellulase production by Aspergillus niger using urban lignocellulosic waste as substrate: Evaluation of different cultivation strategies. J. Environ. Manag. 2022, 305, 114431. [Google Scholar] [CrossRef]
  49. Kang, S.W.; Park, Y.S.; Lee, J.S.; Hong, S.I.; Kim, S.W. Production of cellulases and hemicellulases by Aspergillus niger KK2 from lignocellulosic biomass. Bioresour. Technol. 2004, 91, 153–156. [Google Scholar] [CrossRef]
  50. Sulyman, A.O.; Igunnu, A.; Malomo, S.O. Isolation, purification and characterization of cellulase produced by Aspergillus niger cultured on Arachis hypogaea shells. Heliyon 2020, 6, e05668. [Google Scholar] [CrossRef]
  51. Cunha, F.M.; Esperança, M.N.; Zangirolami, T.C.; Badino, A.C.; Farinas, C.S. Sequential solid-state and submerged cultivation of Aspergillus niger on sugarcane bagasse for the production of cellulase. Bioresour. Technol. 2012, 112, 270–274. [Google Scholar] [CrossRef] [Green Version]
  52. Wojtusik, M.; Villar, J.C.; Ladero, M.; Garcia-Ochoa, F. Physico-chemical kinetic modelling of hydrolysis of a steam-explosion pre-treated corn stover: A two-step approach. Bioresour. Technol. 2018, 268, 592–598. [Google Scholar] [CrossRef]
  53. Sakimoto, K.; Kanna, M.; Matsumura, Y. Kinetic model of cellulose degradation using simultaneous saccharification and fermentation. Biomass Bioenergy 2017, 99, 116–121. [Google Scholar] [CrossRef]
  54. Ryu, D.D.Y.; Lee, S.B. Enzymatic hydrolysis of cellulose: Determination of kinetic parameters. Chem. Eng. Commun. 1986, 45, 119–134. [Google Scholar] [CrossRef]
  55. Haldar, D.; Gayen, K.; Sen, D. Enumeration of monosugars’ inhibition characteristics on the kinetics of enzymatic hydrolysis of cellulose. Process. Biochem. 2018, 72, 130–136. [Google Scholar] [CrossRef]
  56. Paul, S.K.; Chakraborty, S. Mixing effects on the kinetics of enzymatic hydrolysis of lignocellulosic Sunn hemp fibres for bioethanol production. Chem. Eng. J. 2019, 377, 120103. [Google Scholar] [CrossRef]
  57. Jin, X.; Song, J.; Liu, G.Q. Bioethanol production from rice straw through an enzymatic route mediated by enzymes developed in-house from Aspergillus fumigatus. Energy 2020, 190, 116395. [Google Scholar] [CrossRef]
  58. Subsamran, K.; Mahakhan, P.; Vichitphan, K.; Vichitphan, S.; Sawaengkaew, J. Potential use of vetiver grass for cellulolytic enzyme production and bioethanol production. Biocatal. Agric. Biotechnol. 2019, 17, 261–268. [Google Scholar] [CrossRef]
  59. Chauhan, M.; Dutt, S.; Manjul, A.S.; Singh, B.; Garlapati, V.K. A sustainable approach of turning potato waste towards bioethanol production using indigenous microbes of Himachal Pradesh, India. Chemosphere 2022, 299, 134429. [Google Scholar] [CrossRef]
  60. Hosny, M.; El-Sheshtawy, H.S. Effect of biosurfactant on hydrolysis of municipal waste by cellulases producing bacteria for bioethanol production. Curr. Res. Green Sustain. Chem. 2022, 5, 100294. [Google Scholar] [CrossRef]
  61. Mihajlovski, K.; Pecarski, D.; Rajilić-Stojanović, M.; Dimitrijević-Branković, S. Valorization of corn stover and molasses for enzyme synthesis, lignocellulosic hydrolysis and bioethanol production by Hymenobacter sp. CKS3. Environ. Technol. Innov. 2021, 23, 101627. [Google Scholar] [CrossRef]
  62. Danso, B.; Ali, S.S.; Xie, R.; Sun, J. Valorisation of wheat straw and bioethanol production by a novel xylanase- and cellulase-producing Streptomyces strain isolated from the wood-feeding termite, Microcerotermes species. Fuel 2022, 310, 122333. [Google Scholar] [CrossRef]
Figure 1. Changes in the reducing sugar and cellulose concentration in hydrolysate during enzymatic hydrolysis of pre-treated rice husk at various cellulase loadings. All experiments were carried out in triplicate.
Fermentation 08 00417 g001
Figure 2. The relationship between [P]/ln{[P]/([P] − [P]} and [E]0.t/ln{[P]/([P] − [P]} at an enzyme concentration of 10%.
Fermentation 08 00417 g002
Figure 3. The relationship between [P]/ln{[P]/([P] − [P]} and [E]0.t/ln{[P]/([P] − [P]} at an enzyme concentration of 15%.
Fermentation 08 00417 g003
Figure 4. The relationship between [P]/ln{[P]/([P] − [P]} and [E]0.t/ln{[P]/([P] − [P]} at an enzyme concentration of 20%.
Fermentation 08 00417 g004
Figure 5. Effect of enzyme concentration on the reducing sugar levels after 5 h of hydrolysis time.
Fermentation 08 00417 g005
Table 1. The composition of rice husks before and after pre-treatment.
ComponentsUntreated Rice Hull
(%)
H2O2 Pretreated Rice Hull
(%)
Aqueous Ammonia Pretreated Rice Hull
(%)
Cellulose29.2638.7743.80
Hemicellulose20.7917.7115.64
Lignin36.2427.2220.47
Hot Water Solubility (HWS)4.494.089.03
Ash9.2212.2211.06
Table 2. EDS analysis of the element composition of untreated and pre-treated rice husk (ZAF method standardless quantitative analysis).
ElementMass%
(Untreated)
Mass%
(H2O2 Pre-Treated
Rice Husk)
Mass%
(Aqueous Ammonia
Pre-Treated Rice Husk)
C 23.5227.0534.93
O 54.0948.9148.47
Si 22.4024.0516.60
Table 3. Comparison of the activity of crude cellulase enzymes of Aspergillus species.
MicroorganismSubstrateFPase
(Exoglucanase)
CMCase
(Endoglucanase)
β-GlucosidaseReference
Aspergillus niger KK2Rice Straw and Wheat Bran19.5 IU g−1129 IU g−1100 IU g−1[49]
Aspergillus niger NS-2Agricultural and Kitchen Waste Residues17 U g−1310 U g−133 U g−1[50]
Aspergillus nigerSugarcane
Bagasse
-57 IU L−1 h−1-[51]
Aspergillus nidulans and Aspergillus tubingensisSorghum Straw10.9 U mL−1243.2 U mL−11114.3 U mL−1[47]
Aspergillus nigerDry Leaves230.68 U L−1413.49 U L−1-[48]
Aspergillus nigerRice Husk548.940 U mL−1314.892 U mL−1-This study
Table 4. Cellulose enzymatic hydrolysis kinetic constants proposed by various authors.
Ref.Enzyme SourceSubstratepHT (°C)KMk2VM
This workAspergillus nigerRice Husk550 °C1 × 10−3 Mol L−11.1 × 10⁻³ s−11.3 × 10⁻⁷ Mol L−1 s−1
[53] Trichoderma reeseiCellulose-40 °C4.70 × 10−3 Mol L−13.90 × 10⁻³ s−14.83 × 10⁻⁵ Mol L−1 s−1
[32] Aspergillus nigerMixed Peels4.5536 °C60.5 g dm3-28.2 g dm−3 d−1
[54] Trichoderma reeseiSweco 2704.8050 °C36.2 mg mL−1-22.4 mg mL−1 hr−1
[25]Trichoderma reeseiAvicel4.8050 °C3.8 mM 5.6 × 10⁻⁴ s−1-
[28] Trichoderma reeseiSugarcane Bagasse4.8050 °C8.78 g L−1-0.105 g L−1 min−1
[55] Trichoderma reeseiCellulose4.8050 °C45.66 g L−1-0.26 g L−1 h−1
Table 5. Comparison of total reducing sugar concentrations reported for various substrates, pre-treatments, and microorganisms (including the present study).
SubstratePre-Treatment TypeMicroorganismTotal Reducing SUGARS (g L−1)Ref.
Rice StrawNaOHAspergillus fumigatus27.89[57]
Vetiver GrassNaOH-H2SO4Aspergillus tubingensis HS1–521.10[58]
Potato Peel Waste UntreatedB. amyloliquefaciens12.06[59]
Municipal WasteUntreatedBacillus subtilis9.08[60]
Rice Husk3% H2O2 solution (1:10) at 85 °C for 48 h; 20% aqueous ammonia at 100 °C for 5 h.Aspergillus niger6.58 [15]
Corn Stover UntreatedHymenobacter sp. CKS33.85 [61]
Wheat StrawUntreatedStreptomyces sp. MS-S23.6[62]
Rice Husk3% H2O2 solution (1:10) at 85 °C for 6 h; 20% aqueous ammonia at 100 °C for 5 h.Aspergillus niger1.80 This study
Publisher’s Note: MDPI stays neutral with regard to jurisdictional claims in published maps and institutional affiliations.

