Article

Evaluating the Influence of Microbial Fermentation on the Nutritional Value of Soybean Meal

1
Institute of Living Systems, Immanuel Kant Baltic Federal University, A. Nevskogo Street 14, Kaliningrad 236016, Russia
2
Natural Nutraceutical Biotesting Laboratory, Kemerovo State University, Krasnaya Street 6, Kemerovo 650043, Russia
3
Department of General Mathematics and Informatics, Kemerovo State University, Krasnaya Street 6, Kemerovo 650043, Russia
4
Laboratory of Biocatalysis, Kemerovo State University, Krasnaya Street 6, Kemerovo 650043, Russia
5
Sodrugestvo Group S.A., Yu. Gagarin Street 65, Kaliningrad Region, Svetly 238340, Russia
*
Author to whom correspondence should be addressed.
Fermentation 2022, 8(9), 458; https://doi.org/10.3390/fermentation8090458
Submission received: 14 August 2022 / Revised: 9 September 2022 / Accepted: 10 September 2022 / Published: 13 September 2022
(This article belongs to the Special Issue Advances in Resource Recovery from Organic Wastes (ARROW))

Abstract

:
The aim of this article is to increase the nutritional value of soybean meal while reducing the content of antinutrients by microbial fermentation of soybean meal with a mixed culture of probiotic microorganisms (Bacillus subtilis, Aspergillus niger, Saccharomyces cerevisiae, Lactiplantibacillus plantarum) at two different hydromodules. The addition of microorganisms increased the content of easily digestible protein and amine nitrogen in fermented soybean meal (30:110 and 30:130, hydromodulus soybean meal:water) while decreasing urease activity (hydromodulus 30:110). The positive effect of microbial fermentation on the mineral composition of soybean meal was demonstrated. The ability of microorganisms in the fermentation process to increase the content of protein, essential amino acids, and macro- and microelements in soybean meal while decreasing anti-nutritional factors opens up possibilities for using this technology to advance animal husbandry.

1. Introduction

The scarcity of animal feed, particularly protein-rich feed, has become increasingly apparent in recent years, severely impeding the growth of many agricultural sectors [1]. Soybean meal (SBM) is an important source of plant protein in livestock and poultry nutrition. It has a crude protein content of 440–530 g/kg DMB and has an optimal amino acid profile with high digestibility [2]. SBM is low in crude fiber (31–72 g/kg) and high in phosphorus (6.3–6.4 g/kg), mostly in the form of phytic acid [2]. However, the presence of allergenic proteins and anti-nutritional factors limits the use of soybean meal, which can affect digestion and nutrient absorption in humans and animals [3]. β-conglycinin (7S) and glycinin (11S) are known to induce various hypersensitivity reactions affecting the skin, intestines, and respiratory tract [4]. The majority of the phosphorus in SBM is present as phytate, which is poorly absorbed in the digestive tract of livestock animals because many of them lack endogenous phytase [5].
Fermentation was proved to improve the nutritional value of soybeans by increasing nutrient bioavailability and reducing antinutritional factors [6]. Natural fermentation can significantly increase the content of water-soluble protein and the activity of digestive enzymes [7]. Fermentation also contributes to a significant decrease in urease activity and trypsin inhibition activity, which in turn increases the digestibility of fermented soybean meal (FSBM) [8].
The content of crude and soluble proteins, total phenol, and flavonoids increased significantly after solid phase fermentation of SBM with Bacillus subtilis, while the content of trypsin inhibitor decreased. The result of a high-performance analysis of capillary electrophoresis showed an increase in the content of soluble components in FSBM compared to unfermented SBM. Antioxidant activity analysis showed that the reducing capacity, scavenging of 2,2-diphenyl-1-picrylhydrazyl and 2,2’-azino-bis(3-ethylbenzothiazoline-6-sulfonic acid) radicals of FSBM was stronger than that of unfermented SBM. Antihypertensive activity was also found in SBM after fermentation [9].
There are cases of SBM fermentation using microscopic fungi. Fungal fermentation with Aspergillus ficuum and Aspergillus niger caused the enrichment of soybean meal in protein and organic acids with a reduced content of dietary fiber, tannins, phytic acid, and urease, while the content of trypsin inhibitors was increased [10].
Yang et al. [11] evaluated the effect of solid-phase SBM fermentation using a mixed culture of Lacticaseibacillus casei, yeast, and Bacillus subtilis and found that fermented SBM had a lower in vitro IgE binding capacity than unfermented SBM, which reduced allergic reactions when FSBM is introduced into the diet.
Fermentation carried out in several stages is promising. Two-stage fermentation using B. subtilis followed by E. faecium is known to be an effective approach to improving the quality of feed from soybean meal. As a result, the content of lactic acid (a natural preservative), crude protein, and total phosphorus increased; but the amount of soybean antigenic proteins (β-conglycinin and glycinin), hemicellulose, and phytate decreased [12].

2. Materials and Methods

2.1. Soybean Meal

Samples of SBM were provided by the Sodruzhestvo Group of Companies (Svetly, Kaliningrad region, Russia). This product is produced in-house by direct extraction of soybean seeds with a preliminary separation of the soy shell. SBM safety indicators comply with the Unified Veterinary (Veterinary and Sanitary) Requirements for Goods Subject to Veterinary Control (Surveillance) No. 317 of 18 June 2010. The content of crude protein in the provided samples was 48.58%, and urease activity was 0.04 pH unit.

2.2. Microorganisms

Microorganisms strains Lactiplantibacillus plantarum B5466, Saccharomyces cerevisiae Y4653, Aspergillus niger F1270, and Bacillus subtilis B7046 from the collection of the State Research Institute of Genetics and Breeding of Industrial Microorganisms of the Lactiplantibacillus Kurchatov Institute (Moscow, Russia) were used for SBM fermentation.
The Bacillus subtilis strain was cultivated at 37 °C for three days on meat-peptone agar (g/L): peptone—5, beef infusion—3, bacteriological agar—15. The Aspergillus niger strain was cultivated at 26 °C for three days on Czapek medium (g/L): sucrose—30, sodium nitrate—2, potassium hydrogen phosphate—1, magnesium sulfate—0.5, potassium chloride—0.5, iron sulfate—0.01, agar bacteriological—15.0. The Saccharomyces cerevisiae strain was cultivated at 28 °C for three days on YEPD agar (g/L): dextrose—20, peptone—20, yeast extract—10, bacteriological agar—15. The Lactiplantibacillus plantarum strain was cultivated at 28 °C for three days on a medium for lactic acid bacteria (g/L): casein hydrolyzate—20, yeast extract—5, gelatin—2.5, glucose—5, lactose—5, sucrose—5, sodium chloride—4, acetate sodium—1.5, ascorbic acid—0.5, bacteriological agar—15.

2.3. Soybean Meal Fermentation

Two hydromodules were used 30:110 and 30:130 (SBM:water), respectively. These SBM:water ratios were chosen because they provide optimal mixing of the biomass during deep fermentation, and also do not require a lot of energy to further dry the wet SBM. Before fermentation, a 30 g sample of SBM was placed in a 250 mL glass flask and 110 mL of distilled water was added for hydromodule 30:110 (SBM:water). Similarly, for the hydromodule 30:130 (SBM:water), a 30 g sample of SBM was placed in a 250 mL glass flask, followed by 130 mL of distilled water. SBM was autoclaved at 121 °C for 15 min. To prevent the development of foreign microflora, SBM samples were pre-sterilized at a temperature of 121 °C, a pressure of 0.1 MPa, and a duration of 20 min, as described by Huang et al. [13]. After sterilization, the sample was cooled, and under sterile conditions, 1 ml of culture liquid of a mixed culture of microorganisms containing strains of Bacillus subtilis, Aspergillus niger, Saccharomyces cerevisiae, and Lactiplantibacillus plantarum was added. A mixed culture of microorganisms was prepared as follows: the cells of each culture were washed twice with a sterile 0.85% NaCl solution and inoculated to give a final inoculation of 1 × 10⁷ CFU/mL. Then the resulting inoculums were mixed in a ratio of 1:1:1:1 in equal volumes. Fermentation was carried out at 37 °C and constant stirring (180 RPM) for five days. The parameters of the SBM microbial fermentation process were chosen according to the method described by the authors [9]. Fermented soybean meal (FSBM) was subsequently freeze-dried in a FreeZone 2.5 L Triad freeze dryer, −84 °C (Labconco, Kansas City, MO, USA) and ground to powder.

2.4. Protein Content Analysis

The content of soluble protein in SBM was measured by the Kjeldahl method (GOST 10846–91. Grain and products of its processing. Method for determination of protein). The Kjeldahl method is based on the ashing of organic matter with concentrated sulfuric acid with copper sulfate to form ammonium sulfate. Then, an alkali solution is added to the cooled mineralizate, as a result of which ammonia is formed, which is distilled off and titrated. The result of the determination is the calculation of the mass fraction of nitrogen in the sample and the conversion to the mass crude fraction of protein using the coefficient (6.25).
The dye-binding method (the Bradford method) was used to determine the amount of protein after fermentation [14]. The method is based on the binding of the Coomassie brilliant blue G-250 dye to amino acid residues of the protein, primarily to arginine, as well as to tryptophan, tyrosine, histidine, and phenylalanine of the SBM. It was carried out by adding 5 mL of Bradford reagent to 0.1 mL of the SBM solution in a test tube, mixing it, and letting it sit at room temperature for 30 minutes. Optical density was measured on a PE-5400UF spectrophotometer (Vikon-service, Astrakhan, Russia) at a wavelength of 595 nm in a cuvette with a layer thickness of 10 mm. A mixture of the same reagents without SBM was used as a reference solution. A calibration curve was plotted in the concentration range from 0.01 to 0.10 mg of a standard protein sample by measuring the optical density of solutions at 595 nm. The amount of dye initially added and still present in the solution was proportional to the amount of protein that was already present.

2.5. Urease Activity Analysis

Urease activity was evaluated according to GOST 13979.9–69 (Oilcakes and oilmeals. Method for measuring urease activity). The method is based on changing the pH of the phosphate buffer solution, which is formed as a result of the action of urease on the urea contained in the solution. The determination of urease activity as the main anti-nutritional factor was used, since this method is a reliable indicator of the effectiveness of hydrolysis in conditions of humidity, and also the values of this indicator in most cases correlate with another important index—trypsin inhibitor [15].

2.6. Assessment of the Hydrolysis Degree

The method is based on the neutralization of carboxyl groups of monoaminodicarboxylic acids (aspartic, glutamic) of proteins with a solution of sodium hydroxide, the amount of which spent on neutralization is proportional to the mass fraction of the protein in the sample. The Sørensen formol titration is based on the interaction of amine groups with formaldehyde (as well as other aldehydes) to form methylene derivatives. At the same time, the amino groups lose their basic properties, and the carboxyl group is titrated with caustic alkali.

2.7. Macro- and Microelement Composition

The content of macroelements was determined by capillary electrophoresis using a KAPEL-105M system of capillary electrophoresis (Lumex, St. Petersburg, Russia). The measurement method is based on acid treatment of samples, followed by separation and quantitative determination of cations by capillary electrophoresis. The components are detected by indirect absorption at a wavelength of 267 nm.
The content of trace elements in SBM was determined by X-ray fluorescence spectroscopy using the MAKS Spectroscan (Spektron, St. Petersburg, Russia) according to the adapted method FR.1.31.2014.17343 “Determination of Mg, Al, Si, Zn, P, S, K, Ca, Ba, Ti, Cr, Mn, Fe, Ni, Br, Rb, Sr in plant materials and foodstuffs”.

2.8. Ash Content Determination

The ash content of the SBM samples was determined according to GOST 10847–2019. The essence of this method is the combustion of a ground grain sample, followed by a quantitative determination of the fireproof residue.

2.9. Statistical Analysis

Each experiment was repeated at least three times and data were presented as mean ± standard deviation. Data was processed out using standard methods of mathematical statistics. The software Statistica 10.0 (StatSoft Inc., Tulsa, OK, USA) was used to provide one way analysis of variance (ANOVA). Levene’s test was used to evaluate the equality of sample variances. Significant differences between the samples were detected using the Duncan test. The significance of differences between the mean values was taken at p < 0.05.

3. Results

3.1. Degree of FSBM Hydrolysis

Throughout the experiment, the dynamics of the degree of SBM hydrolysis by a mixed culture of probiotic microorganisms (Bacillus subtilis, Aspergillus niger, Saccharomyces cerevisiae, Lactiplantibacillus plantarum) were monitored. At hydromodules (SBM:water) 30:110 and 30:130, an increase in the degree of hydrolysis was observed on the second day. On the second day of enzymatic hydrolysis at a hydromodule 30:110, the percentage of amine nitrogen was 2.15% (which exceeds the value of this indicator in the sample on the first day of fermentation by 22.8%). At a hydromodulus of 30:130, the percentage of amine nitrogen on the second day of enzymatic hydrolysis was 1.91% (which exceeds the value of this indicator in the sample on the first day of fermentation by 13%). The maximum content of amine nitrogen is observed on the third day with both hydromodules (2.99% for the hydromodule 30:110 and 2.45% for the hydromodule 30:130), but on the fourth day of the experiment, this value decreases to 2.30% for the hydromodule 30:110 and 1.73% for the hydromodule 30:130. On the fifth day, the content of amine nitrogen in the samples showed a negative trend: 2.12 % for the hydromodule SBM:water 30:110 and 1.73% for the hydromodulus 30:130 (Figure 1).

3.2. Evaluation of the Dynamics of the Crude Protein Content and Urease Activity of FSBM

The effect of microbial fermentation on the crude protein content of SBM samples was evaluated. As a result of enzymatic hydrolysis on the third day of fermentation, there was an increase in crude protein by 6.94% in the case of a hydromodulus of 30:110 and 8.46% in the case of a hydromodulus of 30:130. On the fifth day of hydrolysis, the highest protein content values were recorded: 61.45% for the hydromodule 30:110 and 60.07% (which is higher than the value on the first day of fermentation by 9.42%) for the hydromodule 30:130 (which is higher than the value on the first day of fermentation by 10.45%). However, differences in crude protein content and urease activity between hydromodules 30:110 and 30:130 are not statistically significant (Table 1).
The essence of the method for measuring urease activity is to change the pH of the phosphate buffer solution, which is formed as a result of the action of urease on the urea contained in the solution. According to the results obtained, it was found that the use of microorganisms for fermentation of SBM at a hydromodulus of 30:110 reduces the value of urease activity on the third day of enzymatic hydrolysis from 0.04 pH unit to 0.02 pH unit. Moreover, on the fourth and fifth days, this value does not change. However, on the second day, the value of urease activity is slightly higher than the initial value and was 0.06 pH unit, which may be associated with the adaptation processes of microorganisms (Table 1). However, there was no obvious link between urease activity and the duration of the hydrolysis in the fermentation variant with a hydromodule 30:130. Further, this value increased to 0.06 pH unit and dropped to a value of 0.02 pH unit.

3.3. Dynamics of the Content of Macro- and Microelements in FSBM

The content of macroelements was determined by capillary electrophoresis. As a result of SBM fermentation with a hydromodule 30:110, an increase in the content of potassium cations was observed on the second day of fermentation—the value was 3.62% (by mass). The maximum content was observed on the fourth day of enzymatic hydrolysis and this value was 3.8% (by mass), which was 0.9% higher than the initial level. At a hydromodulus of 30:130, an increase in the content of potassium cations was observed on the third day of hydrolysis (3.72% by weight) and reached its maximum value on the fourth day of fermentolysis (3.9%), after which it decreases to 3.25% (Figure 2a). The content of sodium cations increased with a hydromodule 30:110 (0.09% by weight) on the second day of SBM fermentation and reached its maximum concentration on the third day of fermentolysis—the content of cations was 0.12 % (by weight), which was 1.5 times higher than the initial content of sodium cations. Further, the content of cations sharply decreased on the fourth day (0.09% by mass) and slightly increased on the fifth day of hydrolysis (0.1% by mass). At a hydromodulus of 30:130, the content of sodium cations increased on the second day of SBM fermentation and was 0.12% by weight, which was 0.04% higher than the initial value. Then this value decreased on the third and fourth days to the initial concentration (0.08% by weight), however, on the fifth day, the content of cations increased again to 0.11% by weight (Figure 2b). There was also a positive trend in the content of magnesium ions in SBM as a result of fermentation of SBM with a hydromodule 30:110. The maximum concentration of magnesium ions was observed on the fourth day of fermentation and was 0.39% (by weight), which was 0.08% higher than the initial value. On the fifth day of fermentolysis, this value decreased and amounted to 0.34% (by weight). At a hydromodulus of 30:130, the content of magnesium ions reached its maximum concentration on the fourth day of fermentation and was 0.4% by weight, after which it decreased on the fifth day to 0.35% by weight (Figure 2c). A similar dynamic was observed when assessing the content of calcium cations. Thus, the maximum content of cations was observed on the 4th day of enzymatic hydrolysis of SBM with a hydromodule 30:110 and was 0.65% (by weight). Further, this value was reduced to 0.45% (by mass). At a hydromodulus of 30:130, the content of calcium ions was also maximum on the fourth day of hydrolysis (0.66% by weight) and then decreased on the fifth day of enzymatic hydrolysis to 0.62% by weight (Figure 2d).
The effect of microbial fermentation on the content of microelements in FSBM with a hydromodule 30:110 was studied. The content of manganese at the beginning of fermentation was 45 μg/kg and increased on the second day to 71 μg/kg, but decreased on the third day to 60 μg/kg. Its maximum content was found on the fourth and fifth days of fermentation and was 81 µg/kg. The nickel content at the beginning of fermentation was 4 μg/kg, after which its content was stable throughout the experiment and was 3 μg/kg. The zinc content increased on the second day of fermentation from 56 to 66 µg/kg, after which its content decreased to 53 µg/kg. However, on the fourth and fifth days, there was positive dynamics of the zinc content and its maximum value was 79 µg/kg on the fifth day of microbial hydrolysis. There was an increase in the content of bromine from 4 µg/kg to 8 µg/kg on the second day of fermentation. However, on the fifth day, this value decreased to 7 µg/kg. The content of strontium increased from 2 µg/kg to 28 µg/kg on the fourth day of fermentation, after which its content decreased to 25 µg/kg. The content of rubidium also increased from 9 μg/kg to 17 μg/kg on the fourth day of hydrolysis. On the second day of fermentation, the iron content reached its peak of 180 μg/kg, which was 51 μg/kg higher than the initial content. However, this value dropped to 119 μg/kg on the third day and rose to 165 on the fifth day of fermentation (Table 2).
The content of the main microelements was also evaluated for the hydromodule 30:130. Thus, the maximum manganese content was observed on the third day of fermentolysis and was 78 µg/kg, which was 33 µg/kg higher than the initial value (this value is also higher than the concentration of manganese in the case of the hydromodule 30:130 by 7 µg/kg). The nickel content did not increase during the experiment. The zinc content was maximum on the third day of microbial fermentation and was 68 µg/kg, which is 12 µg/kg higher than the initial content, however, for the hydromodule 30:130, this value was higher by 2 µg/kg. The content of bromine increased by the fourth day from 4 to 9 µg/kg. The maximum content of strontium was found on the fifth day and was 26 µg/kg (for the hydromodule 30:130, this value was higher by 2 µg/kg). Similarly to the hydromodule 30:130, the maximum content of rubidium was 17 µg/kg on the fourth day of the experiment. The iron content was also maximum on the second day of fermentation and was 182 µg/kg (Table 2).

3.4. Evaluation of FSBM Ash Content

The ash content of the samples was determined by ashing and subsequent combustion of a preliminary well-homogenized sample in a muffle furnace. When using the hydromodule 30:110, the ash content increased during the entire fermentation period and reached its maximum on the fifth day of fermentation—7.9%, which was 2.0% higher than the initial ash content (Table 3).
The ash content in the variant with the hydromodule 30:130 (SBM:water) was slightly lower than in the variant with the hydromodule 30:110 (SBM:water) and was 6.9 %, which is 1.0 % higher than the initial level (Table 3).

4. Discussion

In the present study, microbial fermentation was carried out using a mixed culture of microorganisms Bacillus subtilis, Aspergillus niger, Saccharomyces cerevisiae, and Lactiplantibacillus plantarum. We compared the degree of SBM hydrolysis by a consortium of probiotic microorganisms (Bacillus subtilis, Aspergillus niger, Saccharomyces cerevisiae, Lactiplantibacillus plantarum) for five days at different hydromodules (SBM: water) 30:110 and 30:130. It was found that the maximum accumulation of ammonium nitrogen was observed on the third day of hydrolysis for both modules (2.99% for the hydromodulus 30:110 and 2.45% for the hydromodule 30:130). With further exposure of the consortium of microorganisms to SBM, the content of ammonium nitrogen decreased. This is due to the fact that ammonium nitrogen, including ammonium salts, is the most active, mobile, and reactive form of nitrogenous compounds. It is also well absorbed by a consortium of probiotic microorganisms (Bacillus subtilis, Aspergillus niger, Saccharomyces cerevisiae, and Lactiplantibacillus plantarum), which are involved in chemical reactions. The most significant involvement of nitrogenous compounds in cellular metabolism and enzymatic reactions, which depends on the activity of enzyme systems like proteases and peptidases, occurs on the third day of the enzymatic hydrolysis process.
In addition to ammonium nitrogen, the effect of microbial fermentation on the content of crude protein in samples of soybean meal was evaluated. As a result of enzymatic hydrolysis on the third day of fermentation, there was an increase in crude protein by 6.94% at a hydromodulus of 30:110 (by the Kjeldahl method) and by 8.46% at a hydromodulus of 30:130 (by the Kjeldahl method). According to the Bradford method, the protein content increased by 7.13% at a water ratio of 30:110 and by 9.06% at a water ratio of 30:130 (by the Bradford method). The highest values of the protein content were recorded on the fifth day of hydrolysis. The values of the protein content determined by the Kjeldahl method and by the Bradford method were compared. The values differed in the direction of increased protein according to the Bradford method in the range from 2.5% to 5.4% for the 30:110 hydromodule and from 3.8% to 5.3% for the 30:130 hydromodule. The increase in the protein content determined by the Bradford method is explained by the fact that this method determines and takes into account, in addition of protein, and non-protein nitrogen. Cells of probiotic microorganisms (Bacillus subtilis, Aspergillus niger, Saccharomyces cerevisiae, Lactiplantibacillus plantarum) use nitrogenous substances to build tissues and cell structure, maintain vital activity, as well as high respiratory and enzymatic activity. The most important precursor of consumed organic nitrogen is ammonia or ammonium nitrogen, which these microorganisms assimilate in the first place, and only then consume amine nitrogen.
The urease activity of probiotic microorganisms was determined by changing the pH of the phosphate buffer solution, which is formed as a result of the action of urease on the urea contained in the solution. As a result of the studies, it was found that on the second day the value of urease activity slightly exceeds the initial value, which may be associated with the adaptation processes of microorganisms. The urease reaction can be thought of as a process of ecological mineralization of organic nitrogenous slag; as a result of this process, the water-soluble non-volatile organic substrate, urea, is transformed into volatile products, ammonia, and carbon dioxide, as a result of this enzymatic reaction. However, most of the products formed do not evaporate, but interact with each other in the SBM:water medium to form predominantly ammonium bicarbonate. The latter is absorbed by microorganisms and utilized as a source of nitrogen for the biosynthesis of proteins, nucleic acids, and other important nitrogenous bioorganic components of enzymatic hydrolysis.
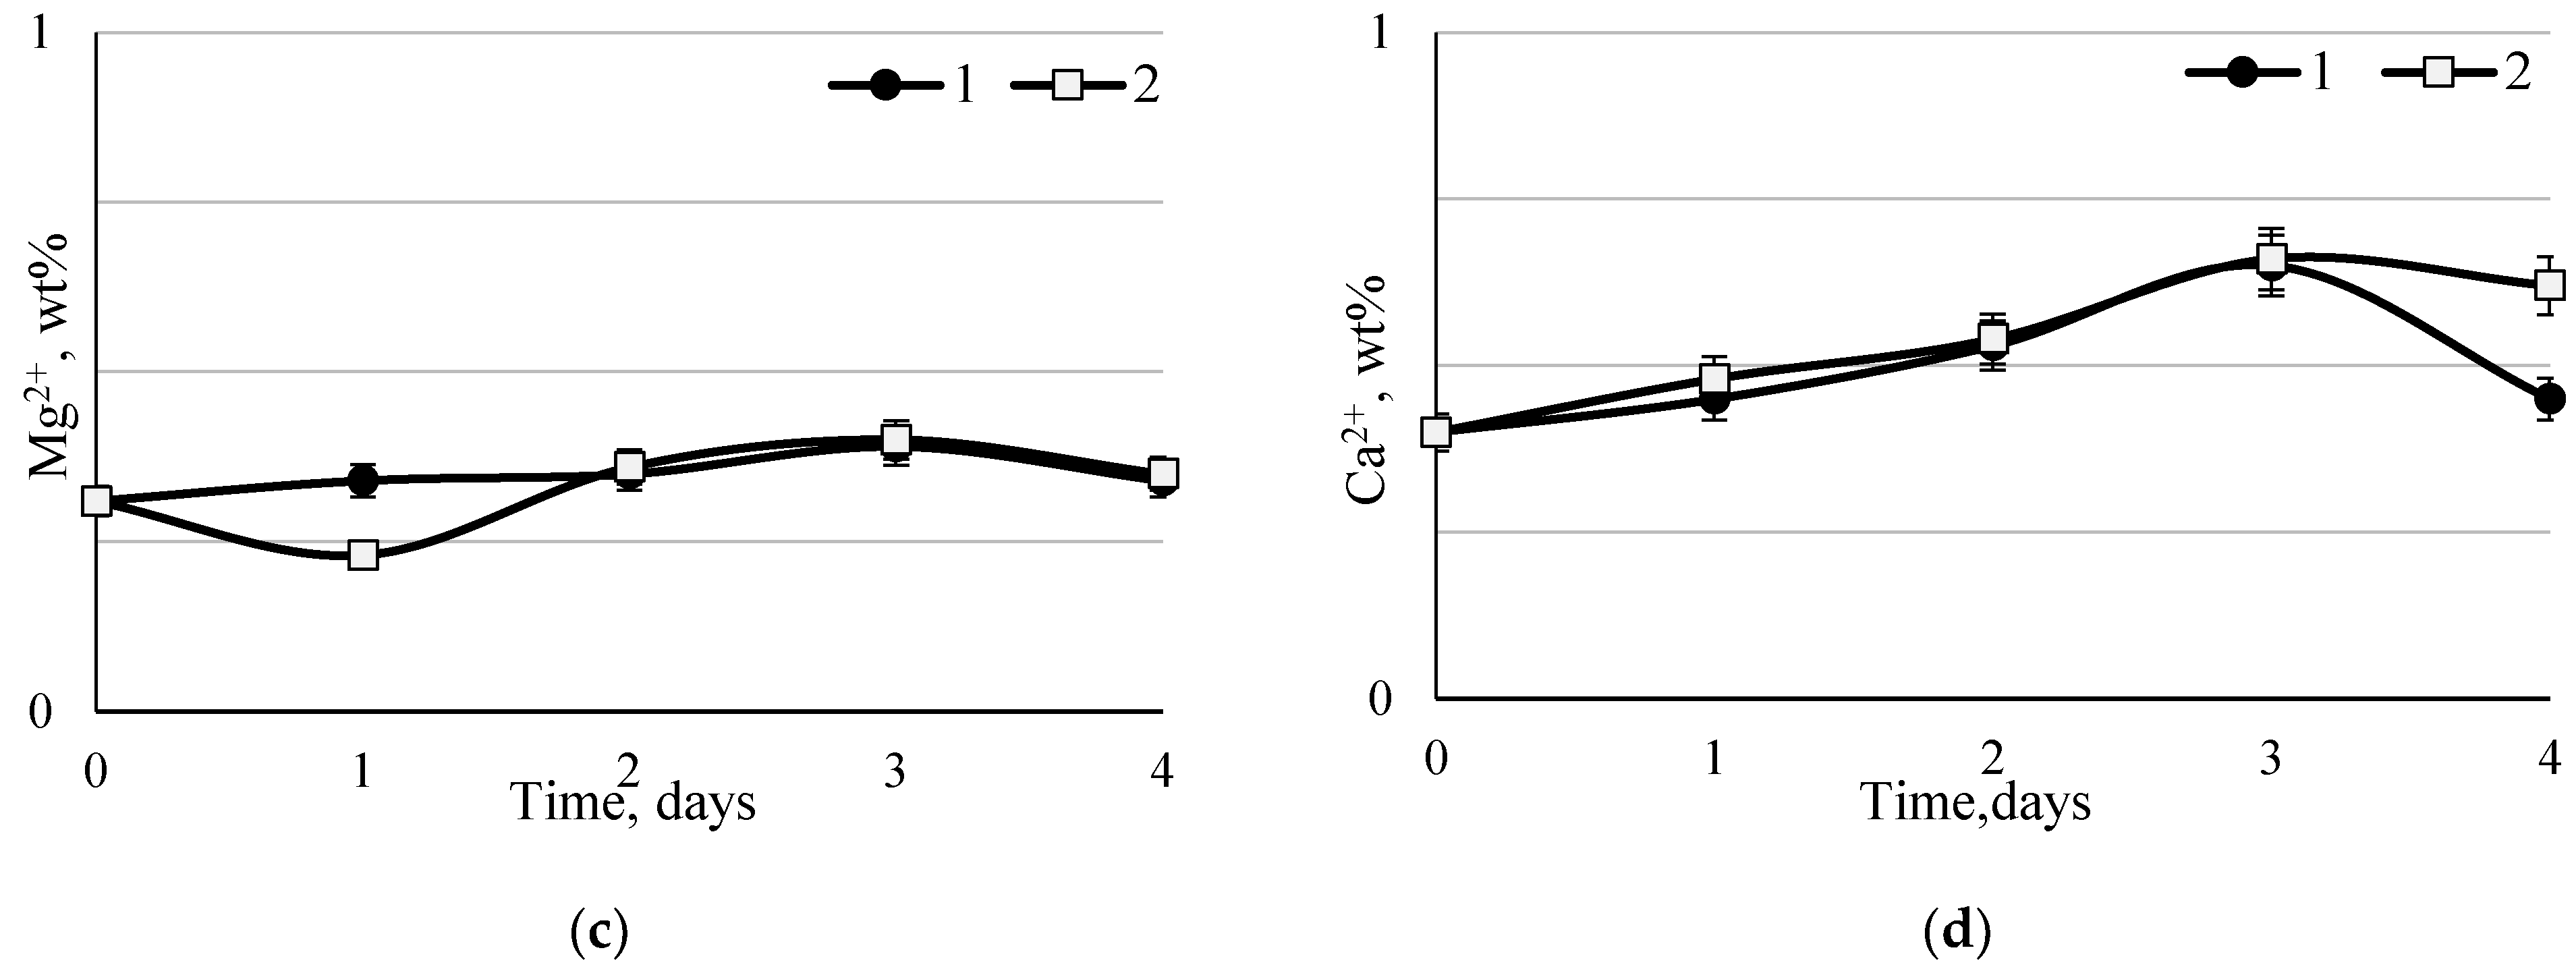
However, no clear relationship between urease activity and duration of SBM hydrolysis was found in our studies. This can be explained by the fact that the urease activity of probiotic microorganisms is detected, but is at a relatively low level, in our opinion, for three reasons: due to the low concentration of urease-positive microorganisms of the consortium used for the enzymatic hydrolysis of SBM; due to low background concentration of urea in SBM; due to the possible inhibition of microbial urease by metal ions, the maximum content of which increased on days two–four of the process of enzymatic hydrolysis of SBM by a consortium of probiotic microorganisms (Bacillus subtilis, Aspergillus niger, Saccharomyces cerevisiae, Lactiplantibacillus plantarum).
When using the hydromodulus 30:110, the ash content increased throughout the entire fermentation period and reached its maximum on the fifth day of fermentation—7.9%, which was 2.0% higher than the initial ash content. The increase in ash content as a result of enzymatic hydrolysis of SBM by a consortium of probiotic microorganisms (Bacillus subtilis, Aspergillus niger, Saccharomyces cerevisiae, Lactiplantibacillus plantarum) is probably associated with the accumulation of macro- and microelements as a result of hydrolysis and their low solubility in the medium. Our studies are in good agreement with the studies of other authors [16,17,18,19,20,21,22,23,24].
The basis of this consortium is based on similar work by researchers involved in the microbial conversion of SBM. For example, in the work of Jazi et al., a consortium containing Lactiplantibacillus plantarum, Bacillus subtilis и Aspergillus oryzae was used to ferment SBM [16]. However, the microorganism Aspergillus niger was used in the present study, as studies are known where this fermented vegetable protein sources, while reducing the level of anti-nutrients and fiber in the finished product [17,18]. Obviously, in the consortium, Aspergillus niger acts as a biocatalyst due to the destruction of the cellulose shell under the action of the synthesized enzyme β-glucosidase, which is also reported in the literature [19]. In the present study, the microbial consortium was also supplemented with the microorganism Saccharomyces cerevisiae. It was assumed that this microorganism contributes to an increase in protein content due to the rapid increase in its own biomass. This assumption was confirmed by the results obtained, indicating an increase in protein content by 9.42–10.45%. For example, in a study by Sharawy et al., using only Saccharomyces cerevisiae, a 6% increase in crude protein content was achieved within 48 h of cultivation [20]. These obtained results also give grounds to be convinced of the greater efficiency of fermentation by a consortium of a microorganism than by isolated strains.
The efficiency of microbial fermentation in this work was evaluated on the basis of several parameters, which included such a value as the percentage of amine nitrogen, which reflects the degree of SBM hydrolysis. That is, this value describes the ratio of the nitrogen of α-amino groups to the total nitrogen. The degree of hydrolysis of defatted soy flour by the microorganism Aspergillus oryzae was evaluated by the formol titration method in the present study, as well as in research by Zhao et al. So, in the work of the authors, the degree of hydrolysis increased by 17.46% (at 24 h), then a decrease of 2.05% was observed (at 44 h). However, these data do not correlate with the results of the present study, since an increase in the degree of hydrolysis was observed only by 1.33%. However, this can be explained by the initially low content of crude protein in soy flour (8.45%) and its subsequent intensive increase to 58.31% [21].
Urease activity is one of the main anti-nutritional factors evaluated during microbial fermentation of soybean meal. As already mentioned, urease activity reflects the efficiency of heat treatment of soybean meal. Urease, which is found in most legumes, can hydrolyze urea to carbon dioxide and ammonia [22]. Li et al. showed a significant decrease in urease activity during the 72-hour fermentation. At the end of fermentation, complete inactivation of urease activity was found in fermented samples [23]. The present study shows a two-fold decrease. I would also like to note that this index in most cases correlates with another important indicator of anti-nutritional factors—trypsin inhibitor [15]. In this connection, it is promising and necessary to evaluate the dynamics of the trypsin inhibitor content in further studies of microbial fermentation of soybean meal.
The practical novelty of this study is a detailed analysis of the macro- and microelement composition of SBM and FSBM. In one of the few studies on the topic of assessing the microelement composition of FSBM, Dan et al. [24] achieved an increase in the content of iron by 6.2%, zinc by 12.9%, and calcium by 46.1% using microbial fermentation of SBM. This study found that the content of macro- and microelements in FSBM increased to varying degrees, however, in general, it can be concluded that microbial hydrolysis has a positive effect on the FSBM composition. Based on the presented results, studies on the effect of various technological regimes and microbial communities on the macro- and microelement composition of soybean meal also seem promising.

5. Conclusions

The use of probiotic microorganisms increases the nutritional value of fermented soybean meal (FSBM). A positive trend in the content of crude protein compared to unfermented soybean meal (SBM) was established: the increase in protein content was 9.42% for the hydromodule 30:110 (SBM:water), and 10.45% for the hydromodule 30:130. At the same time, an increase in the degree of hydrolysis for these samples was recorded: by 44.48% for the hydromodule 30:110 and by 32.24% for the hydromodule 30:130. A decrease in urease activity was also demonstrated for the hydromodule 30:110. Regardless of the hydromodulus, it has been observed that microbial fermentation improves the mineral composition of soybean meal. However, there were no significant differences in the content of crude protein and urease activity between the samples of different hydromodule values. The ability of microorganisms in the fermentation process to increase the content of protein, essential amino acids, and macro- and microelements in SBM while decreasing anti-nutritional factors indicate the potential for using this technology for animal husbandry development.

Author Contributions

Conceived and designed the research S.S and O.B.; analyzed and interpreted the data: S.S., A.P. and O.K. (Olga Kalashnikova); contributed reagents, materials, analysis tools or data: O.K. (Olesia Krol), O.K. (Olga Kriger) and N.F.; writing—review and editing: S.S., S.I. and O.B. All authors have read and agreed to the published version of the manuscript.

Funding

This research was funded by the Prioritet 2030 program of Immanuel Kant Baltic Federal University.

Institutional Review Board Statement

Not applicable.

Informed Consent Statement

Not applicable.

Data Availability Statement

The raw data supporting the conclusions of this article will be made available to any qualified researcher on request.

Conflicts of Interest

The authors declare no conflict of interest.

References

  1. Kim, S.W.; Less, J.F.; Wang, L.; Yan, T.; Kiron, V.; Kaushik, S.J.; Lei, X.G. Meeting global feed protein demand: Challenge, opportunity, and strategy. Annu. Rev. Anim. Biosci. 2019, 7, 221–243. [Google Scholar] [CrossRef]
  2. Banaszkiewicz, T. Nutritional Value of Soybean Meal. In Soybean and Nutrition; El-Shemy, H., Ed.; IntechOpen: London, UK, 2011. [Google Scholar] [CrossRef]
  3. Li, J.; Chang, Z.; Zhang, B.; Li, X.; Sun, Z.; Pengfei, H.; Gao, Z. Effect of ambient aging during soybean meal storage on the performance of a soybean-based adhesive. Ind. Crops Prod. 2019, 140, 111725. [Google Scholar] [CrossRef]
  4. Peng, C.; Cao, C.; He, M.; Shu, Y.; Tang, X.; Wang, Y.; Wu, J. Soybean glycinin-and β-conglycinin-induced intestinal damage in piglets via the p38/JNK/NF-κB signaling pathway. J. Agric. Food Chem. 2018, 66, 9534–9541. [Google Scholar] [CrossRef]
  5. Abd El-Hack, M.E.; Alagawany, M.; Arif, M.; Emam, M.; Saeed, M.; Arain, M.A.; Khan, R.U. The uses of microbial phytase as a feed additive in poultry nutrition-a review. Ann. Anim. Sci. 2018, 18, 639–658. [Google Scholar] [CrossRef]
  6. Zhang, P.; Zhang, P.; Wu, J.; Tao, D.; Wu, R. Effects of Leuconostoc mesenteroides on physicochemical and microbial succession characterization of soybean paste, Da-jiang. LWT 2019, 115, 108028. [Google Scholar]
  7. Wang, R.; Dong, P.; Zhu, Y.; Yan, M.; Liu, W.; Zhao, Y.; Guo, H. Bacterial community dynamics reveal its key bacterium, Bacillus amyloliquefaciens ZB, involved in soybean meal fermentation for efficient water-soluble protein production. LWT 2021, 135, 110068. [Google Scholar] [CrossRef]
  8. Karakurt, Y.; Güvercin, D.; Önder, S.; Celik, C.; Tosun, R.; Baran, B.; Yaşar, S. Chemical, enzymatic, and antioxidant enrichments of full-fat soybean and sunflower meal by Bacillus subtilis fermentation using a solid-state bioreactor. Turk. J. Vet. Anim. Sci. 2019, 43, 82–93. [Google Scholar] [CrossRef]
  9. Dai, C.; Ma, H.; He, R.; Huang, L.; Zhu, S.; Ding, Q.; Luo, L. Improvement of nutritional value and bioactivity of soybean meal by solid-state fermentation with Bacillus subtilis. LWT 2017, 86, 1–7. [Google Scholar] [CrossRef]
  10. Yasar, S.; Tosun, R.; Sonmez, Z. Fungal fermentation inducing improved nutritional qualities associated with altered secondary protein structure of soybean meal determined by FTIR spectroscopy. Measurement 2020, 161, 107895. [Google Scholar] [CrossRef]
  11. Yang, A.; Zuo, L.; Cheng, Y.; Wu, Z.; Li, X.; Tong, P.; Chen, H. Degradation of major allergens and allergenicity reduction of soybean meal through solid-state fermentation with microorganisms. Food Funct. 2018, 9, 1899–1909. [Google Scholar] [CrossRef]
  12. Shi, C.; Zhang, Y.; Lu, Z.; Wang, Y. Solid-state fermentation of corn-soybean meal mixed feed with Bacillus subtilis and Enterococcus faecium for degrading antinutritional factors and enhancing nutritional value. J. Anim. Sci. Biotechnol. 2017, 8, 50. [Google Scholar] [CrossRef]
  13. Huang, C.H.; Chen, C.L.; Chang, S.H.; Tsai, G.J. Evaluation of antiobesity activity of soybean meal products fermented by Lactobacillus plantarum FPS 2520 and Bacillus subtilis N1 in rats fed with high-fat diet. J. Med. Food 2020, 23, 667–675. [Google Scholar]
  14. Kielkopf, C.; Bauer, W.; Urbatsch, I.L. Bradford Assay for Determining Protein Concentration. Cold Spring Harb. Protoc. 2020, 2020, 102269. [Google Scholar] [CrossRef]
  15. Liu, K.; Ruiz, N. Soybean trypsin inhibitor and urease activities and their correlations as affected by heating method, duration, sample matrix, and prior soaking. J. Am. Oil Chem. Soc. 2021, 98, 795–810. [Google Scholar]
  16. Jazi, V.; Ashayerizadeh, A.; Toghyani, M.; Shabani, A.; Tellez, G. Fermented soybean meal exhibits probiotic properties when included in Japanese quail diet in replacement of soybean meal. Poult. Sci. 2018, 97, 2113–2122. [Google Scholar]
  17. Jannathulla, R.; Dayal, J.S.; Ambasankar, K.; Muralidhar, M. Effect of Aspergillus niger fermented soybean meal and sunflower oil cake on growth, carcass composition and haemolymph indices in Penaeus vannamei Boone, 1931. Aquaculture 2018, 486, 1–8. [Google Scholar]
  18. Jannathulla, R.; Dayal, J.S.; Ambasankar, K.; Yuvapushpa, R.; Kumar, J.A.; Muralidhar, M. Evaluation of fungal fermented rapeseed meal as a fishmeal substitute in the diet of Penaeus vannamei. J. Coast. Res. 2019, 86, 82–89. [Google Scholar]
  19. Vazquez-Ortega, P.G.; Alcaraz-Fructuoso, M.T.; Rojas-Contreras, J.A.; López-Miranda, J.; Fernandez-Lafuente, R. Stabilization of dimeric β-glucosidase from Aspergillus niger via glutaraldehyde immobilization under different conditions. Enzyme Microb. Technol. 2018, 110, 38–45. [Google Scholar]
  20. Sharawy, Z.; Goda, A.M.A.S.; Hassaan, M.S. Partial or total replacement of fish meal by solid state fermented soybean meal with Saccharomyces cerevisiae in diets for Indian prawn shrimp, Fenneropenaeus indicus, Postlarvae. Anim. Feed Sci. Technol. 2016, 212, 90–99. [Google Scholar]
  21. Zhao, Y.; Sun-Waterhouse, D.; Zhao, M.; Zhao, Q.; Qiu, C.; Su, G. Effects of solid-state fermentation and proteolytic hydrolysis on defatted soybean meal. LWT 2018, 97, 496–502. [Google Scholar]
  22. Bracco, L.F.; Levin, G.J.; Urtasun, N.; del Cañizo, A.A.N.; Wolman, F.J.; Miranda, M.V.; Cascone, O. Covalent immobilization of soybean seed hull urease on chitosan mini-spheres and the impact on their properties. Biocatal. Agric. Biotechnol. 2019, 18, 101093. [Google Scholar] [CrossRef]
  23. Li, S.; Jin, Z.; Hu, D.; Yang, W.; Yan, Y.; Nie, X.; Chen, X. Effect of solid-state fermentation with Lactobacillus casei on the nutritional value, isoflavones, phenolic acids and antioxidant activity of whole soybean flour. LWT 2020, 125, 109264. [Google Scholar] [CrossRef]
  24. Dan, S.K.; Banerjee, G.; Nandi, A.; Ray, A.K. Nutritional evaluation of soybean meal after fermentation with two fish gut bacterial strains, Bacillus cereus LRF5 and Staphylococcus caprae CCF2 in formulated diets for Labeo rohita fingerlings. J. Fish. Sci. 2017, 5, 445–454. [Google Scholar] [CrossRef]
Figure 1. Dynamics of amine nitrogen accumulation during SBM hydrolysis by a mixed culture of probiotic microorganisms for different hydromodulus values (SBM:water): 1—30:110; 2—30:130.
Fermentation 08 00458 g001
Figure 2. Dynamics of the content of macronutrients (a) potassium cations; (b) sodium cations; (c) magnesium ions; (d) calcium cations during SBM fermentation for different hydromodules (SBM:water): 1—30:110; 2—30:130.
Fermentation 08 00458 g002aFermentation 08 00458 g002b
Table 1. Results of quantitative determination of the content of crude protein and urease activity in samples at different fermentation duration.
Fermentation Duration, DaysProtein by the Kjeldahl Method, % (on d.m.b.)Protein by the Bradford Method, %Urease, pH Unit
121212
055.66 ± 1.6753.79 ± 1.6157.62 ± 1.6755.83 ± 1.610.04 ± 0.0020.02 ± 0.002
154.01 ± 1.6253.20 ± 1.5956.93 ± 1.6255.68 ± 1.590.06 ± 0.0020.06 ± 0.002
259.81 ± 1.7958.76 ± 1.7661.03 ± 1.7960.89 ± 1.760.02 ± 0.0020.04 ± 0.002
358.24 ± 1.7556.49 ± 1.6960.79 ± 1.7558.77 ± 1.690.02 ± 0.0020.07 ± 0.002
461.45 ± 1.8460.07 ± 1.8062.99 ± 1.8463.02 ± 1.800.02 ± 0.0020.04 ± 0.002
1—hydromodule 30:110 (SBM:water); 2—hydromodule 30:130 (SBM:water). Values in a row do not differ significantly (p < 0.05) as assessed by the post hoc test (Duncan’s test). Data presented as a mean ± SD (n = 3).
Table 2. The results of quantitative determination of the content of trace elements in samples at different fermentation durations.
Fermentation Duration, DaysContent, µg/kg
MnNiZnBrSrRbFeMnNiZnBrSrRbFe
12
04545642912945456429129
171366821141806716352310182
260353820161197836882416161
381370828171557045291917151
481379725161657326252615168
1—hydromodule SBM: water 30:110; 2—hydromodule SBM: water 30:130. Data presented as a mean (n = 3).
Table 3. Results of quantitative determination of ash content in samples at different fermentation durations.
Fermentation Duration, DaysAsh Content, wt, %
12
05.9 ± 0.15.9 ± 0.1
16.3 ± 0.2 *5.6 ± 0.1 *
26.5 ± 0.2 *7.6 ± 0.2 *
37.6 ± 0.27.6 ± 0.2
47.9 ± 0.2 *6.9 ± 0.2 *
1—hydromodule SBM: water 30:110; 2—hydromodule SBM: water 30:130. Values in a row followed by the symbol “*” do differ significantly (p < 0.05) as assessed by the post hoc test (Duncan’s test). Data presented as a mean ± SD (n = 3).
Publisher’s Note: MDPI stays neutral with regard to jurisdictional claims in published maps and institutional affiliations.

