Article

Comparing VFA Composition, Biomethane Potential, and Methane Production Kinetics of Different Substrates for Anaerobic Fermentation and Digestion

by
Ali Mahmoud
,
Mohamed Sherif Zaghloul
,
Rania Ahmed Hamza
and
Elsayed Elbeshbishy
*
Environmental Research Group for Resource Recovery, Department of Civil Engineering, Faculty of Engineering, Architecture and Science, Toronto Metropolitan University, 350 Victoria Street, Toronto, ON M5B 2K3, Canada
*
Author to whom correspondence should be addressed.
Fermentation 2023, 9(2), 138; https://doi.org/10.3390/fermentation9020138
Submission received: 9 January 2023 / Revised: 25 January 2023 / Accepted: 27 January 2023 / Published: 31 January 2023
(This article belongs to the Special Issue New Insights on Sludge Fermentation)

Abstract

:
Solid waste is one of the largest sources of greenhouse gases (GHGs) today. The carbon footprint of landfills also has a large impact on global warming. Therefore, it is becoming more urgent to study the possibility of better environmentally friendly approaches for solid waste management and its safe disposal. The digestion of solid waste is a biological process that breaks down the organic content of the solid waste and thus stabilizes it. It also allows the recovery of valuable resources (such as biogas) and the utilization of stabilized waste in various industries. In this study, six substrates were studied to determine their biomethane potential (BMP) in anaerobic digestion. The substrates were fermented and digested anaerobically, and the biogas production was measured. The methane yield of food waste substrates had a higher methane yield between 354 and 347 mL/g-TCOD, and a biodegradability of 89–87%. Wastewater sludge substrates yielded between 324 and 288 mL/g-TCOD with a biodegradability of 81–73%. A kinetics analysis using first-order and Gompertz models was performed for biodegradation and methane production.

Graphical Abstract

1. Introduction

Solid waste generation has drastically, globally increased due to increasing population, urbanization, booming economy, and rising living standards [1]. The global waste volume generated is approximately 11 billion tons per year, with industrial waste having the largest share of 9.2 billion tons per year as of 2011. More than 50% of the generated industrial solid waste is centered in the Asia Pacific region, specifically in China, Japan, India, South Korea, and Australia [1]. Landfilling and the incineration of solid waste were developed mainly to decrease the final volume of waste generated, not for resource recovery. Poor management of these facilities can lead to the excessive production of greenhouse gases (GHG) and highly contaminated leachate. Methane gas emission is a major concern when using landfilling and incineration because it has a global warming potential 28–34 times that of carbon dioxide [2]. The projected methane production from landfilling will increase to approximately 43 million tons per year by 2030 from 40.7 million tons in 2020. The wastewater sector solid waste generated 23.5 million tons of methane in 2020, which is projected to increase to 25.3 million tons in 2023 [1]. The waste used in landfills has a huge potential to generate biomethane, which is beneficial in many applications. Therefore, there is a need for a more sustainable waste management technique to provide lower GHG emissions, waste elimination, and resource recovery from solid waste.
Anaerobic digestion (AD) is the biological process where microorganisms break down organic waste in the absence of air and generate biogas [3]. The generated biogas consists of approximately 60–70% methane and 30–40% carbon dioxide [4]. Other trace gases, such as hydrogen and hydrogen sulfide, can also be found in small amounts. Biogas can be used as a fuel for heat and electricity or further purified to produce biomethane, which can be used as biofuel or natural gas [5]. Organic fractions of municipal solid waste (OFMSW), food waste (FW), and wastewater sludge are most commonly treated solid wastes by anaerobic fermentation. Meanwhile, dairy, pulp and paper, and agriculture wastewater are most commonly liquid wastes treated by dark fermentation [6].
The bakery industry consumes large quantities of water, and more than half of the water is discharged as wastewater [7]. The solid waste generated from the bakery industries is mainly package waste, out-of-specified products, and waste dough [8]. Bakery waste is rich in carbohydrates and lipids with fractions of 80% and 20%, respectively, with negligible amounts of protein. Therefore, bakery waste is a promising substrate for anaerobic digestion.
Fats, oils, and grease (FOG) are common byproducts of food processing, slaughterhouses, and other industries [9]. Most of the produced FOG in various industries ends up in the wastewater stream, leading to frequent clogs in the wastewater collection infrastructure [10]. FOG is highly digestible due to its high organic content, and, therefore, it can be a good substrate to produce methane and volatile fatty acids (VFAs) in anaerobic digestion (AD) and dark fermentation processes, respectively. When performing AD using FOG as the substrate, low concentrations of FOG should be used, as it can inhibit the methanogenic activity due to the production of long-chain fatty acids (LCFAs).
Dairy waste substrates are characterized by their high organic content, with a soluble chemical oxygen demand (SCOD) of 98% of its total chemical oxygen demand (TCOD) [11]. Whey powder (WP) is one of the most studied dairy wastes in anaerobic fermentation experiments. Bengtsson et al. [12], investigated the acidogenic fermentation of cheese whey powder from a dairy in a batch experiment. It was concluded that almost all the SCOD was present as VFA after fermentation. This indicated that cheese whey powder from dairy contains a large, readily fermentable organic fraction. The high degree of fermentability of whey powder was expected since lactose, a readily fermentable disaccharide of glucose and galactose, dominates its organic fraction [12]. Table 1 shows studies performed on the anaerobic fermentation of cheese whey, including the VFA concentrations, yield, and composition.
Primary sludge (PS) is one of the most commonly used substrates in anaerobic digestion and anaerobic fermentation. PS is also a good candidate for fermentation because of its high organic and biodegradable content [17]. The fermentation of PS is relatively easier to facilitate than waste activated sludge (WAS) as it contains more organic content; hence, it is readily hydrolyzed. It is also produced in larger amounts than waste activated sludge (WAS) in wastewater treatment plants. Therefore, the production of VFAs through the fermentation of PS has been deemed a cost-effective method for wastewater treatment plants [6,18]. Table 1 shows previous studies on the fermentation of PS in terms of VFA content, yield, and fractions. Thickened waste activated sludge (TWAS) is another common substrate used in anaerobic fermentation and anaerobic digestion due to its biodegradability. However, when compared to PS, TWAS exhibits a lower potential for fermentation due to its lower organic content, as most of the organic content in WWTPs is already diminished by the time TWAS is produced. TWAS is still stabilized using AD due to the adverse environmental impact if it is landfilled. The characteristics of TWAS in fermentation are shown in Table 1. The variation of the VFAs’ yield, the VFAs’ concentration, and the VFAs’ fractions can be attributed to the source of PS and TWAS, as well as the operating conditions, such as the temperature and pH. Ji et al. [28], investigated the characteristics of concentrated PS and WAS and showed that the SCOD of both substrates is significantly less than their TCOD. The slow hydrolysis of complex organic content delays VFA production [6]. The co-fermentation of PS and WAS at a volatile suspended solids (VSS) ratio of 1:1 has improved the production of VFA by 40% [6].
Food waste (FW) is generated from the different stages of food production, such as agriculture, processing, manufacturing, and consumption, with most of the FW ending up in landfills or incineration facilities. The FW that ends up in landfills contributes to 3.3 billion tons of carbon dioxide equivalent per year of GHG emissions. FW is also the most significant fraction of municipal solid waste (MSW), with an annual production of approximately 1.3 billion tons in 2011, which is projected to rise to 2.2 billion tons by 2025 [29,30]. In order to establish a circular economy, recycling FW can be beneficial as it can be used to produce biofuels, biofertilizers, and industrial biochemicals [31]. FW is a promising substrate for resource recovery due to its high organic content, especially its high concentrations of proteins, lipids, and carbohydrates [6,32]. According to Zhang et al., [33], the moisture content of FW ranges between 74–90%, with a carbon-to-nitrogen ratio (C/N) of 14.7–36.4 and a volatile solids to total solids ratio (VS/TS) of 80–97%. Moreover, FW’s carbohydrates and proteins contents are 36% and 21% of the VS, respectively. However, the lipidic and lignocellulosic components of FW can lead to the inhibition of the methanogenesis stage of AD when present in high concentration. Therefore, the FW’s characterization is important to obtain its full potential in the digestion and fermentation processes. The VFAs content, fractions, and fermentation yield are shown in Table 1.
It is still unclear which type of waste yields more VFAs in anaerobic fermentation. Various factors play effective roles in VFA production, such as operational parameters and inoculums used. However, the types of waste used in anaerobic fermentation are often characterized by their high total COD > 4000 mg/L and must be rich in organic content [6]. In this research, the VFA composition of different substrates is analyzed for six different substrates. Additionally, the biogas and methane production is quantified for each of the substrates. The objective of this work is to help with the selection of suitable substrates in fermentation and anaerobic digestion according to the objectives of the process, whether VFA production or methane generation.

2. Methods

2.1. Inoculum

The inoculum utilized for the fermentation and AD experiments was obtained from the Ashbridge Bay wastewater treatment plant (AWTP) in Toronto. This plant is one of four treatment plants located in Toronto with a capacity of 818 ML/day. The digestion process in AWTP consists of 20 primary digesters, and the methane gas generated is used as fuel for plant needs. All the digesters were operated at a mesophilic temperature range (34–38 °C). The average digester hydraulic retention time (HRT) and organic loading rate (OLR) were approximately 20 days and 1.1 kg TVS/m3 of digester capacity per day, respectively. The anaerobic digesters in AWTP receive approximately 1600 m3/d TWAS and 6500 m3/d primary sludge. The inoculum was obtained from the anaerobic digester effluent during the summer season (June 2021). The digester inoculum was black in color and had an average VSS of 11.7 g/L and a SCOD of 320 mg/L.

2.2. Substrates

PS and TWAS were two municipal substrates used in the fermentation experiment of this study. These two substrates were obtained from AWTP. PS was obtained from the bottoms of the primary clarification tank before being sent to the anaerobic digester for further treatment. As for TWAS, it was obtained from the effluent of the dissolved air flotation tank, which is used to thicken WAS using air and thickening polymer used as a coagulant.
FW samples were obtained from Storm Fisher Biogas Facility located in London, Ontario, Canada. This facility is an anaerobic digestion plant that generates biogas through municipal source-separated organics, industrial, commercial and institutional waste, packaged, liquid, and solid FW. As of 2021, the facility processes 70,000 tons of organic waste yearly, which led to the elimination of 8000 tons of GHG emissions and the production of three million m3 of renewable natural gas (RNG).
The FOG and BP + KW waste substrates were collected from Walker Environmental Group, Niagara Falls, Ontario, Canada. Walker Environmental Group is a division of Walker industries that specializes in resource recovery and waste management. Furthermore, it is one of North America’s largest commercial and industrial grease interceptor material collectors. Walker Environmental also owns and operates food processing facilities, landfills, biosolids processing plants, landfill gas renewable energy projects, and waste haulage facilities.
The powdered form of whey permeate was collected from Agropour Dairy Cooperative, Quebec, Canada. The whey powder was diluted with deionized water in order to create a liquid sample that could be utilized in the fermentation experiment. The full characteristics of the substrate and inoculum listed in our previous work [34]. Figure 1 shows a summary of the seed and substrates characteristics.

2.3. Substrate Fermentation

The acidogenic fermentation experiments of the six substrates were performed in batch reactors, each with a working volume of 1800 mL. This experiment was conducted at a mesophilic temperature of 37 °C. The wastewater examinations for the experiments were performed according to the Standard Methods for Examination of Water and Wastewater (APHA, 2012). The characterization analysis on the soluble contents of these substrates was conducted once when the substrates were collected from the plants and once again before the start of the experiment to ensure no changes occurred in their characteristics. Samples were homogenized before being fed into the reactors using a blender to ensure even distribution. A Food-to-microorganisms (F/M) ratio of 1.0 gTCOD/gVSS was selected, and the corresponding volume (V) of the substrate was calculated using Equation (1):
V s u b s t r a t e = F M × V S S i n o c u l u m × V i n o c u l u m g   T C O D s u b s t r a t e
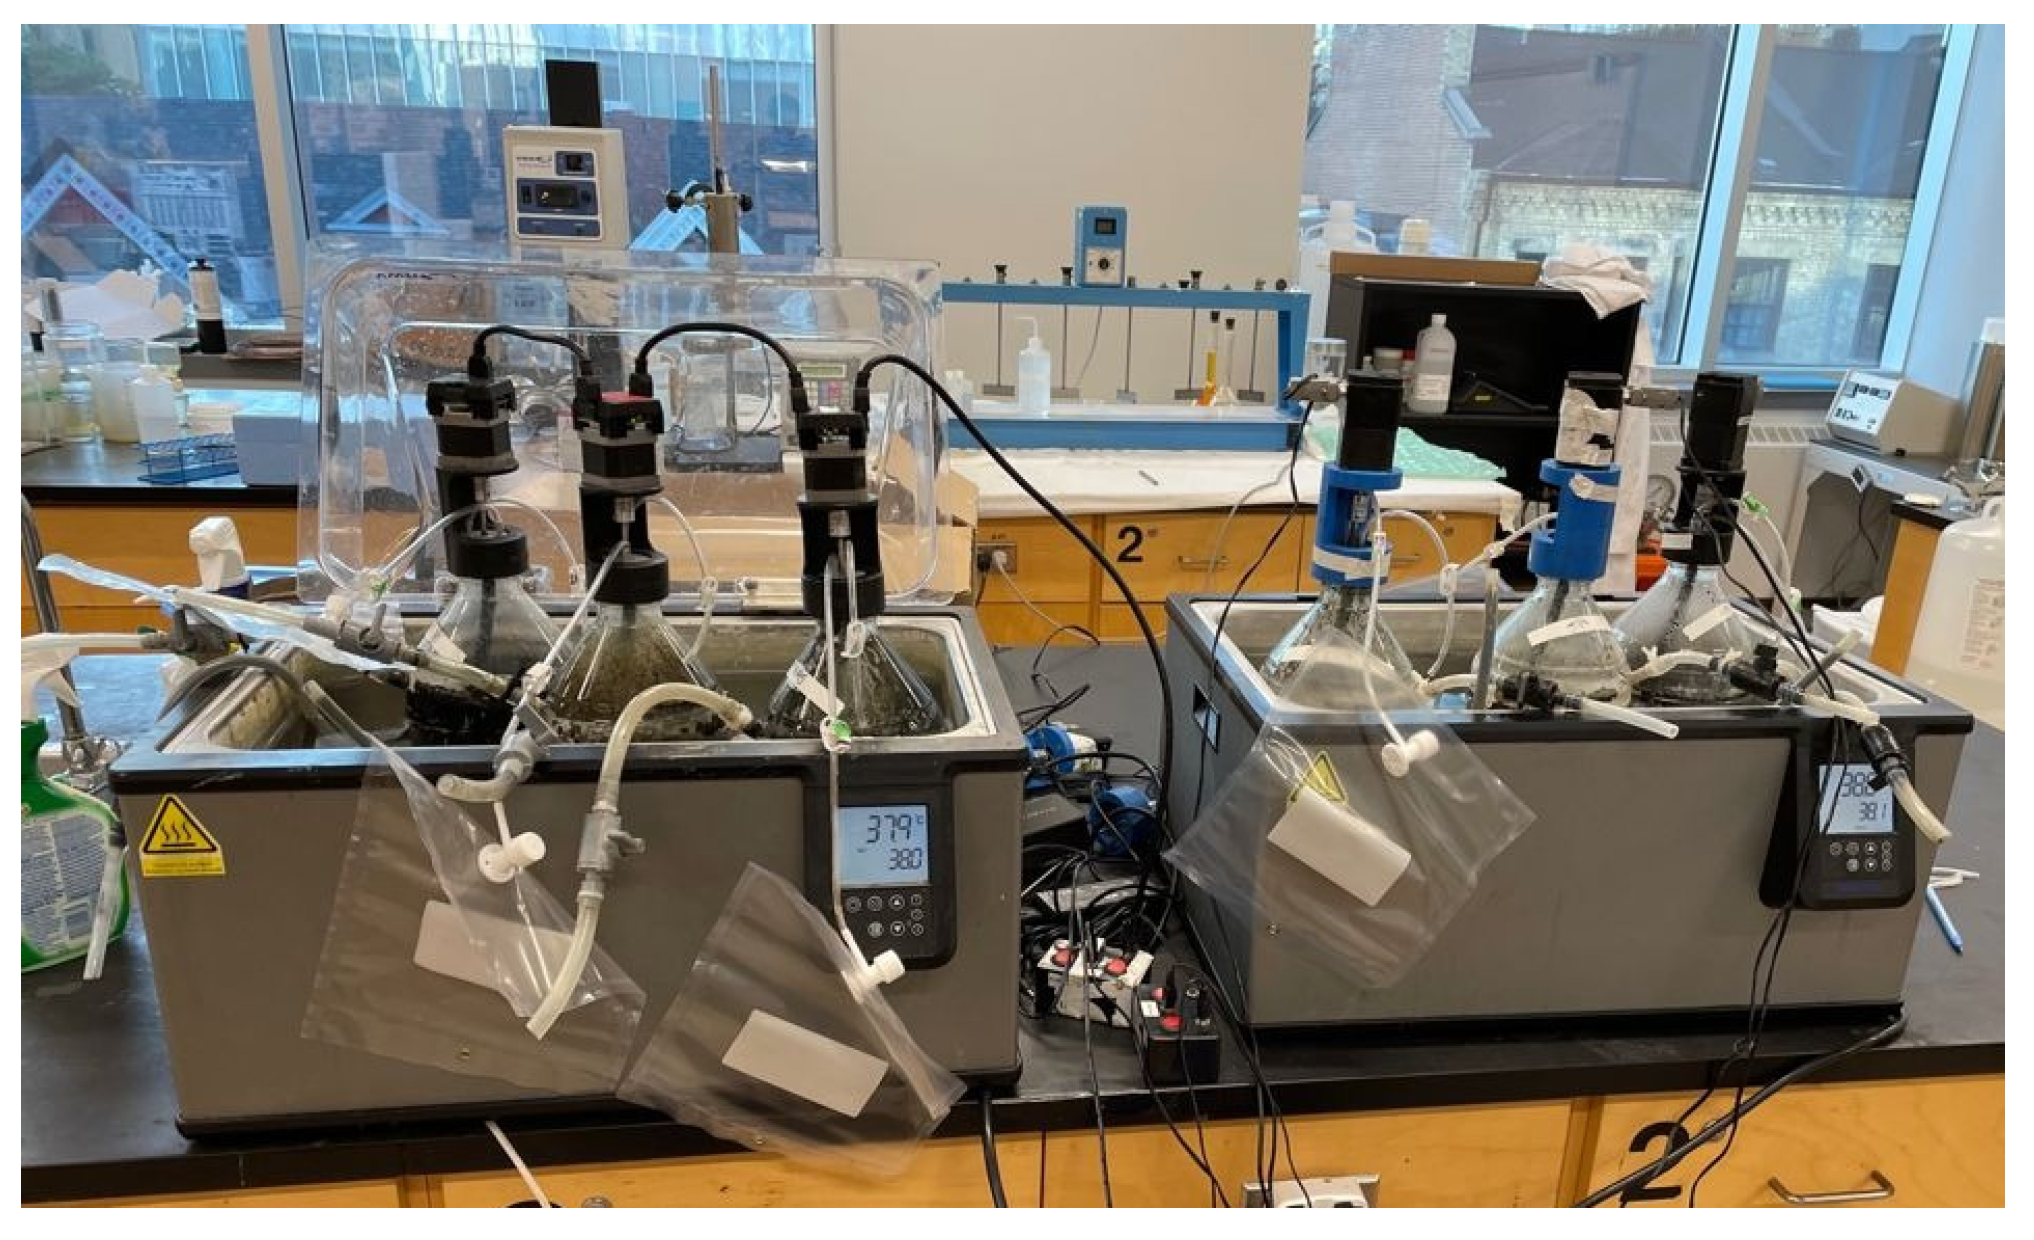
The inoculum preparation was conducted according to the protocol detailed in [35], where the inoculum was heated at 75 °C for 30 min to eliminate the methanogens and enrich the hydrogen-producing bacteria. The fermentation experiment was conducted according to the protocol detailed in Bazyar Lakeh et al. [36], where the inoculum and substrate were mixed inside the batch reactor and the pH was adjusted to 5.5 using either HCL or NaOH. The substrates for this experiment were not pre-treated to be able to examine the potential of VFAs recovery. After adding the inoculum and the substrates, each batch reactor was purged with nitrogen gas for 5 min to ensure anaerobic conditions in the reactors. The reactors were then sealed with a mixer rotating at a speed of 120 rpm to ensure proper mixing within the reactor. The reactors were then placed in incubation units for 72 h at a temperature of 37 °C to ensure mesophilic conditions. Samples were taken every 24 h for three consecutive days to allow for comparison between the different HRTs for the different substrates. The reactor setup is shown in Figure 2.
The VFA composition was measured using gas chromatography after filtering samples through a 0.45 µm filter. The gas chromatograph (GC) was the Varian 8500 (Varian Inc., Toronto, Ontario, Canada), equipped with a flame ionization detector (FID) and a fused silica column measuring 30 m × 0.32 mm. The carrier gas was Helium, and the flow rate was 5 mL/min. The temperatures of the column and the detector were 110 and 250 °C, respectively.

2.4. Biochemical Methane Potential

The biochemical methane potential (BMP) experiment was performed to determine the methane potential of the different feedstocks. The fermentation effluents were collected and centrifuged. The supernatants were used as the feedstocks for the AD experiments. Before starting the BMP experiments on all substrates, the inoculum was degassed for 7–10 days in order to calculate the amount of biogas produced from the substrates alone. All the experiments were performed in duplicates; therefore, the total number of batch digesters being ran simultaneously was 12.
The reactor used in the AD experiments had a total volume of 250 mL and a working volume of 200 mL. The specific amount of substrate to inoculum added to each digester was calculated based on the food-to-microorganism (F/M) ratio of 1 g-TCOD/g-VSS. Table 2 shows the volumes of seed and substrate in each digestion or fermentation reactor. After feeding the digesters with the substrates, the digesters were purged with nitrogen gas for 3 min at ten psi in order to discharge any excess oxygen and maintain the required anaerobic condition. Furthermore, the pH of the AD systems must be between the range of 6.5–7.5 [37]. Therefore, the pH for all the digesters was adjusted using hydrochloric acid or sodium hydroxide. The digesters were then sealed with a rubber septum and plastic cap and placed in the digesters with a rotational speed of 160 rpm and a mesophilic temperature of 37 °C. Gas measurements were then obtained daily for the first week and then periodically for the remainder of the experiment. The experiments stopped when the biogas production was zero or negligible, which was observed after 38 days.
A 100 mL Gastight Luer-Lock glass syringe was utilized to measure the daily volume of the biogas produced. The rate of measuring the gas produced slowed down when the gas production rate decreased over time. Thermo Scientific Trace 1310 GC (Waltham, MA, USA) was utilized to determine the fraction of biomethane produced in the AD experiments. This GC was equipped with a thermal conductivity detector (TCD), with the temperature of the detector set to 100 °C. The molecular sieve column’s dimensions used within the detector were 30 m in length and 0.53 mm in diameter, and the temperature was set to 90 °C. Argon was used as the carrier gas at a flow rate of 30 mL/min.

2.5. Biodegradability

The anaerobic biodegradability of substrates was calculated using the ratio between the actual and theoretical methane production, as shown in Equation (2).
B D C H 4 ( % ) = B o , E x p B o , T h × 100
where B o , E x p is the measured ultimate methane production (mL) and B o , T h is the theoretical methane production per mass of the initial TCOD of the substrate and is calculated using Equation (3) [38].
B o , T h = T C O D s u b s t r a t e × V A d d e d   D u b s t r a t e × T h e r o r e t i c a l   M e t h a n e   Y i e l d

2.6. Gompertz Kinetics

In the batch experiments, the progression of cumulative methane production was depicted by the following modified Gompertz model [39]:
H = P × exp { exp [ R m e P ( λ t ) + 1 ] }
where H is the cumulative methane production (mL), P is the maximum methane production (mL), Rm is the maximum methane production rate (mL/h), λ is the lag phase time (h), t is the incubation time, and e = exp (1) = 2.718.
The COD mass balance was determined based on the initial and final TCOD values of the contents contained within the serum bottles. This value was calculated using Equations (5)–(7), as follows:
M a s s I n i t i a l / f i n a l C O D   i n t i a l f i n a l C O D   ( g L ) × (   v o l u m e   o f   s u b s t r a t e + v o l u m e   o f   s e e d )   m L 1000 m l L
C O D   e q u i v a l e n t   t o   C H 4 = C u m u l a t i v e   M e t h a n e   p r o d u c e d   ( m L ) 398   m L C H 4 g C O D a d d e d    
C O D   m a s s   b a l a n c e   % = [   C O D   e q u i v a l e n t   o f   C H 4 + M a s s   F i n a l   C O D   ( g ) ] M a s s   i n i t i a l   C O D   ( g ) × 100 %

2.7. First-Order Kinetics

In general, the rate-limiting step of anaerobic digestion of particulate wastes is the first step of hydrolysis or solubilization, where the cell wall is broken down, allowing the organic matter inside the cell to be available for biological degradation. Since the most widely used hydrolysis model is the first order, anaerobic digestion is generally described as a first-order reaction with respect to substrate concentration (Equation (8)) and methane production (Equation (9)):
dS/dt = −k·S
d[(BoB)/Bo]/dt = −k·[(BoB)/Bo]
where k is the first-order kinetic constant (d−1), t is the digestion time (d), and S represents the residual substrate (organics) concentration (mg/L) at any time t. As S is a difficult parameter to measure, it is preferable to derive the model by using gas measurement, in which Bo is the ultimate methane production at the end of the experiment corresponding to the initial substrate concentration (So) and B is the methane production corresponding to the substrate consumed, i.e., S = Bo − B. The value of the first-order kinetic constant, k, can be obtained as the slope of the linear curve of ln [(Bo−B)/Bo] vs. t.

3. Results

3.1. Fermentation

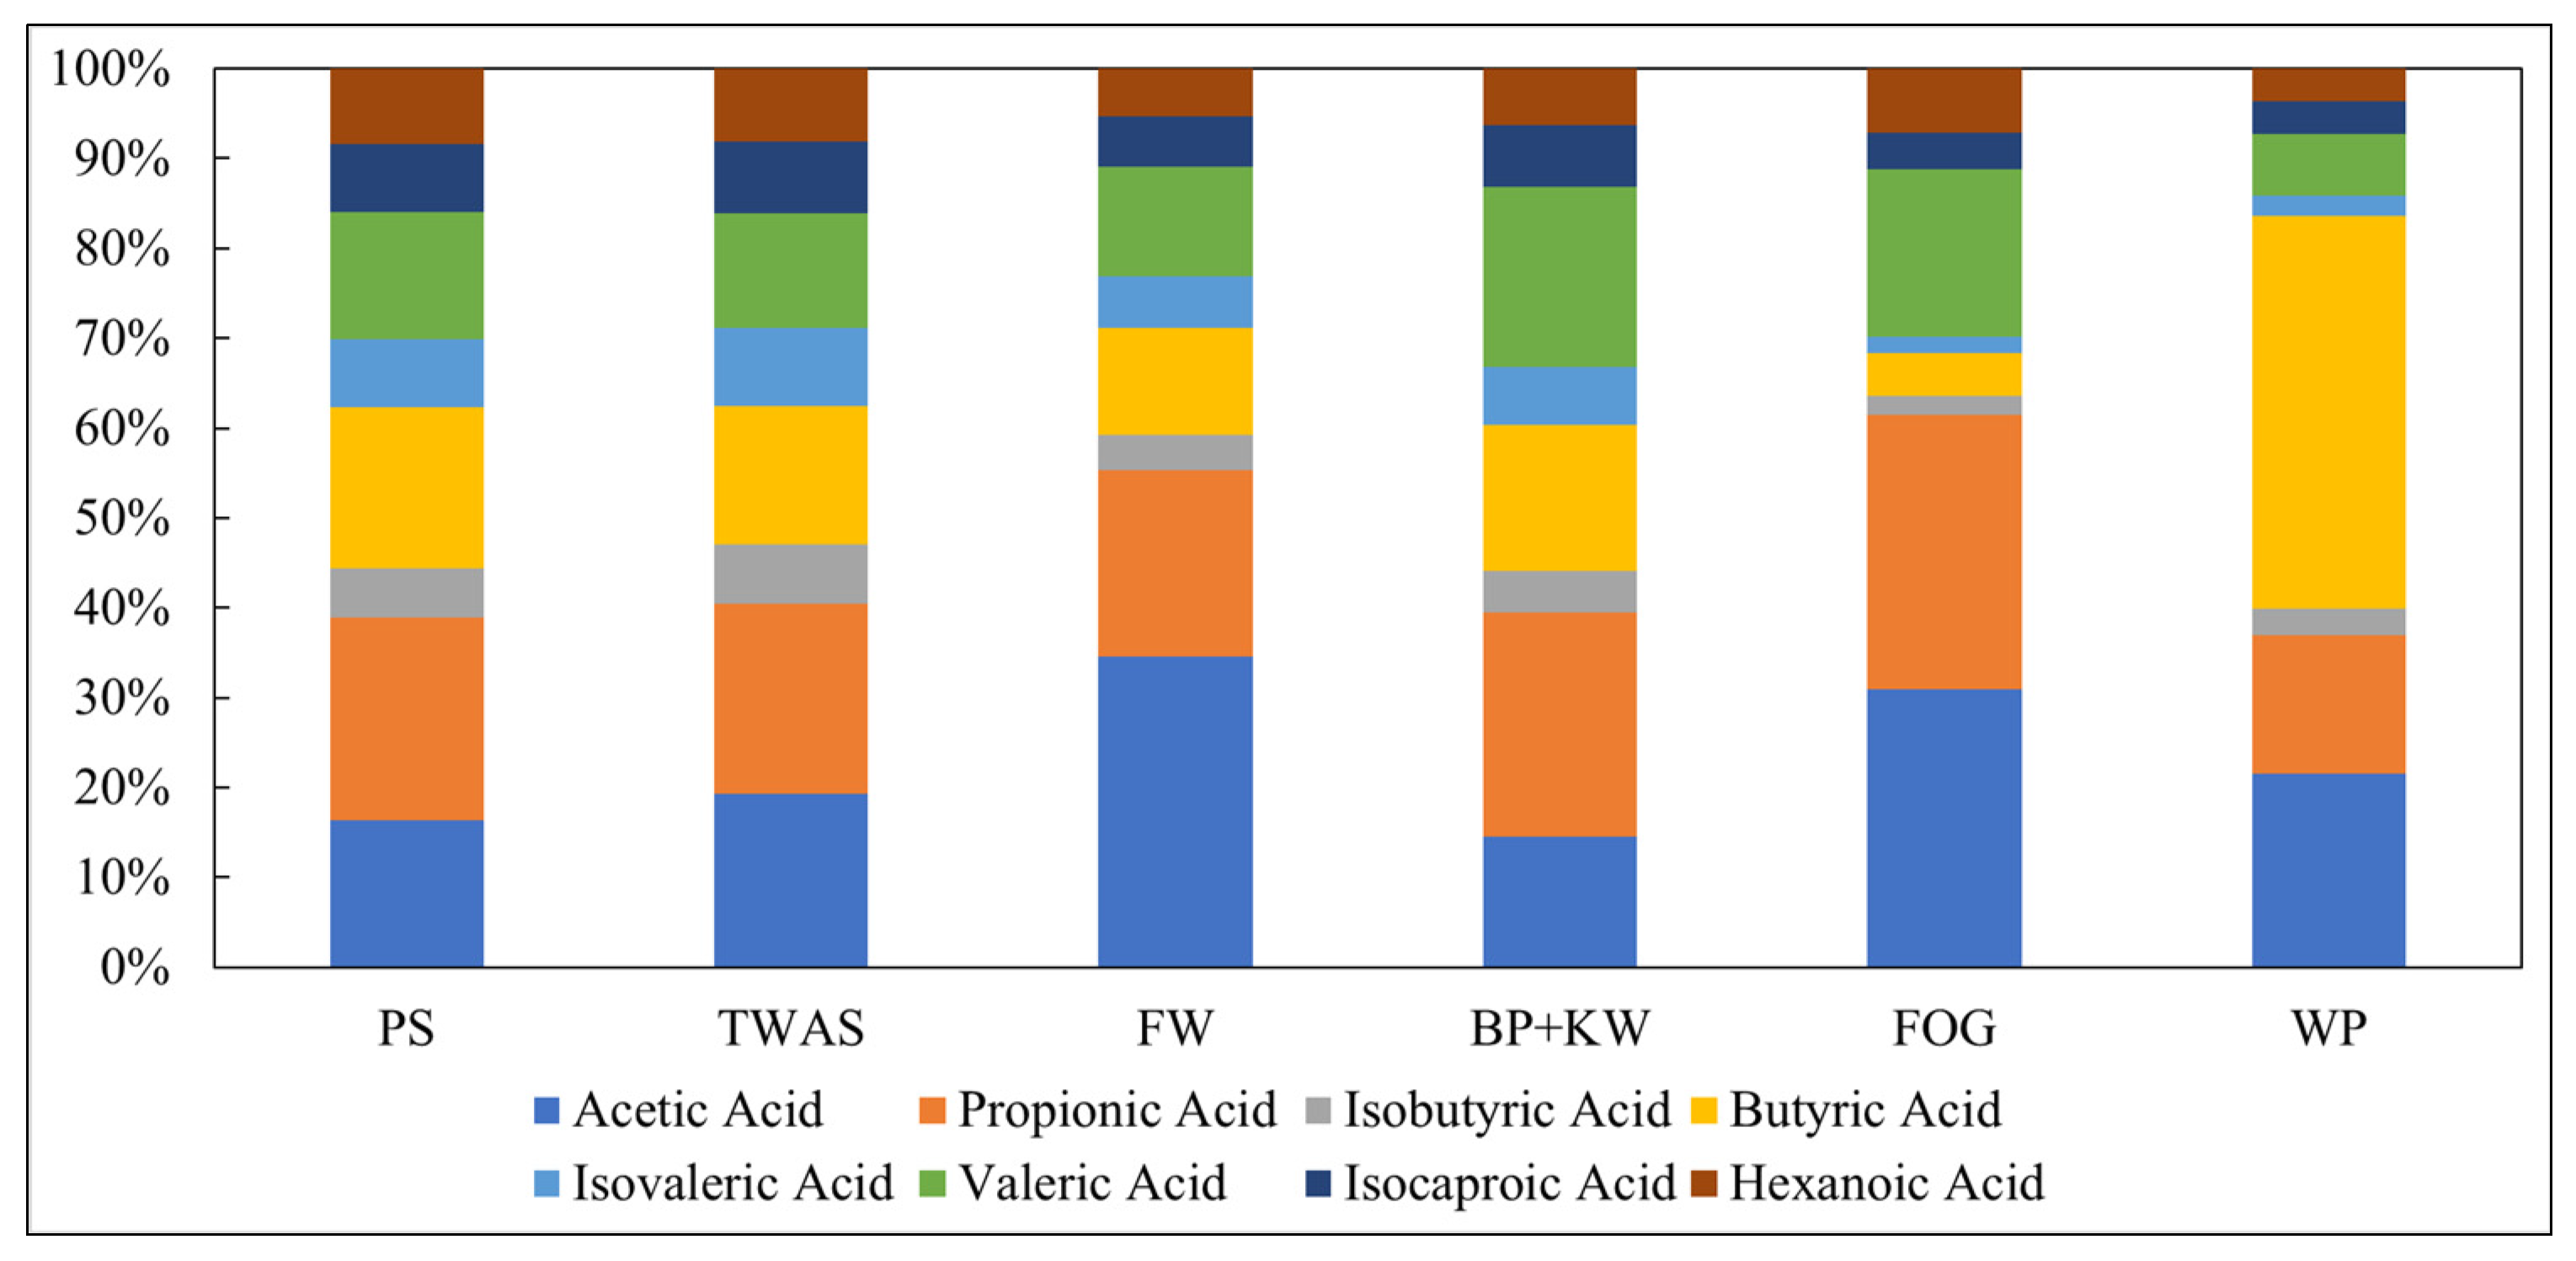
The type of substrate used in the fermentation process determined the amount and composition of the resulting VFAs, as shown in Figure 3. Acetic, propionic, butyric, and valeric acids were found at the highest abundance with all substrates utilized, which is common with the degradation of carbohydrates and lipids [40]. The FW substrate had the highest acetic acid fraction of 35% and a concentration of 1419 mg/L, which is consistent with the fractions of acetic and butyric acids generated in the fermentation of carbohydrates-rich substrates provided in the literature [41,42]. The FOG substrate had an acetic acid fraction and concentration of 31% and 801 mg/L, making it a suitable substitute for FW if acetic acid is desired for use in industries such as paint, rubber, pesticides, and food preservatives [43]. Acetic acid is also desired for the biological nutrient removal process in carbon-deficient wastewater [44]. On the other hand, the BP + KW yielded the lowest acetic acid fraction of 15%.
The fermentation of FOG yielded the highest amount of propionic acid with a fraction of 30%, while the least optimal fraction was obtained from the fermentation of WP of 15%. The fraction of propionic acid is in agreement with other studies that reported a fraction between 15% and 20% [12,14]. A propionic acid fraction of 21% was obtained from PS, in line with the values of 19% reported in the literature [20]. Propionic acid is used in pesticides, pharmaceuticals, and as a carbon source for biological nutrient removal. Therefore, the FOG should be used as a substrate if propionic acid is desired [44,45].
Butyric acid was the highest fraction of VFAs produced in the fermentation of WP at a fraction of 44% and a concentration of 70,000 mg/L, which aligns with other studies that reported a fraction of 55% from the fermentation of glucose and carbohydrate-rich FW [41,46]. The fermentation of FOG, on the other hand, resulted in the lowest content of butyric acid at 5%. Butyric acid is needed for the denitrification process, manufacturing of chemicals and pharmaceuticals, and as a biofuel [44,47]. Therefore, the WP should be chosen as a substrate for fermentation if butyric acid is desired. The valeric acid was produced by all substrates with content fractions ranging between 7% and 21%, where the highest production was in the fermentation of FOG, while the lowest was in that of WP. Other acids, such as isocaproic, isobutyric, isovaleric, and hexanoic acids, were produced at lower amounts with collective fractions ranging between 12% and 30%.

3.2. Biomethane Production

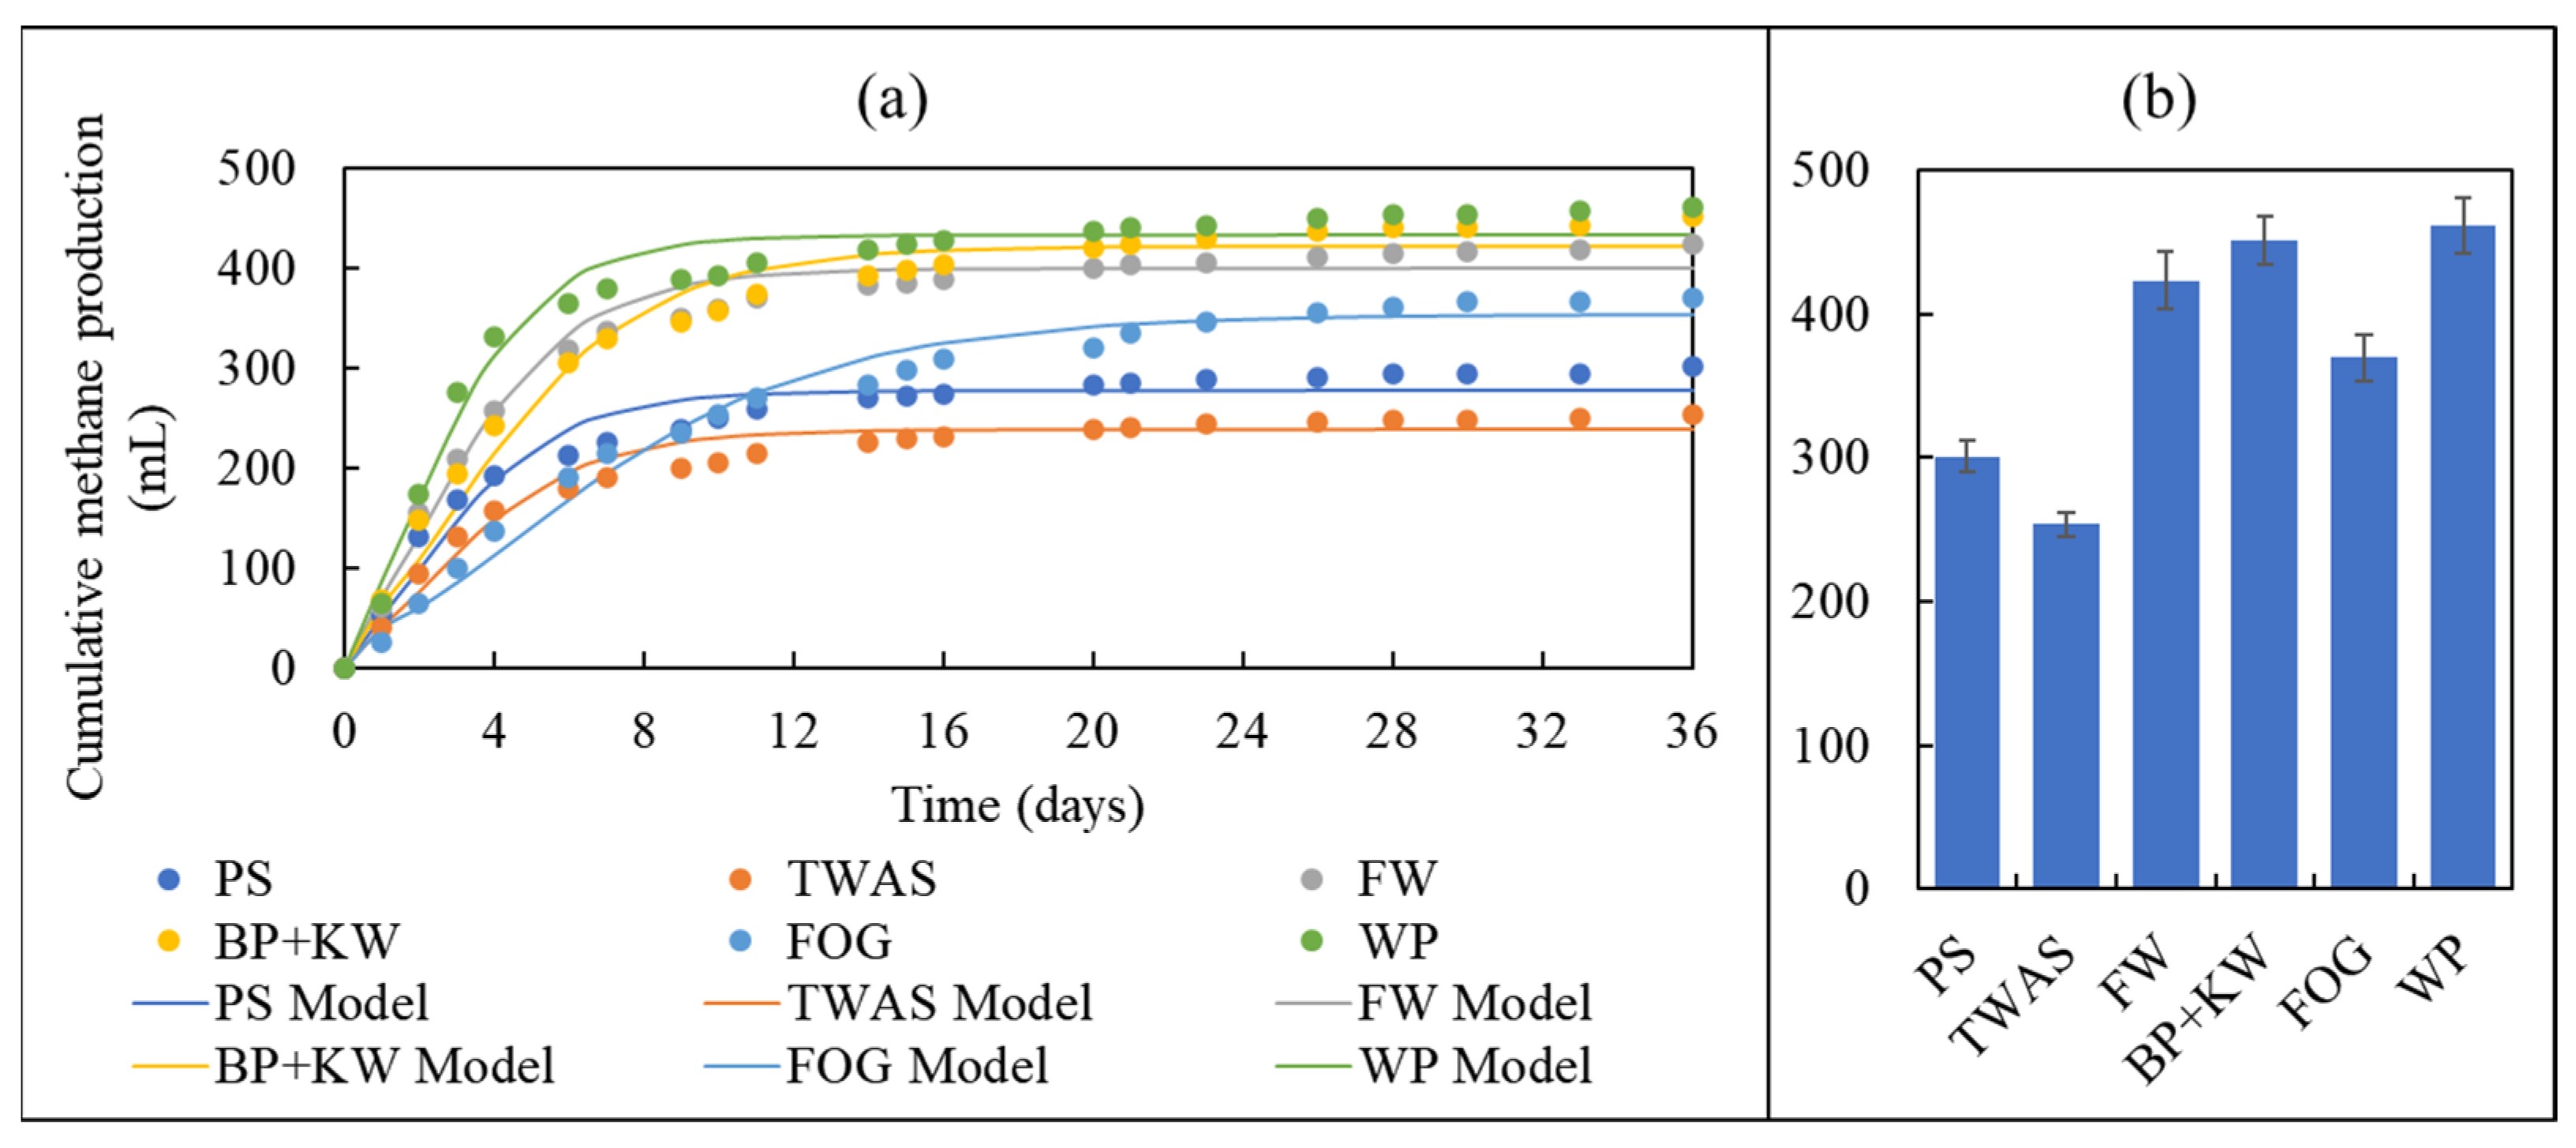
The substrate type directly impacted the performance of the AD processes parameters such as cumulative methane production, methane production rate, and methane yield. The results showed that WP was the superior substrate for cumulative methane production and ultimate methane yield, followed by BP + KW, FW, FOG, PS, and TWAS, respectively.
Figure 4 shows the cumulative methane production and ultimate methane production of the different substrates. As shown in Figure 4a, methane production started right away from day 1 with no lag phase for all substrates. The methane production increased for all substrates with different magnitudes at the different production stages. For all substrates but FOG, the first stage exhibited exponential methane production from day 0 to day 4. The second stage of methane production was steady from day 4 to day 11. The third stage also exhibited a steady methane production rate from day 11 to day 20; however, the magnitude of methane production in this stage was less than that of the second stage. The final stage had the lowest methane production magnitude, and the ultimate methane production was reached at day 36. FOG exhibited the same trends; however, its stages took a longer time than those of the other substrates. The first stage of FOG was approximately seven days. The second stage was a steady methane production from day 7 till day 16. The third stage also exhibited a steady methane production from day 16 till day 23, with a lower magnitude than the steady production observed in stage two. The final stage had the lowest methane production rate, and the ultimate methane production was reached at day 36. Moreover, the Gompertz model was fitted to all the different substrates, and the coefficient of determination ranged between 0.978–0.992, which shows a good fit of the experimental data to the model. As shown in Figure 4b, the maximum cumulative methane production with a value of 462 mL CH4 was achieved when WP was the substrate for AD, followed by BP + KW, FW, FOG, PS, and TWAS, respectively.
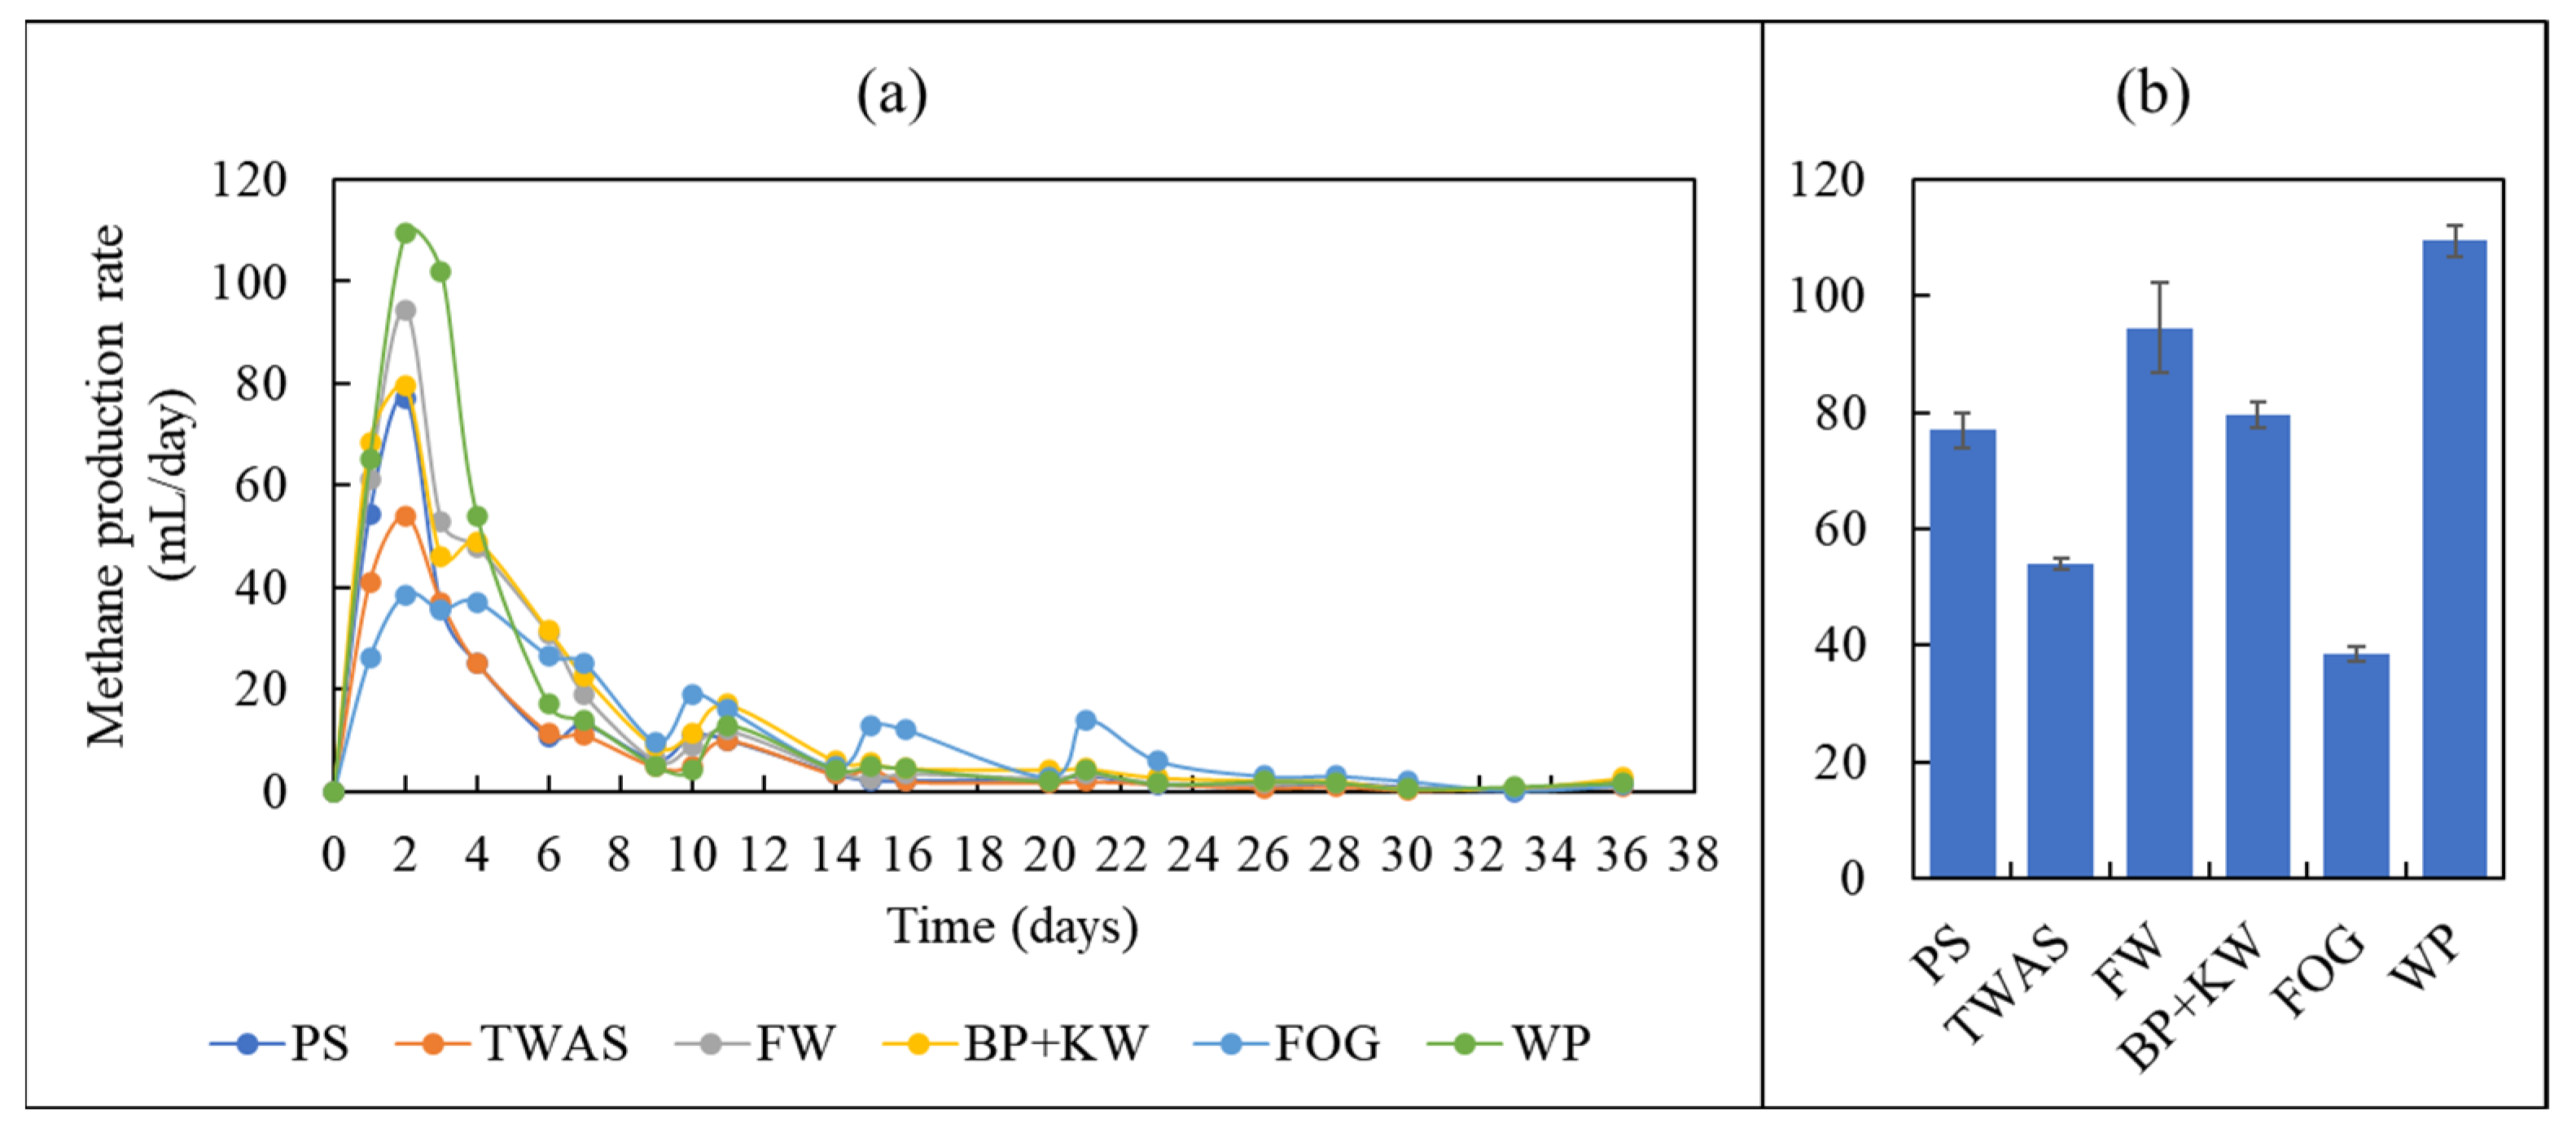
The methane production rate followed a similar trend for all the different substrates, as shown in Figure 5. The maximum methane production rate for all substrates occurred on the second day of digestion; after the maximum methane production rate was achieved, the daily methane production slowed down for all substrates with different magnitudes. The production rate slowed down by 33–53% within the following two days for all the substrates. The methane production rate exhibited a slight increase after the slow-down period, suggesting that no inhibition of methane production occurred. The maximum methane production rate was achieved with a value of 110 mL/day when WP was used as the substrate for AD. This was followed by FW, BP + KW, PS, TWAS, and FOG, respectively, in descending order, as shown in Figure 5b.
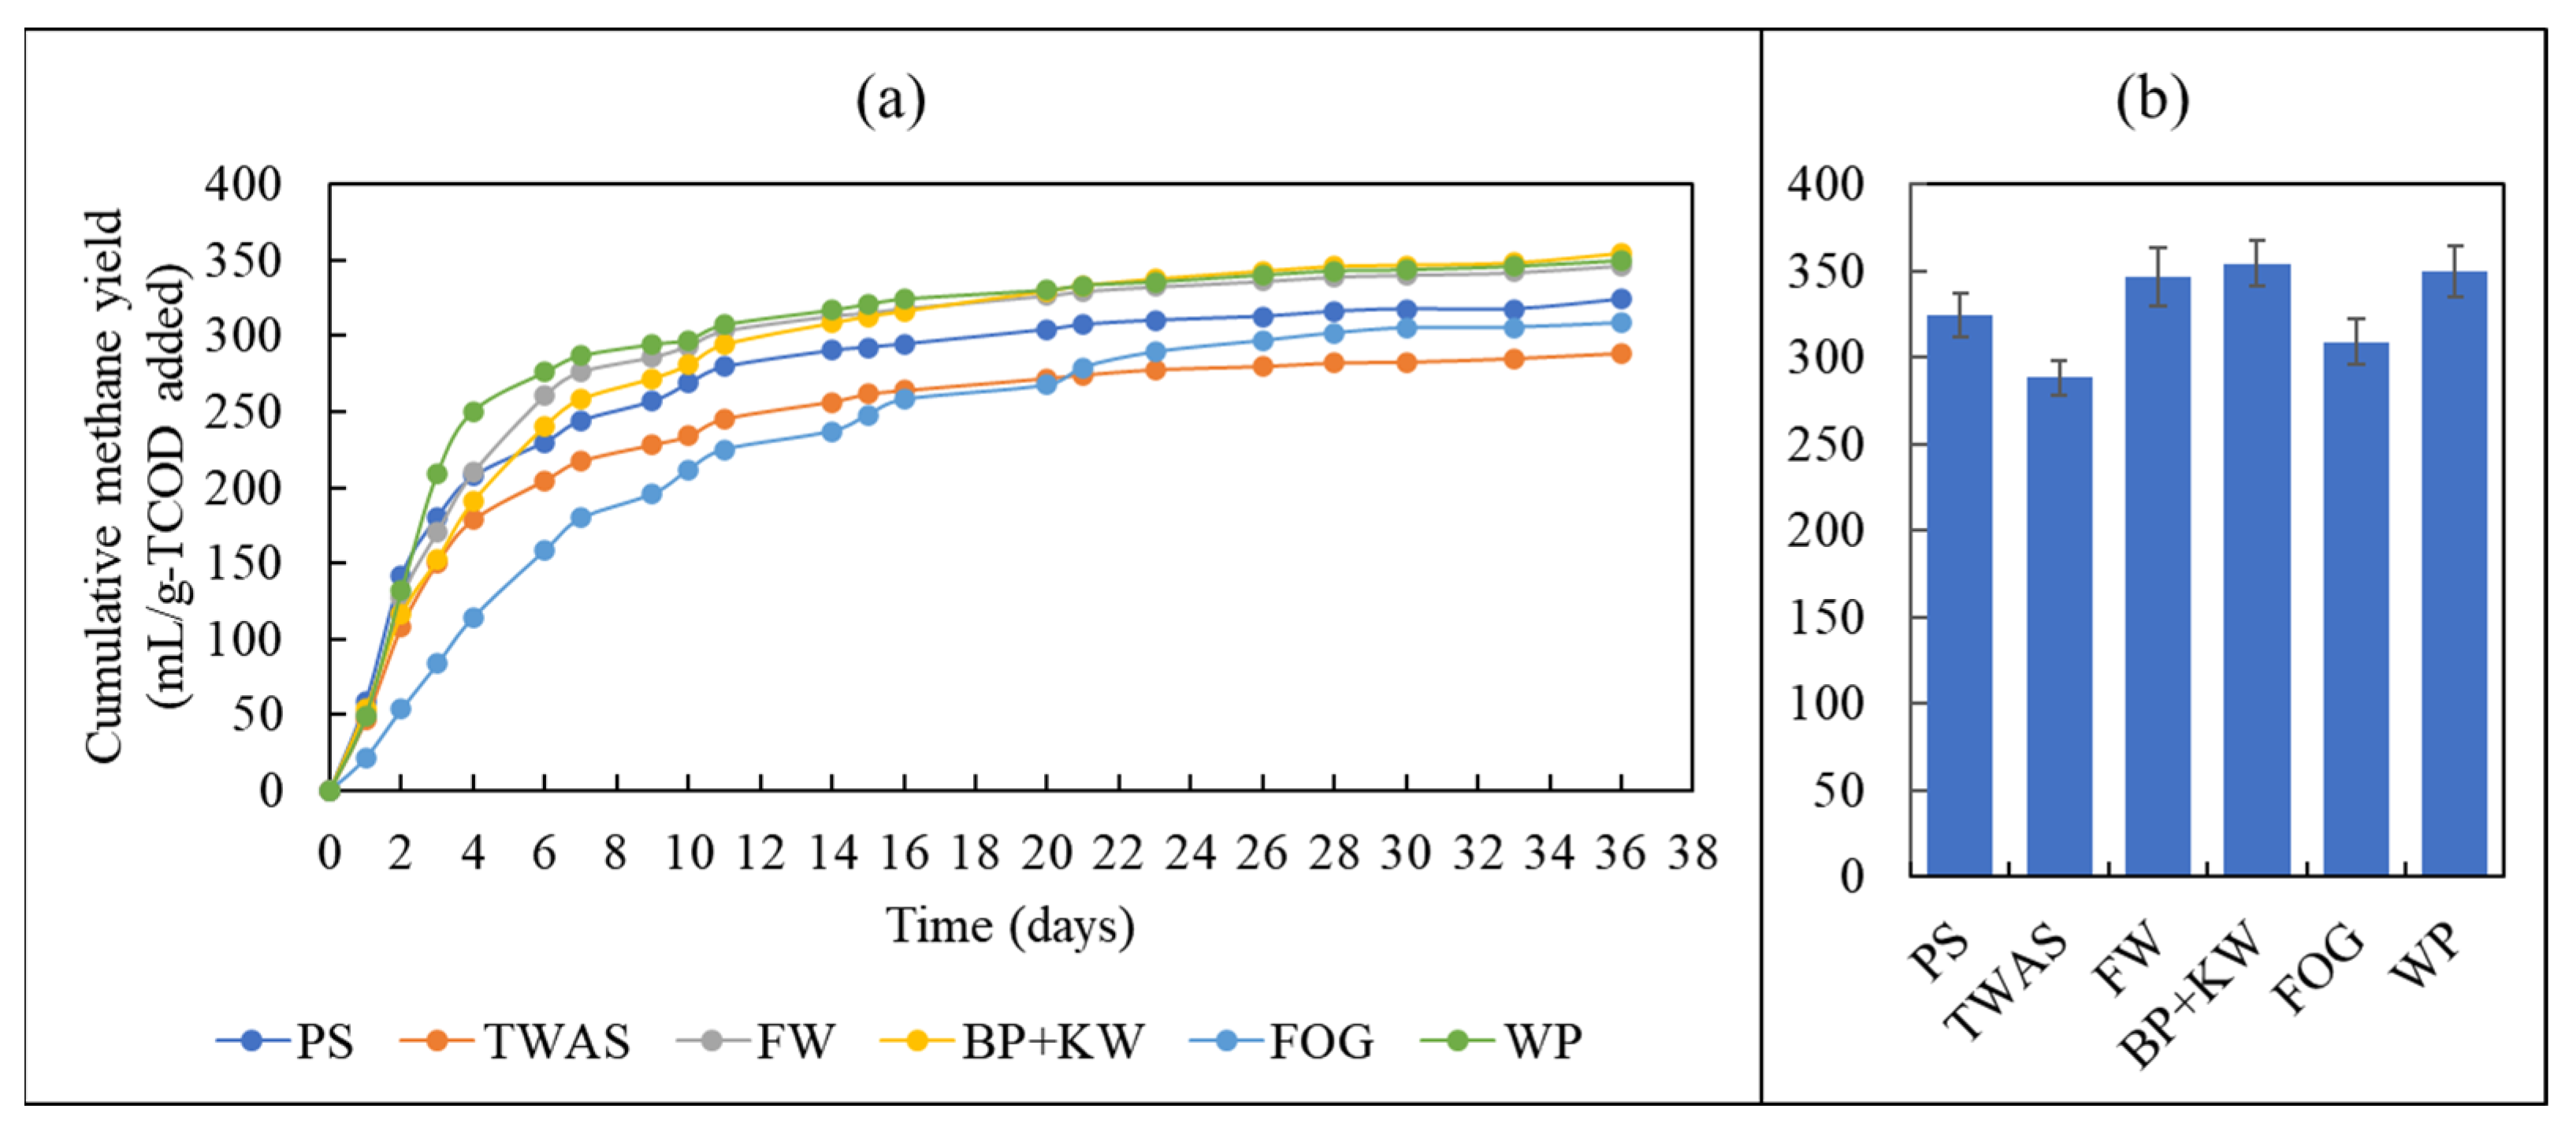
Figure 6 represents the cumulative methane yield per mass of TCOD substrate added for all the different substrates. The trend of the increase in the cumulative methane yield was similar to the trend of the increase in the cumulative methane production. As shown in Figure 6b, the maximum methane yields of 354 and 350 mL CH4/g-TCOD substrate added were achieved with BP + KW and WP as the substrates, respectively. This was followed by FW, PS, FOG, and TWAS, with maximum methane yields of 347, 324, 309, and 289, respectively. The substrates with the highest organic content and high biodegradability were the substrates that achieved higher cumulative methane yields. It was observed that the substrates that achieved the highest VFA yields in the fermentation experiment also achieved the highest cumulative methane yields. This is due to the high carbohydrate content in these substrates. Carbohydrates and proteins were easily hydrolyzed and had high bioconversion rates; hence, the higher VFAs and cumulative methane yields for the substrates with high carbohydrate content.

3.3. Biodegradability

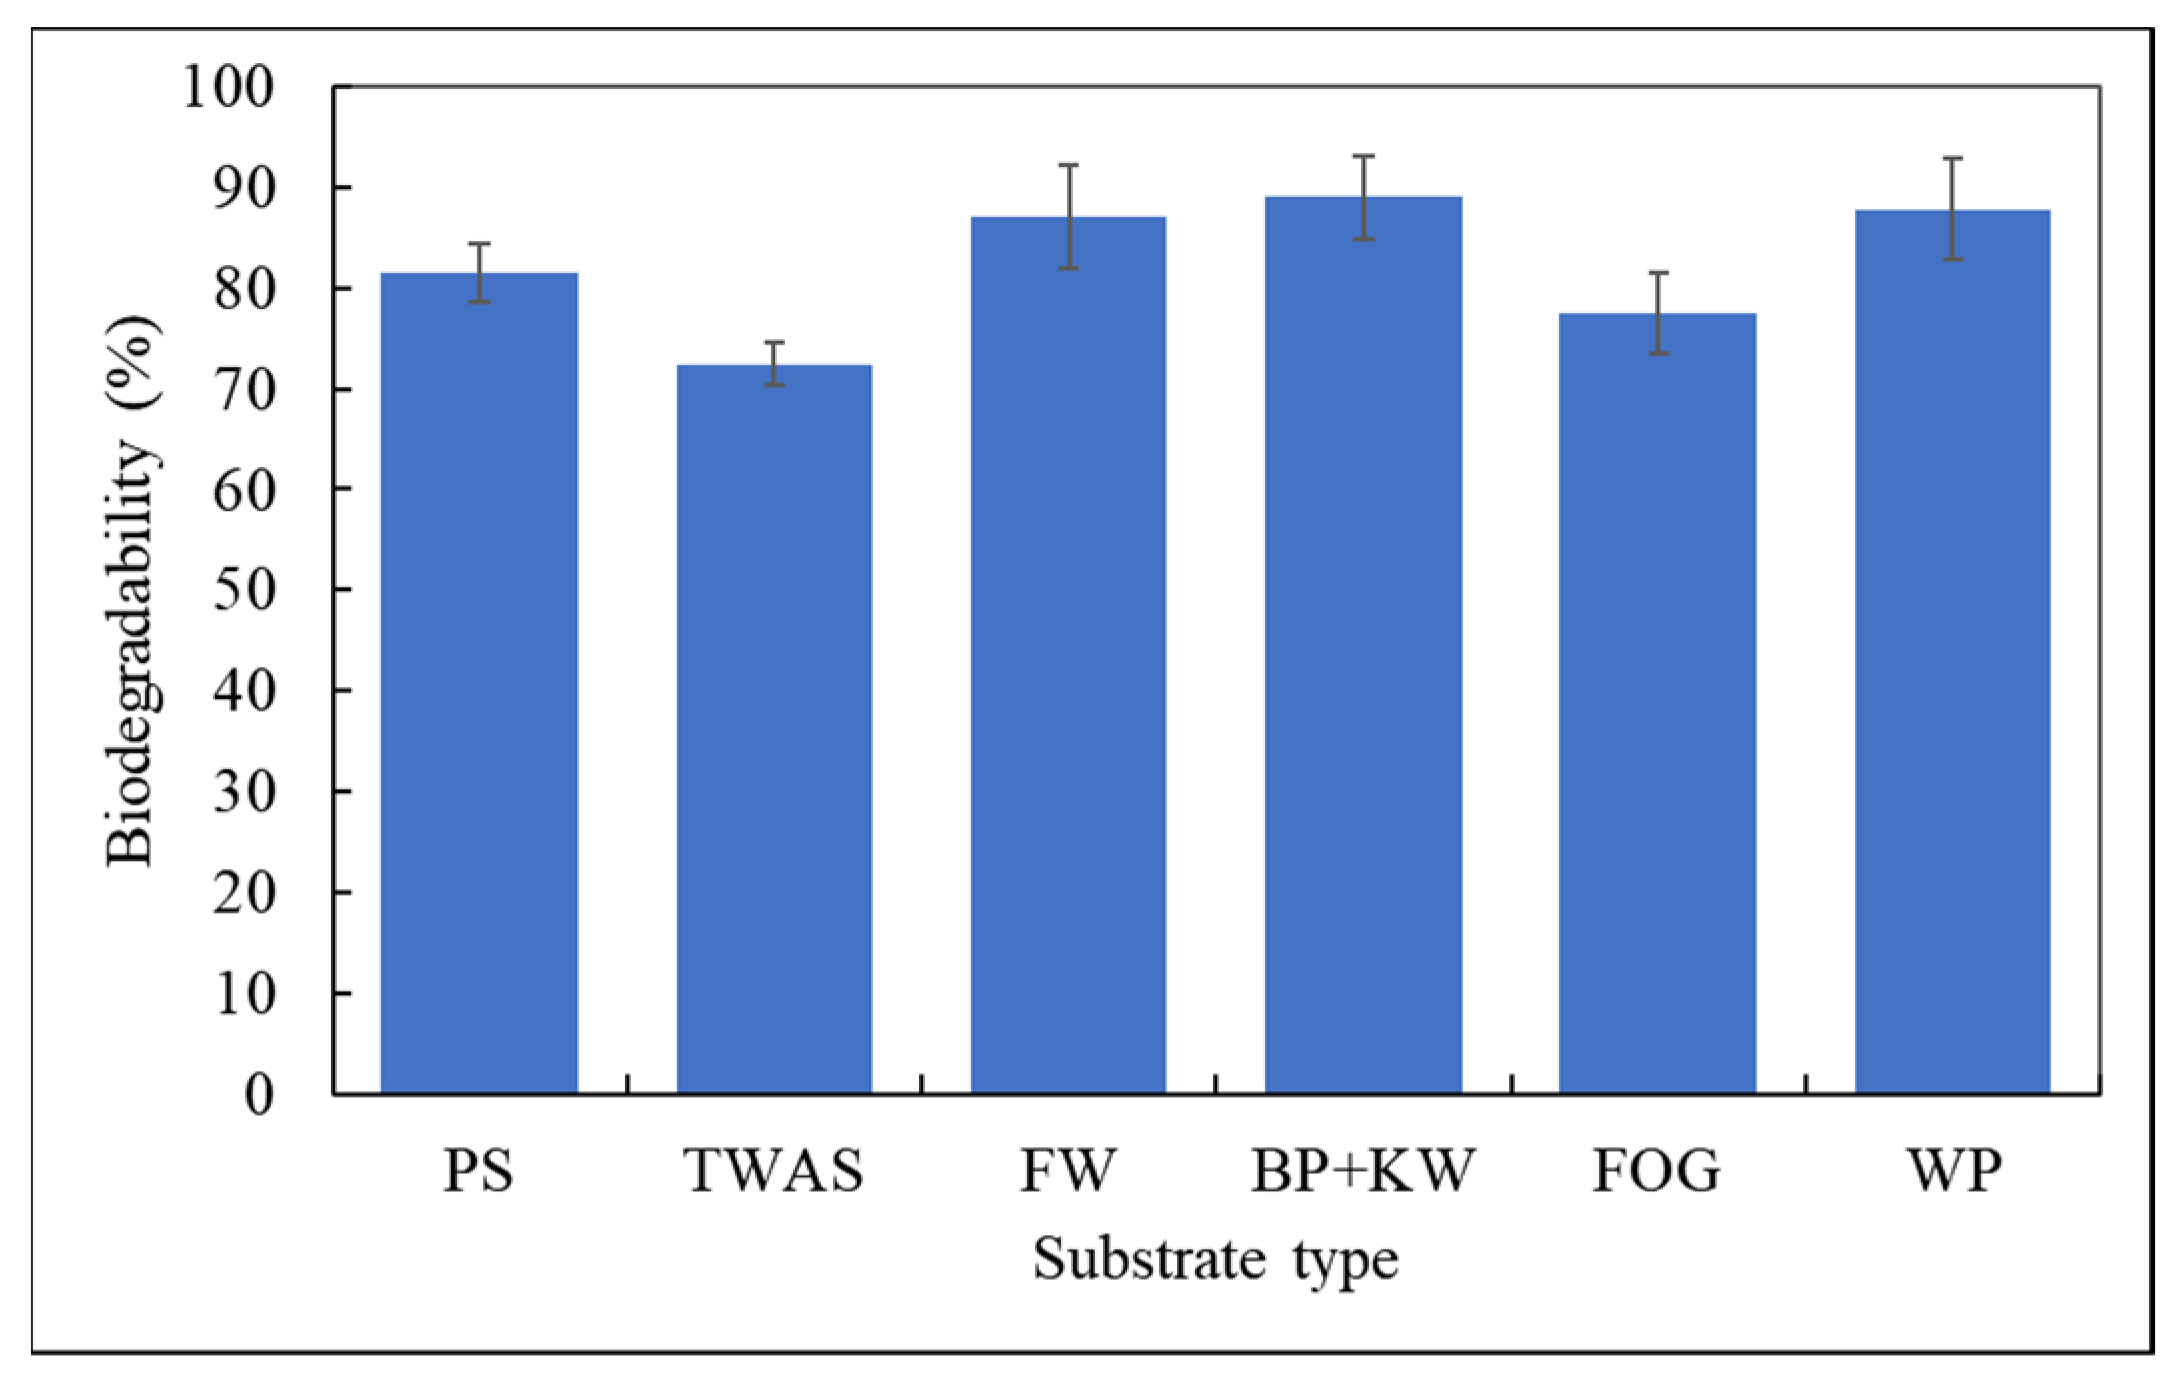
The biodegradable fraction analysis agreed with the methane yield values obtained in this work, as shown in Figure 7. The substrates with the highest yields exhibited the highest biodegradability, whereas the substrates with the lowest yields exhibited the lowest biodegradable fractions. The highest biodegradable fractions of 89, 88, and 87 percent were observed for BP + KW, WP, and FW, respectively, while TWAS, PS, and FOG exhibited the lowest biodegradable fractions of 73, 81, and 78 percent, respectively. The biodegradable fractions were obtained based on the maximum theoretical methane yield value of 398 mL CH4/g-TCODadded at 37 °C.
Furthermore, the COD mass balance calculation was performed to indicate the accuracy of the water quality analysis and biogas measurements. The COD mass balance for the different substrates had a range between 89–94%. Therefore, based on this high range, the obtained experimental methane yield values for the different substrates were considered highly accurate with minimal error.

3.4. Kinetics

The predicted parameters from the modified Gompertz model, which are the maximum methane production rate (Rm), the maximum methane production (P), and the lag phase ( λ ), are shown in Table 3. The table also shows the first-order kinetics rate coefficient (k). There was no lag phase for all substrates utilized in the batch tests. This result was expected, as the soluble fractions of the fermentation effluents were utilized in the experiments. Therefore, the hydrolysis step was rapid. The coefficient of determination (R2) values of the Gompertz model ranged between 0.978–0.992, which confirms the applicability of the model. The predicted maximum methane production rate of 84 mL CH4/d was achieved when WP was the substrate compared to 31 and 38 mL CH4/d for FOG and TWAS, respectively.

4. Discussion

WP, BP + KW, and FW exhibited the highest cumulative methane rates, cumulative methane production, and cumulative methane yield compared to the other substrates. Their good digestion performance could be attributed to their high soluble carbohydrate and protein content, as they exhibit relatively high conversion rates into biogas of 50–58% methane [48]. In a research study by Markou et al. [49], it was observed that the bio-methane yield is increased as the carbohydrate content in the substrate increases. This could be due to the carbohydrate’s accumulation and their occurrence in the form of storage compounds in the cell rather than structural compound form in the cell wall [49].
FW and BP + KW exhibit similar characteristics, as both of these substrates consist of kitchen waste, with FW obtained from household consumption (i.e., municipal) and BP + KW obtained from an industrial waste source. In general, the characteristics of kitchen waste (KW) differ depending on its source and several other factors, such as the cooking methods and cultural and eating habits of the population.
The methane yield values obtained from FW digestion fell within the range observed in the literature. The high yield values of these substrates could be mainly attributed to two main factors: the technique of substrate preparation and the high lipid and carbohydrate content.
All the industrial waste substrates were prepared by mechanical treatment before fermentation by blending the substrates using a blender, which turned the substrate into a paste-like material. This decrease in particle size increased the surface area of the particle. Hence, microbial cells have more accessibility to the substrate, and methane production is increased [50]. The study by Okoro-Shekwaga et al. [50], concluded that increased methane yield by up to 38% could be achieved if the particle size is decreased from 5 mm to 1 mm.
The lipid content in any substrate serves as one of the key contributors to high methane production from the anaerobic digestion of these substrates. Hence, high methane production was expected from the digestion of FW and BP + KW due to their lipid-rich mixtures. However, there is a certain extent to the effect of lipid content on methane production. At high concentrations of lipids, the LCFAs inhibit the methanogenic bacterial functionality, which consequently inhibits the fermentation process. This could be attributed to inhibiting methanogenic bacterial functionals by the LCFAs. Lipids are characterized by their hydrophobic nature; therefore, a very high concentration of lipids inhibits methane production as the mass transfer pathway of soluble intermediates and microbial cells are blocked. The biodegradable metabolite consumption by the methanogenic bacteria is then restricted, which inhibits methane generation. Moreover, a high concentration of LCFAs is highly toxic to anaerobic microbial activity, leading to permanent adverse effects on the activity of acetoclastic and hydrogenotrophic microorganisms [51]. Therefore, it is important to choose substrates with intermediate lipid concentrations such that the methane production would be maximized and no LCFAs inhibition would occur. FW and BP + KW contain lipids concentrations that are not too high to inhibit methane production, and at the same time, they contain a high concentration of carbohydrates. This is the cause for their high methane yields.
The literature studies indicated that the addition of FOG could enhance methane generation through the AD process. FOG is very rich in lipids, and as mentioned earlier, lipids can enhance methane production in the AD process. It has been reported that the addition of FOG from food processing to AD could enhance biomethane production by 30% or more [48]. Therefore, adding FOG as a cosubstrate into digesters will enhance the overall cumulative biomethane production. The lipid content in any substrate exhibits higher biodegradability and conversion to biogas than the protein and carbohydrates contents. The biomethane generation from lipids occurs at a rate of approximately 94%, which is higher than the rate of carbohydrates and proteins [52]. However, as mentioned earlier, there is an upper threshold to the lipid concentration before inhibiting methanogenic bacteria due to the formation of LCFAs. Several factors affect the magnitude of LCFAs inhibition of the methanogenic activity, such as the specific surface area of the anaerobic sludge and the length of the LCFAs carbon chain [53]. One reason why FW and BP + KW exhibited higher biodegradability and methane yield than FOG might be their balance between carbohydrates, lipids, and proteins. The balance between the three macromolecules is important because a very high concentration of lipids can inhibit methanogenic activity, resulting in a lower methane yield.
The literature revealed that several strategies could be used to overcome the toxicity of LCFAs in the AD process. One strategy is increasing the biomass-to-LCFA ratio by diluting the lipidic substrate with inoculum into the reactor content [53]. Another strategy is running the digesters under mesophilic conditions, as the mesophiles are more resistant to LCFAs than thermophiles due to the faster microbial growth rate. Moreover, LCFAs recovery could be achieved via adsorbent addition to the digesters. Once the LCFAs inhibition is reversed via one of these strategies, the biomethane recovery from the AD of FOG would be feasible, and adding FOG to AD as a sole substrate would yield higher methane yields.
Finally, PS and TWAS exhibited the lowest cumulative methane production compared to all the other substrates. This could be attributed to their low organic content and low biodegradability. It has been reported in different research studies that the codigestion of municipal sludge with highly lipidic substrates, such as FOG, enhances biomethane generation. The anaerobic codigestion effectively improves AD performance due to its complementary effects in providing better nutrient balance and higher buffering capacity [54]. Therefore, the option of codigestion should be considered when municipal sludge is to be treated via an AD process.

5. Conclusions

In this study, six different solid wastes were fermented and digested to analyze their methane production yield. The solid wastes were collected from food waste, bakery and kitchen waste, whey powder, fat, oil, and grease, and wastewater treatment primary and thickened waste activated sludge. It was found that the food, bakery and kitchen, and whey powder wastes had higher methane yield per weight of total COD than the primary sludge, thickened waste activated sludge, and fat, oil, and grease. The rate of biodegradation was highest in the bakery and kitchen, whey powder, and food wastes than that of the primary sludge, fat, oil, and grease, and thickened waste activated sludge. The variation in the rate of biodegradability and methane yield was attributed to the different carbohydrates, lipids, and proteins ratio, due to the inhibition of methanogens at high lipid concentrations. For future studies, the impact of this ratio on biomethane production should be studied.

Author Contributions

Conceptualization, R.A.H. and E.E.; methodology, A.M.; software, A.M.; validation, A.M.; formal analysis, A.M.; investigation, A.M. and M.S.Z.; resources, E.E.; data curation, A.M.; writing—original draft preparation, M.S.Z. and A.M.; writing—review and editing, M.S.Z., R.A.H. and E.E.; visualization, A.M. and M.S.Z.; supervision, E.E. and R.A.H.; project administration, E.E. and R.A.H.; funding acquisition, E.E. All authors have read and agreed to the published version of the manuscript.

Funding

This research received funding from the Natural Science and Engineering Research of Canada: NSERC Discovery Grant (No. RGPIN-2022-03825)-NSERC Postdoctoral Fellowship for Mohamed S. Zaghloul.

Institutional Review Board Statement

Not applicable.

Informed Consent Statement

Not applicable.

Data Availability Statement

Not applicable.

Acknowledgments

This work was financially supported by grants from the Natural Sciences and Engineering Research Council of Canada (NSERC).

Conflicts of Interest

The authors declare no conflict of interest.

References

  1. Song, Q.; Li, J.; Zeng, X. Minimizing the increasing solid waste through zero waste strategy. J. Clean. Prod. 2015, 104, 199–210. [Google Scholar] [CrossRef]
  2. Sabour, M.R.; Alam, E.; Hatami, A.M. Global trends and status in landfilling research: A systematic analysis. J. Mater. Cycles Waste Manag. 2020, 22, 711–723. [Google Scholar] [CrossRef]
  3. Pullen, T. Anaerobic Digestion-Making Biogas-Making Energy; Taylor & Francis Group: Oxford, UK, 2015. [Google Scholar]
  4. Xu, F.; Li, Y.; Ge, X.; Yang, L.; Li, Y. Anaerobic digestion of food waste—Challenges and opportunities. Bioresour. Technol. 2018, 247, 1047–1058. [Google Scholar] [CrossRef] [PubMed]
  5. Caposciutti, G.; Baccioli, A.; Ferrari, L.; Desideri, U. Biogas from anaerobic digestion: Power generation or biomethane production? Energies 2020, 13, 743. [Google Scholar] [CrossRef] [Green Version]
  6. Lee, W.S.; Chua, A.S.M.; Yeoh, H.K.; Ngoh, G.C. A review of the production and applications of waste-derived volatile fatty acids. Chem. Eng. J. 2014, 235, 83–99. [Google Scholar] [CrossRef]
  7. Demitry, M.E.; Zhong, J.; Hansen, C.L.; McFarland, M.J. Modifying the ADM1 model to predict the operation of an anaerobic digester co-digesting municipal sludge with bakery waste. Environ. Pollut. 2015, 4, 38. [Google Scholar] [CrossRef]
  8. Chen, J.P.; Yang, L.; Bai, R.; Hung, Y.-T. Bakery waste treatment. In Handbook of Industrial and Hazardous Wastes Treatment; CRC Press: Boca Raton, FL, USA, 2004; pp. 1201–1220. [Google Scholar]
  9. Salama, E.-S.; Saha, S.; Kurade, M.; Dev, S.; Chang, S.; Jeon, B.-H. Recent trends in anaerobic co-digestion: Fat, oil, and grease (FOG) for enhanced biomethanation. Prog. Energy Combust. Sci. 2019, 70, 22–42. [Google Scholar] [CrossRef]
  10. Aziz, T.; Holt, L.; Keener, K.; Groninger, J.; Ducoste, J. Performance of grease abatement devices for removal of fat, oil, and grease. J. Environ. Eng. 2011, 137, 84–92. [Google Scholar] [CrossRef]
  11. Chen, Y.; Cheng, J.J.; Creamer, K.S. Inhibition of anaerobic digestion process: A review. Bioresour. Technol. 2008, 99, 4044–4064. [Google Scholar] [CrossRef] [PubMed]
  12. Bengtsson, S.; Hallquist, J.; Werker, A.; Welander, T. Acidogenic fermentation of industrial wastewaters: Effects of chemostat retention time and pH on volatile fatty acids production. Biochem. Eng. J. 2008, 40, 492–499. [Google Scholar] [CrossRef]
  13. Atasoy, M.; Eyice, O.; Cetecioglu, Z. A comprehensive study of volatile fatty acids production from batch reactor to anaerobic sequencing batch reactor by using cheese processing wastewater. Bioresour. Technol. 2020, 311, 123529. [Google Scholar] [CrossRef]
  14. Lagoa-Costa, B.; Kennes, C.; Veiga, M.C. Cheese whey fermentation into volatile fatty acids in an anaerobic sequencing batch reactor. Bioresour. Technol. 2020, 308, 123226. [Google Scholar] [CrossRef] [PubMed]
  15. Jankowska, E.; Chwialkowska, J.; Stodolny, M.; Oleskowicz-Popiel, P. Volatile fatty acids production during mixed culture fermentation—The impact of substrate complexity and pH. Chem. Eng. J. 2017, 326, 901–910. [Google Scholar] [CrossRef]
  16. Wu, H.; Yang, D.; Zhou, Q.; Song, Z. The effect of pH on anaerobic fermentation of primary sludge at room temperature. J. Hazard. Mater. 2009, 172, 196–201. [Google Scholar] [CrossRef]
  17. Li, X.; Peng, Y.; Zhao, Y.; Zhang, L.; Han, B. Volatile fatty acid accumulation by alkaline control strategy in anaerobic fermentation of primary sludge. Environ. Eng. Sci. 2017, 34, 703–710. [Google Scholar] [CrossRef]
  18. Cokgor, E.U.; Oktay, S.; Tas, D.O.; Zengin, G.E.; Orhon, D. Influence of pH and temperature on soluble substrate generation with primary sludge fermentation. Bioresour. Technol. 2009, 100, 380–386. [Google Scholar] [CrossRef]
  19. Bahreini, G.; Nazari, L.; Ho, D.; Flannery, C.C.; Elbeshbishy, E.; Santoro, D.; Nakhla, G. Enzymatic pre-treatment for enhancement of primary sludge fermentation. Bioresour. Technol. 2020, 305, 123071. [Google Scholar] [CrossRef]
  20. Huang, X.; Dong, W.; Wang, H.; Sun, F.; Feng, Y. Enhance primary sludge acidogenic fermentation with CaO2 addition: Investigation on soluble substrate generation, sludge dewaterability, and molecular biological characteristics. J. Clean. Prod. 2019, 228, 1526–1536. [Google Scholar] [CrossRef]
  21. Kurniawan, A.; Kwon, S.; Shin, J.-H.; Hur, J.; Cho, J. Acid fermentation process combined with post denitrification for the treatment of primary sludge and wastewater with high strength nitrate. Water 2016, 8, 117. [Google Scholar] [CrossRef] [Green Version]
  22. laqa Kakar, F.; Koupaie, E.H.; Razavi, A.S.; Hafez, H.; Elbeshbishy, E. Effect of hydrothermal pretreatment on volatile fatty acids production from thickened waste activated sludge. BioEnergy Res. 2020, 13, 591–604. [Google Scholar] [CrossRef]
  23. Morgan-Sagastume, F.; Hjort, M.; Cirne, D.; Gérardin, F.; Lacroix, S.; Gaval, G.; Karabegovic, L.; Alexandersson, T.; Johansson, P.; Karlsson, A.; et al. Integrated production of polyhydroxyalkanoates (PHAs) with municipal wastewater and sludge treatment at pilot scale. Bioresour. Technol. 2015, 181, 78–89. [Google Scholar] [CrossRef] [PubMed]
  24. Esteban-Gutiérrez, M.; Garcia-Aguirre, J.; Irizar, I.; Aymerich, E. From sewage sludge and agri-food waste to VFA: Individual acid production potential and up-scaling. Waste Manag. 2018, 77, 203–212. [Google Scholar] [CrossRef]
  25. Wang, K.; Yin, J.; Shen, D.; Li, N. Anaerobic digestion of food waste for volatile fatty acids (VFAs) production with different types of inoculum: Effect of pH. Bioresour. Technol. 2014, 161, 395–401. [Google Scholar] [CrossRef]
  26. He, X.; Yin, J.; Liu, J.; Chen, T.; Shen, D. Characteristics of acidogenic fermentation for volatile fatty acid production from food waste at high concentrations of NaCl. Bioresour. Technol. 2019, 271, 244–250. [Google Scholar] [CrossRef]
  27. Zhang, L.; Loh, K.-C.; Dai, Y.; Tong, Y.W. Acidogenic fermentation of food waste for production of volatile fatty acids: Bacterial community analysis and semi-continuous operation. Waste Manag. 2020, 109, 75–84. [Google Scholar] [CrossRef]
  28. Ji, Z.; Chen, G.; Chen, Y. Effects of waste activated sludge and surfactant addition on primary sludge hydrolysis and short-chain fatty acids accumulation. Bioresour. Technol. 2010, 101, 3457–3462. [Google Scholar] [CrossRef] [PubMed]
  29. Ariunbaatar, J.; Panico, A.; Frunzo, L.; Esposito, G.; Lens, P.N.L.; Pirozzi, F. Enhanced anaerobic digestion of food waste by thermal and ozonation pretreatment methods. J. Environ. Manag. 2014, 146, 142–149. [Google Scholar] [CrossRef]
  30. Zhou, M.; Yan, B.; Wong, J.W.C.; Zhang, Y. Enhanced volatile fatty acids production from anaerobic fermentation of food waste: A mini-review focusing on acidogenic metabolic pathways. Bioresour. Technol. 2018, 248, 68–78. [Google Scholar] [CrossRef] [PubMed]
  31. Parthiba Karthikeyan, O.; Trably, E.; Mehariya, S.; Bernet, N.; Wong, J.W.C.; Carrere, H. Pretreatment of food waste for methane and hydrogen recovery: A review. Bioresour. Technol. 2018, 249, 1025–1039. [Google Scholar] [CrossRef] [PubMed] [Green Version]
  32. Ahammad, S.Z.; Gomes, J.; Sreekrishnan, T.R. Wastewater treatment for production of H2S-free biogas. J. Chem. Technol. Biotechnol. 2008, 83, 1163–1169. [Google Scholar] [CrossRef]
  33. Zhang, R.; El-Mashad, H.M.; Hartman, K.; Wang, F.; Liu, G.; Choate, C.; Gamble, P. Characterization of food waste as feedstock for anaerobic digestion. Bioresour. Technol. 2007, 98, 929–935. [Google Scholar] [CrossRef] [PubMed]
  34. Mahmoud, A.; Hamza, R.A.; Elbeshbishy, E. Enhancement of denitrification efficiency using municipal and industrial waste fermentation liquids as external carbon sources. Sci. Total Environ. 2022, 816, 151578. [Google Scholar] [CrossRef] [PubMed]
  35. Hafez, H.; Nakhla, G.; El Naggar, M.H.; Elbeshbishy, E.; Baghchehsaraee, B. Effect of organic loading on a novel hydrogen bioreactor. Int. J. Hydrogen Energy 2010, 35, 81–92. [Google Scholar] [CrossRef]
  36. Bazyar Lakeh, A.A.; Azizi, A.; Hosseini Koupaie, E.; Bekmuradov, V.; Hafez, H.; Elbeshbishy, E. A comprehensive study for characteristics, acidogenic fermentation, and anaerobic digestion of source separated organics. J. Clean. Prod. 2019, 228, 73–85. [Google Scholar] [CrossRef]
  37. Cioabla, A.E.; Ionel, I.; Dumitrel, G.-A.; Popescu, F. Comparative study on factors affecting anaerobic digestion of agricultural vegetal residues. Biotechnol. Biofuels 2012, 5, 39. [Google Scholar] [CrossRef] [Green Version]
  38. Jiang, J.; Zhang, Y.; Li, K.; Wang, Q.; Gong, C.; Li, M. Volatile fatty acids production from food waste: Effects of pH, temperature, and organic loading rate. Bioresour. Technol. 2013, 143, 525–530. [Google Scholar] [CrossRef]
  39. Dhar, B.R.; Elbeshbishy, E.; Hafez, H.; Lee, H.-S. Hydrogen production from sugar beet juice using an integrated biohydrogen process of dark fermentation and microbial electrolysis cell. Bioresour. Technol. 2015, 198, 223–230. [Google Scholar] [CrossRef]
  40. McInerney, M.J. Anaerobic hydrolysis and fermentation of fats and proteins. In Biology of Anaerobic Microorganisms; Zehnder, A.J.B., Ed.; Wiley: New York, NY, USA, 1988; pp. 373–415. [Google Scholar]
  41. Elefsiniotis, P.; Wareham, D.G.; Smith, M.O. Use of volatile fatty acids from an acid-phase digester for denitrification. J. Biotechnol. 2004, 114, 289–297. [Google Scholar] [CrossRef]
  42. Yin, J.; Liu, J.; Chen, T.; Long, Y.; Shen, D. Influence of melanoidins on acidogenic fermentation of food waste to produce volatility fatty acids. Bioresour. Technol. 2019, 284, 121–127. [Google Scholar] [CrossRef]
  43. Atasoy, M.; Owusu-Agyeman, I.; Plaza, E.; Cetecioglu, Z. Bio-based volatile fatty acid production and recovery from waste streams: Current status and future challenges. Bioresour. Technol. 2018, 268, 773–786. [Google Scholar] [CrossRef]
  44. Elefsiniotis, P.; Wareham, D.G. Utilization patterns of volatile fatty acids in the denitrification reaction. Enzym. Microb. Technol. 2007, 41, 92–97. [Google Scholar] [CrossRef]
  45. Zacharof, M.-P.; Lovitt, R.W. Complex effluent streams as a potential source of volatile fatty acids. Waste Biomass Valorization 2013, 4, 557–581. [Google Scholar] [CrossRef]
  46. Yin, J.; Yu, X.; Wang, K.; Shen, D. Acidogenic fermentation of the main substrates of food waste to produce volatile fatty acids. Int. J. Hydrogen Energy 2016, 41, 21713–21720. [Google Scholar] [CrossRef]
  47. Dwidar, M.; Park, J.-Y.; Mitchell, R.J.; Sang, B.-I. The future of butyric acid in industry. Sci. World J. 2012, 2012, 471417. [Google Scholar] [CrossRef] [PubMed] [Green Version]
  48. Long, J.H.; Aziz, T.N.; de los Reyes, F.L.; Ducoste, J.J. Anaerobic co-digestion of fat, oil, and grease (FOG): A review of gas production and process limitations. Process Saf. Environ. Prot. 2012, 90, 231–245. [Google Scholar] [CrossRef]
  49. Markou, G.; Angelidaki, I.; Georgakakis, D. Carbohydrate-enriched cyanobacterial biomass as feedstock for bio-methane production through anaerobic digestion. Fuel 2013, 111, 872–879. [Google Scholar] [CrossRef]
  50. Okoro-Shekwaga, C.K.; Turnell Suruagy, M.V.; Ross, A.; Camargo-Valero, M.A. Particle size, inoculum-to-substrate ratio and nutrient media effects on biomethane yield from food waste. Renew. Energy 2020, 151, 311–321. [Google Scholar] [CrossRef]
  51. Cirne, D.G.; Paloumet, X.; Björnsson, L.; Alves, M.M.; Mattiasson, B. Anaerobic digestion of lipid-rich waste—Effects of lipid concentration. Renew. Energy 2007, 32, 965–975. [Google Scholar] [CrossRef] [Green Version]
  52. Jeganathan, J.; Nakhla, G.; Bassi, A. Long-term performance of high-rate anaerobic reactors for the treatment of oily wastewater. Environ. Sci. Technol. 2006, 40, 6466–6472. [Google Scholar] [CrossRef]
  53. Palatsi, J.; Laureni, M.; Andrés, M.V.; Flotats, X.; Nielsen, H.B.; Angelidaki, I. Strategies for recovering inhibition caused by long chain fatty acids on anaerobic thermophilic biogas reactors. Bioresour. Technol. 2009, 100, 4588–4596. [Google Scholar] [CrossRef]
  54. Bong, C.P.C.; Lim, L.Y.; Lee, C.T.; Klemeš, J.J.; Ho, C.S.; Ho, W.S. The characterisation and treatment of food waste for improvement of biogas production during anaerobic digestion—A review. J. Clean. Prod. 2018, 172, 1545–1558. [Google Scholar] [CrossRef]
Figure 1. Summary of the characteristics of substrates and inoculum.
Fermentation 09 00138 g001
Figure 2. Setup of the fermentation reactors inside temperature-controlled water baths and connected with mechanical mixers and biogas collection bags.
Fermentation 09 00138 g002
Figure 3. VFA composition fractions produced in the fermentation of PS, TWAS, FW, BP + KW, FOG, and WP.
Fermentation 09 00138 g003
Figure 4. Plots of cumulative methane production of the different substrates. (a) Cumulative methane (mL CH4) and Gompertz model fit, (b) ultimate methane (mL CH4).
Fermentation 09 00138 g004
Figure 5. Plots of methane production rates for the different substrates: (a) methane production rate (mL CH4/day); (b) maximum methane production rate (mL CH4/day).
Fermentation 09 00138 g005
Figure 6. Methane yield per mass of TCOD substrate added for all the different substrates. (a) Cumulative methane yield, (b) maximum methane yield.
Fermentation 09 00138 g006
Figure 7. Biodegradable fractions for all the different substrates.
Fermentation 09 00138 g007
Table 1. Literature studies on the total volatile fatty acids (TVFAs) concentration, yield, and fractions produced from the anaerobic fermentation of food waste.
SubstrateTVFAsVFA YieldVFA Fractions (%)Reference
AceticPropionicButyricValericIso-valericOther
Cheese Whey227055 **431542---[12]
Cheese Whey1140570 *22225--51[13]
Cheese Whey972023203820224-16[14]
Cheese Whey20,000400025182016-21[15]
Primary sludge2500215443213452[16]
Primary sludge2400206343514584[16]
Primary sludge4000115432647614[17]
Primary sludge34601777018---12[18]
Primary sludge4593201 *433312723[19]
Primary sludge800136511913575[20]
Primary sludge19301813029181076[21]
TWAS1800-22231017262[22]
TWAS6000210 *28242011125[23]
TWAS1150120253--3312[24]
Food Waste32,0004823015532--[25]
Food Waste26,610395 *65629---[26]
Food Waste295027037--25929[24]
Food Waste8682395 *43516---[27]
(*): mgCOD/gVS; (**): mgCOD/gVSS/hr; TVFAs: mg COD/L; VFA yield: mg COD/g VSS.
Table 2. Seed and substrate volumes in the fermentation and digestion reactors for each of the tested substrates.
SubstrateFermentationDigestion
Substrate Volume (mL)Seed Volume (mL)Substrate Volume (mL)Seed Volume (mL)
PS572122864136
TWAS514128657143
FOG249155128172
BP + KW245155527173
FW136166415185
WP98170211189
Table 3. Kinetics parameters of the Gompertz and first-order models.
SubstrateKinetic Parameters
P (mL)Rm (mL/d) λ (d) R2k (d−1)
PS2784900.9780.189
TWAS2383800.9850.166
FW4006700.9920.168
BP + KW4215400.9890.117
FOG3513100.980.263
WP4338400.9870.189
Disclaimer/Publisher’s Note: The statements, opinions and data contained in all publications are solely those of the individual author(s) and contributor(s) and not of MDPI and/or the editor(s). MDPI and/or the editor(s) disclaim responsibility for any injury to people or property resulting from any ideas, methods, instructions or products referred to in the content.