Article

Chemical Profile and Hematoprotective Activity of Artisanal Jabuticaba (Plinia jabuticaba) Wine and Derived Extracts

by
Raissa Lima
1,†,
Marcos Vinicius T. Silva
1,†,
Brendo A. Gomes
2,†,
Ellis Helena B. C. Macedo
1,
Michele N. Santana
3,
Ana Claudia F. Amaral
4,
Jefferson R. A. Silva
5,
Pollyane G. Corrêa
5,
Ronoel Luiz O. Godoy
6,
Manuela Cristina P. A. Santiago
6,
Suzana G. Leitão
1,2,3,
Rosineide C. Simas
7,8,
Carla S. Carneiro
3,* and
Igor A. Rodrigues
1,3,*
1
Programa de Pós-graduação em Ciências Farmacêuticas, Faculdade de Farmácia, Universidade Federal do Rio de Janeiro, Rio de Janeiro 21941-902, RJ, Brazil
2
Programa de Pós-graduação em Biotecnologia Vegetal, Universidade Federal do Rio de Janeiro, Rio de Janeiro 21941-902, RJ, Brazil
3
Departamento de Produtos Naturais e Alimentos, Faculdade de Farmácia, Universidade Federal do Rio de Janeiro, Rio de Janeiro 21941-902, RJ, Brazil
4
Laboratório de Plantas Medicinais e Derivados, Farmanguinhos Fiocruz, Manguinhos, Rio de Janeiro 21041-250, RJ, Brazil
5
Departamento de Química, Universidade Federal do Amazonas, Japiim, Manaus 69077-000, AM, Brazil
6
Embrapa Agroindústria de Alimentos, Rio de Janeiro 23020-470, RJ, Brazil
7
Laboratório de Cromatografia e Espectrometria de Massas (LaCEM), Universidade Federal de Goiás, Goiânia 74690-900, GO, Brazil
8
Universidade Presbiteriana Mackenzie, Escola de Engenharia, Instituto Mackenzie, Higienópolis 01302-907, SP, Brazil
*
Authors to whom correspondence should be addressed.
These authors contributed equally to this work.
Fermentation 2023, 9(2), 157; https://doi.org/10.3390/fermentation9020157
Submission received: 13 December 2022 / Revised: 31 January 2023 / Accepted: 1 February 2023 / Published: 6 February 2023
(This article belongs to the Special Issue Nutrition and Health of Fermented Foods)

Abstract

:
The alcoholic fermentation of jabuticaba berries (Plinia spp.) originates from a beverage with an intense taste and aroma, popularly known as jabuticaba wine (JW). In addition, polyphenols transferred from fruit peels to the final product turn this beverage into a promising source of bioactive agents. Here, the chemical profile and antioxidant potential of artisanal JW and derivative extracts were determined. Volatile organic compounds were determined by HS-SPME/GC-MS analysis. The wine was dried by lyophilization and subjected to liquid-liquid partitioning (water: ethyl acetate), resulting in three fractions (JWF1-3). ABTS•+ and DPPH•+ scavenging assays were performed to evaluate the antioxidant capacity. In addition, the extracts’ hematoprotective activity was evaluated against oxidative stress. Finally, the extracts were analyzed by LC-HRMS/MS. HS-SPME/GC-MS analysis highlighted 1,8-cineole as the main compound that contributes to the camphor/mint flavor. JWF2 and JWF3 displayed the highest antioxidant capacity. JWF2 stood out for preventing oxidative damage in red blood cells at 7.8 µg·mL−1 The maximal protection of ascorbic acid occurred at 8.8 µg·mL−1. The LC-HRMS/MS analysis allowed the annotation of seventeen compounds, most of them with recognized antioxidant activity such as anthocyanins, catechins, flavanols, and phenolic acids. The results presented herein reinforce JW as a pleasant beverage with bioactive potential.

1. Introduction

Volatile organic compounds (VOCs) play an essential role in the food industry as they provide sensory attributes that contribute to the flavor and aroma characteristics of food and consequently give off aromas to potential consumers [1]. Previously, an aroma extract dilution analysis showed that jabuticaba fruits display a complex volatile constitution that gives it odor attributes such as woody-green, medicinal, honey-like, and flowery. Terpenes (monoterpenes and sesquiterpenes) and alcohols are the main chemical classes that contribute to the characteristic smell of jabuticaba [2]. VOCs are present in these fruits in different concentrations, making them attractive for developing food products such as jams, vinegar, and wines. More recently, a VOC analysis of fermented jabuticaba fruits focused on the alcohol profile revealed high amounts of isoamyl alcohol even in samples with a short time of fruit maceration [3]. These studies show that much effort must be made to understand the complexity of jabuticaba wine volatiles and their impact on the final product.
Fermentation is a well-known process to enhance compounds’ bioactivity. Unsurprisingly, wines have been investigated as bioactive agents, especially antioxidants. Regarding the antioxidant properties of jabuticaba wine, previous reports demonstrated that this beverage presents interesting antioxidant capacity by using in vitro methods based on redox (FRAP, β-carotene bleaching assays) and free radical scavenging (ABTS•+) properties [4,5,6]. Despite the wide use of antioxidant capacity assays, it is known that they may not reflect the antioxidant activity in biological systems [7]. In fact, there are few studies focusing on the biological effect of jabuticaba wine, especially its antioxidant activity. So far, de Sá et al. (2014) reported a vasorelaxant capacity of this beverage.
Oxidative stress plays a crucial role in the progress of several illnesses [8]. It has also been described as an inducer of eryptosis, a programmed death of red blood cells (RBCs). Indeed, strong evidence suggests that oxidative stress may accelerate RBC loss in different systemic conditions and is an additional cause of anemia [9]. Experimentally, RBCs have been used as a model of antioxidant assays not only because of their biological relevance but also due to an intrinsic characteristic. The cellular membrane of these cells is rich in polyunsaturated fatty acids that make them vulnerable to oxidative damage [10]. Interestingly, grape wines have been investigated as inhibitors of RBC oxidative damage due to their high content of polyphenols [11]. Pazzini et al. (2015) demonstrated that Tannat red wine protects RBC against oxidative damage induced by high concentrations of glucose and fructose, which is a biological condition of diabetes [12]. In addition, Aglianico red wine was recently described as an RBC plasma membrane redox system modulator. The initial pro-oxidant effect of this wine stimulates an important enzymatic antioxidant response [13].
Previously, we reported the physicochemical properties and NMR-based metabolomics analyses of artisanal jabuticaba wines [14]. Here, a comprehensive study on the chemical profile of artisanal jabuticaba wine was performed. In addition, the antioxidant potential of wine-derived extracts was addressed using an RBC ex vivo model.

2. Materials and Methods

2.1. Jabuticaba Wine Sample

Jabuticaba wine was produced following traditional practices as previously described [14]. The fermentation process was conducted by using a commercial yeast strain (Saccharomyces cerevisiae). Moreover, potassium metabisulfite (100 mg·L−1 of free SO2) was used as a preservative agent. After 6 months in an amber glass bottle, the wine was collected and immediately aliquoted (30 mL) into amber flasks. Fresh samples were used for the volatile organic compounds and anthocyanins analysis or subjected to drying by lyophilization in an L101 freeze drying equipment (LIOBRAS®, São Carlos, SP, Brazil). The dried samples were maintained in the dark at −20 °C until partitioning and analytical procedures.

2.2. Partitioning Procedures

The dried samples were resuspended in 10% ethanol solution and subjected to liquid-liquid partitioning using ethyl acetate (1:1, v/v) as described in detail by Ghiselli et al. (1998) [15]. As a result of this process, three fractions (JWF1-3) in addition to a residual aqueous phase (JWR) were obtained. The last one was freeze-dried by lyophilization, while the apolar fractions were dried by using a rotatory evaporator under negative pressure and a water bath at 40 °C. All samples were kept in the dark at −20 °C until the analytical and biological assays.

2.3. Sample Preparation and Solid Phase Microextraction (SPME)

Sample preparation was performed as previously described [16] with minor modifications. The wine samples were mixed with 0.75 g of NaCl, 5 mL of Milli-Q water, and 3-octanol (internal standard, 10 mg·L−1 standard solution in absolute ethanol) in a 20 mL flask. The flask was sealed with a cap aluminum septum and placed in a water bath at 40 °C, under magnetic stirring. After the equilibration time (10 min), a Supelco SPME device with a fiber coated with 65 µm polydimethylsiloxane/divinylbenzene (PDMS/DVB) (Bellefonte, PA, USA) was inserted into the vial containing the sample. The fiber was exposed to the headspace for 40 min at 40 °C. Once sampling was finished, the fiber was withdrawn into the needle and transferred to the injection port of the gas chromatograph/mass spectrometer (GC–MS) system for 4 min at 260 °C to desorb the analytes in splitless mode.

2.4. Volatile Compounds Analysis by GC–MS

GC-MS analysis was performed using a Shimadzu GC-2010 plus gas chromatograph interfaced with a QP-2010 Mass Selective Detector (ionization voltage 70 eV), equipped with a nonpolar DB-5MS capillary column (30 m × 0.25 mm, film thickness 0.25 μm), using helium as a carrier gas (1.0 mL·min−1). The oven temperature was programmed from 50 °C to 260 °C, at 7 °C/min, then isothermal at 260 °C for 5 min, using H2 as the carrier gas (1.0 mL·min−1). The injector and detector temperatures were 250 °C. The injection volume was 1.0 μL (2 mg sample/mL CH2Cl2) in splitless mode. Linear velocity (ū) was 14 cm/s. MS interface temperature: 280 °C; mass range: 40–700 Daltons; scan speed: 150 u s−1; interval: 0.50 s (2 Hz). The volatile constituents were identified by comparing their retention indices and mass spectra with those reported in the literature or presented in the Wiley data system library of the GC-MS equipment.

2.5. Odor Activity Value

The odor activity value (OAV) of a volatile compound was calculated by taking the ratio between the content of each compound and its detection threshold concentration [17]. The detection threshold concentrations were obtained from the literature.

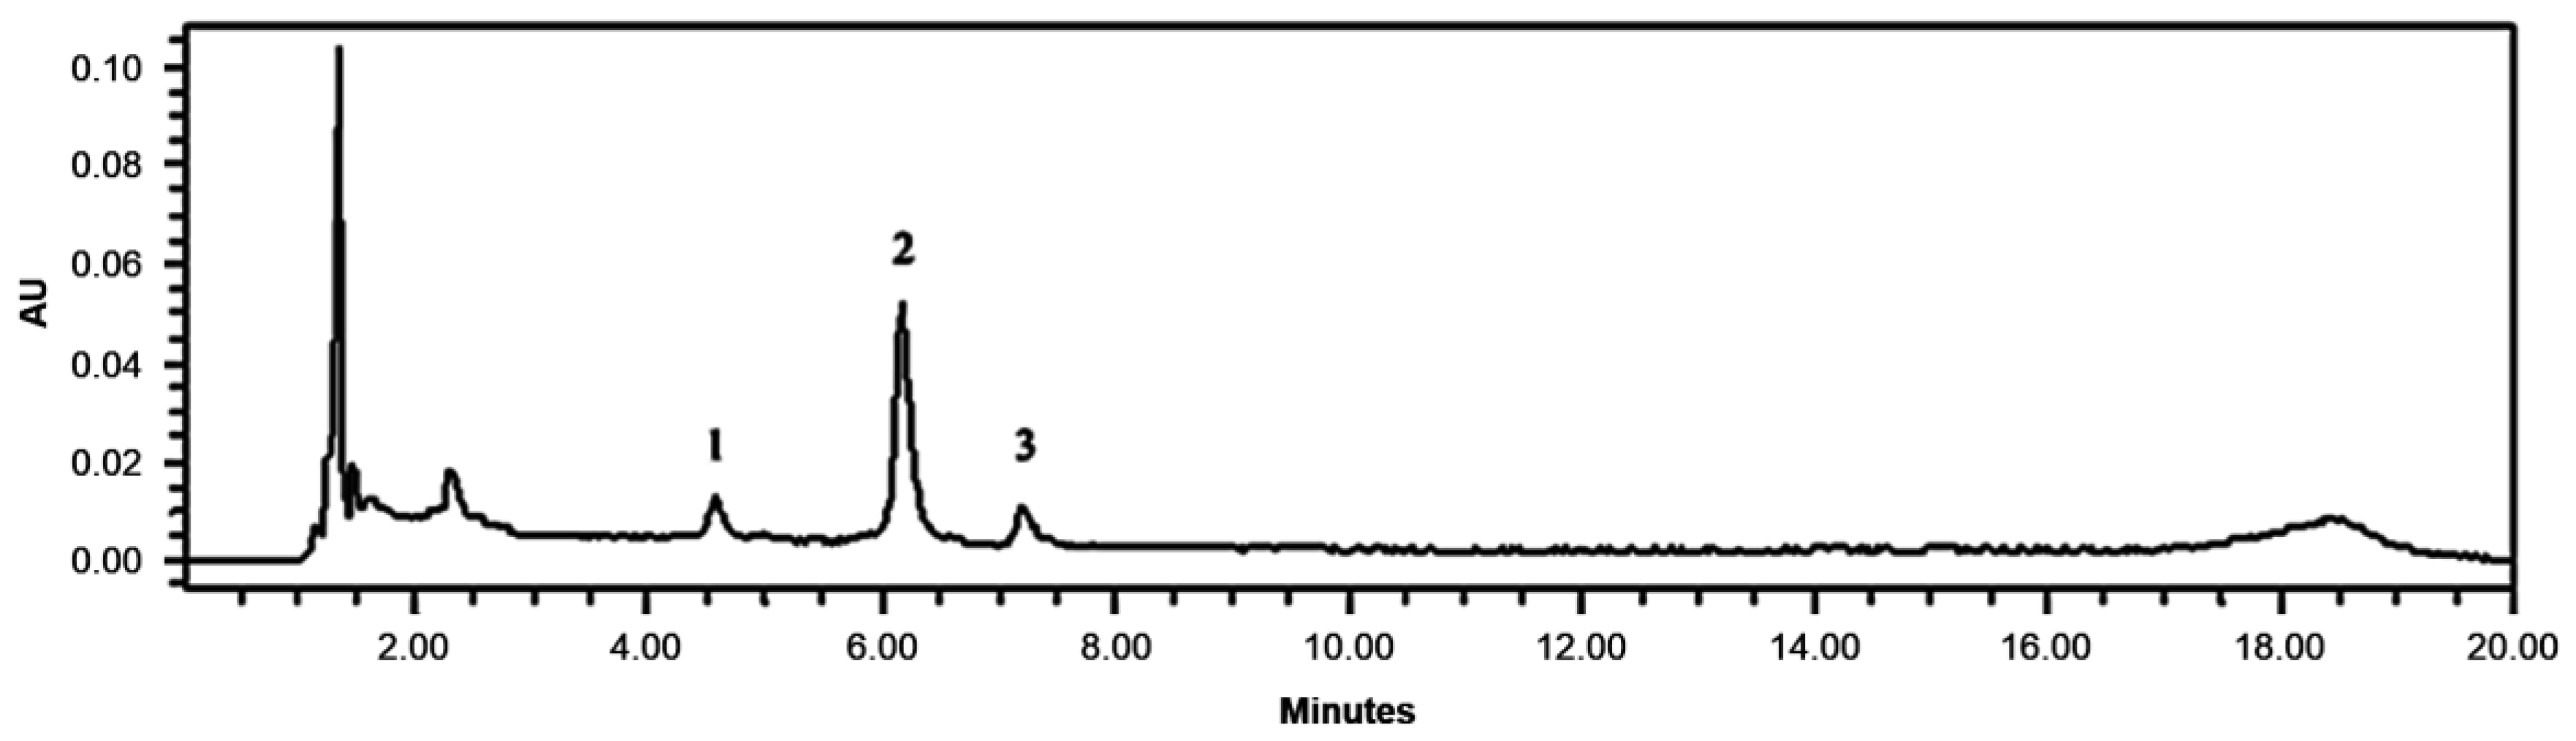
2.6. Anthocyanins Analysis by HPLC

The analysis was performed in a Waters™ Alliance 2695 chromatograph equipped with a Waters™ 2996 photodiode detector and a Thermo™ Scientific C18 BDS column (100 mm × 4.6 mm; 2.4 μm). Elution was performed at a flow rate of 1.0 mL/min, using a column temperature of 40 °C, and injection volume of 20 μL of fresh sample. The elution method consisted of a gradient of 5% formic acid/water (5:95; v/v) as solvent A and acetonitrile as solvent B [18]. The two major anthocyanins, delphinidin-3-O-glycoside and cyanidin-3-O-glycoside, were quantified from the calibration curves constructed with analytical standards in the range of 430 to 780,000 µg·L−1. A third chromatographic peak was quantified using a cyanidin-3-O-glycoside standard calibration curve in the same range. The result was expressed as µg cyanidin-3-O-glycoside equivalent per liter (µg Cy3GEq·L−1).

2.7. Total Phenolic and Flavonoids Contents

The total phenolic content (TPC) was determined as previously described [19] with some modifications. The lyophilized sample (15 mg) was diluted in distilled water (10 mL) and filtered through Whatman ® qualitative filter paper N°.1. In dark conditions, 0.1 mL aliquots were added to 0.5 mL of Folin-Ciocalteu reagent (10% w/v). After 5 min, 0.4 mL of sodium bicarbonate (7.5% w/v) was added. A gallic acid calibration curve was constructed (7.0–200 μg·mL−1) and analyzed following the same conditions as the samples. The mixture was kept for 2 h in the dark and then the absorbance was read at 740 nm (Multiscan FC, Thermo Fisher Scientific, Inc.). Results were expressed as g of gallic acid equivalent per L of wine (g GAE·L−1).
The analysis of total flavonoid content (TFC) followed the protocol described by Ferreira et al. (2009) [20] with modifications. The lyophilized sample (1 mg) was diluted in 1.25 mL of distilled water. Then, 75 μL of a NaNO2 solution (5% w/v) was added to the samples. After shaking, the sample was kept at rest for 6 min. Subsequently, 150 μL of an AlCl3 solution (10% w/v) was added to the mixture, followed by 0.5 mL of a 1 M NaOH solution 5 min later. Finally, the final volume was set to 2.5 mL with distilled water. Quercetin was used to construct a calibration curve (50–550 μg·mL−1). The absorbance of the sample was measured at 510 nm. The results were expressed as g of quercetin equivalent per L of wine (g QE·L−1).

2.8. Evaluation of Antioxidant Capacity

The antioxidant capacity using 2,2-azino-bis(3-ethylbenzothiazoline-6-sulfonic acid) (ABTS) free radical was determined as previously described [21]. ABTS•+ was prepared from 5 mL of ABTS aqueous solution (7 mM) and 88 µL of a 140 mM K2S2O8 solution. This mixture was stored for 16 h at room temperature in the absence of light. Then, the solution was diluted with absolute ethanol until obtaining an absorbance of 0.700 at 734 nm. Subsequently, 1 mL of the solution of ABTS•+ was mixed with different concentrations of the extracts (1.25–15 µg·mL−1, final concentrations). After 6 min at room temperature, the absorbance was measured in a spectrophotometer at 414 nm (Bel UV-M51, BEL Engineering®, São Paulo, SP, Brazil). Trolox was used as the reference antioxidant agent (0.25–5 µg). The 50% effective concentration (EC50) of the samples and standard was determined by regression analysis.
DPPH (2,2-diphenyl-1-picrylhydrazyl) radical scavenging activity of jabuticaba wine extracts was determined as previously described [22] with modifications. JWE (15 mg) was diluted in 100 μL of distilled water, and the volume was set to 10 mL in absolute ethanol. Due to the low yield, 6 mg of fractions JWF1 and JWF2 or 3 mg of fraction JWF3 were diluted in 100 μL of distilled water, which later also had the volume set to 10 mL in absolute ethanol. Antioxidant activity was determined by adding 50 µL of 0.3 mM DPPH to 125 µL of samples at different concentrations (1.2–200 μg·mL−1). The absorbance was measured at 518 nm after 30 min in the dark (Multiscan FC, Thermo Fisher Scientific, Inc. Waltham, MA, USA). Trolox was used as a reference antioxidant agent (0.28–25 µg·mL−1). The EC50 of the samples and standard was determined by regression analysis.

2.9. AAPH-Induced Oxidative Stress against RBC

Ovis aries (sheep) red blood cells (RBC) were used to evaluate hemolysis induced by oxidative stress. Blood samples from a healthy animal were purchased from EBE Pharma Biológica e Agropecuária (Rio de Janeiro, RJ, Brazil). The RBCs were collected by centrifugation (2000 rpm/5 min) after four washing cycles with cold phosphate buffer saline (PBS, pH 7.4). Subsequently, a 10% RBC suspension was prepared in cold PBS. Aliquots (1 mL) from the RBC suspension were distributed into 10 mL Erlenmeyer flasks containing 4 mL of a 2,2′-azobis(2-methylpropionamidine) dihydrochloride solution at different concentrations (1 to 12 mM AAPH in PBS, final concentrations). The cells were incubated in a Dubnoff shaking water bath (QUIMIS®, São Paulo, SP, Brazil) at 37 °C for 4 h. AAPH decomposes at 37 °C into peroxyl (ROO) and alkoxyl (RO) radicals [23]. Then, 0.5 mL were transferred from each flask to microcentrifuge tubes containing 1 mL of cold PBS to inhibit AAPH decomposition. Positive (100%) and negative (0%) controls of hemolysis were performed using untreated cells added with distilled water or PBS, respectively. The tubes were centrifuged, and the supernatants (0.2 mL) were transferred to 96-well microplates. The hemoglobin released after RBC breakdown was used to determine the hemolysis caused by oxidative stress. For this, a spectrophotometric assay was carried out at 540 nm by using a microplate reader (Multiscan FC, Thermo Fisher Scientific, Inc. Waltham, MA, USA). The percentage of hemolysis was calculated as follows.
(AbsA − AbsB) ∗ 100/(AbsC − AbsB),
where AbsA: supernatant of AAPH-treated cells; AbsB: supernatant of negative control; and AbsC: supernatant of positive control.
AAPH 50% oxidative concentration (OC50) was determined by linear regression fit of the dose-response curve.

2.10. Hematoprotective Activity Assay

The hematoprotective effect of jabuticaba wine extracts against oxidative stress was performed as previously reported [24] with modifications. First, a 10% RBC suspension was obtained as described above. Then, 1 mL of cell suspension was transferred to 10 mL Erlenmeyer flasks, where the extracts were previously diluted in PBS (3.9 to 500 µg·mL−1, final concentrations). The cells were incubated under shaking at 37 °C for 30 min. Subsequently, 70 µL of 500 mM AAPH was added to each flask (7 mM, OC50 final concentration). The RBCs were incubated for 4 h, and aliquots (0.5 mL) were taken each hour and processed as described above to evaluate spectrophotometrically (540 nm) the hematoprotective effect. Untreated cells were used as a negative control of oxidation. A control of 100% hemolysis was obtained using distilled water. Ascorbic acid was used as a reference antioxidant agent. The maximal and submaximal concentrations that provided a hematoprotective effect after 4 h of oxidative stress were used as controls (Figure S2). The results were expressed as a percentage of hemolysis using the equation described above.

2.11. Total Cellular Antioxidant Power (TCAP)

RBCs were treated with JW extracts at the maximal hematoprotective concentrations and then challenged with 7 mM AAPH for 4 h at 37 °C as described above. Controls (untreated and AAPH-challenged cells) were performed as well. After the incubation period, 0.5 mL of cell suspensions were transferred to microcentrifuge tubes containing 1 mL of cold PBS. Then, the cells were washed twice by centrifugation (2000 rpm/5 min) and resuspended in 100 µL of cold lysis buffer (5 mM phosphate buffer, pH 7.4). After the cellular lysis, the tubes were centrifuged at 10,000 rpm/10 min and the supernatants were transferred to new tubes in an ice bath. The protein content of hemolysates was determined by the microtiter plate Bradford assay [25]. Subsequently, TCAP was determined using the microtiter plate FRAP method [26] with minor modifications. Aliquots of 20 µL (10 µg protein equivalent) of each sample were taken and added to 280 µL of a freshly prepared FRAP solution. The absorbance was measured at 595 nm, and the results were expressed as µM Fe2+/µg protein.

2.12. Liquid Chromatography-Mass Spectrometry Analysis

Samples were dried, solubilized in water (2 mg·mL−1, final concentration), and centrifuged at 12,000 rpm/10 min. Then, 2 µL of each sample supernatant was analyzed in the HPLC 1260 Infinity II system—Agilent Technologies (LC) using a C18 column, coupled with Orbitrap Q-Exactive—Thermo Scientific mass spectrometer (HRMS) with an electrospray ionization source (ESI). In addition, 0.1% of formic acid was added to the samples for positive ion mode ionization analysis, whereas 0.1% of ammonium hydroxide was used for negative ion mode ionization analysis. Analyses were performed using HPLC a Poroshell 120 EC-C18 column (2.1 × 100 mm i.d. 2.7 µm particle size). The gradient conditions were as follows: solvent A = water–0.01% formic acid or ammonium hydroxide, solvent B = acetonitrile, B = 60% in t = 40 min, and B = 100% in t = 45 min, with a flow rate of 0.3 mL/min−1. HRMS analysis conditions were high-purity nitrogen (N2) as auxiliary gas (sheath gas 0), and high-purity helium (He) as collision gas. The source voltage was 3.2 kV, S-Lens of 50–100, and the capillary temperature was 275 °C. MS spectra were acquired with a range of m/z 50–1200.

2.13. Data Processing and Annotation

The LC-HRMS/MS spectra of each sample were processed in the MZmine version 2.53 software. The parameters used in the positive ion mode ionization data processing were mass detection as 1.0 × 10⁷ for MS1 and 1.0 × 10⁴ for MS2, while the negative ion mode ionization was 2.0 × 10⁶ for MS1 and 1.0 × 10³ for MS2. Other parameters were used for both ionization modes: ADAP Chromatogram builder algorithm for chromatogram construction and wavelets performance deconvolution. Isotopes were removed through the Isotopic Peaks Grouper, using the most intense isotope as a representative, and aligned with the join aligner tool. The data were tentatively identified using a custom database search from the Laboratório de Fitoquímica e Farmacognosia (Laboratory of Phytochemistry and Pharmacognosy) at Universidade Federal do Rio de Janeiro (UFRJ, Rio de Janeiro, RJ, Brazil). Furthermore, the unitary mass and fragmentation patterns were compared with data from PubChem and MassBank websites, and the GNPS platform. Finally, a Venn diagram was constructed using the Bioinformatics & Evolutionary Genomics webserver (bioinformatics.psb.ugent.be/webtools/Venn/) to compare the ion profiles of samples.

2.14. Statistical Analysis

All the analytical procedures were performed in triplicate. Shapiro-Wilks test was used for testing the normality of data (p > 0.05). Then, the analysis of variance (one-way ANOVA) followed by Tukey’s posthoc test was performed for the TPC, TFC, and antioxidant capacity data using XLSTAT® software (version 2014, Addinsoft, Paris, France). For the analysis of TCAP data, a one-way ANOVA, followed by Dunn’s posthoc test, was performed using the same software. p < 0.05 was considered significant.

3. Results and Discussion

3.1. Volatile Compounds

The SPME-CG/MS analysis of jabuticaba wine identified alcohols, aldehydes, ketones, esters, hydrocarbons, carboxylic acids, and terpenoids as the main VOC, totaling 45 compounds (Table 1). The predominant chemical class was aliphatic alcohols, which accounted for 55.3% of the total substances identified. The second largest class was esters (28.3%), while aliphatic aldehydes and ketones were the third largest class, representing 5.8% of the total substances identified in the wine. It is worth mentioning that the most abundant substance does not necessarily mean that it is the one that most influences the aroma, that is, the perception of a smell. This influence is due to the sensory detection threshold, which indicates the concentration of a given VOC (usually in water) required to cause odor perception [27]. Thus, the odor activity (Odor Activity Value—OAV) is extremely important to explain the real capacity that each VOC has to make up the final aroma; this is because the final odor activity value (OAV > 1) may or may not be significant, as it depends on the concentration and the detection threshold [28]. Table 1 shows the major substances that influence the aroma perception in jabuticaba wine regarding the OAV values. Interestingly, ethanol, isoamyl alcohol, and ethyl acetate were the volatile substances in the wine with a maximum detection of 447.3, 459.5, and 364.5 ppb, respectively; however, due to the odor threshold values [29,30], the observed OAV values (<0.1) indicate that these volatile substances poorly contribute to the aroma.
Among all the substances detected in the jabuticaba wine, the monocyclic monoterpene 1,8-cineole displayed the highest odor activity (OAV = 26.9). The odor description for the 1,8-cineole generally refers to camphor, cool, eucalyptol, and mint [31]. Among the 14 esters identified, two showed OAV > 1, which represents an important contribution to the aroma complexity of jabuticaba wine. Indeed, ethyl octanoate (OAV = 5) and ethyl cinnamate (OAV = 4.6) contribute with notes that refer to burned and beer [32], and balsamic, cinnamon, floral, fruit, and honey, respectively [31]. Aldehydes were the third most abundant chemical class of VOC in jabuticaba wine. These compounds displayed low odor threshold (OT) values and therefore some expressive OAV values. Among the 7 aldehydes identified, two of them displayed an OAV > 1, nonanal (OAV = 2.0), and decanal (OAV = 3.3). These compounds contribute to the floral and fruity aroma [31].
An aroma composition in fruit comes from an intricate biosynthetic network that, from fundamental precursors, carbohydrates, lipids, and amino acids, leads to a plethora of substances with the most varied structural characteristics. Aldehydes, esters, and alcohol biosynthesis originate from fatty acids, and their mechanisms are associated with oxidative processes, notably 𝛼-oxidation, 𝛽-oxidation, autoxidation, and the lipoxygenase pathways [33,34]. In addition to these biosynthetic routes, the metabolic process orchestrated by yeasts during the fermentation of P. jaboticaba fruits, including the Ehrlich pathway and carbon metabolism, leads to the biosynthesis of alcohols [35] such as isoamyl alcohol and ethanol. Alcohols, in turn, are involved in the production of acetate esters during the fermentation process via a reaction with acetyl-CoA catalyzed by alcohol acetyltransferase and other enzymes, or ethyl esters are formed from the ethanolysis of acyl-CoA during fatty acid synthesis or degradation [36,37].
Table 1. Volatile organic compounds profile and odor features of jabuticaba wine. Odor descriptors, odor threshold, and odor activity value of jabuticaba wine extracted by SPME-CG/MS using PDMS-DVB fiber.
CompoundCompound Content
(ppb)
Odor descriptor *Odor Threshold **
(ppb)
OAV
Alcohols
Ethanol447.3 ± 8.03Fruity [29]100,000 [29]<0.01
Isoamyl alcohol459.5 ± 9.95Fusel, whiskey, malt, burnt [30]30,000 [30]0.02
1-Dodecanol5.2 ± 0.61Raw carrot, medicinal [38]730 [39]0.01
1-Tridecanol 8.3 ± 1.82---
Pentadecanol 5.0 ± 0.62---
N-Tetradecanol57.4 ± 2.90Cinnamon [31]--
Hexadecanol24.1 ± 4.46flower, wax [31]750 [40]0.03
1-Octadecanol 30.6 ± 4.40-8700.04
1-Eicosanol 5.6 ± 1.35 --
α-Methylbenzyl alcohol77.6 ± 4.01Floral, honey,
rose [31]
750 [41]0.10
Aldehydes and ketones
Nonanal 2.0 ± 3.39Floral [42]1 [42]2.0
Decanal6.7 ± 0.52Orange skin-like, floral [43]2 [43]3.3
α-Hexylcinnamaldehyde 9.9 ± 0.61Fresh, floral, herbal [44]50 [44]0.2
5,9,13-Trimethyl-4,8,12-tetradecatrienal 29.7 ± 7.22---
Dodecanal 1.0 ± 1.74Fatty, citrus-like [43]2 [43]0.5
Hexadecanal1.3 ± 2.18leathery,
burnt rubber [1]
75 [40]0.02
(4E,8E,12E,16E)-4,8,13,17,21-Pentamethyl-4,8,12,16,20-docosapentaenal24.0 ± 4.60---
3-Octanone 3.1 ± 5.41 Buttery, herbal,
moldy [31]
28 [31]0.1
Neryl acetone40.5 ± 3.34---
Esters
Ethyl acetate364.5 ± 5.59-5000 [29]0.07
Diethyl succinate85.4 ± 3.17Fruity, watermelon [45]200 [45]0.4
Ethyl octanoate 24.8 ± 3.20Burnt, beer [32]5 [32]5.0
Phenethyl acetate4.9 ± 0.46Rose, floral, fruity, sweet [45]250 [45]0.02
Ethyl decanoate 8.8 ± 0.74Grape, floral, soapy [30]6300 [29]<0.01
Ethyl 3-methylbutyl butanedioate19.8 ± 2.39---
Ethyl cinnamate 4.6 ± 0.56Strawberry, fruity, honey, cinnamon [46]1.1 [46]4.2
Ethyl dodecanoate5.0 ± 0.85-5900 [29]<0.01
Methyl palmitate 7.4 ± 0.36Ester-like [31]2000 [47]<0.01
Isopropyl myristate8.9 ± 1.53 Faintly oily, fatty [48]--
2-Octyl benzoate4.1 ± 3.61---
2-Methylbutyl salicylate 7.8 ± 0.35---
1-(4-Isopropylphenyl)-2-methylpropyl acetate25.2 ± 2.06---
Nonyl 2-methylpropanoate2.8 ± 4.85---
Hydrocarbons
Tetradecane 1.1 ± 1.83---
Hexadecane 14.3 ± 3.21---
Phytane36.9 ± 2.95---
Carboxylic acid
Octanoic acid 19.0 ± 3.20Fatty acid, cheese [45]500 [45]0.04
Decanoic acid 4.2 ± 0.52Rancid fat [30]10,000 [29]<0.01
Tetradecanoic acid 13.6 ± 3.87-10,000 [41]<0.01
Pentadecanoic acid 20.3 ± 12.78-10,000 [29]<0.01
4-Octylbenzoic acid32.2 ± 7.88---
Terpenes
1,8-Cineole35.0 ± 3.13Camphor, cool, eucalyptol, minty [31]1.3 [29]26.9
Isomethyl-β-ionone 5.7 ± 2.35---
β-Selinene13.7 ± 4.33Herbal [31]--
Juniper camphor2.9 ± 2.73---
* Odor descriptor as reported in the literature; ** Odor threshold as reported in the literature; OAV, Odor activity value; —, data not detected or not available.

3.2. Anthocyanin Content of Jabuticaba Wine

Cyanidin-3-O-glucoside and delphinidin-3-O-glucoside contents were determined in jabuticaba wine by HPLC. As previously demonstrated [49], these anthocyanins are major pigments found in the fruit bark and display an important role in the color features of jabuticaba-derived products. The amounts of delphinidin-3-O-glucoside and cyanidin-3-O-glucoside were 90,000 and 680,000 µg·L−1, respectively. In addition, a third peak with a retention time (RT) of 7.2 min was also detected in the chromatogram (Figure 1). Intriguingly, the amounts determined (70,000 µg Cy3GEq·L−1) were very close to that of delphinidin-3-O-glucoside. The DAD data provided some evidence about the anthocyanin identity of peak 3 but not about the sugar moiety that might be linked to it. The maximum absorption at 500 nm suggested that it might be a pelargonidin glucoside [50]. In fact, Quatrin et al. (2019) first described the presence of pelargonidin-3-glucoside on Myrciaria jaboticaba (syn. P. jaboticaba) and Myrciaria trunciflora (syn. Plinia trunciflora) fruits. In that study, pelargonidin-3-glucoside was detected at 1.9 mg·100 g−1 [51]. Here, an analytical standard of pelargonidin-3-glucoside was used to identify the anthocyanidin. However, a different chromatogram profile was observed with an RT of 8.1 min (data not shown). The presence of another major anthocyanin is an interesting result since it could influence wine color features. Color attributes such as wine color, color density, and hue were previously demonstrated for artisanal jabuticaba wines [14].

3.3. Phenolic and Flavonoid Contents and Antioxidant Capacity

The predominant secondary metabolic classes in jabuticaba are the phenolic compounds [52]. Due to their antioxidant properties, phenolics and flavonoids also act to preserve the quality of beverages and for this reason, they are often evaluated in this type of product. In this study, TPC and TFC in jabuticaba wine were 2.66 ± 0.47 g GAE·L−1 and 2.51 ± 0.13 g QE·L−1, respectively. TPC content in the whole fruit was reported by Inada et al. (2015) as being 8.15 ± 0.52 g GAE·Kg−1 on a dry weight basis (dwb) [49]. The authors highlighted greater amounts of phenolic compounds in the peel (22.52 ± 0.69 g GAE·Kg−1 dwb) and seed (9.86 ± 0.47 g GAE·Kg−1 dwb) than in the pulp (0.2 ± 0.01 g GAE·Kg−1 dwb) of jabuticaba. Similar results to those found in the present study for TPC were reported by Geraldi et al. (2021) for jabuticaba juice (1.48 g GAE·L−1) [53]. These values were similar to those described by Santos et al. (2016) in Brazilian blueberry wines (TPC = 1.6 to 2.1 g GAE·L−1 and TFC = 1.1 to 2.6 g QE·L−1) [54].
Most antioxidant compounds of jabuticaba are concentrated in its peel, and this fruit has superior antioxidant activity when compared to other fruits that are considered significant sources of bioactive compounds. During the maceration step to obtain the fermented beverages, part of these compounds migrates to the beverage [3]. The in vitro antioxidant capacity of JWE and fractions (JWF1-JWF3) can be seen in Table 2. In this study, the DPPH•+ and ABTS•+ scavenging activities were expressed in EC50, which refers to the effective concentration capable of reacting with 50% of the radicals present in the solution. Therefore, the lower the EC50 value, the greater the antioxidant activity. It is noteworthy that a higher and significant (p < 0.05) antioxidant capacity was observed in both ABTS and DPPH assays for the fractions when compared to the JWE. The antioxidant capacity of freeze-dried jabuticaba wine extract was 4 and 10 times lower than the standard used for the ABTS and DPPH assays, respectively. Regarding the fractions, JWF2 and JWF3 showed higher antioxidant capacities when compared to JWF1. It is noteworthy that the radical scavenging activities (EC50) obtained for JWF2 and 3 were close to those observed for the Trolox standard.
The antioxidant capacity in jabuticaba wine was higher than that reported by Morales et al. (2016) for fermented (EC50 = 130 µg·mL−1) and non-fermented (EC50 = 262 µg·mL−1) jabuticaba pomaces by the DPPH method [5]. Lenquiste et al. (2015) evaluated the antioxidant capacity by ABTS and DPPH assays in jabuticaba (M. jaboticaba) peel powder and its aqueous extract and observed values of 4.46 μM TroloxE·mL−1 and 6.42 μM TroloxE·mL−1, respectively [55]. In a previous study, 1.71 g·100 mL−1 of grape wine decreased free radicals level by 50%. The wine displayed higher antioxidant activity than juice made with grapes from the same lot [56]. Jabuticaba wine and its fractions displayed high antioxidant potential, as they showed approximate values to jabuticaba extracts and grape wine described by other authors. In addition, Paula et al. (2022) demonstrated that the fermentation of jabuticaba can potentialize its antioxidant activity, which confers benefits to human health [3].

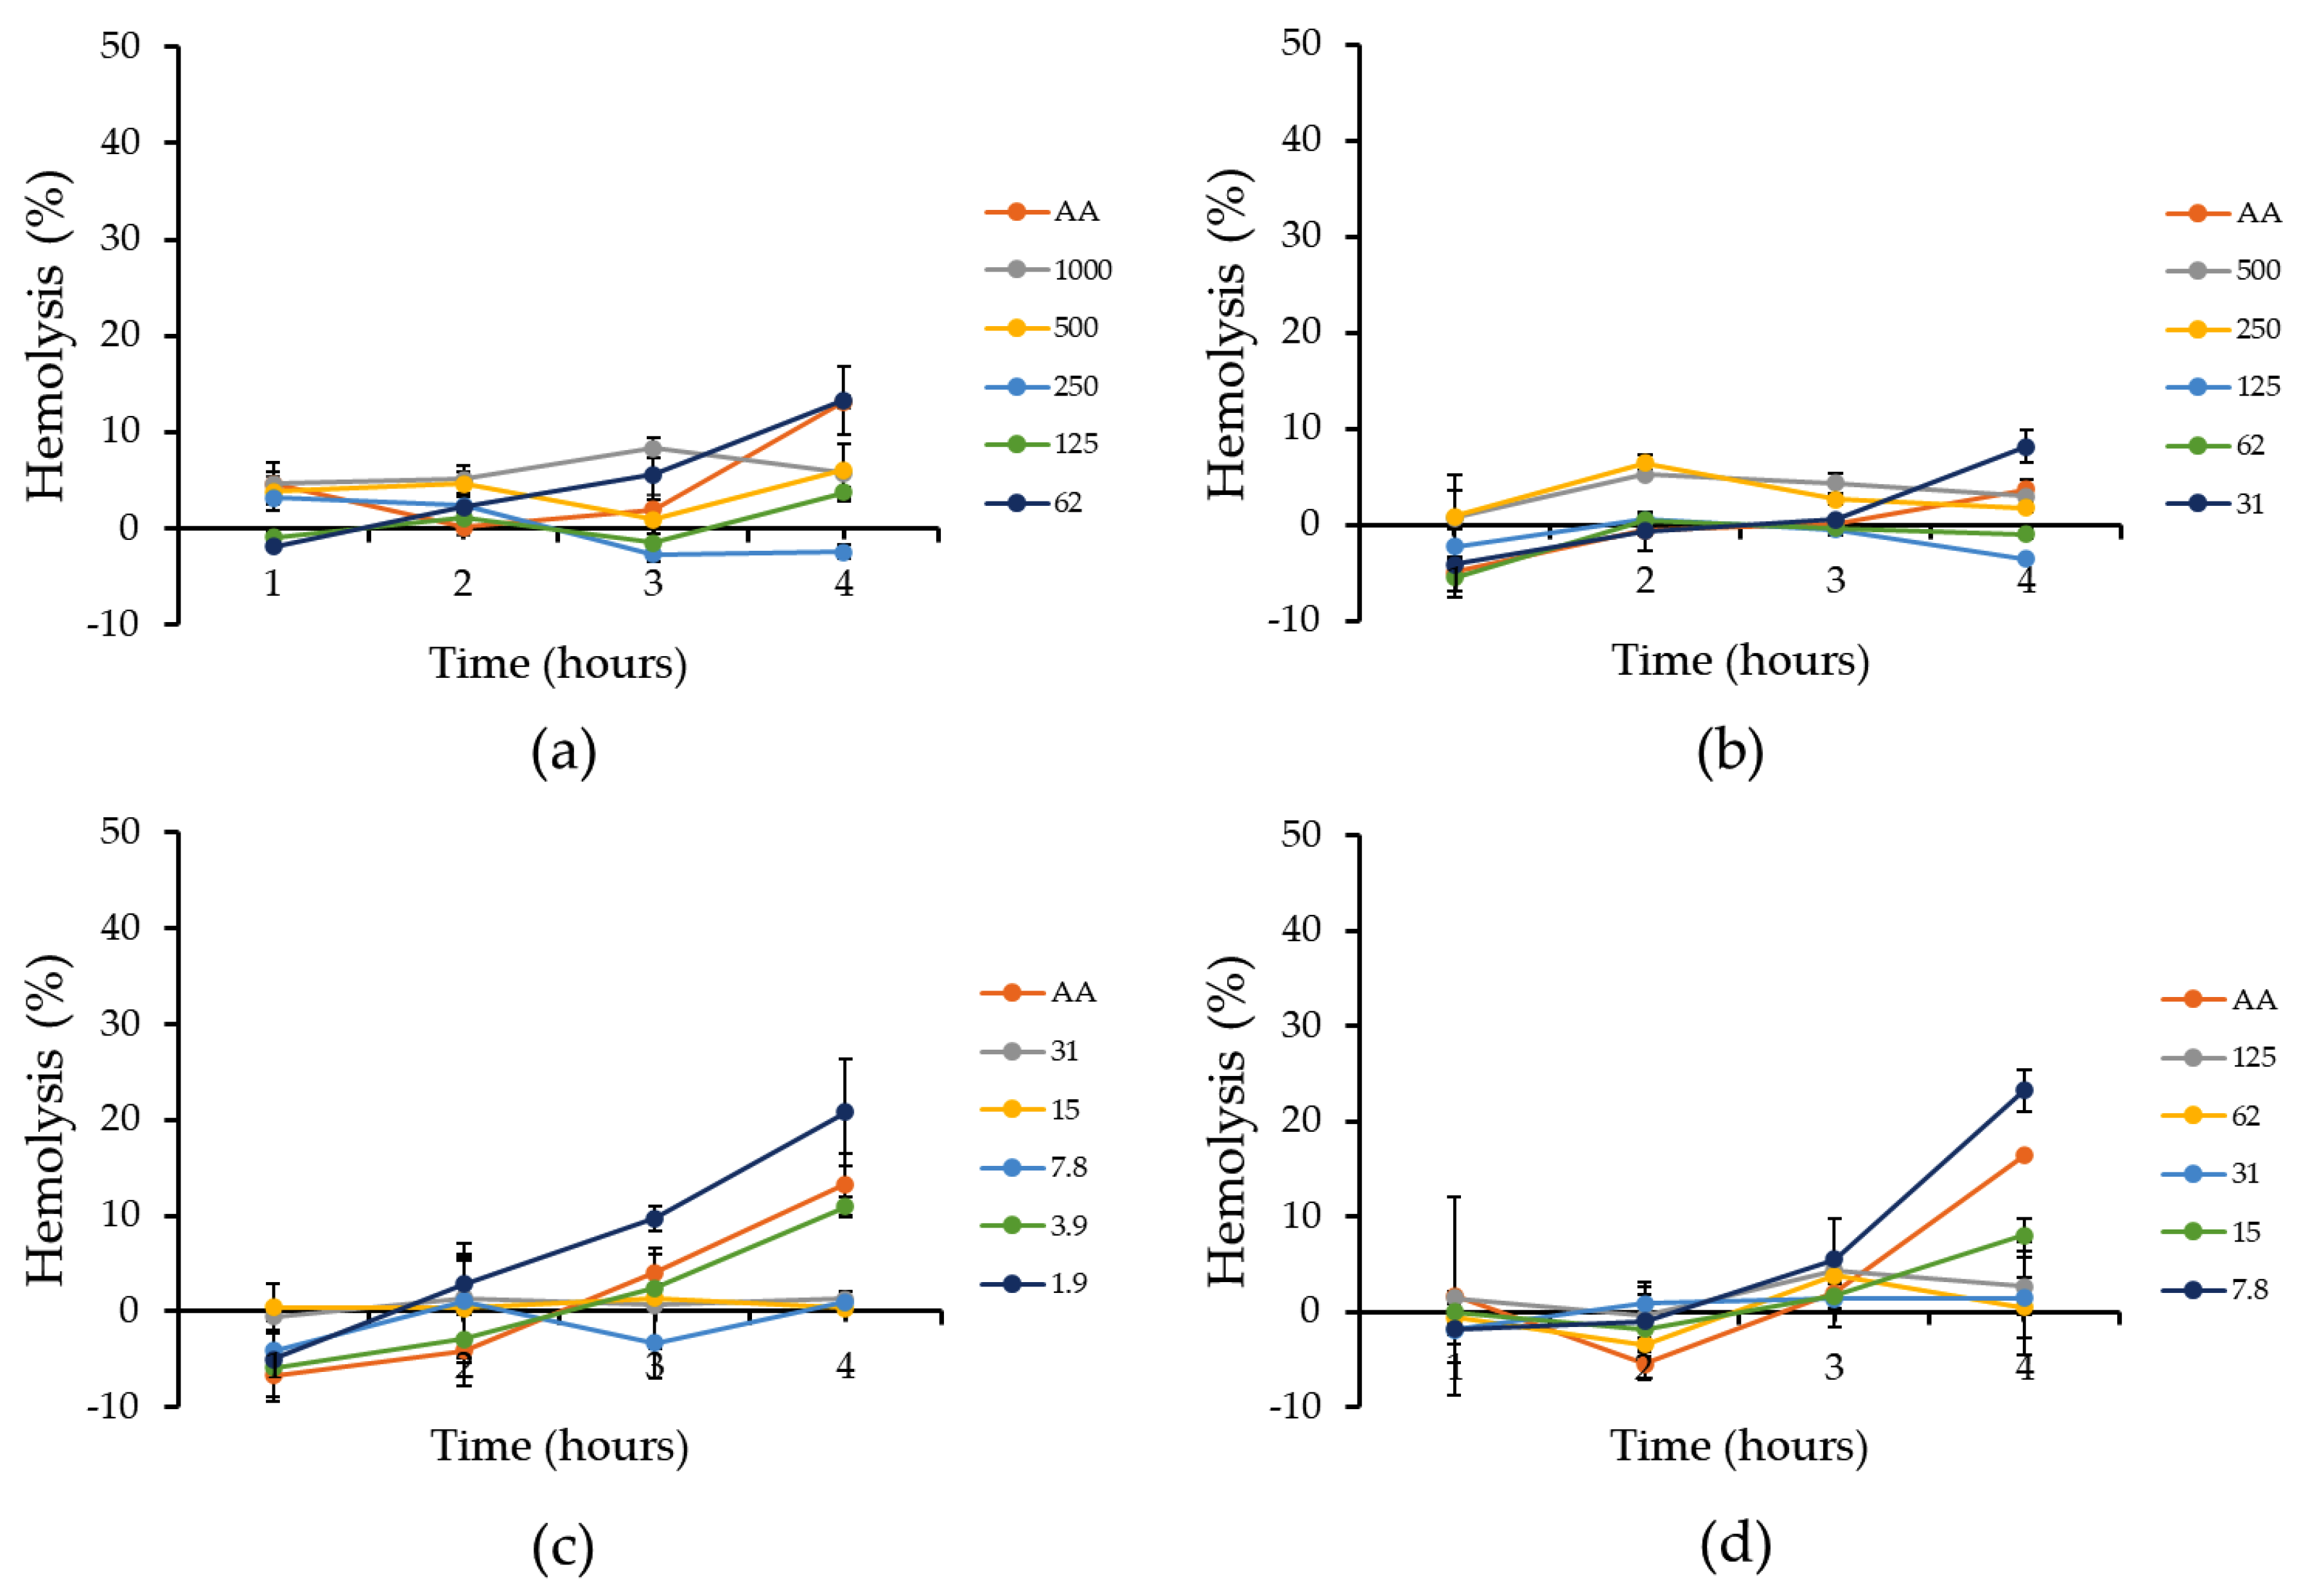
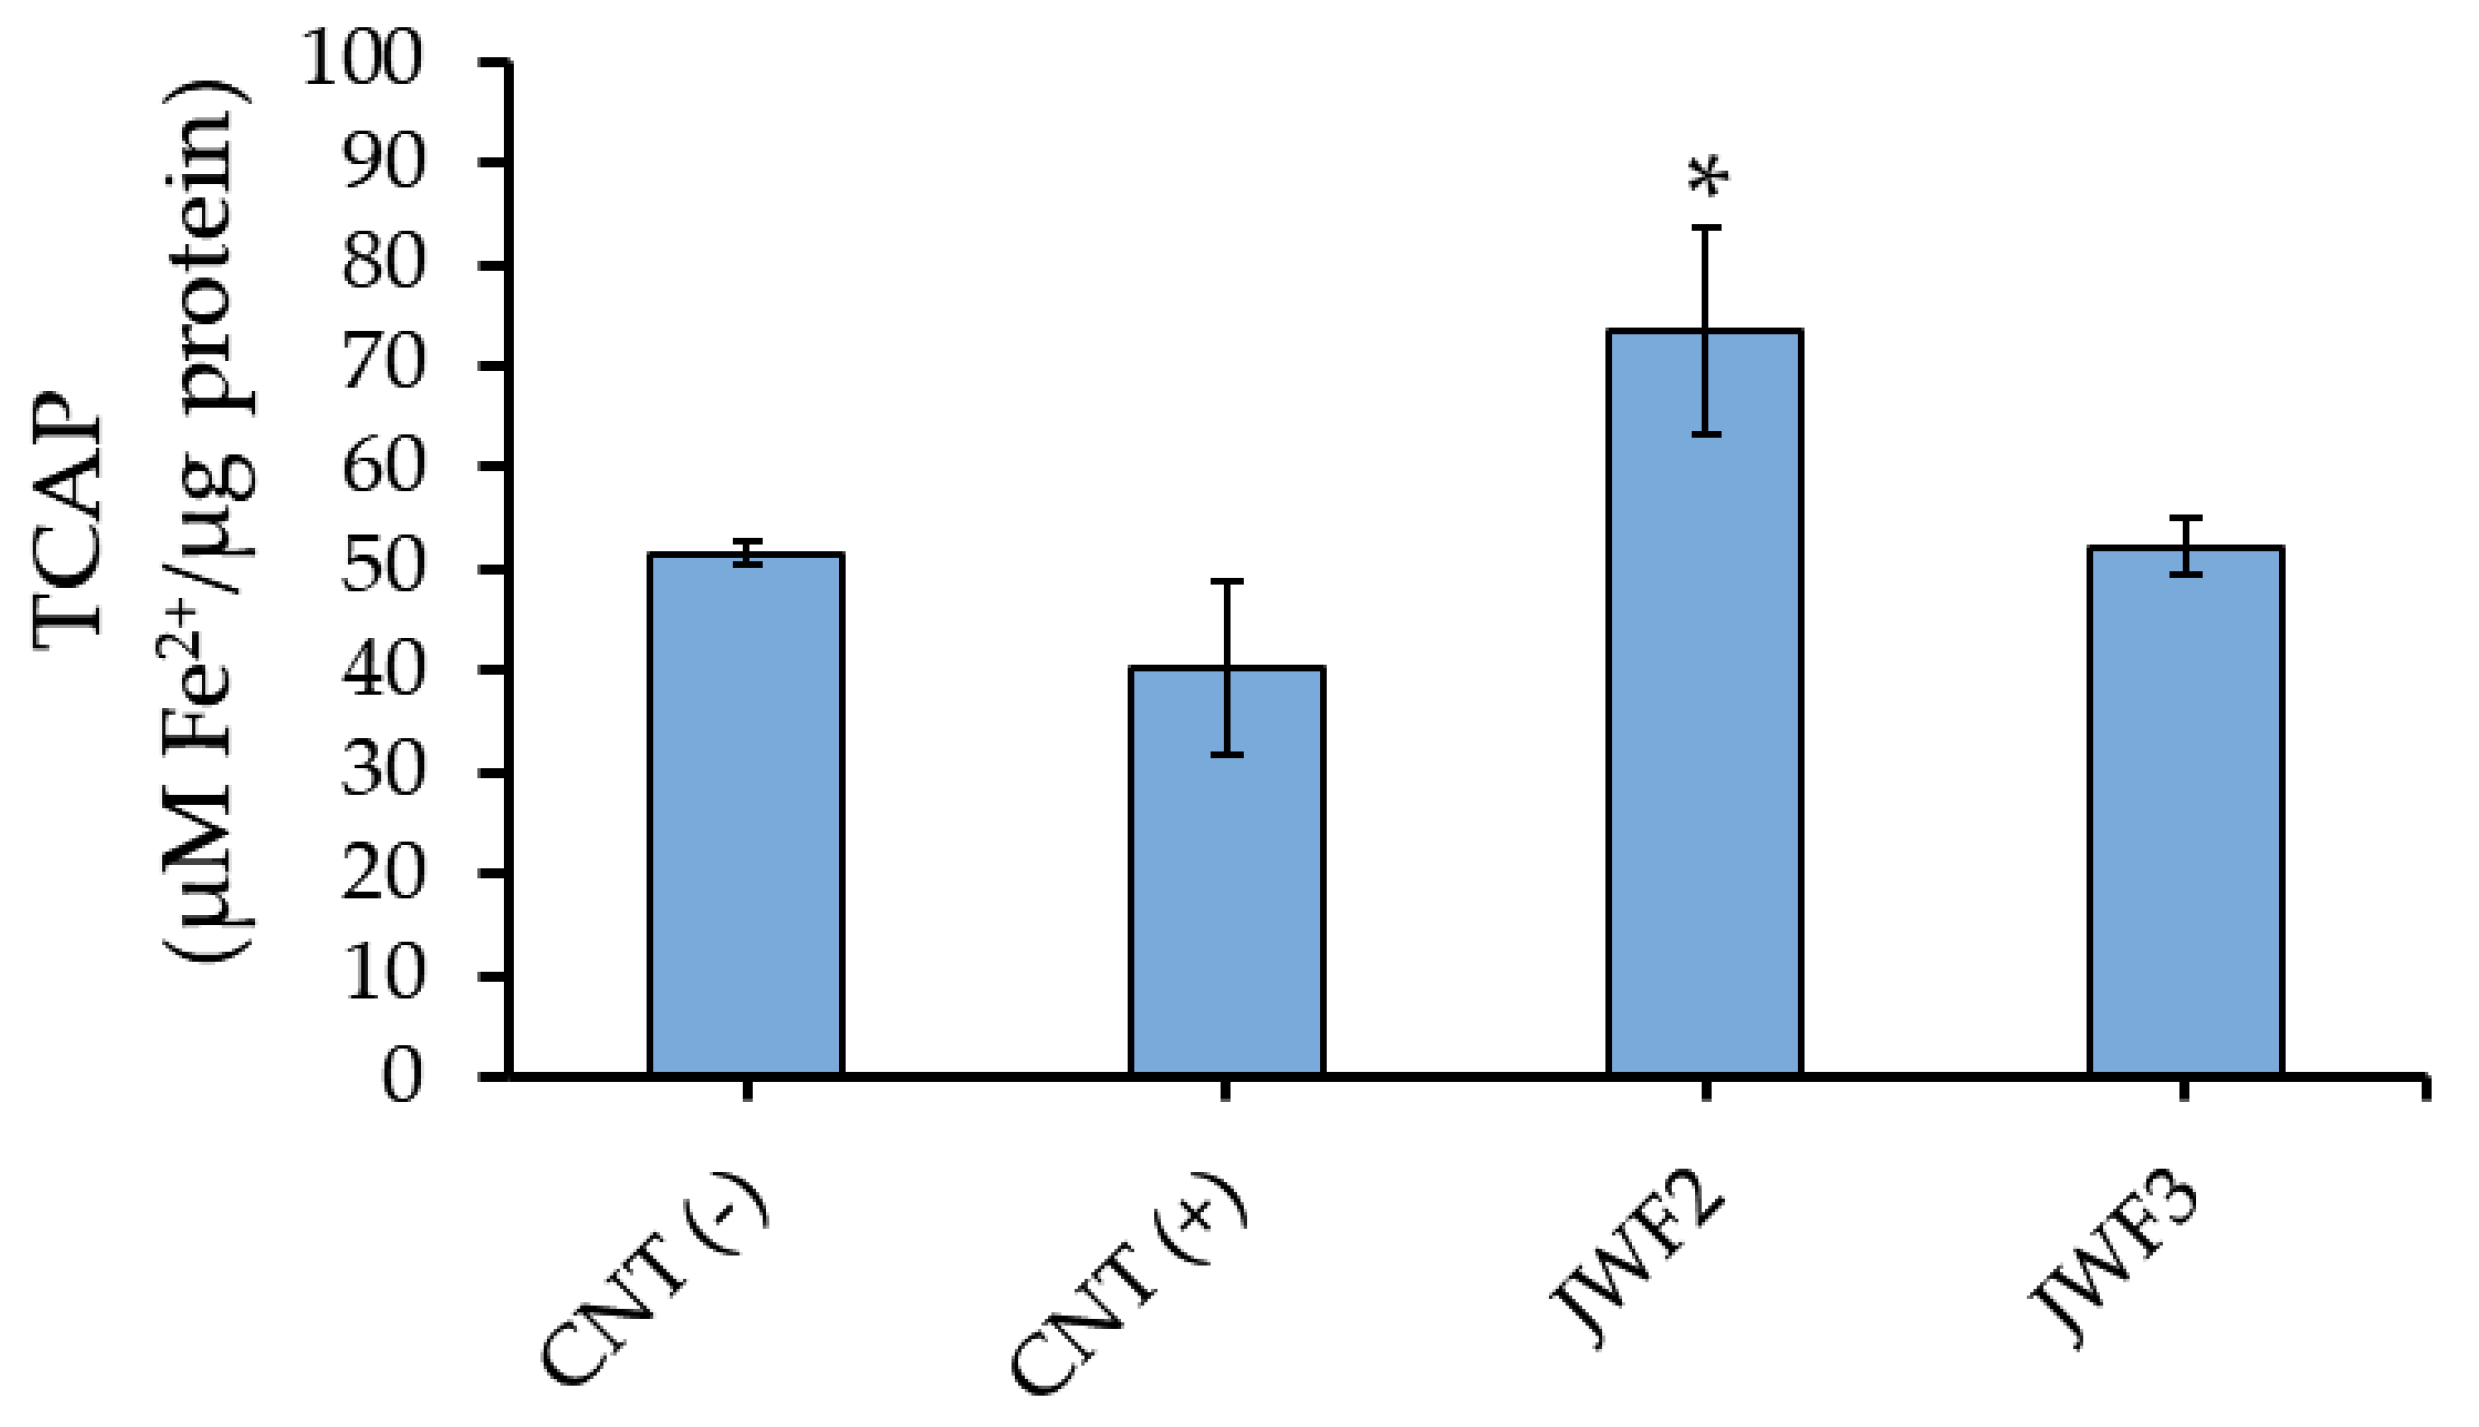
3.4. Hematoprotective Effect of Jabuticaba Wine Extracts

Jabuticaba wine extracts were evaluated as hematoprotective (antioxidant) agents against the oxidative stress induced by AAPH-derived free radicals. For this, we first determined the half-maximal oxidative concentration (OC50) of AAPH. This was an important step since the effective concentration of AAPH reported in previous studies is controversial. Effective concentrations varying from 20 to 200 mM were used to lead erythrocytes to oxidative damage [57,58,59,60,61]. In the present study, an OC50 of 7 mM was determined after erythrocyte exposure to AAPH (Figure S2), which allowed a better observation of the oxidative progress and cell lysis. In addition, ascorbic acid maximal (50 µM) and submaximal concentrations (6 µM) were also determined as antioxidant controls (Figure S3).
All the extracts displayed antioxidant activity by preventing RBC lysis in a dose-dependent manner (Figure 2). In addition, the partitioning procedure increased the hematoprotective effect of samples. After 4 h exposure to AAPH, we observed that JWF2 and JWF3 were the most active extracts. The maximal hematoprotective effect against oxidative stress was observed at 7.8 and 31 µg/mL, respectively. The result displayed by JWF2 was similar to that for ascorbic acid. The reference antioxidant agent showed maximal hematoprotective effect at 50 µM (8.8 µg·mL−1). The less active extracts, JWE and JWF1, displayed maximal hematoprotective effects at 250 and 62 µg·mL−1, respectively. The fruits of different Plinia species have been investigated as sources of antioxidants. Previously, Lenquiste et al. (2015) demonstrated that jabuticaba (M. jaboticaba) peel powder and its aqueous extract increased the antioxidant mechanisms of Wistar rats, including catalase activity and GSH levels [55]. Recently, extracts derived from M. cauliflora seeds were reported as hematoprotective agents since they were able to attenuate the oxidative damage induced by AAPH on human RBC [57]. Both studies highlighted phenolics, especially flavonoids, as responsible for antioxidant bioactivity. Despite the hematoprotective effect of jabuticaba peels and seeds, it is worth mentioning that the fermentation process enhances the antioxidant properties of plant-based products through the biotransformation of phenolics into more active compounds [62], which turns fermented jabuticaba products (wine or its derived extracts) into an interesting source of bioactives. To the best of our knowledge, this is the first report on the hematoprotective effect of jabuticaba wine-derived extracts.
JWF2 and JWF3 were the most effective antioxidant agents. Thus, their effect on RBCs’ total antioxidant power was determined from the hematoprotective assay (Figure 3). After the AAPH challenging, JWF3 displayed a similar TCAP level (52 ± 3 µM Fe2+·µg−1 protein) to that of untreated cells (52 ± 1 µM Fe2+·µg−1 protein). This result suggests that this fraction maintained the intracellular antioxidant status of RBCs. In turn, JWF2 increased the TCAP levels of RBCs when compared to controls and JFW3. A significant difference (p < 0.05) was observed between this fraction (73 ± 10 µM Fe2+·µg−1 protein) and the AAPH-challenged RBCs (40 ± 9 µM Fe2+·µg−1 protein). Keshavarzi1 et al. (2022) demonstrated that grape juice and wine (0.15 mL/mL erythrocytes) can protect RBC from oxidative damage by increasing the cellular antioxidant mechanisms (total thiol group amount and catalase activity) and total antioxidant power after 24 h of treatment [63]. Interestingly, jabuticaba peel extract was reported as an inducer of catalase and glutathione s-transferase mRNA expression in muscle cells [64]. Here, we demonstrated that jabuticaba wine-derived fractions, especially JFW2, can protect RBCs from free radical attack and maintain the TCAP at levels that prevent cellular oxidative damage. Further investigation will be necessary to better understand jabuticaba wine-induced antioxidant mechanisms in RBCs.

3.5. Chemical Profile of Jabuticaba Wine Extracts

The chromatograms obtained by LC-HRMS/MS analysis in the negative ionization mode showed JWE as a complex sample, highlighting the signals at 9–16 min and 25–42 min RT (Figure S4). JWF1 showed greater abundance and more intense signals between 25–43 min RT, which is a region where more polar compounds are not typically found. Relevant signals between 24–38 min RT displaying m/z consistent with a flavonoid skeleton type were detected in JWF2. The chromatogram profile of JWF3 showed relevant signals in the intervals of 12–14 min and 28–38 min RT. The RT range is consistent with that of phenolic acids, which were tentatively identified in this study (Table 3). Regarding JWR, as expected, the chromatogram profile was similar to that of JWE, but with lower abundance and less intense ions. The results obtained in the positive ionization mode did not allow for verifying the efficiency of the partitioning process, as the chromatograms showed similar distribution, abundance, and ionic intensity (Figure S5). In addition, some expected compounds, such as pelargonidin or its glycosylated form could not be annotated. The ion intensity in the LC-HRMS/MS analysis was not relevant. The signals had a low count and were mixed with the analysis noise. Thus, there was no automatic fragmentation of the ions, preventing the analysis of the exact mass and fragmentation profile to confirm the presence of these compounds. After the LC-HRMS/MS analysis, 17 compounds were annotated, including carbohydrates, flavonoids, and organic acids (Table 2). These results agree with those previously reported for jabuticaba fruits [65,66].
Here, we demonstrated that JWF2 and JWF3 stood out due to their antioxidant properties, including their hematoprotective activity. However, the LC-HRMS/MS analysis showed minor amounts of relevant antioxidant compounds (quercetin, isoquercitrin, cyanidin, and gallic acid) when compared to the other extracts. The partitioning process probably contributed to enhancing the antioxidant activity of these samples by eliminating possible interferants present in the crude extract (JWE). In addition, antagonistic interactions between compounds in complex mixtures such as crude extracts may also occur [67]. It is noteworthy that some ions with relevant intensity in the chromatograms could not be annotated, as the profile of masses and fragmentation obtained were also not similar to the substances searched in public databases and literature. However, even though they were not annotated, similar signals with greater intensity (m/z 149.0233, 309.242, 313.2734, and 338.3413) in the chromatograms of the negative ionization mode analysis of JW2 and JW3 could be contributing to the antioxidant activity as well. In addition, Venn diagrams were constructed for better visualization of the intersections between these two samples and the determination of 47 ions in the negative ionization mode and 15 ions in the positive ionization mode that could be contributing to antioxidant activity (Figure S6). It demonstrated that ions visualized at the intersections between these samples may belong to the phenolic compounds and act as antioxidant agents. Finally, it is worth mentioning that the extracts analyzed here are still complex mixtures, which means that several components with antioxidant properties including peptides, organic acids, terpenoids, and wine preservatives (sulfites) not detected by the methods used here are potential contributors to total antioxidant activity.

4. Conclusions

In the present study, we provide a comprehensive analysis of the chemical composition, including volatile compounds, and antioxidant potential of artisanal jabuticaba wine. The predominance of aliphatic aldehydes (nonanal and decanal), esters (ethyl octanoate and ethyl cinnamate), and alcohols, especially the monoterpene alcohol 1,8-cineole, give the beverage aroma descriptors such as floral, fruity, burnt, beer, and fresh (camphor, cool, minty). The extracts obtained from the wine displayed important antioxidant capacity and were able to protect erythrocytes from chemically induced oxidative damage. In addition, JWF2 increased the intracellular antioxidant status of AAPH-challenged RBC. The partitioning process of the crude wine extract resulted in two fractions with strong antioxidant activity, similar to that of ascorbic acid. The removal of possible interferants probably contributed to the enhancement of fractions’ bioactivity. In addition to the main anthocyanins initially identified in the jabuticaba wine by HPLC, important antioxidant agents belonging to phenolic acid and flavonoid chemical classes were described in the extracts. Altogether, the results presented herein demonstrate that jabuticaba wine is a beverage with interesting aroma complexity and a source of bioactive compounds with hematoprotective effects. In addition, the jabuticaba wine reduction into crude extract and fractions pave the way for their usage as functional agents in food and pharmaceutical industries.

Supplementary Materials

The following supporting information can be downloaded at: https://www.mdpi.com/article/10.3390/fermentation9020157/s1, Figure S1: Total phenolic (TPC) and flavonoid (TFC) contents of jabuticaba wine extract (JWE); Figure S2: Determination of half maximum concentration for the hemolysis induced by AAPH oxidative stress (OC50); Figure S3: Hematoprotective effect of ascorbic acid against the hemolysis induced by AAPH oxidative stress; Figure S4: Jabuticaba wine extract (JWE), fractions (JWF1-3), and residue (JWR) chromatograms obtained by LC-HRMS/MS analysis in negative ionization mode; Figure S5: Jabuticaba wine extract (JWE), fractions (JWF1-3), and residue (JWR) chromatograms obtained by LC-HRMS/MS analysis in positive ionization mode; Figure S6: Venn diagram of the total ions obtained from HPLC-MS/MS data. (a) Data obtained in negative ionization mode; (b) Data obtained in positive ionization mode.

Author Contributions

Conceptualization, C.S.C. and I.A.R.; formal analysis, M.V.T.S. and B.A.G.; investigation, R.L., M.V.T.S., B.A.G., E.H.B.C.M., M.N.S., P.G.C. and M.C.P.A.S.; resources, A.C.F.A., J.R.A.S., R.L.O.G., S.G.L., R.C.S., C.S.C. and I.A.R.; writing—original draft preparation, M.V.T.S., B.A.G., A.C.F.A., J.R.A.S., R.C.S., C.S.C. and I.A.R.; writing—review and editing, R.L.O.G. and S.G.L.; visualization, R.C.S., C.S.C. and I.A.R.; supervision, I.A.R.; project administration, I.A.R.; funding acquisition, J.R.A.S., C.S.C. and I.A.R. All authors have read and agreed to the published version of the manuscript.

Funding

This research was funded by Fundação de Amparo à Pesquisa do Estado do Rio de Janeiro (FAPERJ), grant numbers E-26/202.752/2018, E-26/201.418/2022, and E-26/201.362/2022; and Fundação de Amparo à Pesquisa do Estado do Amazonas (FAPEAM) (Edital n. 006/2019—Universal Amazonas Program).

Institutional Review Board Statement

The animal study protocol was approved by the Institutional Ethics Committee of Universidade Federal do Rio de Janeiro (protocol code CEUA 077/22, approval date: 31 August 2022).

Data Availability Statement

The data that support the findings of this study are available from the corresponding author upon reasonable request.

Acknowledgments

The authors thank Mylena Ribeiro Castro, Shara Barbosa Goulart de Souza, and Pedro Henrique da Silva Fonseca for their technical support. The authors also thank the Laboratório de Cromatografia e Espectrometria de Massas (Laboratory of Chromatography and Mass Spectrometry) at the Universidade Federal de Goiás (UFG, Brazil) for providing the LC-HRMS/MS system to carry out this study.

Conflicts of Interest

The authors declare no conflict of interest. The funders had no role in the design of the study; in the collection, analyses, or interpretation of data; in the writing of the manuscript; or in the decision to publish the results.

Ethical Statement

Blood samples from Ovis aries were purchased from EBE Pharma Biológica e Agropecuária (Rio de Janeiro, RJ, Brazil). Ethical approval was obtained from the Institutional Ethics Committee (CEUA/UFRJ 077/22).

References

  1. Chen, Y.; Yin, H.; Wu, X.; Shi, X.; Qi, K.; Zhang, S. Comparative analysis of the volatile organic compounds in mature fruits of 12 Occidental pear (Pyrus communis L.) cultivars. Sci. Hortic. 2018, 240, 239–248. [Google Scholar] [CrossRef]
  2. Plagemann, I.; Krings, U.; Berger, R.G.; Marostica Jr, M.R. Volatile constituents of jabuticaba (Myrciaria jaboticaba (Vell.) O. Berg) fruits. J. Essent. Oil Res. 2012, 24, 45–51. [Google Scholar] [CrossRef]
  3. Paula, D.G.C.D.; Vasconcelos, C.M.; Pereira, A.F.; Quintão, A.L.D.C.; Chaves, J.O.; Parreiras, P.M.; Menezes, C.C. Maceration time over antioxidant activity, volatile compounds and temporal dominant sensation of fermented jabuticaba. Food Sci. Technol. 2022, 42. [Google Scholar] [CrossRef]
  4. De Sá, L.Z.M.; Castro, P.F.; Lino, F.M.; Bernardes, M.J.; Viegas, J.C.; Dinis, T.C.; Santana, M.J.; Romao, W.; Vaz, B.G.; Lião, L.M.; et al. Antioxidant potential and vasodilatory activity of fermented beverages of jabuticaba berry (Myrciaria jaboticaba). J. Funct. Foods 2014, 8, 169–179. [Google Scholar] [CrossRef]
  5. Morales, P.; Barros, L.; Dias, M.I.; Santos-Buelga, C.; Ferreira, I.C.; Asquieri, E.R.; Berrios, J.D.J. Non-fermented and fermented jabuticaba (Myrciaria cauliflora Mart.) pomaces as valuable sources of functional ingredients. Food Chem. 2016, 208, 220–227. [Google Scholar] [CrossRef] [PubMed]
  6. De Souza, A.C.; Fernandes, A.C.; Silva, M.S.; Schwan, R.F.; Dias, D.R. Antioxidant activities of tropical fruit wines. J. Inst. Brew. 2018, 124, 492–497. [Google Scholar] [CrossRef]
  7. Zhang, J.; Stanley, R.A.; Adaim, A.; Melton, L.D.; Skinner, M.A. Free radical scavenging and cytoprotective activities of phenolic antioxidants. Mol. Nutr. Food Res. 2006, 50, 996–1005. [Google Scholar] [CrossRef]
  8. Vona, R.; Gambardella, L.; Cittadini, C.; Straface, E.; Pietraforte, D. Biomarkers of oxidative stress in metabolic syndrome and associated diseases. Oxid. Med. Cell. Longev. 2019, 2019, 8267234. [Google Scholar] [CrossRef]
  9. Bissinger, R.; Bhuyan, A.A.M.; Qadri, S.M.; Lang, F. Oxidative stress, eryptosis and anemia: A pivotal mechanistic nexus in systemic diseases. FEBS J. 2019, 286, 826–854. [Google Scholar] [CrossRef]
  10. Scott, M.D.; Van Den Berg, J.J.; Repka, T.; Rouyer-Fessard, P.; Hebbel, R.P.; Beuzard, Y.; Lubin, B.H. Effect of excess alpha-hemoglobin chains on cellular and membrane oxidation in model beta-thalassemic erythrocytes. J. Clin. Investig. 1993, 91, 1706–1712. [Google Scholar] [CrossRef]
  11. Tedesco, I.; Russo, M.; Russo, P.; Iacomino, G.; Russo, G.L.; Carraturo, A.; Faruolo, C.; Moio, L.; Palumbo, R. Antioxidant effect of red wine polyphenols on red blood cells. J. Nutr. Biochem. 2000, 11, 114–119. [Google Scholar] [CrossRef] [PubMed]
  12. Pazzini, C.E.; Colpo, A.C.; Poetini, M.R.; Pires, C.F.; de Camargo, V.B.; Mendez, A.S.; Azevedo, M.L.; Soares, J.C.; Folmer, V. Effects of red wine tannat on oxidative stress induced by glucose and fructose in erythrocytes in vitro. Int. J. Med. Sci. 2015, 12, 478–486. [Google Scholar] [CrossRef] [PubMed]
  13. Tedesco, I.; Spagnuolo, C.; Russo, G.L.; Russo, M.; Cervellera, C.; Moccia, S. The pro-oxidant activity of red wine polyphenols induces an adaptive antioxidant response in human erythrocytes. Antioxidants 2021, 10, 800. [Google Scholar] [CrossRef] [PubMed]
  14. Macedo, E.H.; Santos Jr, G.C.; Santana, M.N.; Jesus, E.F.; de Araújo, U.B.; Anjos, M.J.; Pinheiro, A.S.; Carneiro, C.S.; Rodrigues, I.A. Unveiling the physicochemical properties and chemical profile of artisanal jabuticaba wines by bromatological and NMR-based metabolomics approaches. LWT 2021, 146, 111371. [Google Scholar] [CrossRef]
  15. Ghiselli, A.; Nardini, M.; Baldi, A.; Scaccini, C. Antioxidant activity of different phenolic fractions separated from an italian red wine. J. Agric. Food Chem. 1998, 46, 361–367. [Google Scholar] [CrossRef] [PubMed]
  16. Rodrigues, F.R.; Ramos, A.S.; Amaral, A.C.F.; Ferreira, J.L.P.; Carneiro, C.S.; Silva, J.R.A. Evaluation of Amazon fruits: Chemical and nutritional studies on Borojoa sorbilis. J. Sci. Food Agric. 2018, 98, 3943–3952. [Google Scholar] [CrossRef]
  17. Wang, X.; Xie, K.; Zhuang, H.; Ye, R.; Fang, Z.; Feng, T. Volatile flavor compounds, total polyphenolic contents and antioxidant activities of a China gingko wine. Food Chem. 2015, 182, 41–46. [Google Scholar] [CrossRef]
  18. Gouvêa, A.C.; Melo, A.; Santiago, M.C.; Peixoto, F.M.; Freitas, V.; Godoy, R.L.; Ferreira, I.M. Identification and quantification of anthocyanins in fruits from Neomitranthes obscura (DC.) N. Silveira an endemic specie from Brazil by comparison of chromatographic methodologies. Food Chem. 2015, 185, 277–283. [Google Scholar] [CrossRef] [PubMed]
  19. Singleton, V.L.; Orthofer, R.; Lamuela-Raventós, R.M. Analysis of total phenols and other oxidation substrates and antioxidants by means of Folin-Ciocalteu reagent. Methods Enzymol. 1999, 299, 152–178. [Google Scholar] [CrossRef]
  20. Ferreira, I.C.F.R.; Aires, E.; Barreira, J.C.M.; Estevinho, L.M. Antioxidant activity of Portuguese honey samples: Different contributions of the entire honey and phenolic extract. Food Chem. 2009, 114, 1438–1443. [Google Scholar] [CrossRef]
  21. Rufino, M.S.M.; Alves, R.E.; Brito, E.S.; Pérez-Jiménez, J.; Saura-Calixto, F.; Mancini-Filho, J. Bioactive compounds and antioxidant capacities of 18 non-traditional tropical fruits from Brazil. Food Chem. 2010, 121, 996–1002. [Google Scholar] [CrossRef]
  22. Mensor, L.L.; Menezes, F.S.; Leitão, G.G.; Reis, A.S.; Santos, T.C.D.; Coube, C.S.; Leitão, S.G. Screening of Brazilian plant extracts for antioxidant activity by the use of DPPH free radical method. Phytother. Res. 2001, 15, 127–130. [Google Scholar] [CrossRef] [PubMed]
  23. López-Alarcón, C.; Fuentes-Lemus, E.; Figueroa, J.D.; Dorta, E.; Schöneich, C.; Davies, M.J. Azocompounds as generators of defined radical species: Contributions and challenges for free radical research. Free Radic. Biol. Med. 2020, 160, 78–91. [Google Scholar] [CrossRef] [PubMed]
  24. Yang, H.L.; Korivi, M.; Lin, M.K.; Chang, H.C.; Wu, C.R.; Lee, M.S.; Chen, W.T.; Hseu, Y.C. Antihemolytic and antioxidant properties of pearl powder against 2,2’-azobis(2-amidinopropane) dihydrochloride-induced hemolysis and oxidative damage to erythrocyte membrane lipids and proteins. J. Food Drug. Anal. 2017, 25, 898–907. [Google Scholar] [CrossRef]
  25. Olson, B.J.; Markwell, J. Assays for determination of protein concentration. Curr. Protoc. Pharmacol. 2007, 38, A.3A.1–A.3A.29. [Google Scholar] [CrossRef]
  26. Bolanos de la Torre, A.A.; Henderson, T.; Nigam, P.S.; Owusu-Apenten, R.K. A universally calibrated microplate ferric reducing antioxidant power (FRAP) assay for foods and applications to Manuka honey. Food Chem. 2015, 174, 119–123. [Google Scholar] [CrossRef]
  27. Guo, X.; Ho, C.T.; Wan, X.; Zhu, H.; Liu, Q.; Wen, Z. Changes of volatile compounds and odor profiles in Wuyi rock tea during processing. Food Chem. 2021, 341, 128230. [Google Scholar] [CrossRef]
  28. Jeleń, H.H.; Majcher, M.; Dziadas, M. Microextraction techniques in the analysis of food flavor compounds: A review. Anal Chim Acta. 2012, 738, 13–26. [Google Scholar] [CrossRef]
  29. Pino, J.A.; Mesa, J. Contribution of volatile compounds to mango (Mangifera indica L.) aroma. Flavour Fragr. J. 2006, 21, 207–213. [Google Scholar] [CrossRef]
  30. Malherbe, S.; Tredoux, A.G.J.; Nieuwoudt, H.H.; du Toit, M. Comparative metabolic profiling to investigate the contribution of O. oeni MLF starter cultures to red wine composition. J. Ind. Microbiol. Biotechnol. 2011, 39, 477–494. [Google Scholar] [CrossRef]
  31. FEMA. Flavors Extracts Manufacturers Association. Available online: https://www.femaflavor.org/ (accessed on 3 October 2022).
  32. Gómez-Míguez, M.J.; Cacho, J.F.; Ferreira, V.; Vicario, I.M.; Heredia, F.J. Volatile components of Zalema white wines. Food Chem. 2007, 100, 1464–1473. [Google Scholar] [CrossRef]
  33. Sanz, C.; Olias, J.M.; Perez, A.G. Aroma biochemistry of fruits and vegetables. In Proceedings-Phytochemical Society of Europe; Oxford University Press Inc: Oxford, UK, 1996; Volume 41, pp. 125–156. [Google Scholar]
  34. Echeverría, G.; Graell, J.; López, M.L.; Lara, I. Volatile production, quality and aroma-related enzyme activities during maturation of ‘Fuji’apples. Postharvest Biol. Technol. 2004, 31, 217–227. [Google Scholar] [CrossRef]
  35. Zohre, D.; Erten, H. The influence of Kloeckera apiculata and Candida pulcherrima yeasts on wine fermentation. Process. Biochem. 2002, 38, 319–324. [Google Scholar] [CrossRef]
  36. Juan, C.; Jianquan, K.; Junni, T.; Zijian, C.; Ji, L. The profile in polyphenols and volatile compounds in alcoholic beverages from different cultivars of mulberry. J. Food Sci. 2012, 77, C430–C436. [Google Scholar] [CrossRef] [PubMed]
  37. Hirst, M.B.; Richter, C.L. Review of aroma formation through metabolic pathways of Saccharomyces cerevisiae in beverage fermentations. Am. J. Enol. Vitic. 2016, 67, 4. [Google Scholar] [CrossRef]
  38. Ahmed, E.M.; Dennison, R.A.; Dougherty, R.H.; Shaw, P.E. Flavor and odor thresholds in water of selected orange juice components. J. Agric. Food Chem. 1978, 26, 187–191. [Google Scholar] [CrossRef]
  39. Varlet, V.; Knockaert, C.; Prost, C.; Serot, T. Comparison of odor-active volatile compounds of fresh and smoked salmon. J. Agri. Food Chem. 2006, 54, 3391–3401. [Google Scholar] [CrossRef] [PubMed]
  40. Pino, J.A.; Quijano, C.E. Study of the volatile compounds from plum (Prunus domestica L. cv. Horvin) and estimation of their contribution to the fruit aroma. Ciênc. Tecnol. Aliment. 2012, 32, 76–83. [Google Scholar] [CrossRef]
  41. Leffingwell, J.C.; Leffingwell, D. GRAS flavor chemicals-detection thresholds. Perfum. flavor. 1991, 16, 1–19. [Google Scholar]
  42. Pino, J.A.; Bent, L. Odour-active compounds in guava (Psidium guajava L. cv. Red Suprema). J. Sci. Food Agric. 2013, 93, 3114–3120. [Google Scholar] [CrossRef]
  43. Nobrega, I.C.; Ataíde, C.S.; Moura, O.M.; Livera, A.V.; Menezes, P.H. Volatile constituents of cooked bullfrog (Rana catesbeiana) legs. Food Chem. 2007, 102, 186–191. [Google Scholar] [CrossRef]
  44. Shi, J.; Tong, G.; Yang, Q.; Huang, M.; Ye, H.; Liu, Y.; Wu, J.; Zhang, J.; Sun, X.; Zhao, D. Characterization of key aroma compounds in tartary buckwheat (Fagopyrum tataricum Gaertn.) by means of sensory-directed flavor analysis. J. Agric. Food Chem. 2021, 69, 11361–11371. [Google Scholar] [CrossRef]
  45. Chang, E.H.; Jung, S.M.; Hur, Y.Y. Changes in the aromatic composition of grape cv. Cheongsoo wine depending on the degree of grape ripening. Food Sci. Biotechnol. 2014, 23, 1761–1771. [Google Scholar] [CrossRef]
  46. Gómez García-Carpintero, E.; Sánchez-Palomo, E.; González Viñas, M.A. Volatile composition of Bobal red wines subjected to alcoholic/malolactic fermentation with oak chips. LWT 2014, 55, 586–594. [Google Scholar] [CrossRef]
  47. Buttery, R.G.; Turnbaugh, J.G.; Ling, L.C. Contribution of volatiles to rice aroma. J. Agric. Food Chem. 1988, 36, 1006–1009. [Google Scholar] [CrossRef]
  48. Joshi, R.; Gulati, A. Fractionation and identification of minor and aroma-active constituents in Kangra orthodox black tea. Food Chem. 2015, 167, 290–298. [Google Scholar] [CrossRef]
  49. Inada, K.O.P.; Oliveira, A.A.; Revorêdo, T.B.; Martins, A.B.N.; Lacerda, E.C.Q.; Freire, A.S.; Braz, B.F.; Santelli, R.E.; Torres, A.G.; Perrone, D.; et al. Screening of the chemical composition and occurring antioxidants in jabuticaba (Myrciaria jaboticaba) and jussara (Euterpe edulis) fruits and their fractions. J. Funct. Foods 2015, 17, 422–433. [Google Scholar] [CrossRef]
  50. Da Silva, F.L.; Escribano-Bailón, M.T.; Alonso, J.J.P.; Rivas-Gonzalo, J.C.; Santos-Buelga, C. Anthocyanin pigments in strawberry. LWT 2007, 40, 374–382. [Google Scholar] [CrossRef]
  51. Quatrin, A.; Pauletto, R.; Maurer, L.H.; Minuzzi, N.; Nichelle, S.M.; Carvalho, J.F.C.; Junior, M.M.; Rodrigues, E.; Bochi, V.C.; Emanuelli, T. Characterization and quantification of tannins, flavonols, anthocyanins and matrix-bound polyphenols from jaboticaba fruit peel: A comparison between Myrciaria trunciflora and M. jaboticaba. J. Food Compos. Anal. 2019, 78, 59–74. [Google Scholar] [CrossRef]
  52. Fernandes, I.A.A.; Maciel, G.M.; Maroldi, W.V.; Bortolini, D.G.; Pedro, A.C.; Haminiuk, C.W.I. Bioactive compounds, health-promotion properties and technological applications of Jabuticaba: A literature overview. Meas. Food 2022, 8, 100057. [Google Scholar] [CrossRef]
  53. Geraldi, M.V.; Cazarin, C.B.B.; Dias-Audibert, F.L.; Pereira, G.A.P.; Carvalho, G.G.; Kabuki, D.Y.; Catharino, R.R.; Pastore, G.M.; Behrens, M.C.; Júnior Marostica, M.R. Influence of high isostatic pressure and thermal pasteurization on chemical composition, color, antioxidant properties and sensory evaluation of jabuticaba juice. LWT 2021, 139, 110548. [Google Scholar] [CrossRef]
  54. Santos, R.O.; Trindade, S.C.; Maurer, L.H.; Bersch, A.M.; Sautter, C.K.; Penna, N.G. Physicochemical, Antioxidant and Sensory Quality of Brazilian Blueberry Wine. An. Acad. Bras. Cienc. 2016, 88, 1557–1568. [Google Scholar] [CrossRef]
  55. Lenquiste, S.A.; da Silva Marineli, R.; Moraes, É.A.; Dionísio, A.P.; de Brito, E.S.; Junior, M.R. Jaboticaba peel and jaboticaba peel aqueous extract shows in vitro and in vivo antioxidant properties in obesity model. Food Res. Int. 2015, 77, 162–170. [Google Scholar] [CrossRef]
  56. Sánchez-Moreno, C.; Larrauri, J.A.; Saura-Calixto, F. Free radical scavenging capacity and inhibition of lipid oxidation of wines, grape juices and related polyphenolic constituents. Food Res. Int. 1999, 32, 407–412. [Google Scholar] [CrossRef]
  57. Hacke, A.C.M.; Valério, T.P.; Cubo, M.F.; Lima, D.; Pessôa, C.A.; Vellosa, J.C.R.; Pereira, R.P. Antioxidant capacity of Myrciaria cauliflora seed extracts by spectrophotometric, biochemical, and electrochemical methods and its protective effect against oxidative damage in erythrocytes. J. Food Biochem. 2022, 46, e14222. [Google Scholar] [CrossRef] [PubMed]
  58. Du, R.; Liu, K.; Zhao, S.; Chen, F. Changes in antioxidant activity of peptides identified from brown rice hydrolysates under different conditions and their protective effects against AAPH-induced oxidative stress in human erythrocytes. ACS Omega 2020, 5, 12751–12759. [Google Scholar] [CrossRef] [PubMed]
  59. Yin, Z.N.; Wu, W.J.; Sun, C.Z.; Liu, H.F.; Chen, W.B.; Zhan, Q.P.; Lei, Z.G.; Xin, X.; Ma, J.J.; Yao, K.; et al. Antioxidant and anti-inflammatory capacity of ferulic acid released from wheat bran by solid-state fermentation of Aspergillus niger. Biomed. Environ. Sci. 2019, 32, 11–21. [Google Scholar] [CrossRef]
  60. Zhang, H.; Chen, T.; Jiang, J.; Wong, Y.S.; Yang, F.; Zheng, W. Selenium-containing allophycocyanin purified from selenium-enriched Spirulina platensis attenuates AAPH-induced oxidative stress in human erythrocytes through inhibition of ROS generation. J. Agric. Food Chem. 2011, 59, 8683–8690. [Google Scholar] [CrossRef]
  61. Takebayashi, J.; Kaji, H.; Ichiyama, K.; Makino, K.; Gohda, E.; Yamamoto, I.; Tai, A. Inhibition of free radical-induced erythrocyte hemolysis by 2-O-substituted ascorbic acid derivatives. Free Radic. Biol. Med. 2007, 43, 1156–1164. [Google Scholar] [CrossRef]
  62. Leonard, W.; Zhang, P.; Ying, D.; Adhikari, B.; Fang, Z. Fermentation transforms the phenolic profiles and bioactivities of plant-based foods. Biotechnol. Adv. 2021, 49, 107763. [Google Scholar] [CrossRef] [PubMed]
  63. Keshavarzi, A.; Seifikar, S.; Ranjbar, A.; Khiripour, N.; Ghaleiha, A.; Soltaniyan, A.; Rafieemehr, H. Effect of fresh red grape juice and grape fermentative product on oxidative-stress in human erythrocytes in vitro. Arch. Biotechnol. Biomed. 2022, 6, 001–006. [Google Scholar] [CrossRef]
  64. Ferreira, P.R.; Pinheiro, F.D.A.; Duarte, M.D.S.; da Silva, W.; dos Reis, N.R.; Marques, D.B.D.; Bastos, D.S.S.; Fontes, E.A.F. Effect of jaboticaba and pequi extracts on gene expression of antioxidant enzymes in C2C12 mouse muscle cells. Res. Soc. Dev. 2021, 10, e375101018864. [Google Scholar] [CrossRef]
  65. Alezandro, M.R.; Dubé, P.; Desjardins, Y.; Lajolo, F.M.; Genovese, M.I. Comparative study of chemical and phenolic compositions of two species of jaboticaba: Myrciaria jaboticaba (Vell.) Berg and Myrciaria cauliflora (Mart.) O. Berg. Food Res. Int. 2013, 54, 468–477. [Google Scholar] [CrossRef]
  66. De Andrade Neves, N.; Stringheta, P.C.; da Silva, I.F.; García-Romero, E.; Gómez-Alonso, S.; Hermosín-Gutiérrez, I. Identification and quantification of phenolic composition from different species of Jabuticaba (Plinia spp.) by HPLC-DAD-ESI/MSn. Food Chem. 2021, 355, 129605. [Google Scholar] [CrossRef]
  67. Anesini, C.; Turner, S.; Cogoi, L.; Filip, R. Study of the participation of caffeine and polyphenols on the overall antioxidant activity of mate (Ilex paraguariensis). LWT 2012, 45, 299–304. [Google Scholar] [CrossRef]
Figure 1. Chromatogram profile showing major anthocyanins in jabuticaba wine. (1) delphinidin-3-O-glucoside; (2) cyanidin-3-O-glucoside; and (3) unknown anthocyanin.
Fermentation 09 00157 g001
Figure 2. Effect of JWE and fractions (JWF1-3) on hematoprotection of RBCs against oxidative stress. RBCs were treated with several concentrations (µg·mL−1) of the extracts and challenged with 7 mM AAPH (OC50) for 4 h. Hematoprotective (antioxidant) effect of (a) JWE; (b) JWF1; (c) JWF2; and (d) JWF3. Ascorbic acid (AA) at 6 µM was used as a reference antioxidant agent. Each point represents the mean of two independent experiments ± standard error.
Fermentation 09 00157 g002
Figure 3. Effect of JWE and fractions (JWF2 and JWF3) on the total cellular antioxidant power of RBC. RBC were treated with maximal protective concentrations of JWF2 (7.8 µg·mL−1) and JWF3 (31 µg·mL−1) and challenged with 7 mM AAPH (OC50) for 4 h. Each point represents the mean of two independent experiments ± standard error. The asterisk (*) indicates a significant difference between JWF2 and CNT (+) (ANOVA and Dunn’s test, p < 0.05). CNT (-), negative control (untreated RBC); CNT (+), positive control (RBC treated with 7 mM AAPH).
Fermentation 09 00157 g003
Table 2. Antioxidant capacity of jabuticaba wine extract (JWE) and fractions (JWF1–JWF3).
SampleABTS
(EC50 µg·mL−1)
DPPH
(EC50 µg·mL−1)
JWE3.89 (±0.22) a30.17 (±8.89) a
JWF13.30 (±0.11) a,b18.85 (±4.96) b
JWF22.15 (±0.65) b5.18 (±3.58) c
JWF31.22 (±0.10) b6.20 (±2.06) c
Standard Trolox1.05 (±0.26) b3.05 (±0.19) c
Mean (±SD) for triplicates. Means followed by different letters, in the same column, differ from each other by the Tukey posthoc test (ANOVA) (p < 0.05).
Table 3. Chemical profile of jabuticaba wine extracts determined by LC-HRMS/MS analysis. Relative areas were calculated among samples. The peak area in each sample was divided by the sum of peak areas among the samples to show compound variations.
CompoundsRT (min)Ionization ModeExperimental MassAbsolute Area (Relative %)
JWEJWF1JWF2JWF3JWR
Citric acid13.53[M-H]191.0207.8 × 107 (23.8)1.7 × 10⁸ (51.8)3.9 × 10⁵ (0.1)5.8 × 10⁷ (17.7)2.2 × 10⁷ (6.7)
Cyanidin12.60[M+H]+287.05261.7 × 109 (98.6)9.1 × 10⁶ (0.5)-1.4 × 10⁷ (0.8)8.2 × 10⁵ (0.1)
Cyanidin-3-O-glucoside13.86[M+H]+449.10525.8 × 105 (0.5)---1.1 × 10⁸ (99.5)
Delphinidin12.29[M+H]+303.04993.4 × 106 (0.4)8.4 × 10⁸ (96.5)-2.7 × 10⁷ (3.1)-
Ellagic acid11.84[M-H]300.99891.1 × 108 (59.7)-1.3 × 10⁶ (0.7)7.0 × 10⁶ (3.8)6.6 ×10⁷ (35.8)
Ellagic acid hexose11.70[M-H]481.06206.6 × 108 (99.6)---2.6 × 10⁶ (0.4)
Gallic acid12.66[M-H]169.01433.3 × 108 (12.9)3.7 × 10⁷ (14.5)1.5 × 10⁷ (0.6)3.7 × 10⁸ (1.4)1.8 × 10⁹ (70.5)
Glucose/
Fructose
12.19[M-H]179.05636.1 × 107 (89.2)-3.4 × 10⁶ (5.0)-4.0 × 10⁶ (5.8)
Guaijaverin11.69[M-H]433.07972.1 × 108 (90.8)-2.3 × 10⁶ (1.0)9.0 × 10⁵ (0.4)1.8 × 10⁷ (7.8)
Isomyricitrin11.44[M-H]479.08568.7 × 107 (92.6)-8.3 × 10⁵ (0.9)-6.1 × 10⁶ (6.5)
isso-oenothein C11.26[M-H]783.07021.7 × 108 (99.9)---1.3 × 10⁵ (0.1)
Isoquercitrin11.86[M-H]463.08848.5 × 107 (99.3)-4.6 × 10⁵ (0.5)-1.7 × 10⁵ (0.1)
Lactose/sucrose10[M-H]341.10908.1 × 107 (95.3)-2.6 × 10⁶ (3.1)-1.4 × 10⁶ (1.6)
Malic acid11.80[M-H]133.01432.8 × 108 (53.1)-4.5 × 10⁶ (0.8)3.1 × 10⁶ (0.6)2.4 × 10⁸ (45.5)
Monogalloyl glucose11.93[M-H]331.06604.3 × 108 (84.2)-1.3 × 10⁵ (0.1)2.6 × 10⁵ (0.1)8.0 × 10⁷ (15.7)
Myricetin11.55[M+H]+319.04231.3 ×109 (75.6)4.2 × 10⁸ (24.4)---
Quinic acid12.83[M-H]191.05629.0 × 108 (72.1)1.7 × 10⁸ (13.6)6.7 × 10⁶ (0.5)2.0 × 10⁶ (0.2)1.7 × 10⁸ (13.6)
Disclaimer/Publisher’s Note: The statements, opinions and data contained in all publications are solely those of the individual author(s) and contributor(s) and not of MDPI and/or the editor(s). MDPI and/or the editor(s) disclaim responsibility for any injury to people or property resulting from any ideas, methods, instructions or products referred to in the content.

