Article

Cellulosic Fiber Waste Feedstock for Bioethanol Production via Bioreactor-Dependent Fermentation

1
Environment and Natural Materials Research Institute (ENMRI), City of Scientific Research and Technological Applications (SRTA-City), New Borg El-Arab City 21934, Alexandria, Egypt
2
Chemistry Department, Faculty of Science, Alexandria University, Ibrahimia, Alexandria 21321, Alexandria, Egypt
3
Bioprocess Development Department, Genetic Engineering and Biotechnology Research Institute (GEBRI), City of Scientific Research and Technological Applications (SRTA-City), New Borg El-Arab City 21934, Alexandria, Egypt
4
Polymeric Materials Research Department, Advanced Technology and New Materials Research Institute (ATNMRI), City of Scientific Research and Technological Applications (SRTA-City), New Borg El-Arab City 21934, Alexandria, Egypt
5
Environmental Biotechnology Department, Genetic Engineering and Biotechnology Research Institute (GEBRI), City of Scientific Research and Technological Applications (SRTA-City), New Borg El-Arab City 21934, Alexandria, Egypt
*
Author to whom correspondence should be addressed.
Fermentation 2023, 9(2), 176; https://doi.org/10.3390/fermentation9020176
Submission received: 30 December 2022 / Revised: 3 February 2023 / Accepted: 3 February 2023 / Published: 15 February 2023

Abstract

:
The bioconversion of environmental wastes into energy is gaining much interest in most developing and developed countries. The current study is concerned with the proper exploitation of some industrial wastes. Cellulosic fiber waste was selected as a raw material for producing bioethanol as an alternative energy source. A combination of physical, chemical, and enzymatic hydrolysis treatments was applied to maximize the concentration of glucose that could be fermented with yeast into bioethanol. The results showed that the maximum production of 13.9 mg/mL of glucose was achieved when 5% cellulosic fiber waste was treated with 40% HCl, autoclaved, and followed with enzymatic hydrolysis. Using SEM and FTIR analysis, the instrumental characterization of the waste fiber treatment confirmed the effectiveness of the degradation by turning the long threads of the fibers into small pieces, in addition to the appearance of new functional groups and peak shifting. A potent yeast strain isolated from rotten grapes was identified as Starmerella bacillaris STDF-G4 (accession number OP872748), which was used to ferment the obtained glucose units into bioethanol under optimized conditions. The maximum production of 3.16 mg/mL of bioethanol was recorded when 7% of the yeast strain was anaerobically incubated at 30 °C in a broth culture with the pH adjusted to 5. The optimized conditions were scaled up from flasks to a fermentation bioreactor to maximize the bioethanol concentration. The obtained data showed the ability of the yeast strain to produce 4.13 mg/mL of bioethanol after the first 6 h of incubation and double the amount after 36 h of incubation to reach 8.6 mg/mL, indicating the efficiency of the bioreactor in reducing the time and significantly increasing the product.

1. Introduction

The growing human population entails the excessive use of fossil fuels, which significantly complicates the global warming issue [1]. The growing increase in greenhouse gas emissions from fossil fuels threatens nearly one million species at risk for extinction [2,3]. Fossil fuels are also seen as an unsustainable source of energy generation due to their limited supply and active role in environmental damage [4,5]. The worldwide expanding population drives increased mass production, which necessitates the continuous search for cost-effective and efficient alternative energy sources of a sustainable nature [6,7]. In this regard, bioethanol production through microbial fermentation provides significant benefits as a green and eco-friendly technology [8,9,10]. In addition to its biofuel application, bioethanol can be applied as a precursor in synthesizing diverse industry-important compounds, including diethyl ether, ethyl acetate, acetaldehyde, etc. [11].
On the other hand, lignocellulosic wastes account for 60 billion tons/year, which emphasizes the great environmental challenges to agriculture and industrial wastes [6]. This high availability of cellulosic wastes taps the way for second-generation bioethanol production, where hydrolyzed cellulosic wastes are the main source of fermentable sugars in the bioethanol production process [6,12,13]. This direction represents a dual solution for the lignocellulosic environmental impacts and cost reduction in bioethanol production. Furthermore, a circular economy method can fulfill the general desire for the introduction and development of eco-friendly and affordable technology [14]. When applied in biorefinery, these procedures may include the manufacture of bioethanol from first- through third-generation biofuels. Sustainable development strategies are used in international accords and coalitions to help replace fossil fuels [10,15]. Due to the current competitive economic market and environmental situation, recycling has recently become the most crucial method for energy conservation, especially when using combined parameters or techniques [16].
Waste materials are changed into chemical fuels and are easily turned into sustainable energy using conversion technology. Thermochemical, biochemical, and biological processes are the three basic categories under which biomass energy conversion technology is categorized [17]. The textile industry produces enormous amounts of waste, both solid and liquid, which have the potential to be converted into bioenergy. Bioenergy production from textile waste is a relatively untapped area of research, even though many different types of feedstock have become realistically exploited in recent years [2]. There has been a lot of interest in the biorefinery strategy for large-scale biomass utilization that involves the co-production of value-added goods and bioethanol [18]. Traditionally, large-scale biofuel manufacturing facilities, or biorefineries, have relied on a centralized supply network. The difficulty increases, though, when the technique must be consistent with the fluctuation in biomass quantity [19]. Therefore, the current research is directed toward implementing cellulosic fiber waste for bioethanol production through a locally isolated yeast. The different approaches for waste hydrolysis and characterization were evaluated. Different fermentation conditions were tested and optimized, on a lab-scale level, then upscaled to a stirred-tank fermentation bioreactor for the efficient production of bioethanol.

2. Materials and Methods

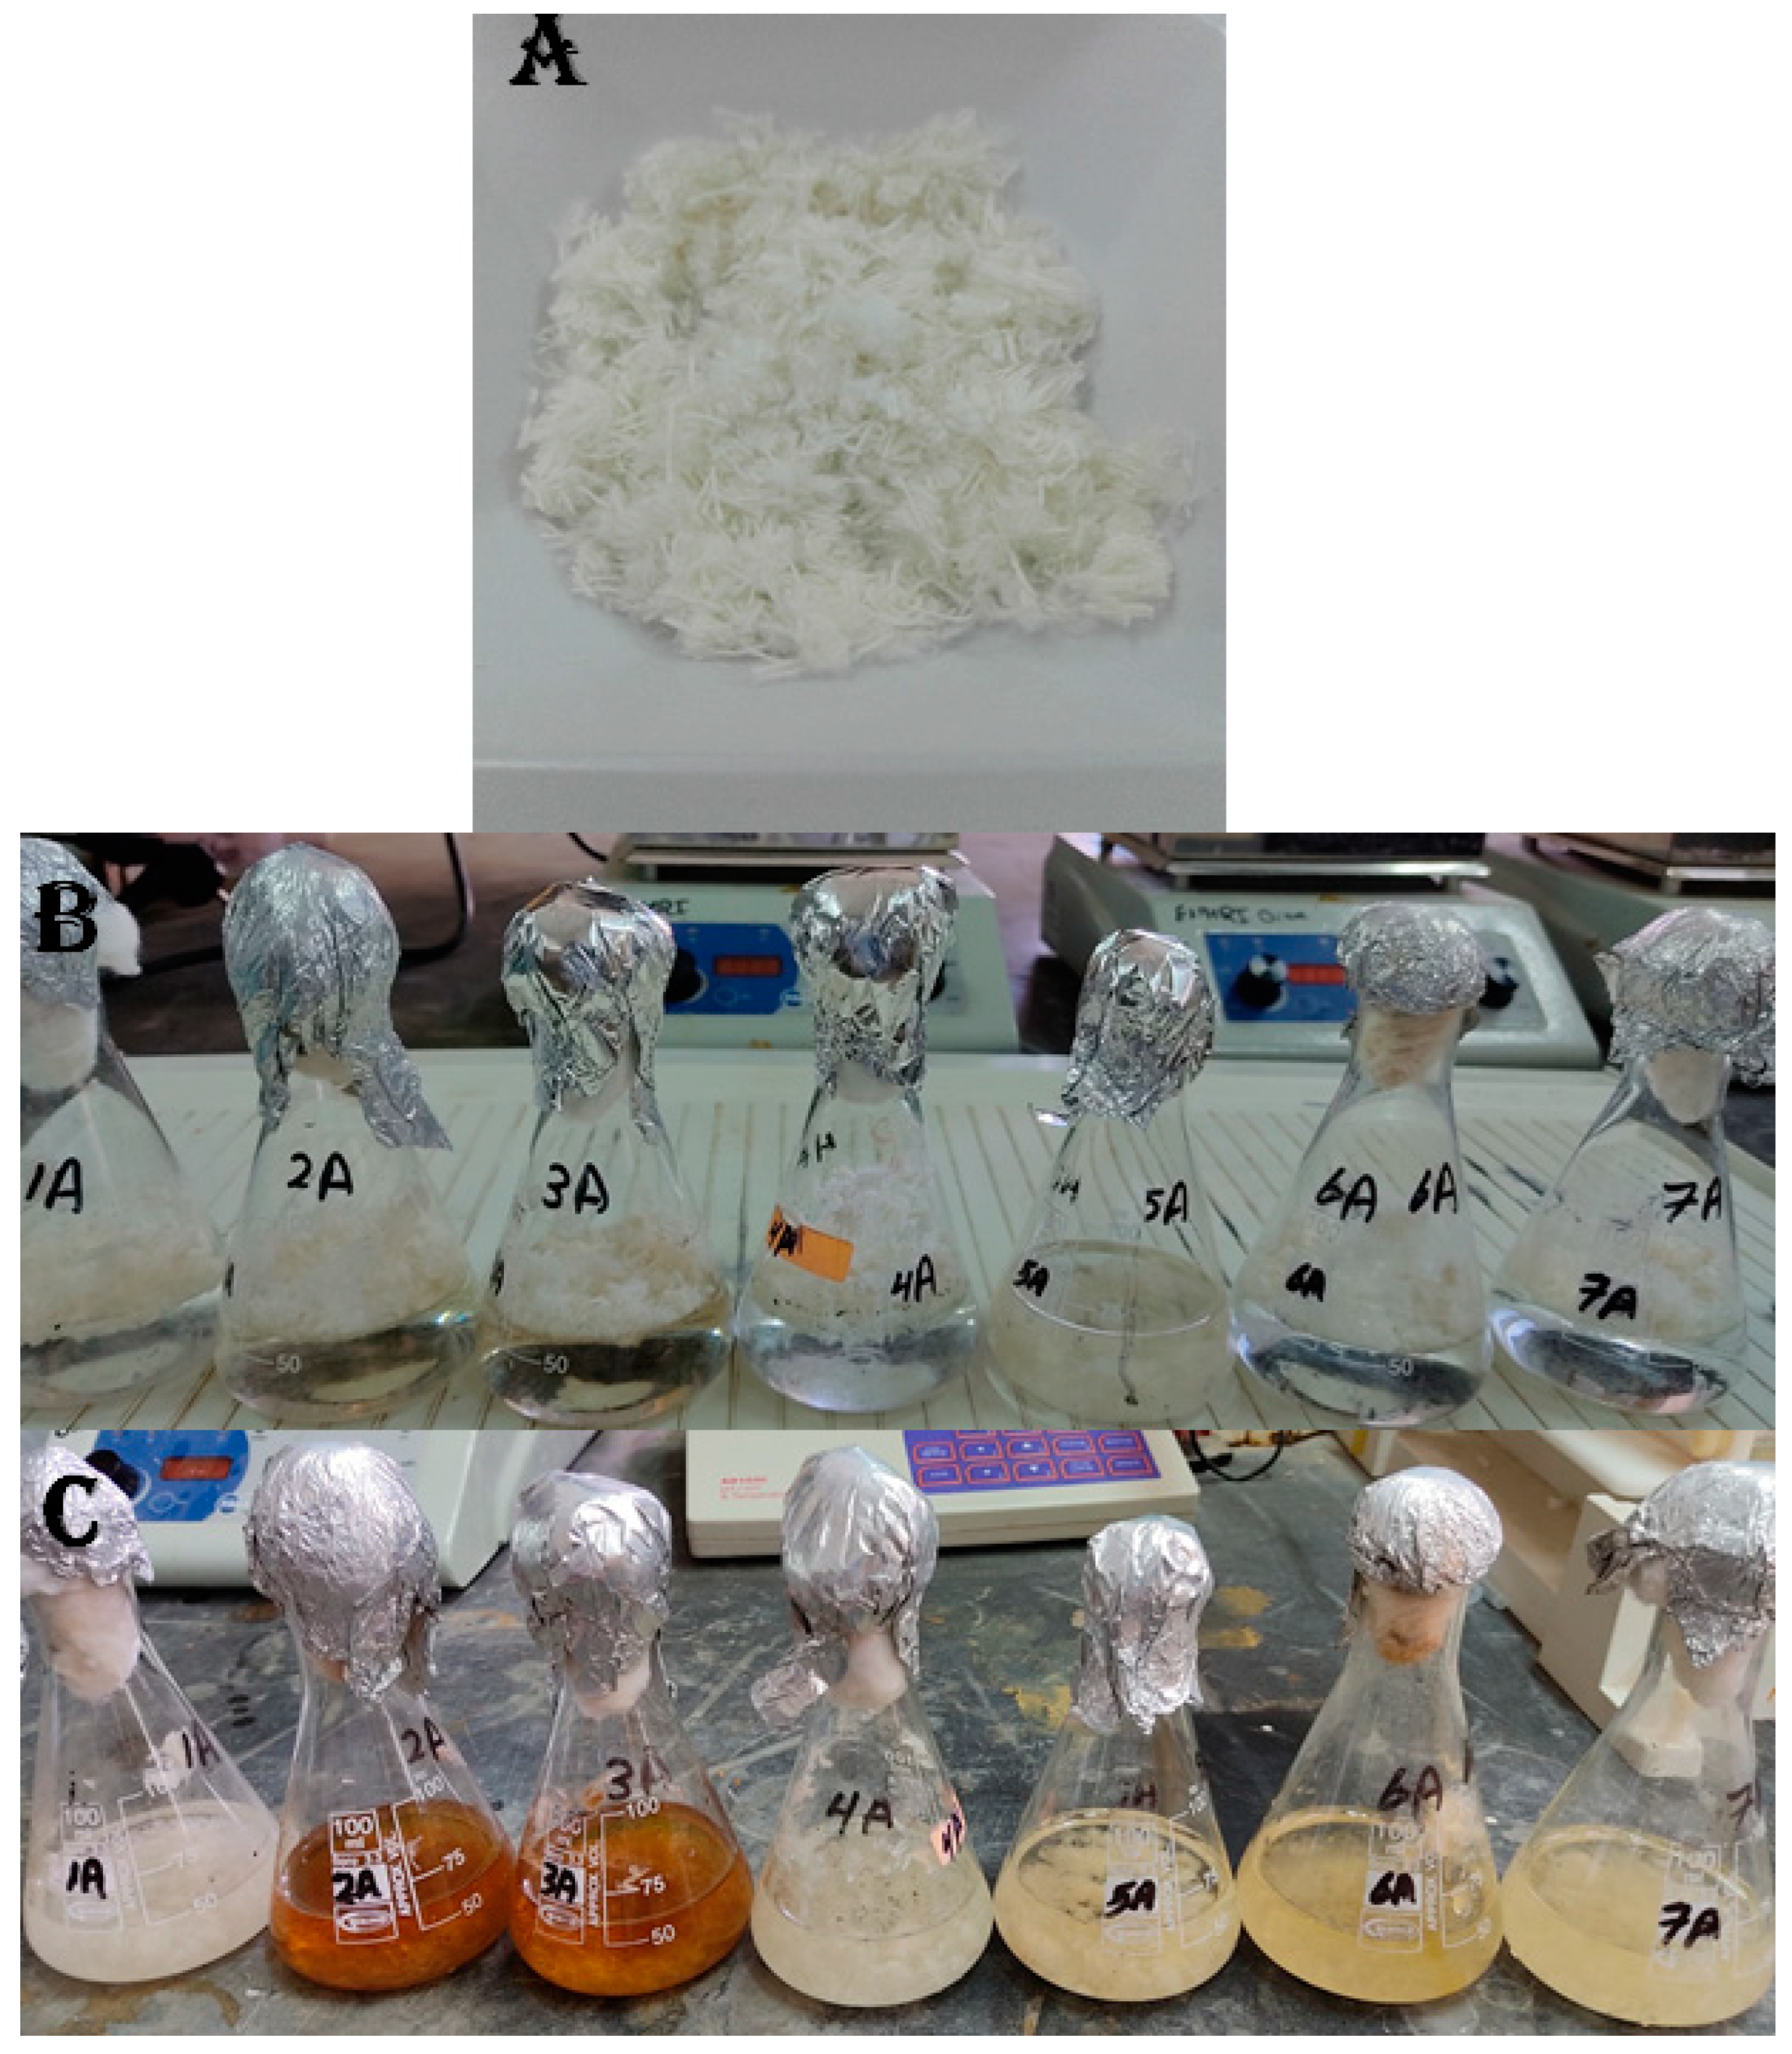
2.1. Sample Collection and Preparation

Various cellulosic wastes were collected from different local textile companies in Egypt. The cellulosic wastes mainly included residues from the textile fabrication process, collected from textile fabrication factories in Borg Elarab, Amria, and the 6th of October cities through the summer of 2020.
All of the collected samples were washed with distilled water (dH2O), dried at 50 °C for 48 h. The dried cellulose samples were cut into small pieces to facilitate the hydrolysis processes.

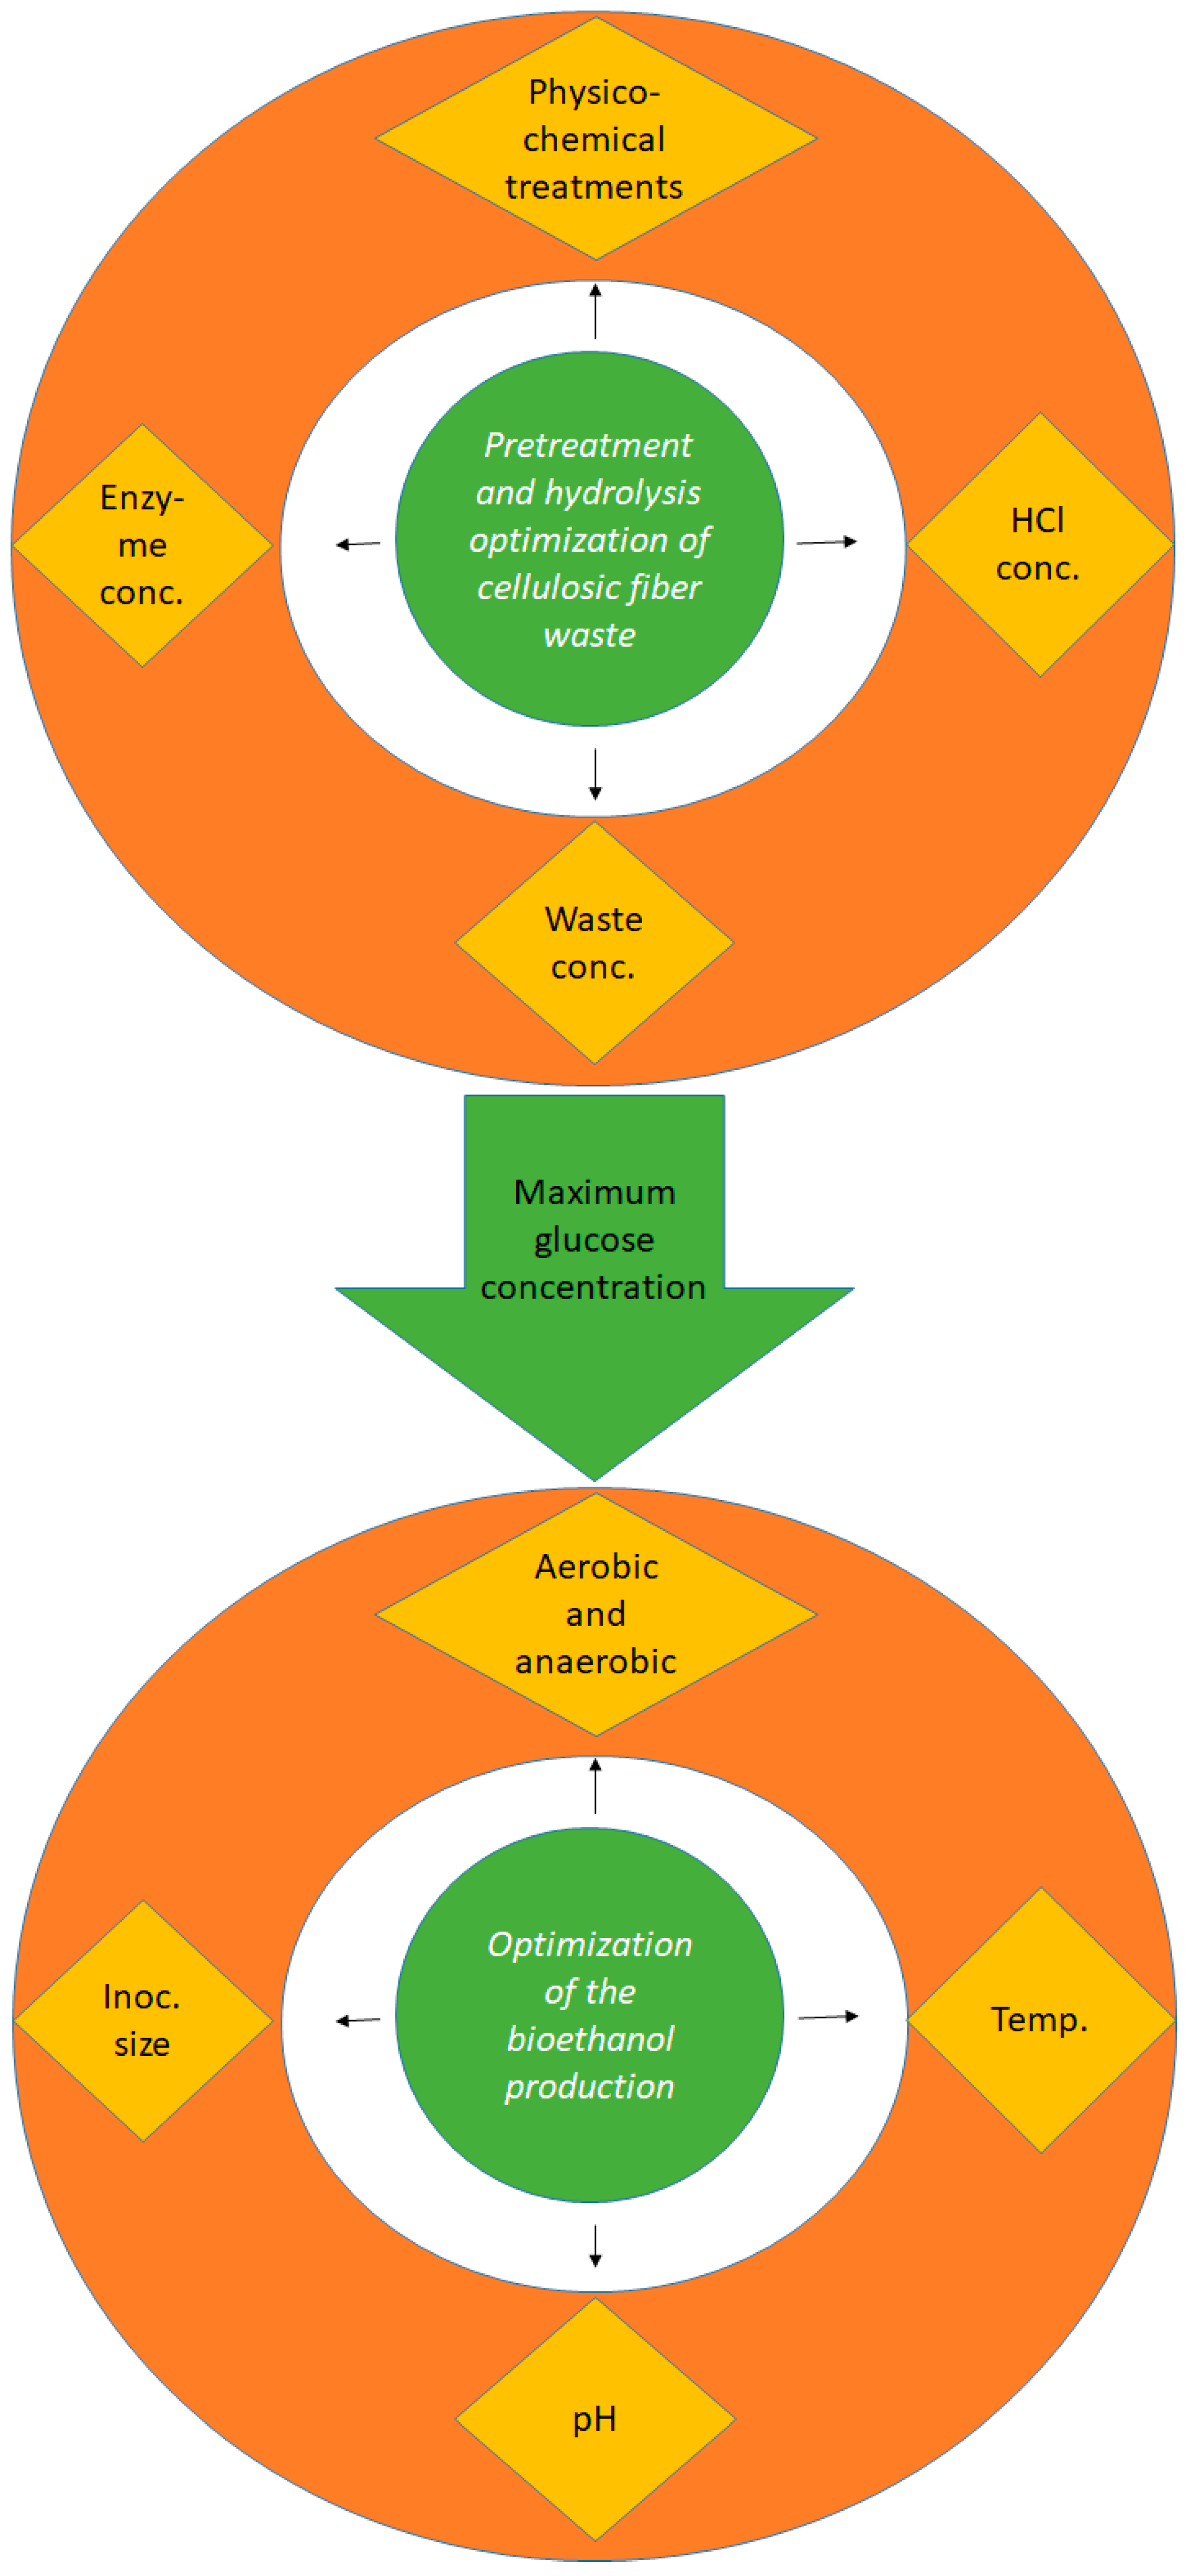
2.2. Optimization of the Conditions Used for the Waste Hydrolysis

2.2.1. Screening of the Optimum Chemical and Physical (Physico-Chemical) Treatments

Several pretreatment strategies were evaluated for increasing the cellulosic waste accessibility to hydrolysis according to [20]. The cellulosic wastes (1% w/v) were treated separately with 50 mL of different acidic and alkaline solutions, including 20% (v/v) HCl, 20% (v/v) H2SO4, 20% (v/v) H3PO4, 100% acetic acid, 5 M NaOH, or 5 M KOH. Each cellulosic-waste mixture was treated in four different physical regimens, including autoclaving for 20 min (121 °C and 15 psi), microwaving for 5 min, sonication for 20 min at 75 °C, or heating for 20 min at 100 °C. Figure 1 shows the flasks before and after the above-mentioned treatment conditions for cellulosic waste.

2.2.2. Optimization of HCl Concentration

Based upon the results of using different hydrolysis techniques, the effect of of HCl (5–40% v/v) in different concentrations were evaluated on cellulosic wastes according to [21]. 1% of cellulosic waste was added to each concentration of HCl and autoclaved for 20 min at 121 °C and 15 psi. The liberated glucose was evaluated at 540 nm using a glucose kit (Biosystem, Spain).

2.2.3. Optimization of Cellulosic Waste Concentration

The concentration of cellulosic waste supporting maximum glucose production was evaluated at different substrate percentages according to [22].
After determining the optimum acid concentration required for the maximization of glucose production, different percentages of the cellulosic fiber wastes were prepared and treated with the selected optimum acid concentration. For this purpose, the concentrations of 0.2, 1, 2, 3, 4, 5, 6, and 7% (w/v) of the cellulosic fiber waste were treated with 40% (v/v) HCl, followed by autoclaving at 121 °C and 15 psi for 20 min. The glucose concentration of each concentration was determined using a spectrophotometric technique as shown in Section 2.5.

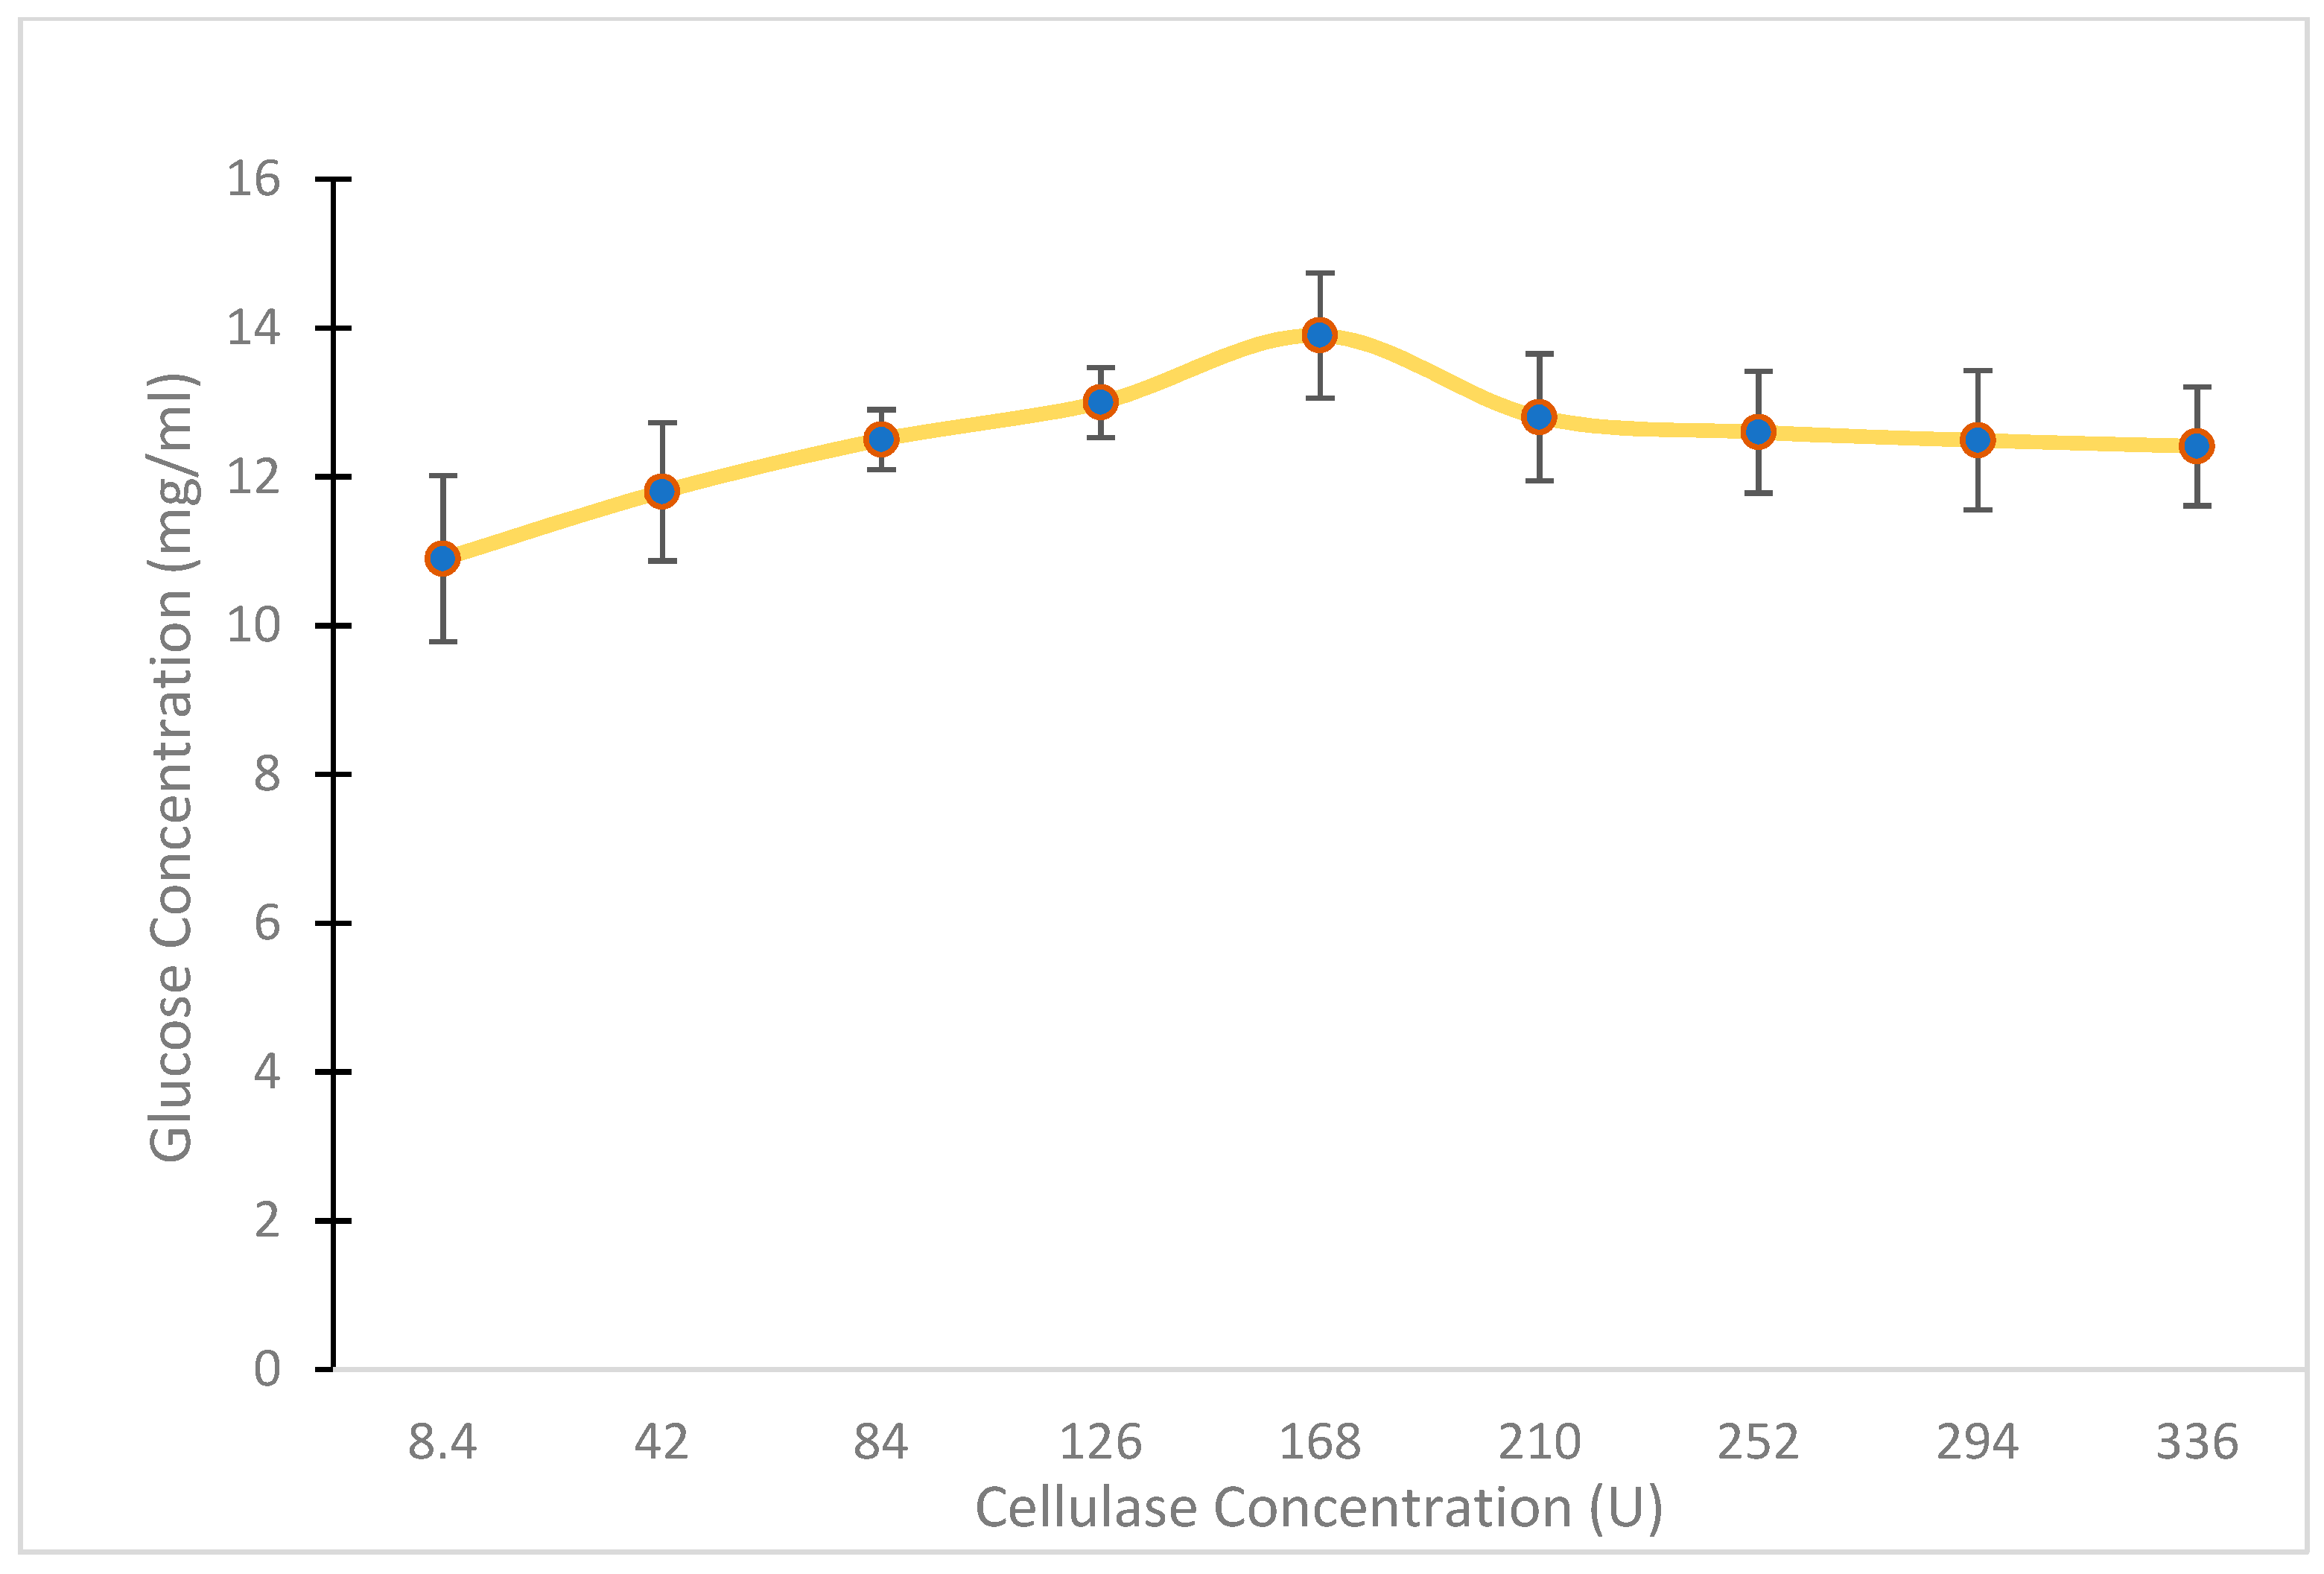
2.2.4. Mixed Physico-Chemical and Enzymatic Hydrolysis

Different cellulase concentrations were applied to investigate the ability of enzymatic hydrolysis to boost the physico-chemical treatment results [23]. In brief, after physico-chemical treatment, the pH of the mixture was adjusted to pH 5.5 using NaOH. Different concentrations of cellulases (produced by Trichoderma reesei ATCC 26,921 with ≥700 units/gram concentration, Sigma-Aldrich, USA) with concentrations from 8.4 to 336 U were added separately and incubated at 50 °C under shaking (150 rpm) for 72 h. The initial glucose concentration was determined before enzymatic hydrolysis, while the final glucose concentration was determined at the end of the enzymatic hydrolysis process.

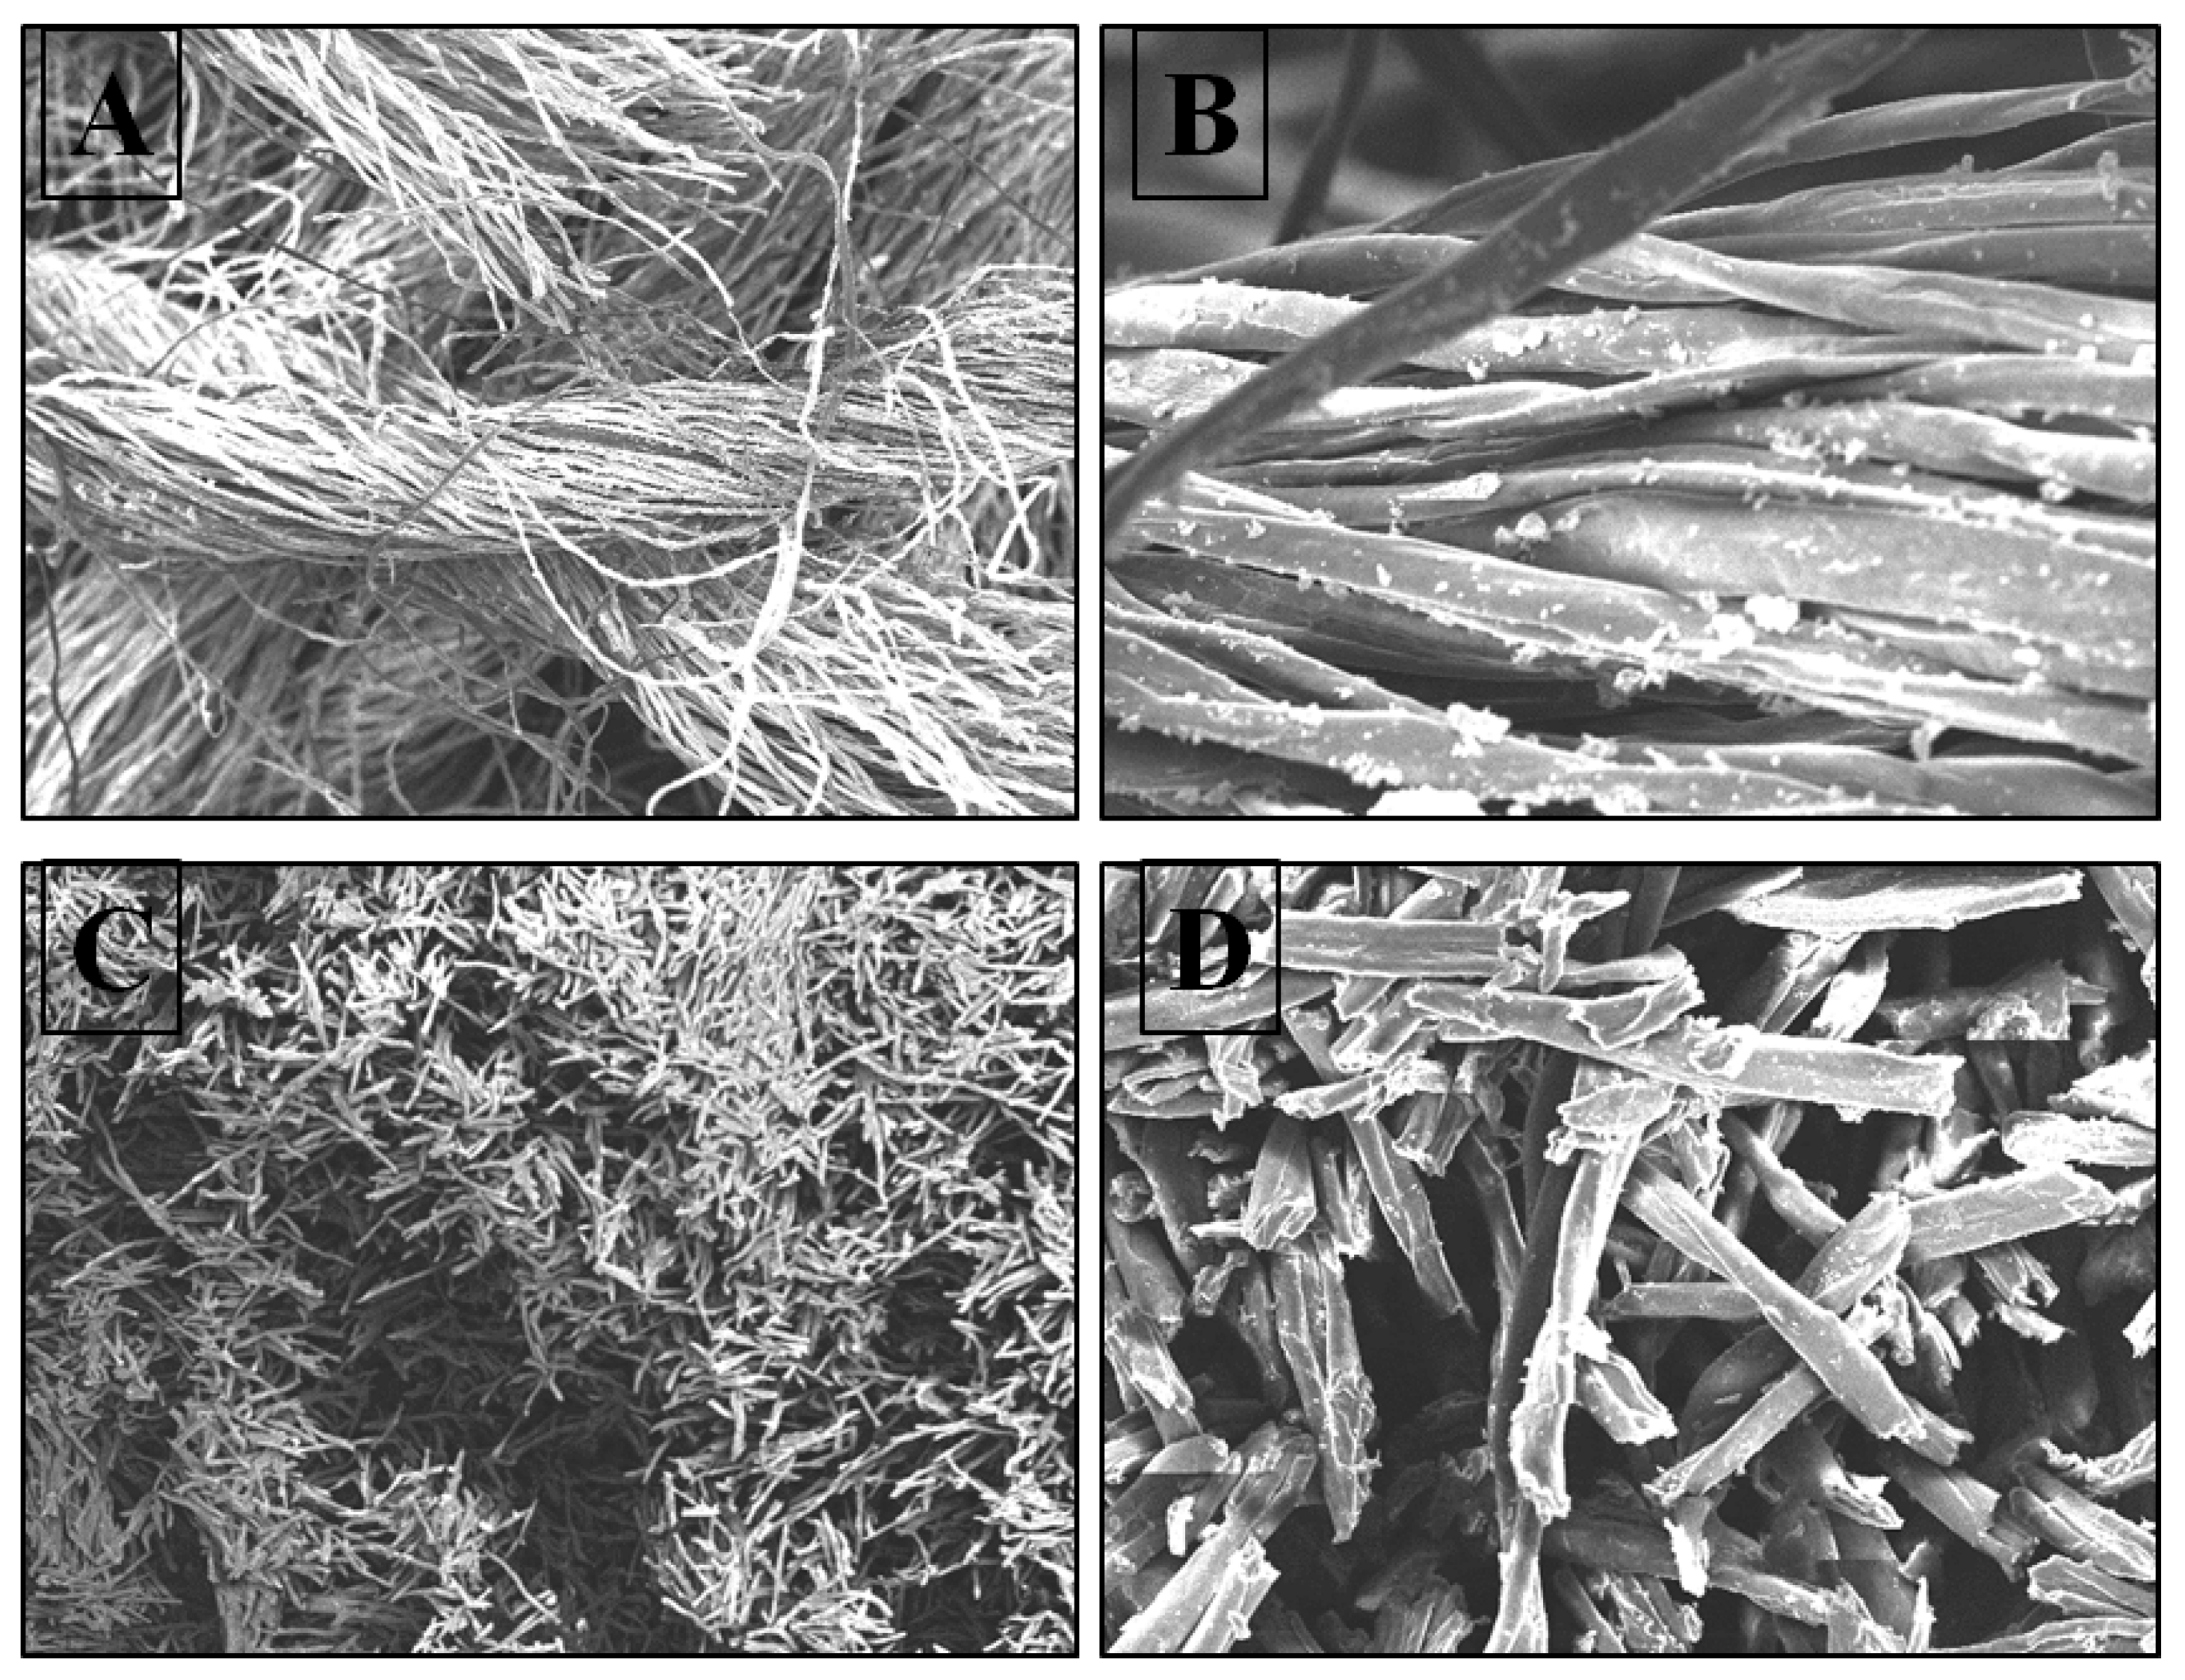
2.3. Characterization of the Cellulosic Fiber Waste

The morphological and chemical structure of the cellulosic fiber waste before and after the hydrolysis process was investigated using SEM (JEOL JSM-6360LA, Japan) and FTIR (Shimadzu FTIR-8400 S, Japan) analysis, respectively.

2.4. Yeast Isolation and Screening for Ethanol Production

Three different rotten fruits were used as sources for isolating yeast strains according to [24] with some modifications. Briefly, 0.1 g of rotten apple, banana, or grape were separately suspended in 10 mL sterile saline solution 0.9% (w/v) under aseptic conditions, where 50 µL of each serially diluted sample was inoculated to YPG plates and incubated at 30 °C for 48 h. After incubation, the growing individual colonies were aseptically transferred to fresh YPG agar plates to insure purity.
A single colony of each purified yeast isolate was inoculated into 5 mL YPG broth (pH 5.5) in sterile falcon tubes. The tubes were anaerobically incubated at 30 °C for 72 h under static conditions. To ensure anaerobic cultivation, the inoculated tubes were insulated with Parafilm. Using spectrophotometric procedures, glucose consumption and bioethanol production were evaluated after 72 h [25].

2.5. Determination of Glucose and Bioethanol Concentration

The glucose concentration of all treatments mentioned above was determined using the glucose determination kit (Biosystem, Spain) according to the instruction manual. The potassium dichromate method was applied as a fast and reliable laboratory investigation method to investigate the concentration of the produced bioethanol after each fermentation experiment. At the beginning, each sample was centrifuged at 10,000 rpm for 10 min. After centrifugation, 1 mL of each fermentation sample in addition to the control samples was diluted with 4 mL of distilled water, followed by the addition of 1 mL of 5% (w/v) K2Cr2O7. All of the tubes were incubated in an ice bath for 3 min before the addition of 1 mL of concentrated H2SO4 via dropper. After 10 min of frequent manual shaking and incubation at room temperature, the spectrophotometric absorbance of each sample was measured at 660 nm against potassium dichromate/water blank. The ethanol concentration of each sample was determined according to a previously prepared ethanol standard curve [23].

2.6. Optimization of the Bioethanol Production Conditions

The various cultivation conditions affecting the isolated yeast using the sugars liberated from the hydrolyzed fiber waste were evaluated toward maximum bioethanol production. The initial glucose concentration of all experiments was adjusted to 6.42 mg/mL unless other concentrations were mentioned.

2.6.1. Effect of Aerobic and Anaerobic Cultivation on Bioethanol Production

To evaluate the effect of oxygen on bioethanol production, a volume of 250 µL of overnight culture of G4 isolate was inoculated into multiple tubes containing 5 mL of the hydrolyzed cellulosic fiber waste at pH 5.5. Half of the tubes were covered by parafilm to provide anaerobic conditions, while the other tubes were left open without cover. The control tubes included the same internal components without adding the microbe. All of the tubes were incubated at 30 °C for 72 h. After incubation, the glucose and ethanol concentrations were determined, and the results were compared with the control measurements.

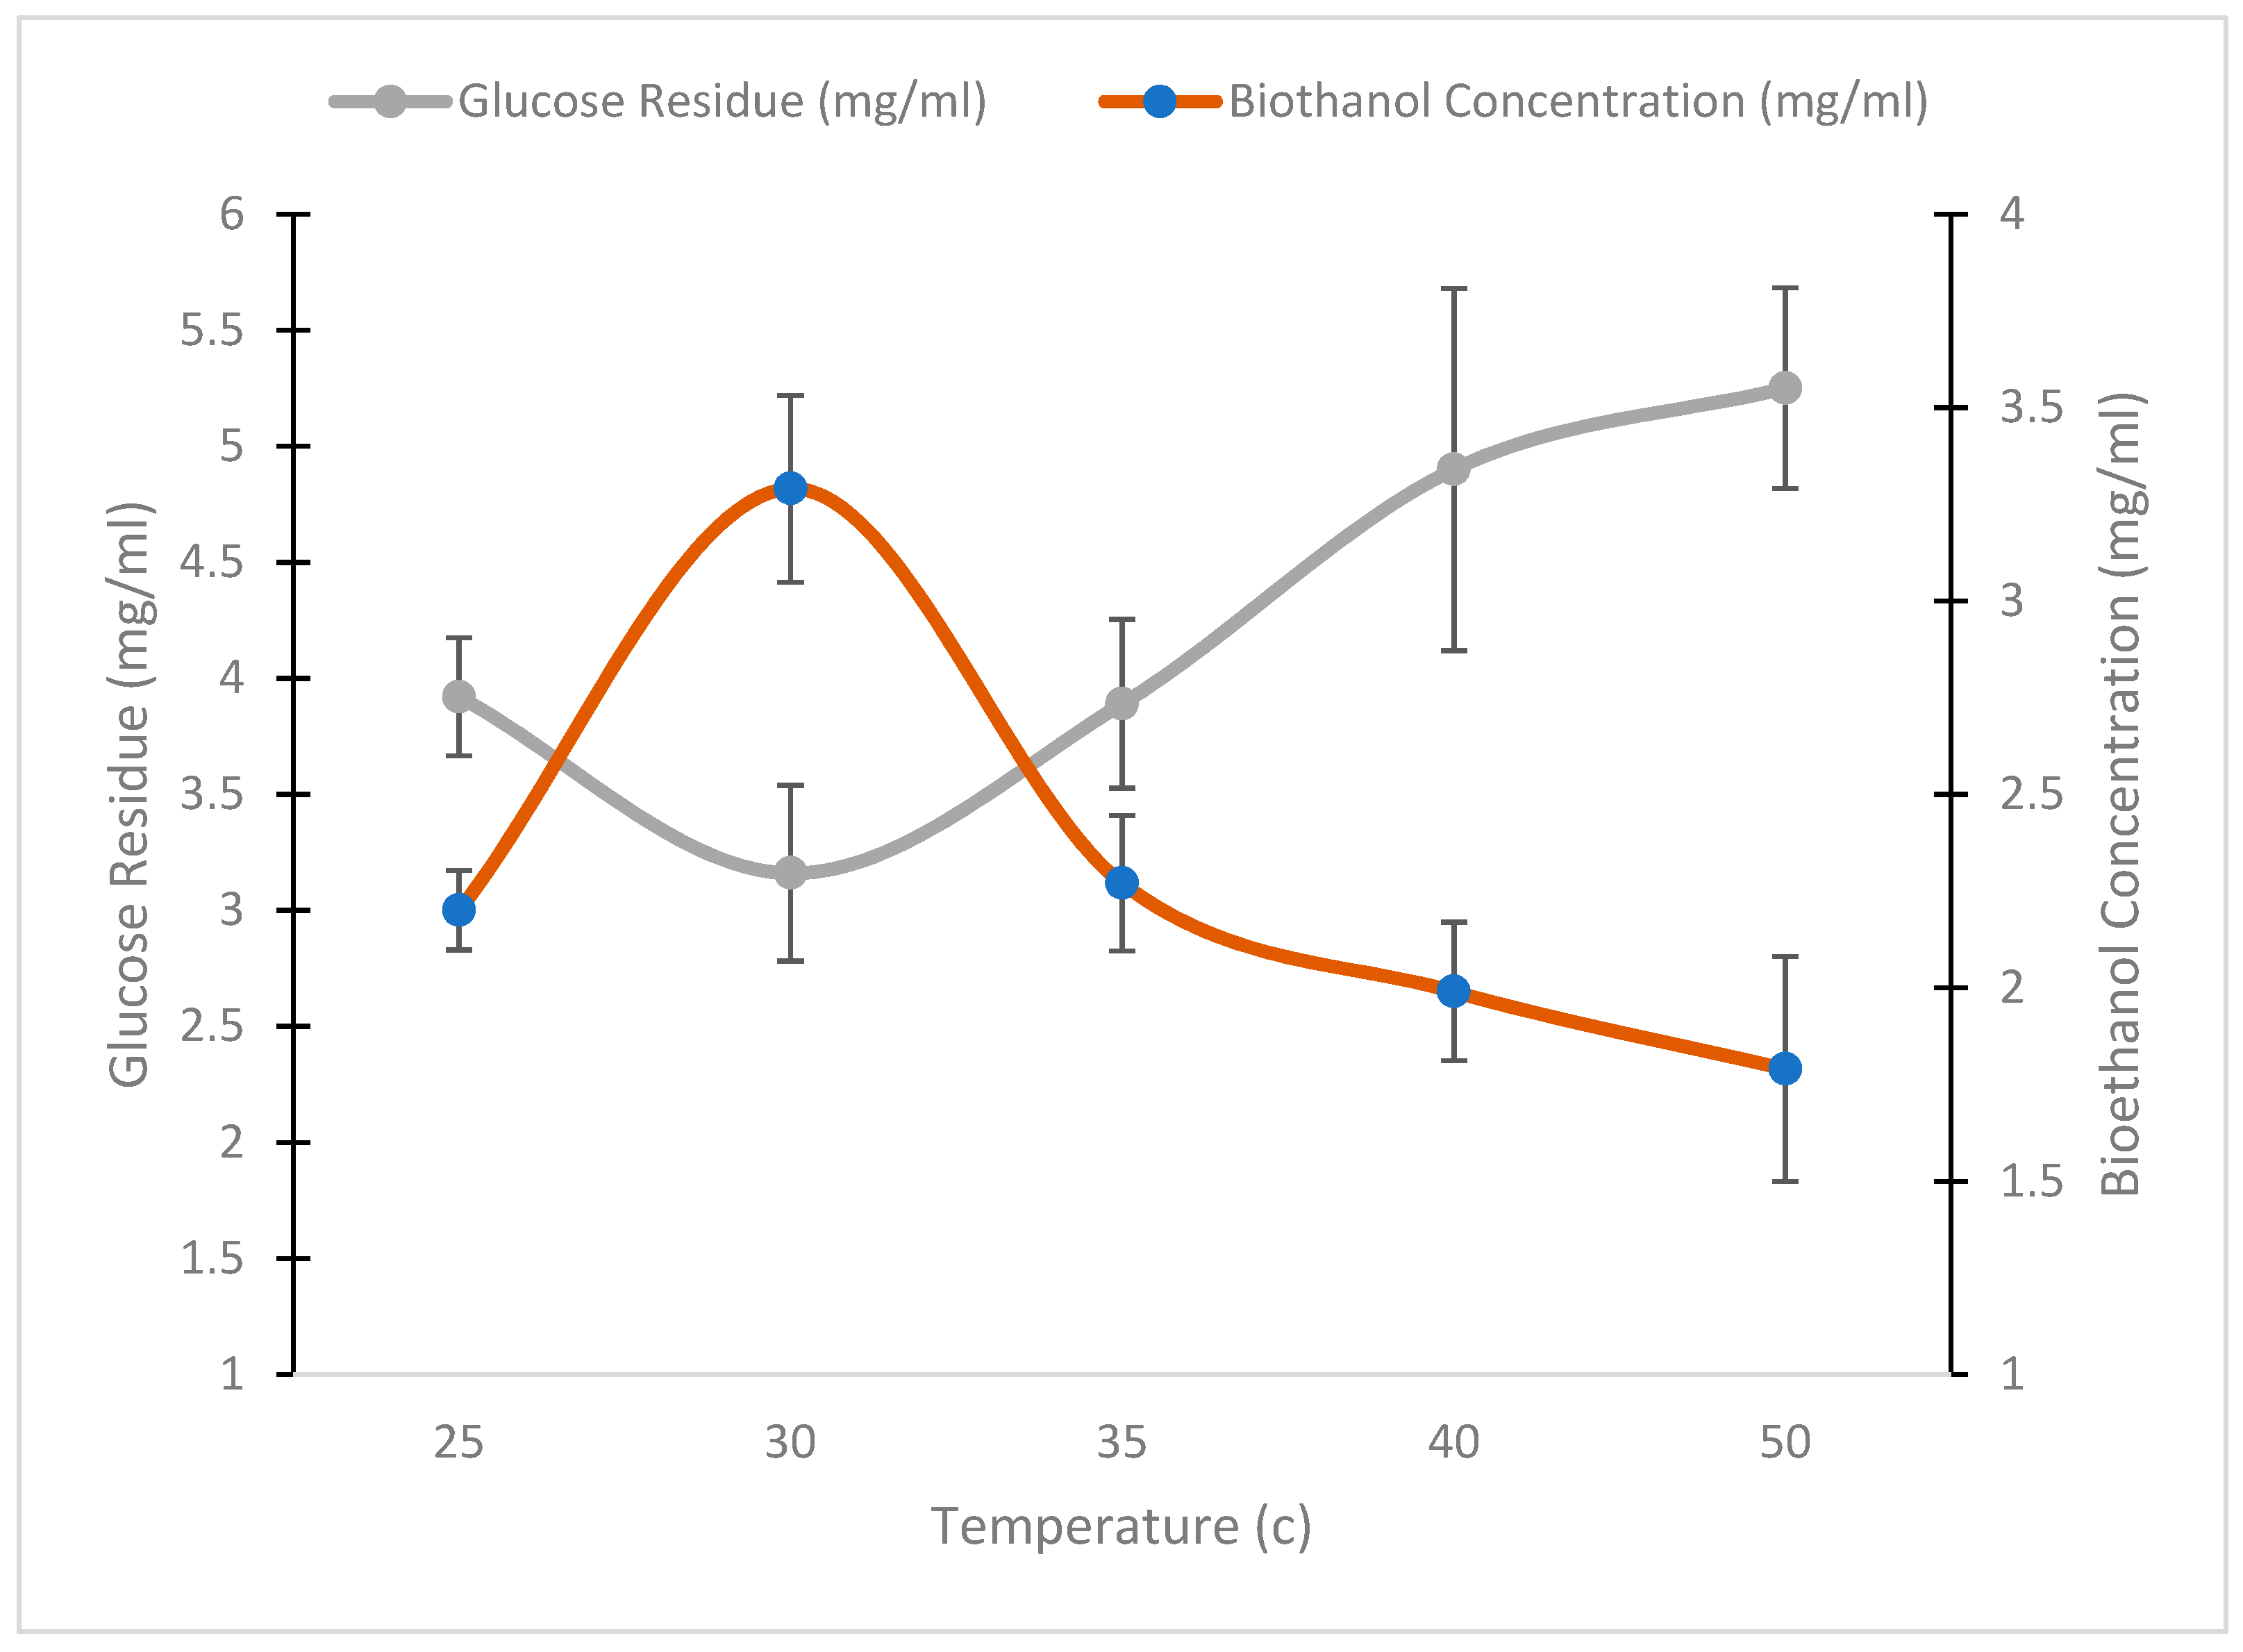
2.6.2. Effect of the Cultivation Temperature on the Bioethanol Production

A volume of 250 µL of G4 isolate pre-culture in YPG broth was added to 5 mL of cellulosic waste hydrolysate in different sterile falcon tubes. All of the tubes were then divided into replicates and anaerobically incubated at different temperatures of 25, 30, 35, 40, and 50 °C for 72 h, according to [26] with some modifications. At the end of incubation, both residual glucose and the produced bioethanol concentrations were determined.

2.6.3. Effect of Medium pH on the Bioethanol Production

The fiber waste hydrolysate was dispensed into different falcon tubes with 5 mL each. The pH of the tubes was separately adjusted to 3, 4, 5, 6, 7, 8, 9, and 10 in replicates using NaOH pellets [27]. Each tube was then inoculated with 250 µL of an overnight culture of G4 isolate, except the control tubes, which were kept un-inoculated. All of the experimental and control tubes were incubated at 30 °C under anaerobic conditions for 72 h. Residual glucose and bioethanol concentrations were spectrophotometrically determined at the end of the incubation period.

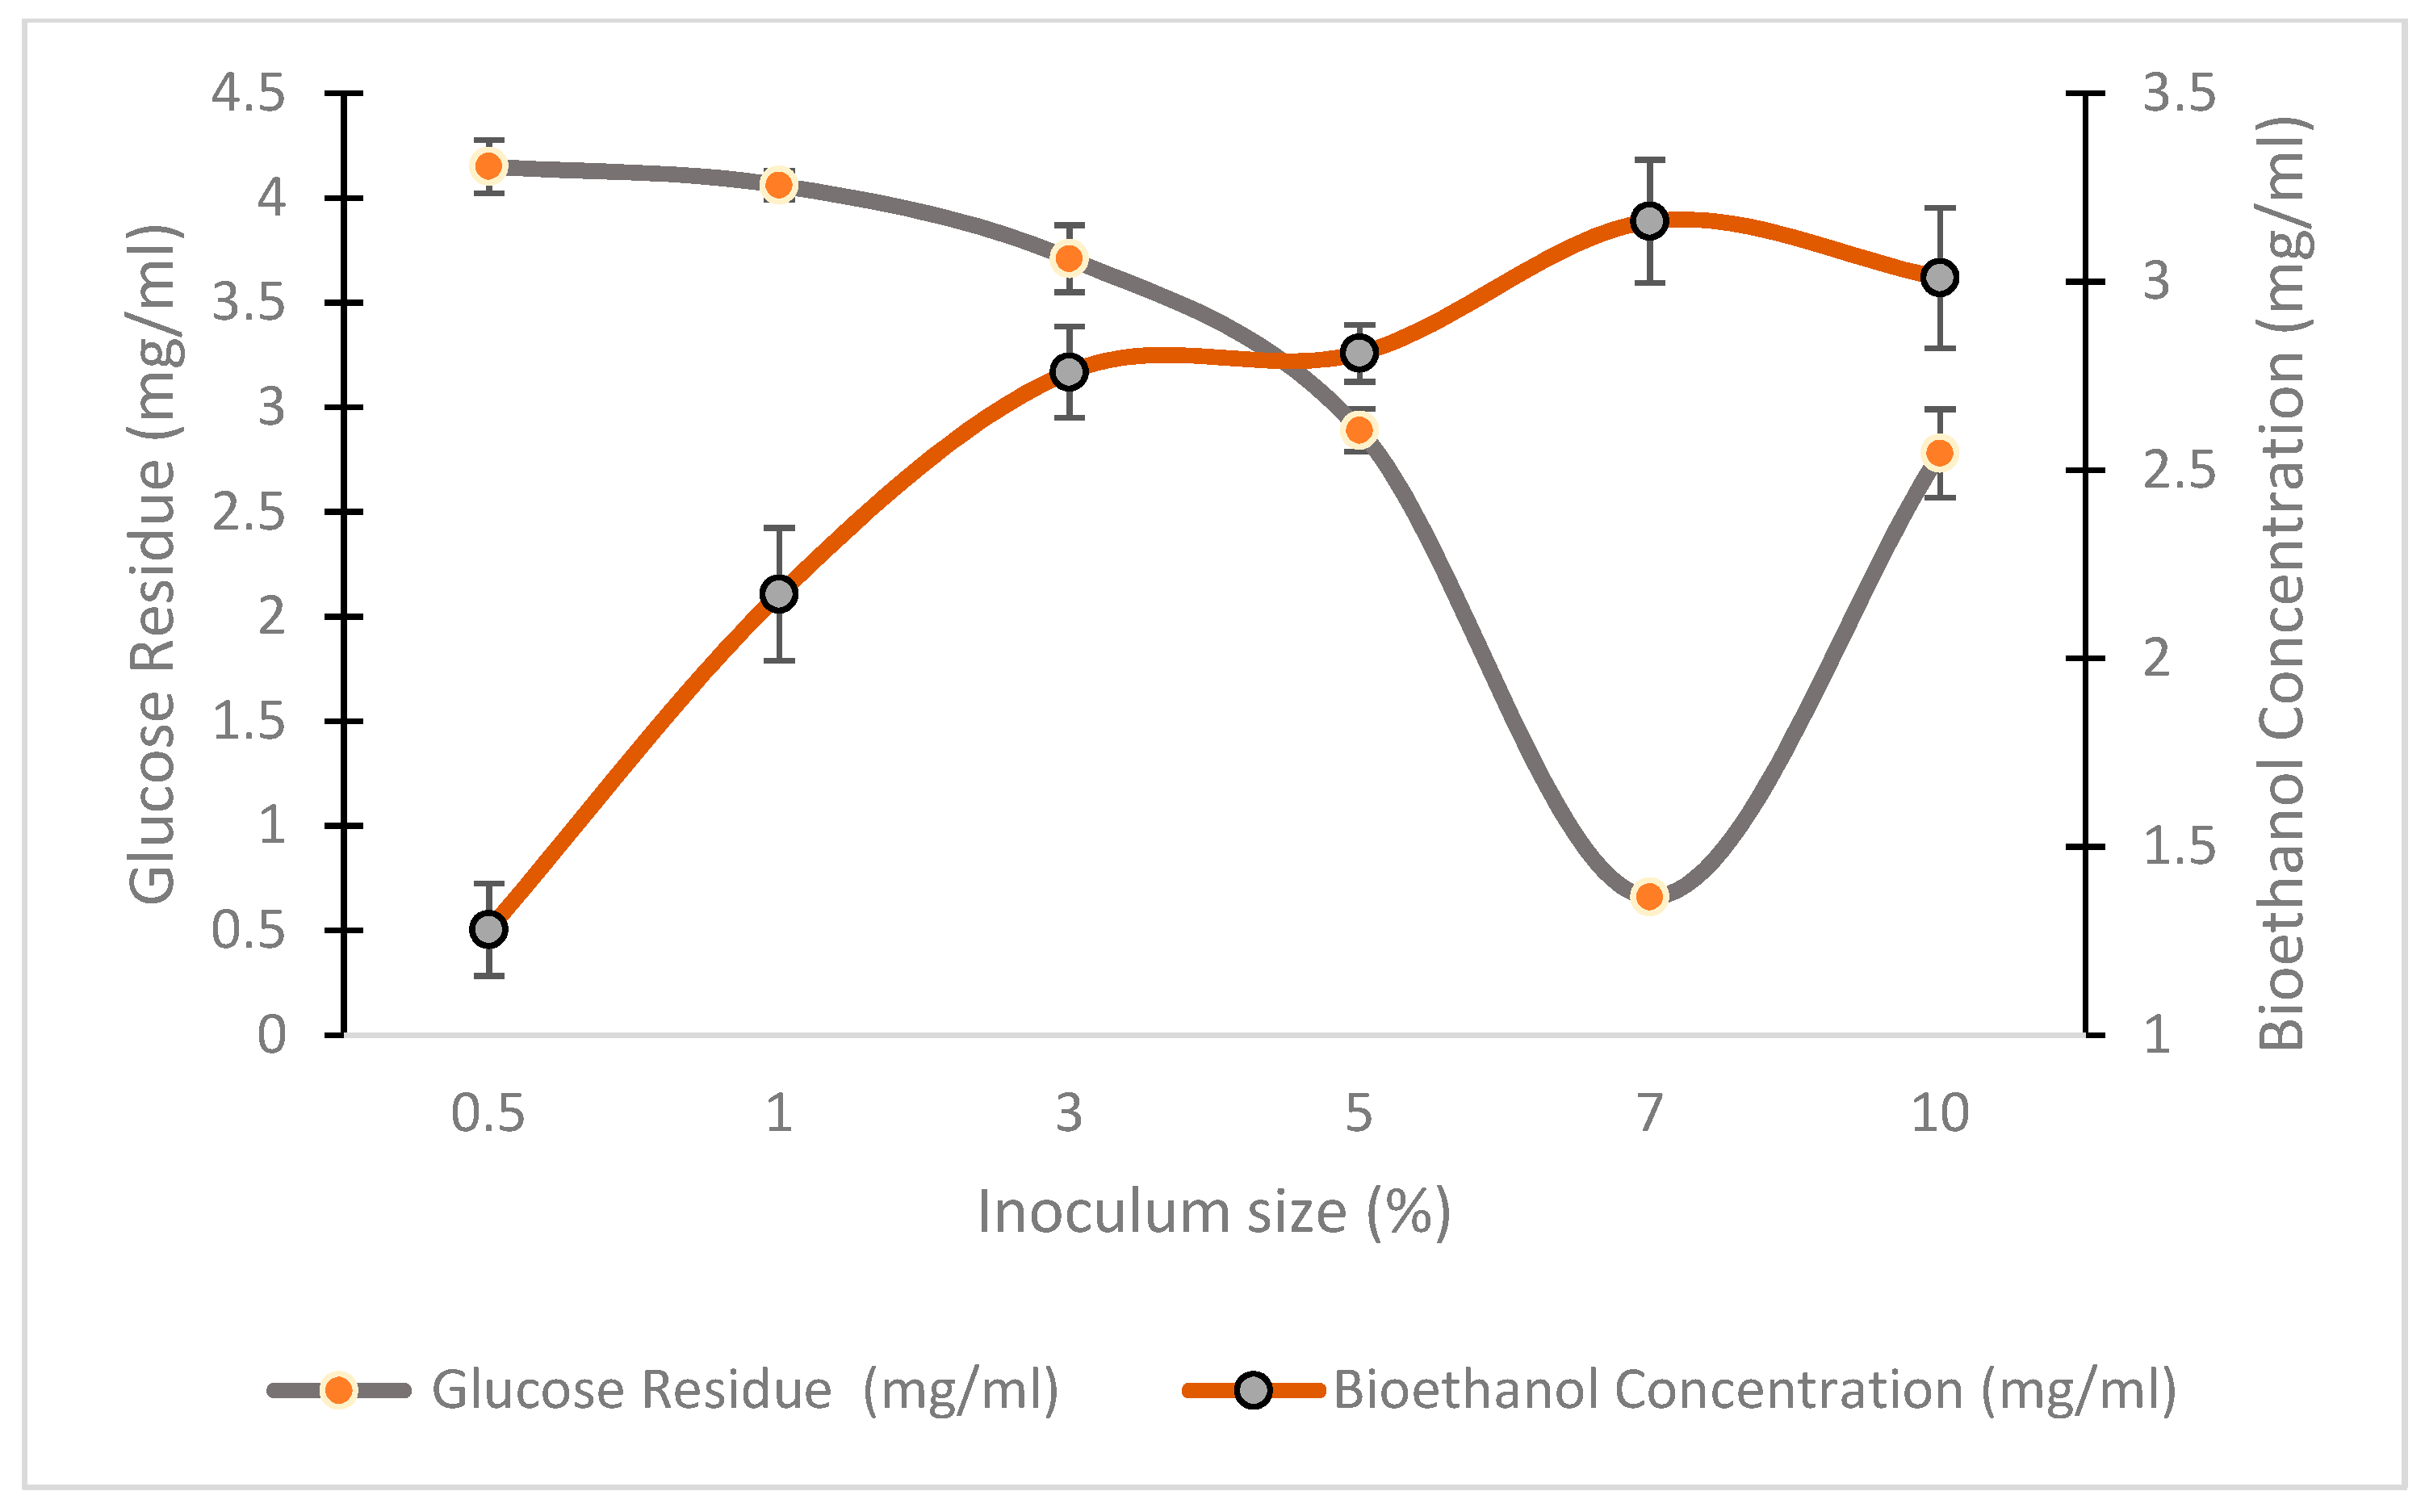
2.6.4. Effect of Yeast’s Inoculum Size on Bioethanol Production

A total volume of 5 mL fiber waste hydrolysate (pH 5) was dispensed into different falcon tubes, followed by the inoculation of various inoculum sizes (0.5, 1, 3, 5, 7, and 10% v/v) of an overnight culture of the yeast used, according to [28] with some modifications. All of the tubes, including the un-inoculated controls, were incubated anaerobically at 30 °C for 72 h. The residual glucose and the produced bioethanol concentrations were investigated.

2.7. Conversion Yield

The conversion efficiency or theoretical ethanol yield (%) has been calculated according to [2] as follows:
Bioethanol   yield   ( g / g )   of   glucose   = Bioethanol   concerntration   ( g l ) Initial   glucose   concerntration   ( g l )
Conversion   efficiency   ( % ) = EtOH 0.51 ×   100
After all, the optimization conditions for waste treatment and bioethanol production can be illustrated in Scheme 1.

2.8. Molecular Identification of the Yeast Isolate (G4)

2.8.1. DNA Extraction

The yeast isolate G4 was submitted for DNA extraction using Quick-DNA™ Fungal/Bacterial Miniprep Kit (Zymo Research, USA).

2.8.2. PCR of 23S rRNA Gene

After the extraction of DNA, PCR was performed using universal primers. COSMO PCR red master mix was used with the addition of 1 µM of each primer and 1 µg of the extracted DNA with nuclease-free water up to 50 µL. The PCR program was started with a denaturation step at 95 °C for 2 min followed with 30 cycles of denaturation at 95 °C for 15 sec, annealing at 55 °C for 30 s, extension at 72 °C for 45 s, with a final extension step at 72 °C for 7 min. The obtained PCR product was submitted for purification and sequencing (Sigma, Germany).

2.8.3. Sequencing and GenBank Submission

The obtained sequence was compared with the other sequences deposited in GenBank to identify the isolate at both the genus and species levels. The obtained sequence was subsequently deposited in GenBank using a unique accession number.

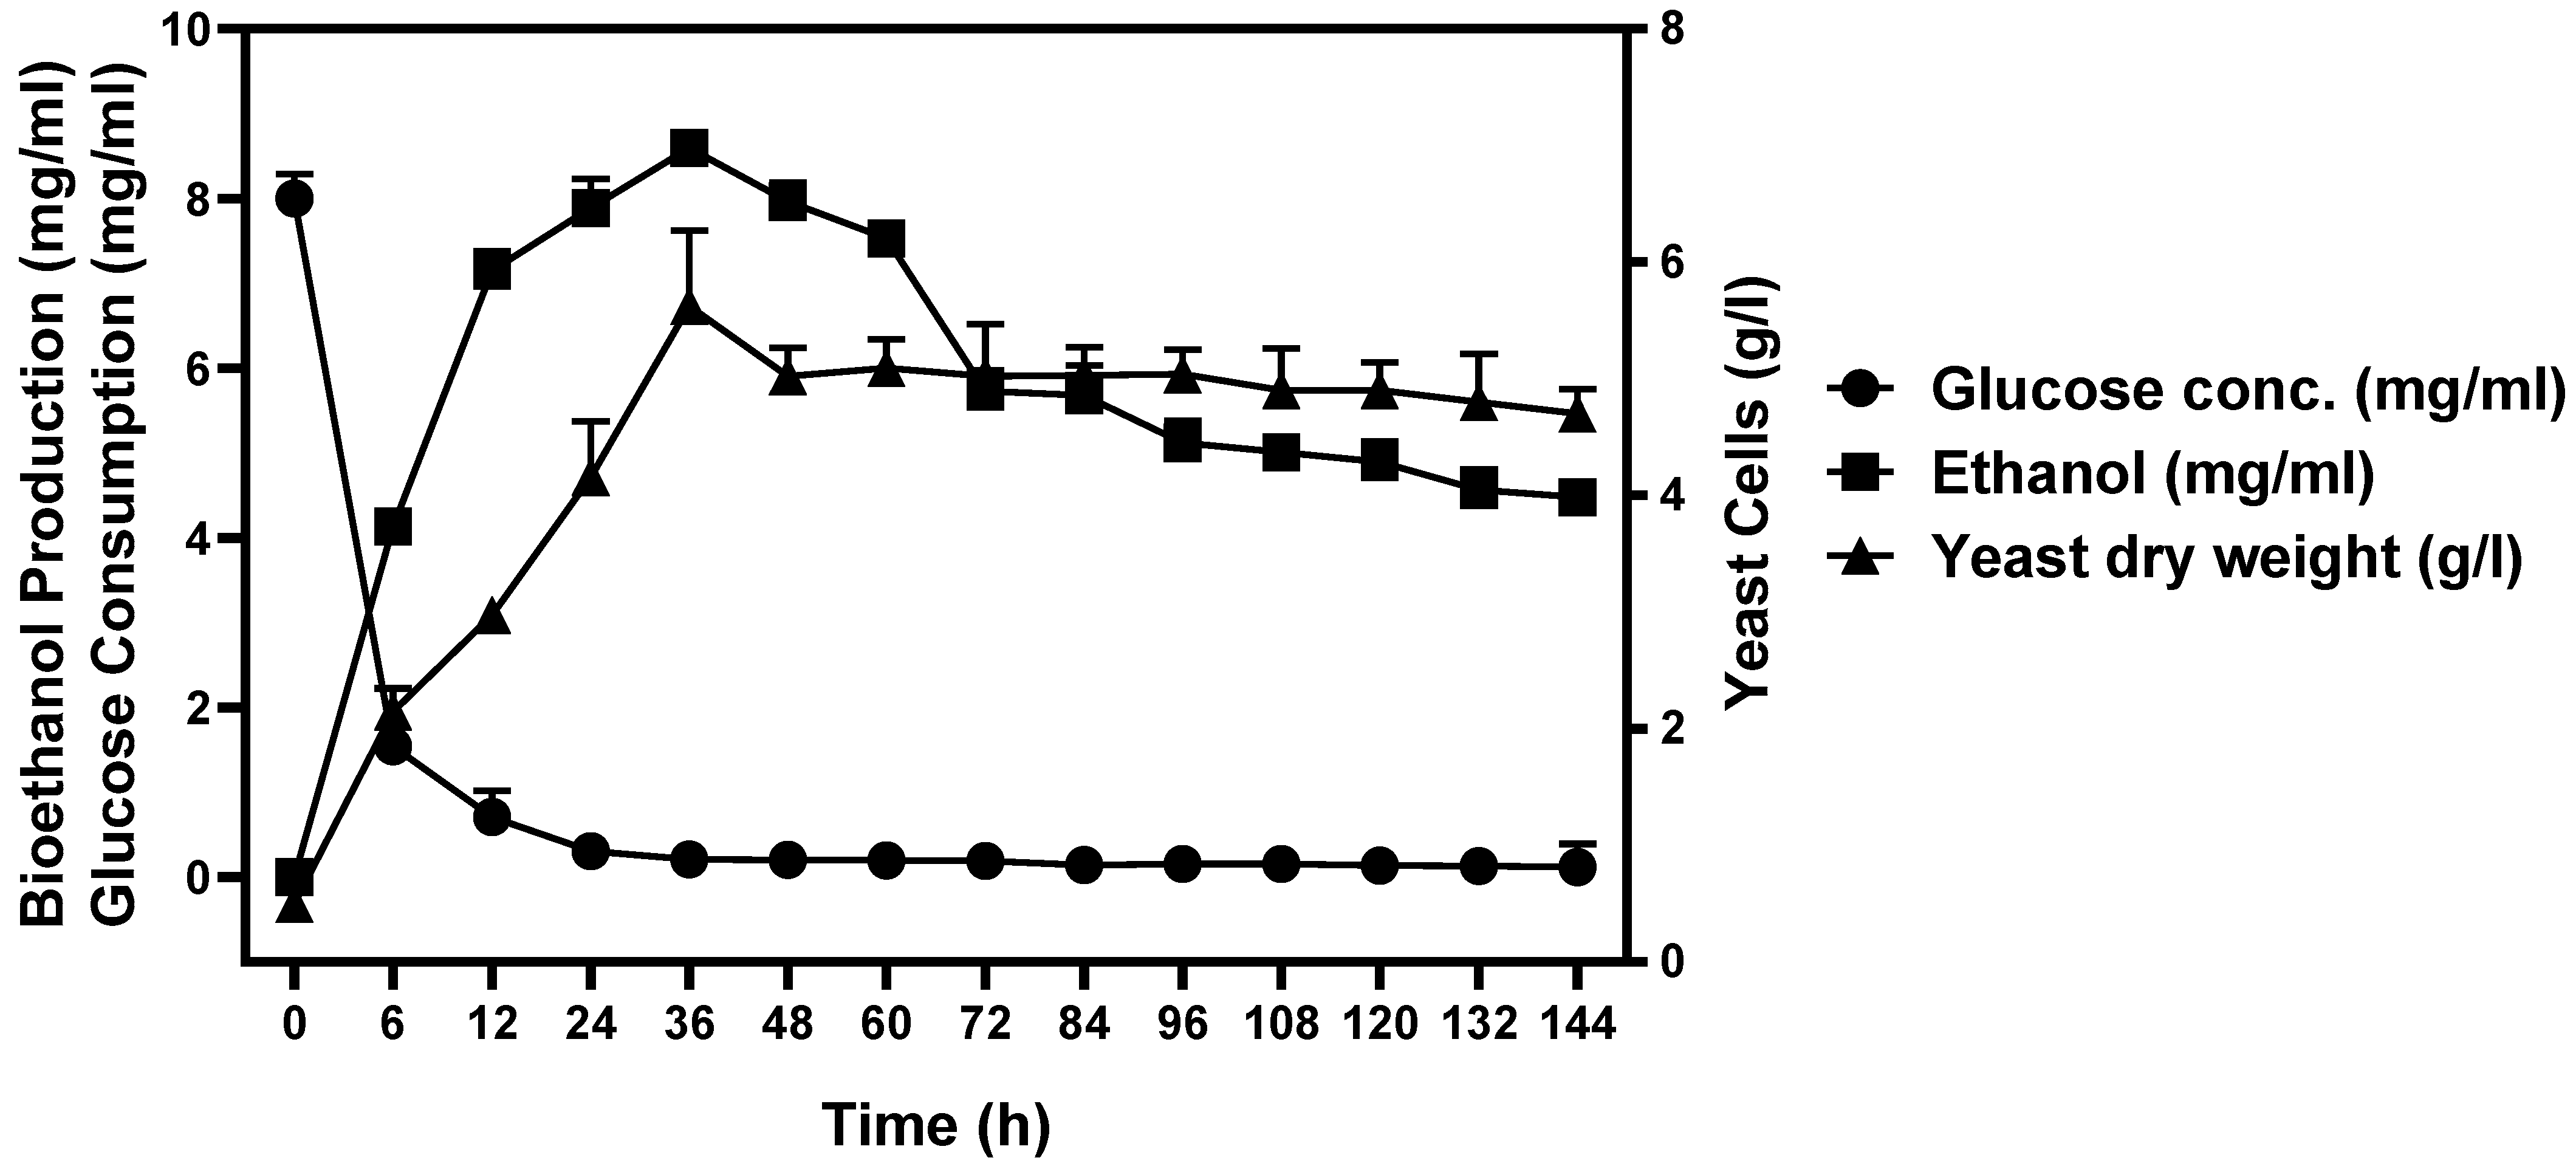
2.9. Bioreactor Cultivation

The production of bioethanol from cellulosic fiber waste was scaled up from the shaking flask scale to a bench-scale bioreactor using yeast-coded G4. The bioreactor cultivation was carried out at a stirred-tank bioreactor (Bio flow 310, New Brunswick Scientific, USA) with a glass vessel of 7 L. The bioreactor had a digitally controlled pH electrode, a temperature probe, and a polarography-dissolved oxygen electrode (DO). The ethanol production was conducted at a working volume of 3 L of waste hydrolysate with an initial pH of 5.5. The yeast pre-inoculum was prepared in a YPG medium and incubated at 30 °C for 24 h to a final OD600 of 0.6. Under aseptic conditions, the ethanol production was initiated by inoculating the bioreactor with 7% (v/v) of G4 isolate and cultivating at 30 °C under batch fermentation mode. For the first 6 h of cultivation, the agitation speed was adjusted to 100 rpm through a stirred motor equipped with two sets of 4-bladed Rushton turbine impellers to ensure good mass transfer. No oxygen was supplied during fermentation and the initial oxygen concentration of the prepared waste was considered 100% DO saturation. Samples were withdrawn internally from the fermentation medium, where ethanol accumulation and glucose consumption were evaluated.
It is worth mentioning that all of the experiments were performed in triplicates.

3. Results and Discussion

3.1. Determination of the Optimum Glucose Production Conditions

3.1.1. Determination of the Optimum Physico-Chemical Treatments

Screening for the best hydrolysis conditions of cellulosic fiber wastes into glucose units was a critical step for proper progress throughout the study. A fixed 1% concentration of the fiber waste was treated with different acidic and alkaline solutions, followed by physical treatments. It was reported that both diluted and concentrated acids were used to break the rigidity of lignocellulosic wastes, and HCl and H2SO4 were the most commonly used acids [29]. Moreover, the acid or base concentrations used were previously applied for treating multiple cellulosic waste products, such as using 10% acids for the pretreatment of office paper waste [30], or 20% acid concentrations for the pretreatment of cardboard waste [31].
The treatment results (Figure 2) indicated significant variation in the waste hydrolysis level as indicated in the glucose concentrations attributed to the hydrolysis strategy. It was previously reported that the liberation of glucose units from cellulosic wastes was type-dependent, since strong chemical and physical treatments were required to treat some of these wastes, while mild pretreatment conditions could be adequate for others [32]. Among other applied hydrolysis solutions, acidic hydrolysis with HCl was the most significant, especially when followed with autoclaving or boiling, with maximum final glucose concentrations of 1.57 and 0.97 mg/mL for the two treatments, respectively. The second-best applied acid was phosphoric acid, which showed the liberation of 0.38 mg/mL glucose units after hot plate treatment, followed by acetic acid and sulfuric acid, which showed 0.31 and 0.30 mg/mL glucose units after sonication treatments, respectively (Figure 2). On the other hand, the water and alkaline treatments revealed insignificant waste hydrolysis results at most physical treatments except boiling. It was claimed that the hydrolysis of cellulosic wastes with acids was the most potent and favored treatment method [22]. The obtained data were in accordance with [33], who reported that the diluted acids were sufficient for the hydrolysis of cellulosic wastes and for removing their hemicellulose content. Moreover, the autoclaving of the treated wastes was also considered a potent physical treatment method as it depended on pressure and high temperature [34].

3.1.2. Determination of the Optimum HCl Concentration

Based upon the high potency of HCl in cellulosic waste hydrolysis, the effects of different HCl concentrations were evaluated. The obtained results (Figure 3) revealed that the glucose concentration was gradually increasing in proportion to the HCl concentration. As shown in Figure 2, the glucose concentration increased from 0.33 mg/mL to 1.71 md/mL by increasing the HCl concentration from 5 to 35%, with the maximum glucose liberation at 40% HCl (2.02 mg/mL). The results were in line with other studies that reported the potency of HCl for maximum sugar releasing from cellulosic wastes, yet the HCl concentrations were varied, which could be attributed to different hydrolysis conditions and lignocellulose characteristics [35].

3.1.3. Optimization of Cellulosic Waste Concentration

Different cellulosic waste concentrations were evaluated for maximum glucose-releasing potency. The results (Figure 4) revealed that increasing the cellulosic waste concentration also increased the hydrolysis efficiency, as indicated in the final glucose concentration. The glucose concentration gradually increased from 0.21 to 5.18 mg/mL, starting from 0.2 to 4% of the fiber concentrations. The maximum glucose concentration (5.7 mg/mL) was recorded at 5% waste concentration (Figure 4). Any increase in waste concentration beyond 5% slowed the hydrolysis process and resulted in a lower glucose concentration (5.15 mg/mL at 7% waste). Our data were in accordance with studies in the literature, which found that using higher substrate concentrations could enhance the operability of the hydrolysis process, thus affecting the hydrolysis rate and augmenting the glucose yield in the hydrolysates [36,37,38,39]. However, contrary to this, our results revealed that increasing the substrate concentration to levels above 5% resulted in lower production of the glucose units, which indicated that 5% was the optimum substrate percentage that could be hydrolyzed using the above-mentioned physico-chemical conditions.

3.1.4. Mixed Physico-Chemical and Enzymatic Hydrolysis

The enzymatic waste hydrolysis was evaluated upon the resulting optimum physico-chemical conditions to enhance the hydrolysis results. Herein, the treatment of cellulosic fiber wastes with 40% HCl followed by autoclaving generated 20.8 mg/mL of glucose, which was considered as the initial sugar concentration. The enzymatic hydrolysis results (Figure 5) revealed that the application of cellulases significantly increased glucose liberation, especially with prolonged hydrolysis time. The glucose concentration increased from 10.9 to 13 mg/mL with increasing cellulases concentration from 8.4 to 42 U after 72 h of hydrolysis. The maximum glucose concentration was detected at 168 U of cellulases after 72 h as 13.9 mg/mL. However, cellulase concentration above 168 U gradually decreased the glucose concentration titer from 12.8 to 12.4 mg/mL using 210 and 336 U of cellulase enzymes after 72 h of incubation, respectively. Mixed chemical or physical treatment with enzyme hydrolysis was recently identified as an efficient and reliable approach for lignocellulosic material hydrolysis, which was in line with the current results [5,40]. However, mechanical (such as a high-pressure water jet system) and enzymatic pretreatments were also performed [13]. On the other hand, some researchers valorized using lignocellulosic wastes such as corncob pith as the raw material for the enzymatic production of xylooligosaccharides without pretreatment [7].

3.2. Waste Characterization
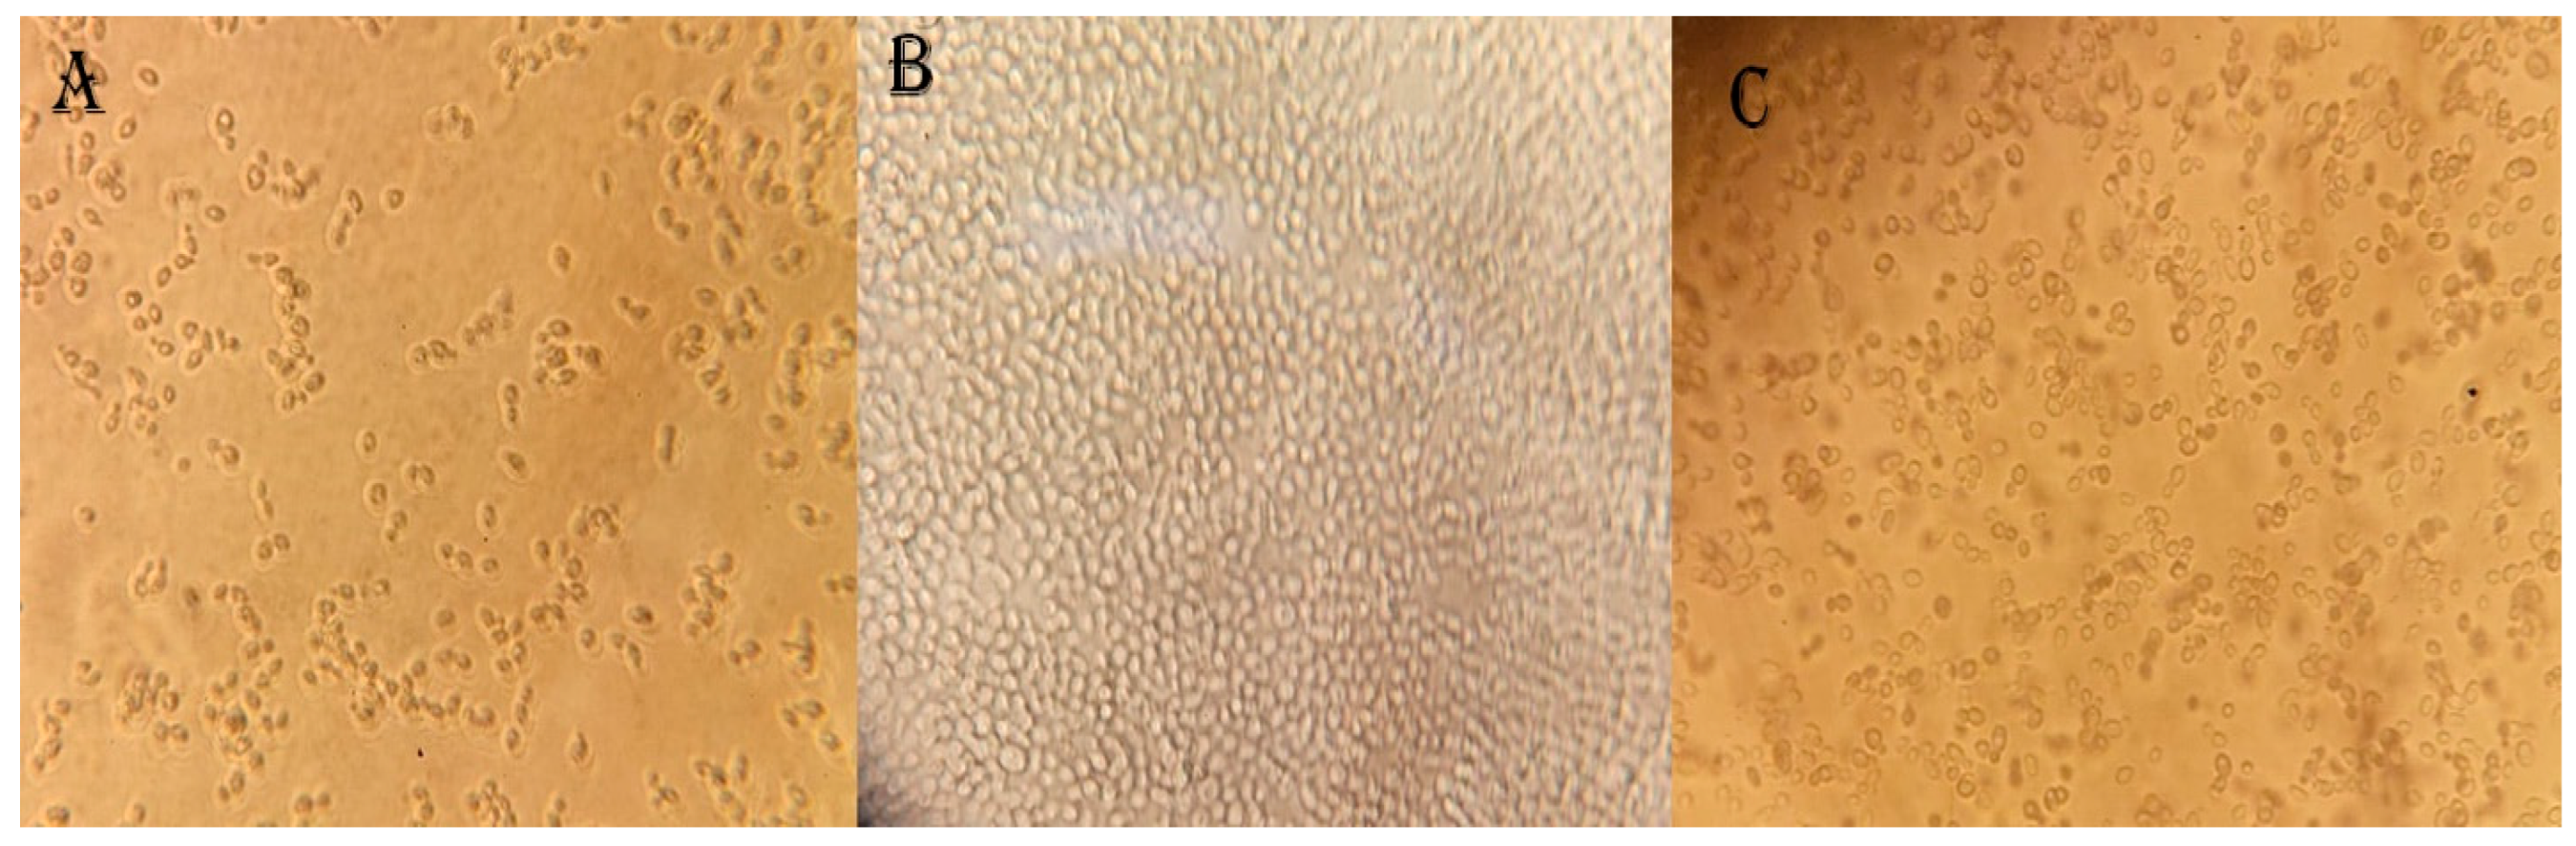
3.2.1. SEM

The micrographs of the cellulosic fiber waste were investigated before and after the hydrolysis process. As shown in Figure 6, the untreated cellulosic fibers appeared as long threads with smooth surfaces and no cracks. However, the fibers’ surface turned into an edge with short, wrinkled threads after treatment.
According to the SEM micrographs shown, it could be concluded that these micrographs provided a clear indication of the degradation of the treated wastes into smaller units, which was in accordance with the data on liberated glucose measurements and supports the principle of the hydrolysis of cellulosic wastes into shorter polysaccharide chains using acidic and autoclaving treatments.

3.2.2. FTIR Spectroscopic Analysis

Infrared spectroscopy is currently one of the most important analytical techniques available to scientists. It presents a relatively easy method for obtaining direct information on chemical changes that occur during chemical treatments. FTIR analysis was conducted to investigate the presence of different functional groups in the treated and untreated cellulosic waste samples. Figure 7 presents the IR spectra of the cellulosic fiber waste before and after hydrolysis. The spectra showed characteristic peaks at 1012, 1319, 1425, 1627, 2889, and 3274 cm−1, which referred to C-O-C stretching at the β-(1→4)-glycosidic linkages, C-C, CH2 bending, C=O stretching of polysaccharides, C-H stretching, and OH groups stretching, respectively, which demonstrated the higher intensity of the tested cellulosic waste [41].
The band at ~3500 cm−1 related to the stretching of the OH groups was narrower and had a higher intensity for the hydrolyzed samples, which demonstrated that the treated cellulosic wastes contained more –OH groups than in the untreated samples. The absorption peak at ~1640 cm−1 proved the degradation of cellulose and was attributed to the C=O stretching of polysaccharides, which increased in intensity after hydrolysis [42].
Another indicator of the degradation of polysaccharides during the chemical treatments was the significant decrease in the intensity of the peak around 1015 cm−1, which was related to the (-COC) glycosidic linkage in the polysaccharides. Moreover, the peak of C-O-C shifted from 1012 to 1038 cm−1 with a low intensity, while (C=O) shifted from 1627 to 1635 cm−1 with a higher intensity than the untreated fibers, which was due to the acid hydrolysis process of the waste [43,44].

3.3. Yeast Isolation from Different Fruit Samples

The rotten fruits (apple, banana, and grape) that were tested were serially diluted in sterile saline solution and spread over YPG agar plates to isolate yeast strains. The obtained results showed the ability of some colonies with yeast-specific characteristics to grow over the inoculated YPG plates. A colony on each plate was tested under the optical microscope to investigate its shape and purity (Figure 8). Each colony was named according to its isolation source as: Ap1 from the apple sample, B2 from the banana sample, and G4 from the grape sample.

3.4. Screening the Bioethanol Production Potential of Isolated Yeast

The three selected yeast isolates (Ap1, B2, and G4) were tested for their ability to ferment glucose into bioethanol using YPG broth. As shown in Table 1, the three tested yeast isolates revealed significant bioethanol production potentials in a range from 4.23 to 4.68 mg/mL. The obtained results showed that the highest produced bioethanol concentration was recorded as 4.68 mg/mL using the G4 isolate. However, slightly lower bioethanol concentrations were recorded as 4.23 and 4.48 mg/mL in the B2 and Ap1 isolates, respectively. Therefore, the current study selected the G4 isolate as the biochemical machinery to produce bioethanol through the fermentation of the glucose units liberated from the cellulosic fiber wastes.

3.5. Optimization of Bioethanol Production Conditions

The cultivation conditions of the selected yeast isolate (G4) on cellulosic fiber waste were evaluated toward maximum bioethanol production conditions.

3.5.1. Effect of Aerobic and Anaerobic Fermentation

The selected yeast isolate (G4) was incubated under aerobic and anaerobic conditions with the cellulosic fiber waste hydrolysate to determine which of these conditions was optimum for maximum bioethanol production. As shown in Table 2, the highest bioethanol concentration of 4.68 mg/mL was obtained under anaerobic cultivation conditions. The maximum produced bioethanol titer was 22% higher than that produced under aerobic conditions (3.82 mg/mL). In the same line, the residual glucose concentration indicated a higher glucose consumption under anaerobic conditions (2.22 mg/mL) compared to aerobic cultivation (2.90 mg/mL), where the initial glucose concentration was 6.81 mg/mL. The higher bioethanol production under anaerobic conditions was in line with the high ability of the yeast cells to grow under anaerobic conditions, which were confirmed with the glucose consumption results [45].

3.5.2. Effect of Cultivation Temperature

The incubation temperature directly influenced the yeast growth rates and substrate consumption [46]. Therefore, the selected G4 isolate was incubated at different temperatures to investigate the effect on bioethanol production. The results (Figure 9) revealed the significant impact of cultivation temperature upon glucose consumption, and hence bioethanol production. At 25 °C, the results indicated 2.20 mg/mL of bioethanol with a residual glucose concentration of 3.92 mg/mL. The elevation of the incubation temperature to 30 °C increased the bioethanol production to 3.29 mg/mL with the lowest measured glucose residue of 3.16 mg/mL. The higher temperatures (above 30 °C) adversely affected bioethanol production, where the lowest bioethanol was at 50 °C about 1.79 mg/mL with a residual glucose concentration of 5.25 mg/mL. The results were in line with the reported optimum temperature for S. cerevisiae free cells around 30 °C [26,47].

3.5.3. Effect of Medium pH

The effect of different pH values on the production of bioethanol using the G4 yeast isolate was also investigated. The residual glucose and bioethanol concentrations in the fermented cellulosic fiber hydrolysate are shown in Figure 10. The results indicated that the lowest measured bioethanol concentrations were at pH 3 and 4; 1.54 and 2.02 mg/mL, respectively. The elevation of the pH to 5 increased the glucose consumption rate to 0.10 mg/mL and the bioethanol concentration to 3.69 mg/mL. Increasing the medium pH (above 5) gradually decreased the bioethanol production to 3.64 mg/mL at pH 6 and 1.94 mg/mL at pH 10. Several studies reported an optimum pH for bioethanol production between 5 and 5.5 using some food wastes [26,48]. Lower or higher pH values for S. cerevisiae optimum ethanol production were also reported [49,50]. These results revealed that the optimum pH for the highest bioethanol production using the G4 yeast isolate was 5.

3.5.4. Effect of Inoculum Size

As the number of the inoculated yeast cells greatly affects the concentration of the product during the fermentation process, different inoculum sizes of the G4 yeast isolate were tested for their effect on bioethanol production using fiber waste hydrolysate. As illustrated in Figure 11, increasing the yeast’s inoculum size resulted in an increase in the produced bioethanol concentration to a certain limit, followed by a decline in the bioethanol concentration. A gradual increase in the bioethanol concentration started from 0.5% yeast inoculum (1.28 mg/mL) to reach 2.81 mg/mL at the 5% inoculum size, with a maximum bioethanol production of 3.16 mg/mL at the 7% inoculum size. It is worth mentioning that the lowest glucose residue was measured when the 7% inoculum size was used (0.66 mg/mL). On the other hand, increasing the inoculum size to 10% reduced the bioethanol production to 3.01 mg/mL. In a similar study, Zhang et al. reported a 7% S. cerevisiae inoculum size for maximum bioethanol production from raw sweet potato [51]. Depending on the obtained data, it could be concluded that after the optimization experiments the conversion efficiency (%) according to Equations (1) and (2) was 42%.

3.6. Molecular Identification of G4 Isolate

The molecular identification of the yeast isolate using the amplification and sequencing of 23S rRNA and the obtained sequence was submitted to GenBank in order to obtain a specific accession number. The obtained data revealed that the isolate belonged to the genus Starmerella and was identified as Starmerella bacillaris (STDF-G4). The obtained sequence was deposited in GenBank under the accession number OP872748. The similarity of the yeast strain with other strains in GenBank could be represented in a phylogenetic tree analysis using the MEGA 11.0 program as shown in Figure 12.

3.7. Bioreactor Cultivation

The urgent need for new sustainable fuel sources forces the continuous research in the valorization of lignocellulosic or cellulosic wastes into bioethanol to overcome their environmental accumulation issues, in addition to providing an ecofriendly alternative for current fuel sources [52,53]. In this regard, the cellulosic fiber waste potential for bioethanol production was evaluated in a bench-scale bioreactor based upon the optimization experiment results on shake flasks. The initial glucose concentration in the applied waste (about 8 mg/mL) was sharply decreased in the first 36 h of fermentation to reach about 0.2 mg/mL (about 98% of the total glucose). This rapid substrate consumption rate (dS/dT of about −0.069 g/L/h) was proportionally related to yeast cell growth, where after the first 6 h, about 2.15 g/L of yeast cells were detected and gradually increased to a maximum (Xmax) of about 5.6 g/L at 36 h of fermentation with a growth rate (dX/dT) of 0.17 g/L/h. The bioethanol production was in line with the cell mass increasing, where after the first 6 h, about 4.13 mg/mL of bioethanol was detected and gradually increased to a maximum (about 8.6 mg/mL) at the same time (36 h) with a production rate (dP/dT) of about 0.2 g/L/h (Figure 13). After 36 h, the glucose consumption rate was significantly decreased almost to zero, with an insignificant reduction in glucose content from 0.2 mg/mL to 0.1 mg/mL within 108 h (from 36–144 h), where the yeast cells sustained a stationary phase growth pattern. The ethanol production rate was in line with glucose consumption, where after 36 h, the bioethanol was reduced by about 48% (from 8.6 to 4.48 mg/mL) at 144 h of fermentation (108 h after maximum production). These results were consistent with [10], who reported that the Saccharomyces cerevisiae strain succeeded in fermenting all of the reducing sugars in the food hydrolysate into bioethanol, yielding 0.43–0.50 g of bioethanol/g reducing sugars after 120 h of fermentation.

4. Conclusions

In the current work, the optimized conditions of using HCl, autoclaving, and enzymatic hydrolysis were applied to maximize the number of glucose units released from the fiber waste to be used as the raw material for bioethanol production. The SEM and FTIR investigations were used to confirm the degradation process and the liberation of the glucose units. These glucose units were effectively fermented into bioethanol using a yeast isolate identified with molecular tools as Starmerella bacillaris STDF-G4 with accession number OP872748. The large-scale production of bioethanol in a bioreactor fermentor was performed and resulted in the maximization of the product in a reduced time.

Author Contributions

Conceptualization, T.H.T., M.A.A.-S. and R.A.A.; methodology, A.E.M., E.E.-D. and H.E.-G.; software, A.E.M., E.E.-D., H.E.-G., M.A.A.-S., T.H.T. and R.A.A.; validation, M.A.A.-S., T.H.T. and R.A.A.; formal analysis, A.E.M., E.E.-D. and H.E.-G.; investigation, M.A.A.-S., T.H.T. and R.A.A.; resources, A.E.M., E.E.-D., H.E.-G., M.A.A.-S., T.H.T. and R.A.A.; data curation, H.E.-G., M.A.A.-S., T.H.T. and R.A.A.; writing—original draft preparation, A.E.M., E.E,-D., H.E,-G., M.A.A.-S. and T.H.T.; writing—review and editing, H.E.-G., T.H.T. and R.A.A.; visualization, T.H.T., M.A.A.-S. and R.A.A. All authors have read and agreed to the published version of the manuscript.

Funding

This work was conducted under the project funded by the Science, Technology, and Innovation Funding Authority (STDF), Ministry of Scientific Research, Egypt, project ID: 41621, “WIPER”.

Institutional Review Board Statement

Not applicable (study not involving humans or animals).

Informed Consent Statement

Not applicable.

Data Availability Statement

Not applicable.

Conflicts of Interest

The authors declare no conflict of interest.

References

  1. Hussain, A.; Arif, S.M.; Aslam, M. Emerging renewable and sustainable energy technologies: State of the art. Renew. Sustain. Energy Rev. 2017, 71, 12–28. [Google Scholar] [CrossRef]
  2. Khandaker, S.; Bashar, M.M.; Islam, A.; Hossain, M.T.; Teo, S.H.; Awual, M.R. Sustainable energy generation from textile biowaste and its challenges: A comprehensive review. Renew. Sustain. Energy Rev. 2022, 157, 112051. [Google Scholar] [CrossRef]
  3. Parry, M.; Arnell, N.; McMichael, T.; Nicholls, R.; Martens, P.; Kovats, S.; Livermore, M.; Rosenzweig, C.; Iglesias, A.; Fischer, G. Millions at risk: Defining critical climate change threats and targets. Glob. Environ. Chang. 2001, 11, 181–183. [Google Scholar] [CrossRef]
  4. Khan, S.A.; Rashmi; Hussain, M.Z.; Prasad, S.; Banerjee, U. Prospects of biodiesel production from microalgae in India. Renew. Sustain. Energy Rev. 2009, 13, 2361–2372. [Google Scholar] [CrossRef]
  5. Zhao, L.; Sun, Z.-F.; Zhang, C.-C.; Nan, J.; Ren, N.-Q.; Lee, D.-J.; Chen, C. Advances in pretreatment of lignocellulosic biomass for bioenergy production: Challenges and perspectives. Bioresour. Technol. 2021, 343, 126123. [Google Scholar] [CrossRef]
  6. Nieves, D.C.; Alanís, M.J.R.; Quiroz, R.D.L.C.; Ruiz, H.A.; Iqbal, H.M.; Parra-Saldívar, R. Current status and future trends of bioethanol production from agro-industrial wastes in Mexico. Renew. Sustain. Energy Rev. 2019, 102, 63–74. [Google Scholar] [CrossRef]
  7. Gandam, P.K.; Chinta, M.L.; Gandham, A.P.; Pabbathi, N.P.P.; Konakanchi, S.; Bhavanam, A.; Atchuta, S.R.; Baadhe, R.R.; Bhatia, R.K. A New Insight into the Composition and Physical Characteristics of Corncob—Substantiating Its Potential for Tailored Biorefinery Objectives. Fermentation 2022, 8, 704. [Google Scholar] [CrossRef]
  8. Melendez, J.R.; Mátyás, B.; Hena, S.; Lowy, D.A.; El Salous, A. Perspectives in the production of bioethanol: A review of sustainable methods, technologies, and bioprocesses. Renew. Sustain. Energy Rev. 2022, 160, 112260. [Google Scholar] [CrossRef]
  9. Szulczyk, K.R.; Ziaei, S.M.; Zhang, C. Environmental ramifications and economic viability of bioethanol production in Malaysia. Renew. Energy 2021, 172, 780–788. [Google Scholar] [CrossRef]
  10. Jarunglumlert, T.; Bampenrat, A.; Sukkathanyawat, H.; Prommuak, C. Enhanced Energy Recovery from Food Waste by Co-Production of Bioethanol and Biomethane Process. Fermentation 2021, 7, 265. [Google Scholar] [CrossRef]
  11. Sarris, D.; Papanikolaou, S. Biotechnological production of ethanol: Biochemistry, processes and technologies. Eng. Life Sci. 2016, 16, 307–329. [Google Scholar] [CrossRef] [Green Version]
  12. Branco, R.H.R.; Serafim, L.S.; Xavier, A.M.R.B. Second Generation Bioethanol Production: On the Use of Pulp and Paper Industry Wastes as Feedstock. Fermentation 2018, 5, 4. [Google Scholar] [CrossRef] [Green Version]
  13. Zeghlouli, J.; Christophe, G.; Ogura, K.; Sawamura, N.; Guendouz, A.; El Modafar, C.; Michaud, P.; Delattre, C. High-Pressure Water Jet System Treatment of Argan Nut Shell and Enzymatic Hydrolysis for Bioethanol Production. Fermentation 2022, 8, 627. [Google Scholar] [CrossRef]
  14. Rosen, Y.; Mamane, H.; Gerchman, Y. Immersed ozonation of agro-wastes as an effective pretreatment method in bioethanol production. Renew. Energy 2021, 174, 382–390. [Google Scholar] [CrossRef]
  15. Garlapati, V.K.; Chandel, A.K.; Kumar, S.J.; Sharma, S.; Sevda, S.; Ingle, A.P.; Pant, D. Circular economy aspects of lignin: Towards a lignocellulose biorefinery. Renew. Sustain. Energy Rev. 2020, 130, 109977. [Google Scholar] [CrossRef]
  16. Derman, E.; Abdulla, R.; Marbawi, H.; Sabullah, M.K.; Gansau, J.A.; Ravindra, P. Simultaneous saccharification and fermentation of empty fruit bunches of palm for bioethanol production using a microbial consortium of S. cerevisiae and T. harzianum. Fermentation 2022, 8, 295. [Google Scholar] [CrossRef]
  17. Widiarti, N.; Ni’Mah, Y.L.; Bahruji, H.; Prasetyoko, D. Development of CaO from Natural Calcite as a Heterogeneous Base Catalyst in the Formation of Biodiesel: Review. J. Renew. Mater. 2019, 7, 915–939. [Google Scholar] [CrossRef]
  18. Wong, K.H.; Tan, I.S.; Foo, H.C.Y.; Chin, L.M.; Cheah, J.R.N.; Sia, J.K.; Tong, K.T.X.; Lam, M.K. Third-generation bioeth-anol and L-lactic acid production from red macroalgae cellulosic residue: Prospects of Industry 5.0 algae. Energy Convers. Manag. 2022, 253, 115155. [Google Scholar] [CrossRef]
  19. Jusakulvijit, P.; Bezama, A.; Thrän, D. An Integrated Assessment of GIS-MCA with Logistics Analysis for an Assess-ment of a Potential Decentralized Bioethanol Production System Using Distributed Agricultural Residues in Thailand. Sustainability 2022, 14, 9885. [Google Scholar] [CrossRef]
  20. Chen, J.-C.; Guo, J.-S. Improving the conversion efficiency of waste cotton to bioethanol by microwave hydrolysis technology. Sustain. Environ. Res. 2013, 23, 333–339. [Google Scholar]
  21. Gupta, R.; Sharma, K.K.; Kuhad, R.C. Separate hydrolysis and fermentation (SHF) of Prosopis juliflora, a woody substrate, for the production of cellulosic ethanol by Saccharomyces cerevisiae and Pichia stipitis-NCIM. Bioresour. Technol. 2009, 100, 1214–1220. [Google Scholar] [CrossRef]
  22. Salam, M.; Pondith, P.C.; Islam, A.; Khan, M.R.; Uddin, M.R.; Islam, M. Conversion of Cellulosic waste into fermentable sugar: Process optimization. J. Chem. Eng. 2013, 28, 27–31. [Google Scholar] [CrossRef] [Green Version]
  23. Abu-Saied, M.A.; Taha, T.H.; Elnaggar, E.M.; Amer, R.A.; Mansy, A.E.; Elkady, G.M. Green production of bioethanol from cellulosic fiber waste and its separation using polyacrylonitrile-co-poly methyl acrylate membrane. Cellulose 2018, 25, 6621–6644. [Google Scholar] [CrossRef]
  24. Kumar, H.M.; Kumar, K.H.; Yogananda, S.; Swamy, H.V.K.; Nagaraja, T.; Kumar, S.S.; Dalawai, N. Isolation and characterization of yeast strains for bio-ethanol production. J. Pure Appl. Microbiol. 2015, 9, 2435–2441. [Google Scholar]
  25. Sayyad, S.; Chaudhari, S.; Panda, B. Quantitative determination of ethanol in arishta by using UV-visible spectro-photometer. Pharm. Biol. Eval. 2015, 2, 204–207. [Google Scholar]
  26. Ünal, M.Ü.; Chowdhury, G.; Şener, A. Effect of temperature and nitrogen supplementation on bioethanol produc-tion from waste bread, watermelon and muskmelon by Saccharomyces cerevisiae. Biofuels 2020, 13, 395–399. [Google Scholar] [CrossRef]
  27. Ogbonda, K.H.; Kiin-Kabari, D.B. Effect of temperature and pH on ethanol production by a Blastomyces species isolated from the intestine of oil palm weevil (Rhynchophorus palmarum, coleoptera). Afr. J. Biotechnol. 2013, 12, 588–591. [Google Scholar]
  28. Kusmiyati; Shitophyta, L.M. The effect of yeast weight and temperature on ethanol production from sorghum and iles-iles flour. In AIP Conference Proceedings; AIP Publishing LLC: Melville, NY, USA, 2015; p. 030019. [Google Scholar] [CrossRef]
  29. De Jong, R.J.E. Gosselink, Lignocellulose-based chemical products. In Bioenergy Research: Advances and Applications; Elsevier: Amsterdam, The Netherlands, 2014; pp. 277–313. [Google Scholar]
  30. Taha, R.H.; Taha, T.H.; Elsherif, M.A.; Mansy, A. Successive Application of Physicochemical and Enzymatic Treat-ments of Office Paper Waste for the Production of Bioethanol with Possible Using of Carbon Dioxide as an Indicator for the Determination of the Bioethanol Concentration. J. Biobased Mater. Bioenergy 2021, 15, 790–798. [Google Scholar] [CrossRef]
  31. Taha, R.H.; Taha, T.H.; Abu-Saied, M.; Mansy, A.; Elsherif, M.A. Maximization of the bioethanol concentration pro-duced through the cardboard waste fermentation by using ethylenediamine-modifying poly (acrylonitrile-co-methyl acrylate) membrane. Biomass Convers. Biorefinery 2022, 1–19. [Google Scholar] [CrossRef]
  32. Taha, R.H.; Taha, T.H.; Abu-Saied, M.; Mansy, A.; Elsherif, M.A. Successful production of bioethanol from olive waste residues followed by its purification using poly (acrylonitrile-co-methylacrylate)/polymethylmethaacrylate membrane. Biomass Convers. Biorefinery 2022, 1–15. [Google Scholar] [CrossRef]
  33. Vasić, K.; Knez, Ž.; Leitgeb, M. Bioethanol Production by Enzymatic Hydrolysis from Different Lignocellulosic Sources. Molecules 2021, 26, 753. [Google Scholar] [CrossRef] [PubMed]
  34. Irfanullah, N.R.; Arain, M.B.; Shah, N. Conversion of cotton to glucose by base hydrolysis using various hydrolytic conditions. Pakhtunkhwa J. Life Sci. 2014, 2, 125–137. [Google Scholar]
  35. Nwosu-Obieogu, K.; Aguele, F.O.; Agu, C.M.; Onyekwulu, C.S.; Akatobi, K.N. Optimisation of the hydrolysis of melon seed (Citrullus lanatus) husk with hydrochloric acid using response surface methodology. Indian Chem. Eng. 2021, 64, 293–302. [Google Scholar] [CrossRef]
  36. Tippkötter, N.; Duwe, A.-M.; Wiesen, S.; Sieker, T.; Ulber, R. Enzymatic hydrolysis of beech wood lignocellulose at high solid contents and its utilization as substrate for the production of biobutanol and dicarboxylic acids. Bioresour. Technol. 2014, 167, 447–455. [Google Scholar] [CrossRef] [PubMed]
  37. Ostadjoo, S.; Hammerer, F.; Dietrich, K.; Dumont, M.-J.; Friscic, T.; Auclair, K. Efficient Enzymatic Hydrolysis of Biomass Hemicellulose in the Absence of Bulk Water. Molecules 2019, 24, 4206. [Google Scholar] [CrossRef] [Green Version]
  38. Wang, W.; Zhang, C.; Tong, S.; Cui, Z.; Liu, P. Enhanced Enzymatic Hydrolysis and Structural Features of Corn Stover by NaOH and Ozone Combined Pretreatment. Molecules 2018, 23, 1300. [Google Scholar] [CrossRef] [Green Version]
  39. Zeghlouli, J.; Christophe, G.; Guendouz, A.; El Modafar, C.; Belkamel, A.; Michaud, P.; Delattre, C. Optimization of bio-ethanol production from enzymatic treatment of Argan pulp feedstock. Molecules 2021, 26, 2516. [Google Scholar] [CrossRef]
  40. Barampouti, E.M.; Grammatikos, C.; Stoumpou, V.; Malamis, D.; Mai, S. Emerging Synergies on the Co-treatment of Spent Coffee Grounds and Brewer’s Spent Grains for Ethanol Production. Waste Biomass Valorization 2021, 13, 877–891. [Google Scholar] [CrossRef]
  41. Khenblouche, A.; Bechki, D.; Gouamid, M.; Charradi, K.; Segni, L.; Hadjadj, M.; Boughali, S. Extraction and characterization of cellulose microfibers from Retama raetam stems. Polímeros 2019, 29. [Google Scholar] [CrossRef]
  42. Afsharpour, M.; Rad, F.T.; Malekian, H. New cellulosic titanium dioxide nanocomposite as a protective coating for preserving paper-art-works. J. Cult. Heritage 2011, 12, 380–383. [Google Scholar] [CrossRef]
  43. Neto, W.P.F.; Silvério, H.A.; Dantas, N.O.; Pasquini, D. Extraction and characterization of cellulose nanocrystals from agro-industrial residue—Soy hulls. Ind. Crops Prod. 2012, 42, 480–488. [Google Scholar] [CrossRef]
  44. Elerian, A.F.; Abu-Saied, M.A.; Abd-Elnaim, G.H.; Elnaggar, E.M. Development of polymer electrolyte membrane based on poly(Vinyl Chloride)/graphene oxide modified with zirconium phosphate for fuel cell applications. J. Polym. Res. 2023, 6, 30. [Google Scholar] [CrossRef]
  45. Mussatto, S.I.; Dragone, G.; Guimarães, P.M.; Silva, J.P.A.; Carneiro, L.M.; Roberto, I.C.; Vicente, A.; Domingues, L.; Teixeira, J.A. Technological trends, global market, and challenges of bio-ethanol production. Biotechnol. Adv. 2010, 28, 817–830. [Google Scholar] [CrossRef] [PubMed] [Green Version]
  46. Azhar, S.H.M.; Abdulla, R.; Jambo, S.A.; Marbawi, H.; Gansau, J.A.; Faik, A.A.M.; Rodrigues, K.F. Yeasts in sustainable bioethanol production: A review. Biochem. Biophys. Rep. 2017, 10, 52–61. [Google Scholar]
  47. Liu, R.; Shen, F. Impacts of main factors on bioethanol fermentation from stalk juice of sweet sorghum by immobilized Saccharomyces cerevisiae (CICC 1308). Bioresour. Technol. 2008, 99, 847–854. [Google Scholar] [CrossRef]
  48. Betiku, E.; Taiwo, A.E. Modeling and optimization of bioethanol production from breadfruit starch hydrolyzate vis-à-vis response surface methodology and artificial neural network. Renew. Energy 2015, 74, 87–94. [Google Scholar] [CrossRef]
  49. Tsafrakidou, P.; Manthos, G.; Zagklis, D.; Mema, J.; Kornaros, M. Assessment of substrate load and process pH for bioethanol production—Development of a kinetic model. Fuel 2022, 313, 123007. [Google Scholar] [CrossRef]
  50. Joginder, S.D.; Ashok, K.; Sunil, K.T. Bioethanol production from starchy part of tuberous plant (potato) using Sac-charomyces cerevisiae MTCC-170. Afr. J. Microbiol. Res. 2013, 7, 5253–5260. [Google Scholar] [CrossRef]
  51. Zhang, L.; Zhao, H.; Gan, M.; Jin, Y.; Gao, X.; Chen, Q.; Guan, J.; Wang, Z. Application of simultaneous saccharification and fermentation (SSF) from viscosity reducing of raw sweet potato for bioethanol production at laboratory, pilot and industrial scales. Bioresour. Technol. 2011, 102, 4573–4579. [Google Scholar] [CrossRef]
  52. Devi, A.; Bajar, S.; Kour, H.; Kothari, R.; Pant, D.; Singh, A. Lignocellulosic biomass valorization for bioethanol production: A circular bioeconomy approach. Bioenergy Res. 2022, 1–22. [Google Scholar] [CrossRef]
  53. Trejo, M.; Bhuyar, P.; Unpaprom, Y.; Dussadee, N.; Ramaraj, R. Advancement of fermentable sugars from fresh elephant ear plant weed for efficient bioethanol production. Environ. Dev. Sustain. 2022, 24, 7377–7387. [Google Scholar] [CrossRef] [PubMed]
Figure 1. Cellulosic fiber waste (A), after chemical treatments (B), and after autoclaving (C).
Fermentation 09 00176 g001
Scheme 1. The optimization conditions for waste treatment and bioethanol production.
Fermentation 09 00176 sch001
Figure 2. Screening of the optimum combined chemical and physical treatments resulted in the highest production of glucose units from cellulosic fiber wastes. F1, F2, F3, F4, F5, F6, and F7 are the treatments of 1% fiber waste using d.H2O, 20% HCl, 20% H2SO4, 20% H3PO4, 100% acetic acid, 5M NaOH, and 5M KOH, respectively.
Fermentation 09 00176 g002
Figure 3. Determination of the optimum HCl concentration that would result in the production of the highest glucose concentration liberated from cellulosic fiber wastes after autoclaving treatment. 1AF, 2AF, 3AF, 4AF, 5AF, 6AF, 7AF, and 8AF are 1% of the waste treated with 5, 10, 15, 20, 25, 30, 35, and 40% HCl, respectively.
Fermentation 09 00176 g003
Figure 4. Determination of the optimum cellulosic fiber waste concentration that results in the highest production of glucose units after treatment with 40% HCl, followed by autoclaving. 1AF, 2AF, 3AF, 4AF, 5AF, 6AF, 7AF, and 8AF are 0.2, 1, 2, 3, 4, 5, 6, and 7% of the cellulosic waste, respectively.
Fermentation 09 00176 g004
Figure 5. Determination of the optimum chemical/physical and enzymatic concentrations that resulted in the highest production of glucose from cellulosic fiber waste.
Fermentation 09 00176 g005
Figure 6. SEM micrographs of the treated and untreated cellulosic fiber waste, (A) untreated fiber waste at 200× magnification, (B) untreated fiber waste at 300× magnification, (C) treated fiber waste at 200× magnification, and (D) treated fiber waste at 300× magnification.
Fermentation 09 00176 g006
Figure 7. FTIR of cellulosic fiber waste; A: before hydrolysis and A1: after hydrolysis.
Fermentation 09 00176 g007
Figure 8. Microscopic examination of the three selected yeast isolates; (A): Ap1 isolate, (B): B2 isolate, and (C): G4 isolate.
Fermentation 09 00176 g008
Figure 9. Effect of different incubation temperatures on the production of bioethanol with G4 yeast isolate and the determination of the residual glucose concentrations.
Fermentation 09 00176 g009
Figure 10. Effect of different pH values on the production of bioethanol using G4 yeast isolate and the residual glucose concentrations.
Fermentation 09 00176 g010
Figure 11. Effect of inoculum size on the production of bioethanol using G4 yeast isolate and the residual glucose concentrations.
Fermentation 09 00176 g011
Figure 12. Phylogenetic tree of Starmerella bacillaris (STDF-G4) within the relative strains. The tree was constructed using the Maximum Likelihood tree method with bootstrap values for 500 replicates using the MEGA 11.0 program.
Fermentation 09 00176 g012
Figure 13. Batch fermentation profile for bioethanol production through locally isolated Starmerella bacillaris (STDF-G4) using cellulosic fiber waste in a bench-scale bioreactor.
Fermentation 09 00176 g013
Table 1. The concentration of bioethanol produced by Ap1, B2, and G4 yeast isolates after 72 h of anaerobic incubation in YPG broth.
SampleResidual Glucose Conc. (mg/mL)Bioethanol Conc. (mg/mL)
AP10.164.48
B20.384.23
G40.114.68
Table 2. The concentration of glucose and bioethanol concentration after 72 h of incubation of G4 yeast isolates with cellulosic fiber waste hydrolysate under aerobic and anaerobic conditions.
ConditionsResidual Glucose Conc. (mg/mL)Bioethanol Conc. (mg/mL)
Aerobic2.903.82
Anaerobic2.224.68
Disclaimer/Publisher’s Note: The statements, opinions and data contained in all publications are solely those of the individual author(s) and contributor(s) and not of MDPI and/or the editor(s). MDPI and/or the editor(s) disclaim responsibility for any injury to people or property resulting from any ideas, methods, instructions or products referred to in the content.

