Article

Valorisation through Lactic Fermentation of Industrial Wastewaters from a Bean Blanching Treatment

1
Department of Chemical Engineering, Materials, and Industrial Production, University of Naples Federico II, P. Tecchio 80, 80125 Naples, Italy
2
Department of Industrial Engineering, University of Niccolò Cusano, Via Don Carlo Gnocchi 3, 00166 Rome, Italy
3
I. T. P. Innovation and Technology Provider S.r.l., Via Bisignano a Chiaia 68, 80121 Naples, Italy
4
Heinz Innovation Center, Nieuwe Dukenburgseweg 19, 6534 AD Nijmegen Postbus 57, NL-6500 AB Nijmegen, The Netherlands
*
Author to whom correspondence should be addressed.
Fermentation 2023, 9(4), 350; https://doi.org/10.3390/fermentation9040350
Submission received: 24 February 2023 / Revised: 23 March 2023 / Accepted: 28 March 2023 / Published: 1 April 2023
(This article belongs to the Section Fermentation for Food and Beverages)

Abstract

:
In recent years, scientific research and industries have been focusing on the application of biological treatments aimed at imparting functional properties to waste products from food industries according to the principles on which the circular economy model is based, namely, the recovery, valorisation, and reuse of wastes. This work aimed at exploring the possibility of valorising waters from the blanching process of dried navy beans through lactic acid fermentation using Lacticaseibacillus paracasei CBA L74 as a starter. Two samples at different solid concentrations (0.75 °Bx and 1.25 °Bx) were fermented, and, in both cases, a bacterial load of 8 Logs and a lactic acid concentration of approximately 1.3 g/L were reached, despite the lack of nutrients. An unusual pH trend, characterised by an initial decrease and unexpected final rise, was observed during the fermentation of both samples: simultaneously, an increase in protein content was observed, suggesting that the proteolytic action of the microorganism could be responsible for the release of pH-increasing substances. In both cases, a slight increase in total polyphenols (approximately 23.3–33.72%) and flavonoids (approximately 42.3–52%) due to fermentation was observed, with a corresponding improvement in antioxidant capacity (approximately 25.32–37.72%). A significant increase in saponin concentration was determined for the most concentrated blanching water (from 2.87 ± 0.28 to 6.68 ± 0.69 mgOAE/mL), leading to an improvement in foaming properties and an enhanced capacity to produce stable emulsions. The obtained results confirmed the possibility of reducing water consumption from blanching operations, as well as finding valorisation opportunities for this side stream through a safe and inexpensive fermentation treatment.

Graphical Abstract

1. Introduction

Food and waste losses occurring at different stages of the food supply chain, such as production, handling, processing, and distribution, result in the inappropriate use of resources, such as water, energy, land, and other inputs [1]. The management and disposal of wastes produced during several industrial processes are strictly linked to a linear economy model, which is based on the logic of “make, take, and dispose”, tends to over-produce, and speeds up the product life cycle [2]. Basically, it only prioritises the production of goods to meet the community’s needs without focusing on the consequences linked to the end of their life cycle, such as the depletion of natural resources, environmental issues, climate change, ecosystem degradation [3], and additional costs that weigh on the economic balance of a company [4].
Thus, in recent years, a transition to a new business model of a circular economy has been taking place: a type of resilient economy that disconnects economic growth from material consumption [5] and combines care for the environment with the efforts of companies to improve their productivity and revenue. Recycling and reuse through energy and resource recovery are the major principles of a circular economy [6].
Food wastes are significant sources of polysaccharides, proteins, lipids, and phytochemicals with biological effects, such as vitamins, phenols, flavour compounds, carotenoids, and other pigments, which make them suitable raw materials for further treatments, such as extraction, thermochemical, or biological processes aimed at producing biofuel and bioenergy, nutraceutical functional ingredients, fertilisers, animal feeds, and environmental adsorbents [7,8,9,10,11].
Food processing industries, such as pulp and paper industries, sugar factories, dairies, olive mills, distilleries, vegetable and fruit canning, meat, and coffee processing plants, are the main consumers of high amounts of water and responsible for generating large volumes of waste effluents [12,13,14,15].
Since industrial wastewaters represent one of the largest contributors to environmental pollution and an enormous financial cost for companies in terms of management, treatment, and disposal [16], industry and research are moving in the same direction to find convenient technological solutions for valorising and reusing these waste effluents. Food wastewaters are characterised by high values of Biological and Chemical Oxygen Demand (BOD and COD, respectively), high concentrations of suspended and dissolved solids (oils, fats, and sugars), nitrogen, phosphorous, and minerals [17,18].
In recent years, biological treatments aimed at degrading organic matter [19] and pollutants [20] have been widely investigated.
In particular, COD removal rates above 65% were achieved by Diaz et al. [19] through both batch and continuous fungal treatments of liquid effluents from sewage sludge digestion. Yamashita and Yamamoto-Ikemoto [20] studied the denitrification of and phosphate removal from the effluent of a sewage treatment plant using bioreactors packed with different combinations of wood and iron.
Moreover, bioprocesses promoting the production of biohydrogen [21,22] and biomethane [23] as energy sources have been also studied.
In particular, anaerobic fermentation is commonly applied to dairy wastewaters generated in milk processing units [24].
Anaerobic digestion consists of a biological process in which organic material is degraded by microorganisms in the absence of oxygen [25] to produce biogas. Lactic acid bacteria can be used to increase the biomethane production yield through the production of substances, i.e., fatty acids, carbon dioxide, and peptides [26], occurring during the previous hydrolysis, acidogenesis, and acetogenesis phases. These compounds are involved in methanogenesis reactions, as reported by Juodeikiene et al. [27], who studied the potential of utilising Lactobacillus delbrueckii spp. bulgaricus to ferment dairy wastewaters before the methanogenesis phase. This resulted in an increase in the final methane production: a higher methane yield of 76% was reached by using a double-stage treatment (lactic fermentation followed by methanogenesis) compared to 38% obtained with a one-stage process carried out without adding any lactic acid bacteria.
Beyond energy and environmental applications, extensively explored in several scientific works, to the best of our knowledge, so far, few literature studies have investigated the possibility of using the lactic acid fermentation technique as a route to increase the contents of value-added compounds in food wastewaters, such as phenols, flavonoids, proteins, and organic molecules with functional properties and beneficial effects on human health.
It represents a safe and relatively inexpensive treatment due to the simple equipment, mild operating conditions, and non-hazardous microorganisms involved.
Soaking, cooking, and blanching are treatments commonly applied to legumes; they require high amounts of industrial waters, which tend to become rich in phenols, carbohydrates, proteins, and saponins during these processes.
For years, saponins have been commonly considered undesirable compounds in foods due to their toxicity and haemolytic activity. However, their health-promoting properties, such as the ability to lower cholesterol levels, blood lipids, and blood glucose response or to reduce the risk of cancer, and their antioxidant properties [28] have recently been studied [29].
They are surface-active compounds with wetting, emulsifying, and foaming properties due to their amphiphilic structure [30]. As reported by Damian et al. [31], their phytochemical composition and gelling ability suggest their potential application as a vegan-friendly egg-white replacement in meringue recipes.
This work aimed at exploring the possibility of valorising water coming from an industrial blanching plant, which implements the treatment of dried navy beans through a lactic fermentation process, in order to assess its suitability as a sustainable recovery and valorisation strategy for industrial effluents.
Compounds such as sugars, starch, and proteins may be released into the water during blanching in sufficient amounts to guarantee the sustenance, replication, and metabolism of the involved microorganism. On the other hand, their low concentrations could be responsible for triggering particular metabolic pathways, leading to the production of bioactive molecules of functional and technological interest.
The probiotic strain used as the starter culture was Lacticaseibacillus paracasei CBA L74; its ability to ferment cereal, fruit, and legume-based media [32,33,34,35,36,37,38,39] and the resulting biological effects [40,41,42] have been investigated in previous works.
Samples at different solid concentrations were tested, and the fermentation performance was studied in terms of bacterial growth, the pH trend, lactic acid production, proteins, glucose, and starch consumption. Moreover, the impact of fermentation on the phenol and saponin concentrations was evaluated, and the resulting functional properties of the fermented blanching water, such as the antioxidant activity and emulsifying and foaming capacities, were determined.

2. Materials and Methods

2.1. Strain and Feedstock

The microorganism used as the starter culture for the fermentation trials was Lacticaseibacillus paracasei (LP) CBA L74, patented and provided by Heinz Italia S.p.A. It was stored at −80 °C in cryovials with glycerol (20%) and reactivated through incubation at 37 °C for 24 h in 9 mL of an animal-free broth (20 g/L Bacto Yeast Extract, BD Biosciences; 0.5 g/L MgSO4, Sigma-Aldrich, St. Louis, MA, USA; 50 g/L Glucose, Sigma-Aldrich; 0.5 g/L citric acid, Sigma-Aldrich). The cell density in the inoculum broth was 108 CFU/mL. Two typologies of bean blanching water samples (RBW1 and RBW2) were provided by Kraft Heinz Company in sterile conditions. They were withdrawn from industrial blanchers at two different process times and characterised by different solid concentrations (Table 1).

2.2. Fermentation Apparatus

Fermentation tests were carried out using the laboratory apparatus described by Gallo et al. [34]. The system consisted of a batch reactor (20 cm high, 10 cm ID, 1.5 L) equipped with an external jacket for the circulation of a service fluid (water) from a thermostatically controlled water bath. The mixing system consisted of a stainless-steel rotating shaft mounted on the head plate and equipped with 2 Rushton turbines. It was connected to a motor that allowed the adjustment of the stirring speed to ensure the appropriate homogeneity of the medium during the process. The head plate was equipped with an input for the insertion of the In Pro 3100 probe (Mettler Toledo, Milan, Italy) connected to the M300 transmitter (Mettler Toledo, Milan, Italy), which is useful for inline temperature/pH measurements.

2.3. Experimental Procedure

One litre of each RBW sample was loaded into the bioreactor and brought to the operating temperature of 37 °C. The medium was inoculated (1% v/v), and fermentation was performed for 24 h, without pH control, by setting a stirring speed of 81 rpm. Fermented samples were withdrawn aseptically from the reactor at specific times (after the inoculum (t0) and after 2 h (t2), 4 h (t4), 6 h (t6), 8 h (t8), 14 h (t14), 16 h (t16), 18 h (t18), 20 h (t20), 22 h (t22), and 24 h (t24) of fermentation) for bacterial count, pH, lactic acid, and total protein determinations. Moreover, raw and fermented samples (RBW and FBW, respectively), collected before and after 24 h of the process, respectively, were characterised in terms of glucose and total starch concentrations, total polyphenol and flavonoid contents, total saponins, antioxidant activity, and emulsifying and foaming properties.

2.4. Analytical Methods

2.4.1. Bacterial Count and Organic Acid Determination

Serial dilutions and the spread plate method [43] on Petri plates filled with De Man, Rogosa, and Sharpe (MRS) agar (Oxoid, Basingstoke, UK) were performed for lactobacillus count.
MacConkey agar (Oxoid, Basingstoke, UK) and Gelatin Peptone Bios Agar (Biolife, Milan, Italy) were used to control the presence of microbial contaminants in the fermenting medium.
All plates were incubated at 37 °C for 48 h before reading. Anaerobic kits (Anaerogen Compact, Oxoid, Basingstoke, UK) were used for MRS plates to ensure anaerobic growth conditions for LP CBA L74 during the incubation period. The measured bacterial charge was expressed as CFU/mL, where CFU is colony-forming units.
Lactic acid production was monitored by high-performance liquid chromatography (HPLC) using an Agilent Technologies 1100 equipped with an Agilent Synergi Hydro-RP C18 column (250 mm × 4.6 mm and a pore size of 4 μm) with a visible/UV detector. The mobile phase consisted of a 0.27% KH2PO4 aqueous solution at pH = 2 modified with H3PO4 (eluent A) and 100% methanol (eluent B), using a gradient consisting of 30% B in 2.6 min followed by 100% A in 2.9 min with a flow rate of 1 mL/min.
The detection was set at 210 nm [39].

2.4.2. Total Protein Evaluation

Total proteins were estimated through the colorimetric Bradford method [44].
First, 0.25 mL of blanching water and 2.5 mL of Bradford reagent were mixed thoroughly, and, after 2 min, absorbances were read at a wavelength of 595 nm using a spectrophotometer. A blank solution was prepared using the same procedure by replacing the sample amount with deionised water.
Bovine serum albumin (BSA) was used as a reference substance to prepare aqueous solutions at known concentrations (0.01 ÷ 0.1 mg/mL) and build a calibration curve, which allowed the quantification of the protein amount as milligrams of BSA per mL of blanching water.

2.4.3. Total Starch and Glucose Estimation

Starch and glucose contents were determined using a Total Starch assay kit (AA/AMG) (Megazyme) and D-Glucose assay kit (GOPOD Format) (Megazyme), respectively, through spectrophotometric analysis at 510 nm.

2.4.4. Total Polyphenol and Flavonoid Determination

Total polyphenol content (TPC) was estimated using the Folin–Ciocalteu assay according to the procedure reported by Aikpokpodion and Dongo [45], with some modifications.
Briefly, 1 mL of the RBW or FBW sample was added to 0.3 mL of Folin–Ciocalteu reagent and 1 mL of a 7.5% (w/v) Na2CO3 solution, and a final volume of 10 mL was reached using deionised water.
The resulting solution was stirred, stored in the dark for 2 h, and then subjected to spectrophotometric analysis at a wavelength of 720 nm. Deionised water was used as a blank. TPC was expressed as milligrams of gallic acid equivalents (GAE) through a calibration curve prepared using aqueous solutions of gallic acid at known concentrations (0.004 ÷ 0.025 mg/mL).
The flavonoid concentration was determined by the aluminium chloride colorimetric method reported by Ismail et al. [46], with some modifications. A total of 5 mL of each sample was mixed with 0.5 mL of a 2% (w/v) AlCl3 solution, and a final volume of 10 mL was reached using a 70% v/v ethanol solution.
Total flavonoid content (TFC) was indicated as milligrams of quercetin equivalent (QE) through a calibration curve obtained using ethanol solutions at different quercetin concentrations (0.0015 ÷ 0.02 mg/mL).

2.4.5. Total Saponin Determination

Total saponin content (TSC) was determined using the vanillin-sulphuric acid assay described by Hiai et al. [47]. First, 0.5 mL of the RBW or FBW sample was mixed with 0.5 mL of an 8% w/v vanillin solution and 5 mL of a 72% v/v H2SO4 solution. The mixture was heated at 60 °C for 10 min and then cooled for 15 min. Absorbances were read using a spectrophotometer at 538 nm, using a solution prepared with vanillin, H2SO4, and deionised water in the proportions reported above as a blank. TSC was indicated as milligrams of oleanolic acid equivalents (OAE) through a calibration curve prepared with oleanolic acid solutions at known concentrations (0.1 ÷ 1 mg/mL).

2.4.6. Antioxidant Activity

The antioxidant properties of BW samples were evaluated by FRAP (ferric reducing antioxidant power) assay according to the procedure reported by Benzie and Devaki [48].
Briefly, 0.15 mL of each sample was added to 4.4 mL of FRAP reagent (300 mM acetate buffer at pH 3.6; 10 mM tripyridyl-triazine (TPTZ) in 40 mM HCl, and 20 mM FeCl3·6H2O in a ratio of 10:1:1), and a final volume of 5 mL was reached with deionised water. Absorbances were measured at 593 nm using a spectrophotometer. Antioxidant activity (AA) was evaluated by measuring the millimoles of Fe2+ ions into the reaction mixture, through a calibration curve prepared by performing the analysis previously described on FeSO4·H2O solutions at known concentrations (0.01 ÷ 0.15 mmol/L).
The ferric reducing power of each sample was expressed as millimoles of Trolox equivalents (TE) through a calibration curve generated using Trolox solutions at various concentrations (2.94 × 10⁻³ ÷ 2.94 × 10⁻² mmol/L).

2.4.7. Foaming Capacity (FC) and Foaming Stability (FS) Estimation

FC and FS were determined according to the method reported by Sai-Ut et al. [49].
Briefly, 2 g of each sample was weighed and added to 50 mL of distilled water in a 100 mL graduated cylinder. The suspension was mixed and shaken, and the total volume was recorded after 2 min and 30 min. FC and FS values were calculated according to Equations (1) and (2).
FC = V 2     V 0 V 0   × 100
FS = V 30   V 2   × 100
where V0, V2, and V30 indicate the volumes evaluated before whipping and after 2 min and 30 min, respectively.

2.4.8. Emulsifying Activity Index (EAI) and Emulsifying Stability Index (ESI) Determination

The emulsifying properties of RBW and FBW samples were evaluated by the method described by Cheung et al. [50] and originally developed by Pearce and Kinsella [51].
First, 5 mL of bean blanching water sample was mixed with 5 mL of deodorised sunflower oil and sonicated for 40 min. Then, 5 mL of 0.1% sodium dodecyl sulphate (SDS) was added to the solution and vortexed. EAI and ESI were calculated according to Equations (3) and (4).
EAI = 4.606 × Abs 0 × D ϕ × DM × 10 4
ESI = Abs 0 Abs 0 Abs 10 × t
where Abs0 and Abs10 are the absorbances read immediately after mixing and after 10 min, respectively; ϕ, D, and [DM] are the oil fraction, the dilution factor, and the solid concentration (g/mL), respectively, and t is a time interval of 10 min.

2.5. Statistical Analysis

Statistical analysis was performed using Microsoft Excel 2016®. Fermentation tests and analyses were performed in triplicate; mean values and standard deviations (n = 3) were calculated for each experimental dataset. Their statistical significance was evaluated by Student’s t-test, accepting only results with p < 0.05 as significant.

3. Results and Discussion

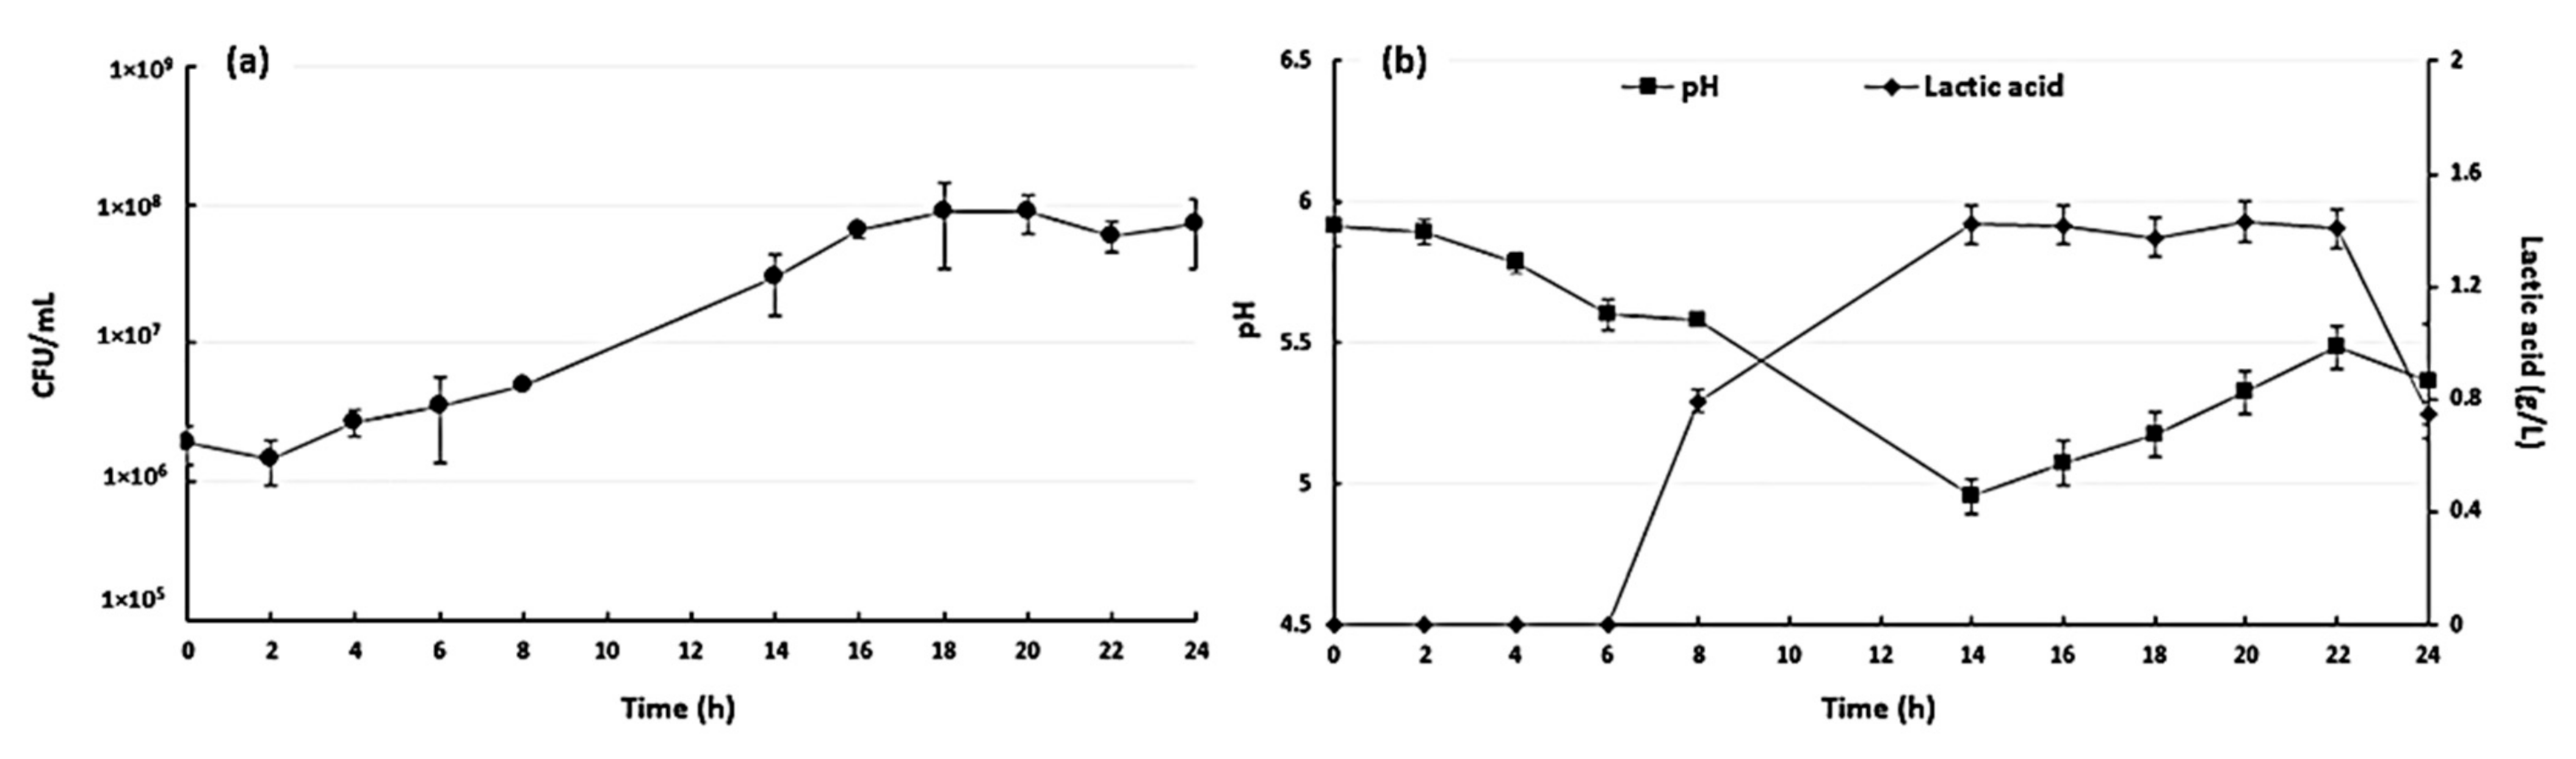
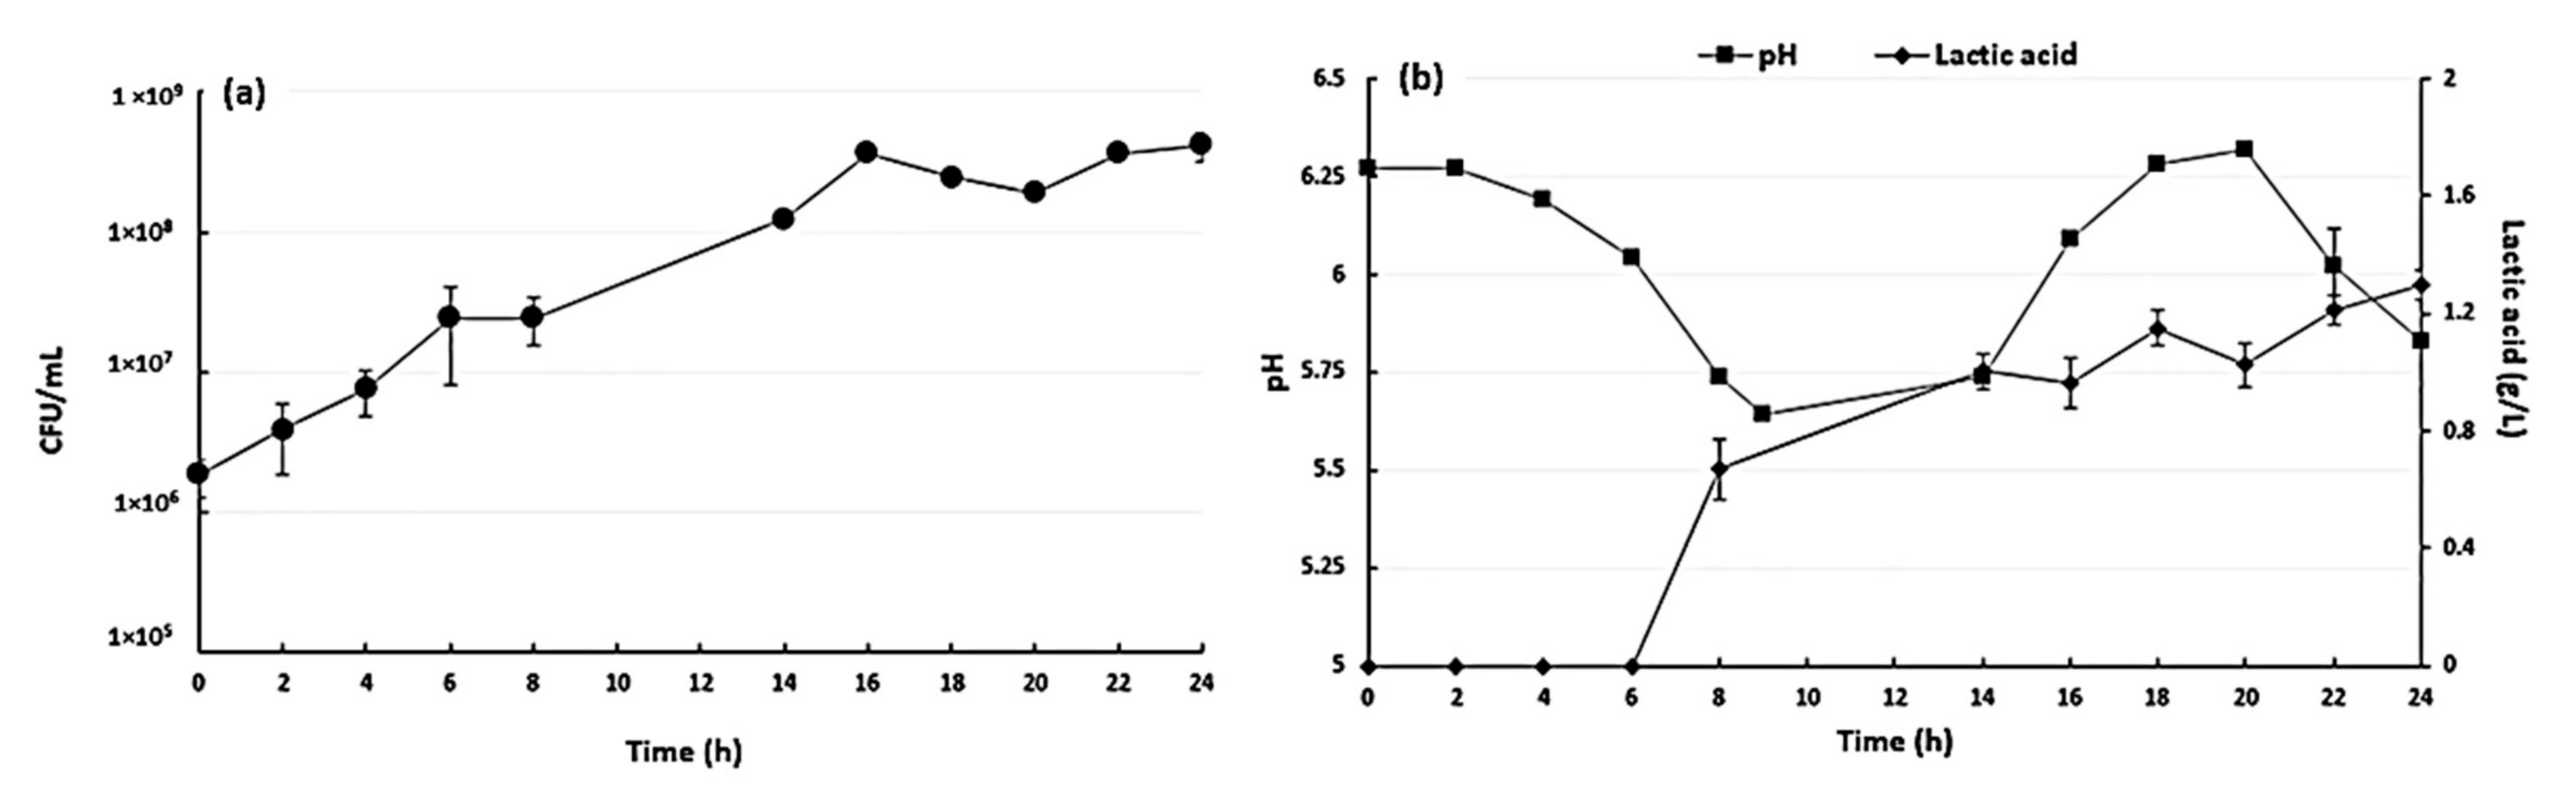
3.1. Fermentation Results

In Figure 1 and Figure 2, the bacterial growth, pH, and lactic acid concentration measured during the fermentation of BW1 and BW2 samples, respectively, are reported.
After a lag phase of approximately 6 h, the bacterial charge in BW1 increased from an initial value of 3.50 × 10⁶ ± 2.12 × 10⁵ CFU/mL to 6.50 × 10⁷ ± 7.07 × 10⁶ CFU/mL at time t16 and maintained an approximately constant value until the end of the process (Figure 1a).
Although the acclimatisation phase was very long, probably due to the differences in the nutrient composition between the inoculum broth and BW1, LP’s growth showed an exponential phase duration of 10 h, similar to that observed in Colucci Cante et al. [52], where a cooked navy bean suspension was fermented using the same microorganism. As shown in Figure 1b, the lactic acid concentration followed the same trend as bacterial growth: its production was detected after 6 h of the fermentation process, at the beginning of the exponential growth phase; moreover, a maximum concentration of 1.42 ± 0.06 g/L was reached after 14 h of fermentation and remained approximately constant during almost the entire growth stationary phase (t22).
The lactic acid production rate observed during BW1 fermentation reflected the trend reported in previous works, where a water suspension containing 10% solid navy beans was fermented using the same strain, and a slightly higher lactic acid content of 2 g/L was produced [37,52].
Furthermore, a slight but statistically significant decrease in lactic acid content was observed during the last 2 h of the BW1 fermentation process.
Probably, this final decrease could be attributed to the possible conversion/degradation of lactic acid occurring during the last phase of the process, when the fermenting water BW1 was further depleted of nutrients and the microorganism in stress conditions.
Lindgren et al. [53] studied the ability of Lactiplantibacillus plantarum to metabolise lactic acid anaerobically after prolonged incubation when glucose was absent from the medium. Moreover, several authors investigated the conversion of lactate to acetate in presence of O2, with and without producing H2O2, using L. plantarum [54,55].
As regards pH, it decreased from an initial value of 5.92 ± 0.07 to a minimum value of 4.92 ± 0.06 at time t14, simultaneously with the increase in lactic acid content.
Subsequently, pH showed an unusual rise to a final value of 5.36 ± 0.21 after 24 h of fermentation.
In Figure 2a, the bacterial growth occurring during the fermentation of the BW2 sample showed a shorter lag phase of 2 h than that observed in the BW1 growth curve (Figure 1a) due to its higher solid concentration and less marked differences in the nutrient composition with respect to the inoculum broth. Moreover, a maximum bacterial load of 3.50 × 10⁸ ± 2.12 × 10⁶ CFU/mL was reached after 16 h of the process and remained approximately constant until the end of the process.
As reported in Figure 2b, lactic acid started to be produced after 6 h of the process and reached a maximum concentration of approximately 1.29 g/L after 24 h; pH showed a decreasing trend from an initial value of 6.27 ± 0.01 to 5.65 ± 0.01 at time t8, corresponding to the lactic acid concentration increase.
As observed for BW1, an expected increase in the pH value occurred from time t8 to time t20 (6.22 ± 0.01); then, a new significant decrease was observed during the last 4 h, and a final value of 5.83 ± 0.01 was reached at time t24. In both BW1 and BW2 fermentations, the uncommon pH value trend was presumed to be linked to the possible proteolytic activity of the microorganism and/or the production of basic compounds that are able to increase pH and reverse its conventional tendency to decrease during the lactic fermentation process.
Figure 3 shows the concentration values of two main carbon sources for the microorganism, namely, glucose and total starch, and the total protein content, determined in both raw samples, RBW1 and RBW2, and 24 h fermented samples, FBW1 and FBW2.
In the BW1 sample, glucose content decreased from 0.41 ± 0.05 g/L to approximately 0.19 ± 0.07 g/L during fermentation, while total starch, initially present inside the water in low quantities (0.061 ± 0.03 g/L), showed a slight and statistically significant reduction after 24 h. The amylolytic properties of LP CBA L74 were already studied in previous experiments, where the ability of the microorganism to reduce a certain amount of total starch in the medium was shown [33,34,52].
As regards BW2, fermentation started with a higher glucose concentration of 2.25 ± 0.06 g/L, which was consumed until reaching a final value of 0.51 ± 0.05 g/L; total starch remained approximately constant throughout the process. Therefore, glucose was confirmed to be the preferred carbon source for the microorganism in both BW1 and BW2 fermentations.
Moreover, the greater glucose availability in BW2 allowed an improvement in the lactic acid production rate (Figure 2a) and prevented the lactic acid degradation hypothesised for BW1 during the last fermentation period.
As shown in Figure 3b, the initial total protein content in the substrate BW1 was 0.17 ± 0.04 g/L and significantly increased by 125.5% to 0.39 ± 0.05 g/L after 24 h of the process.
A higher protein concentration of 0.57 ± 0.08 g/L was instead determined in RBW2, and a less marked increase of approximately 25% was recorded after fermentation (to a final value of 0.71 ± 0.06 g/L in FBW2). Presumably, under stress conditions due to a nutrient deficiency inside both media, the microorganism was able to hydrolyse proteins: in both substrates, the formation of simple peptides or free amino acids led to an increase in protein units, to which the Coomassie brilliant blue dye used in the Bradford method could bind [56]. Specifically, a greater number of polypeptide units within the substrate resulted from the proteolytic process: they will be detected as a higher total protein content due to the presence of a greater number of exposed carboxyl and amino groups to which the Bradford reagent binds.
Several authors have studied the proteolytic activity of lactic acid bacteria, such as Lactobacillus lactis, Lactobacillus helveticus, Lacticaseibacillus rhamnosus, Lacticaseibacillus paracasei, Limosilactobacillus fermentum, Lactiplantibacillus plantarum, and Limosilactobacillus reuteri [57,58], owing to the presence of specific enzymes able to break polypeptide bonds and produce small peptides or even free amino acids [59,60].
Moreover, Emkani et al. [61] reported that the presence of organic acids, such as lactic acid, could promote protein hydrolysis through the disruption of ionic interactions between the protein side chains that stabilise their secondary structure. To investigate the reasons for the unusual rise in pH occurring during the last stages of the process in both blanching water samples, the total protein trend was evaluated throughout the entire process (Figure 4).
As reported in Figure 4a, the initial total protein content in RBW1 of 0.17 ± 0.04 g/L remained approximately constant during the first 16 h of the process; then, it increased to a maximum value of 0.43 ± 0.05 g/L at time t20, reflecting the rise in pH observed during the last hours of the process (Figure 4a). A similar trend was observed in the BW2 medium, where an increasing trend was recorded after 16–18 h of the process, corresponding to the rise in pH (Figure 4b). Protein breakage is probably responsible for metabolic pathways that lead to the production of pH-increasing substances, such as ammonia. Savino et al. [62] studied the ability of LAB species to degrade arginine via the arginine deiminase (ADI) pathway in apples, leading to ammonia formation and to an increase in pH.

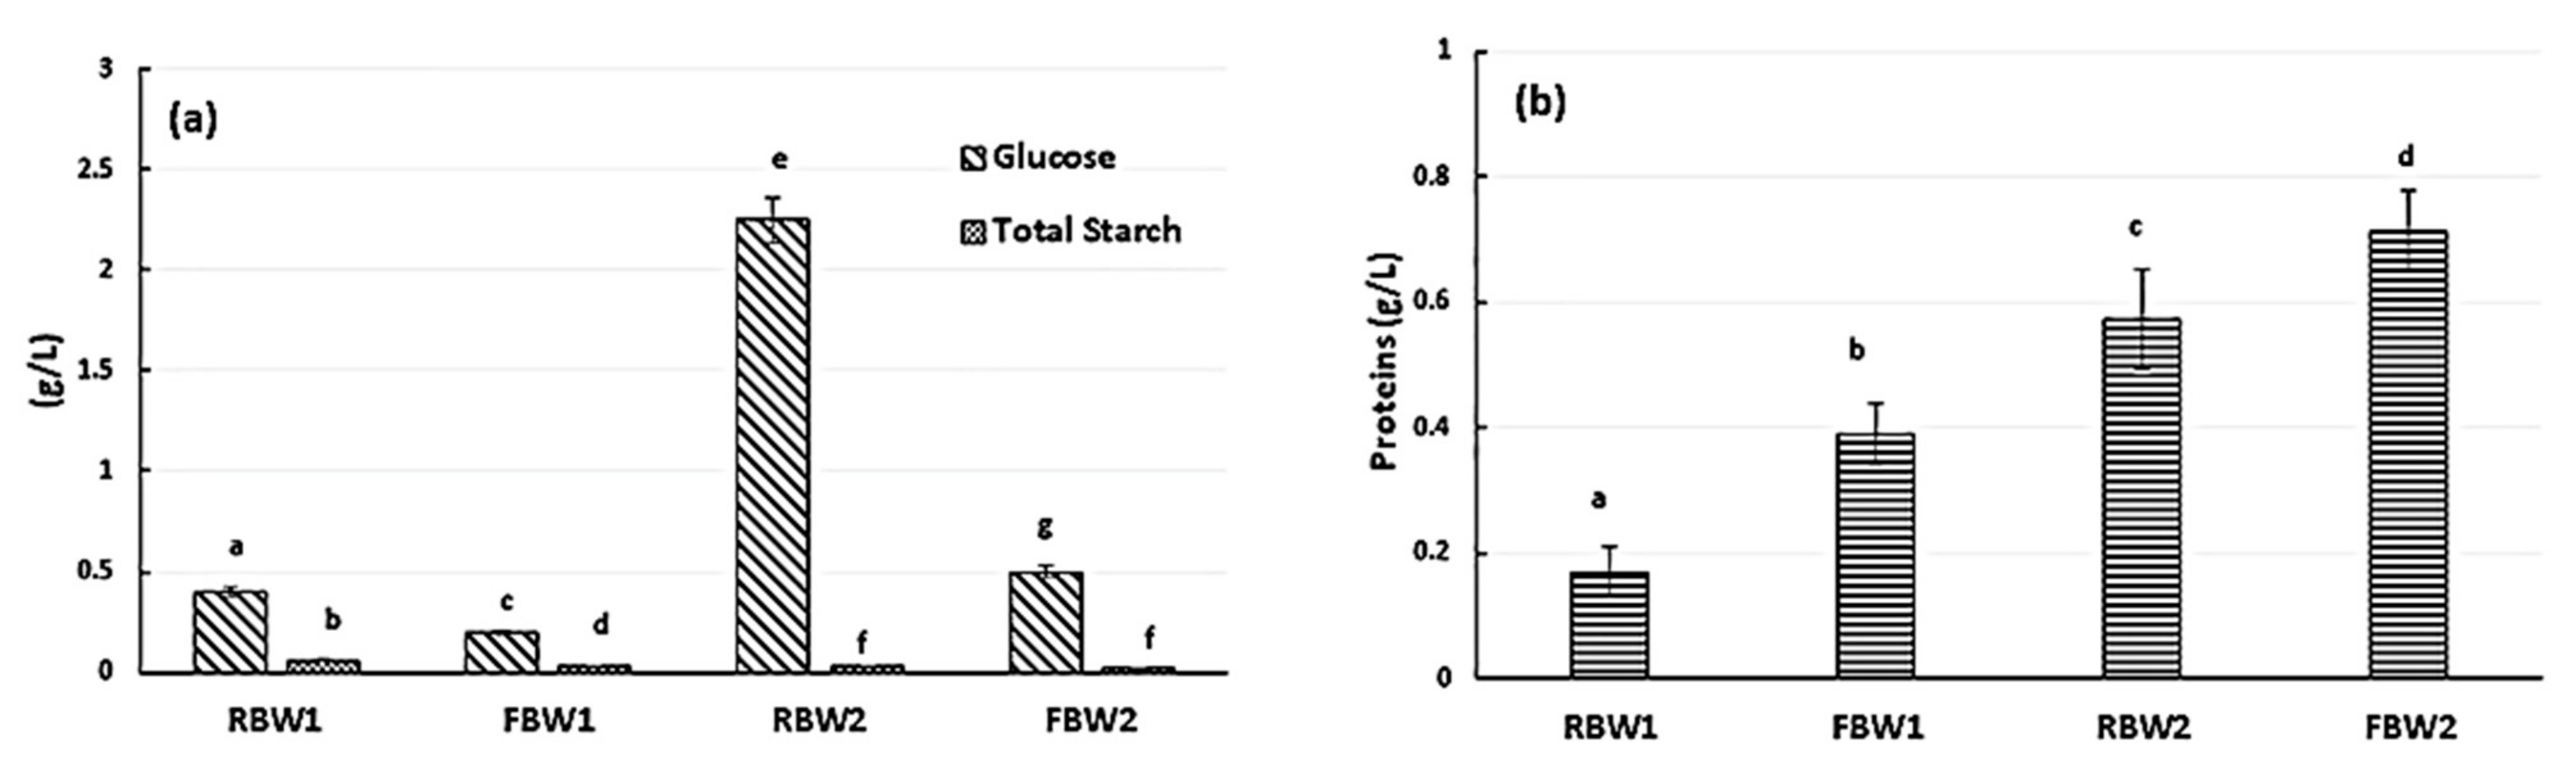
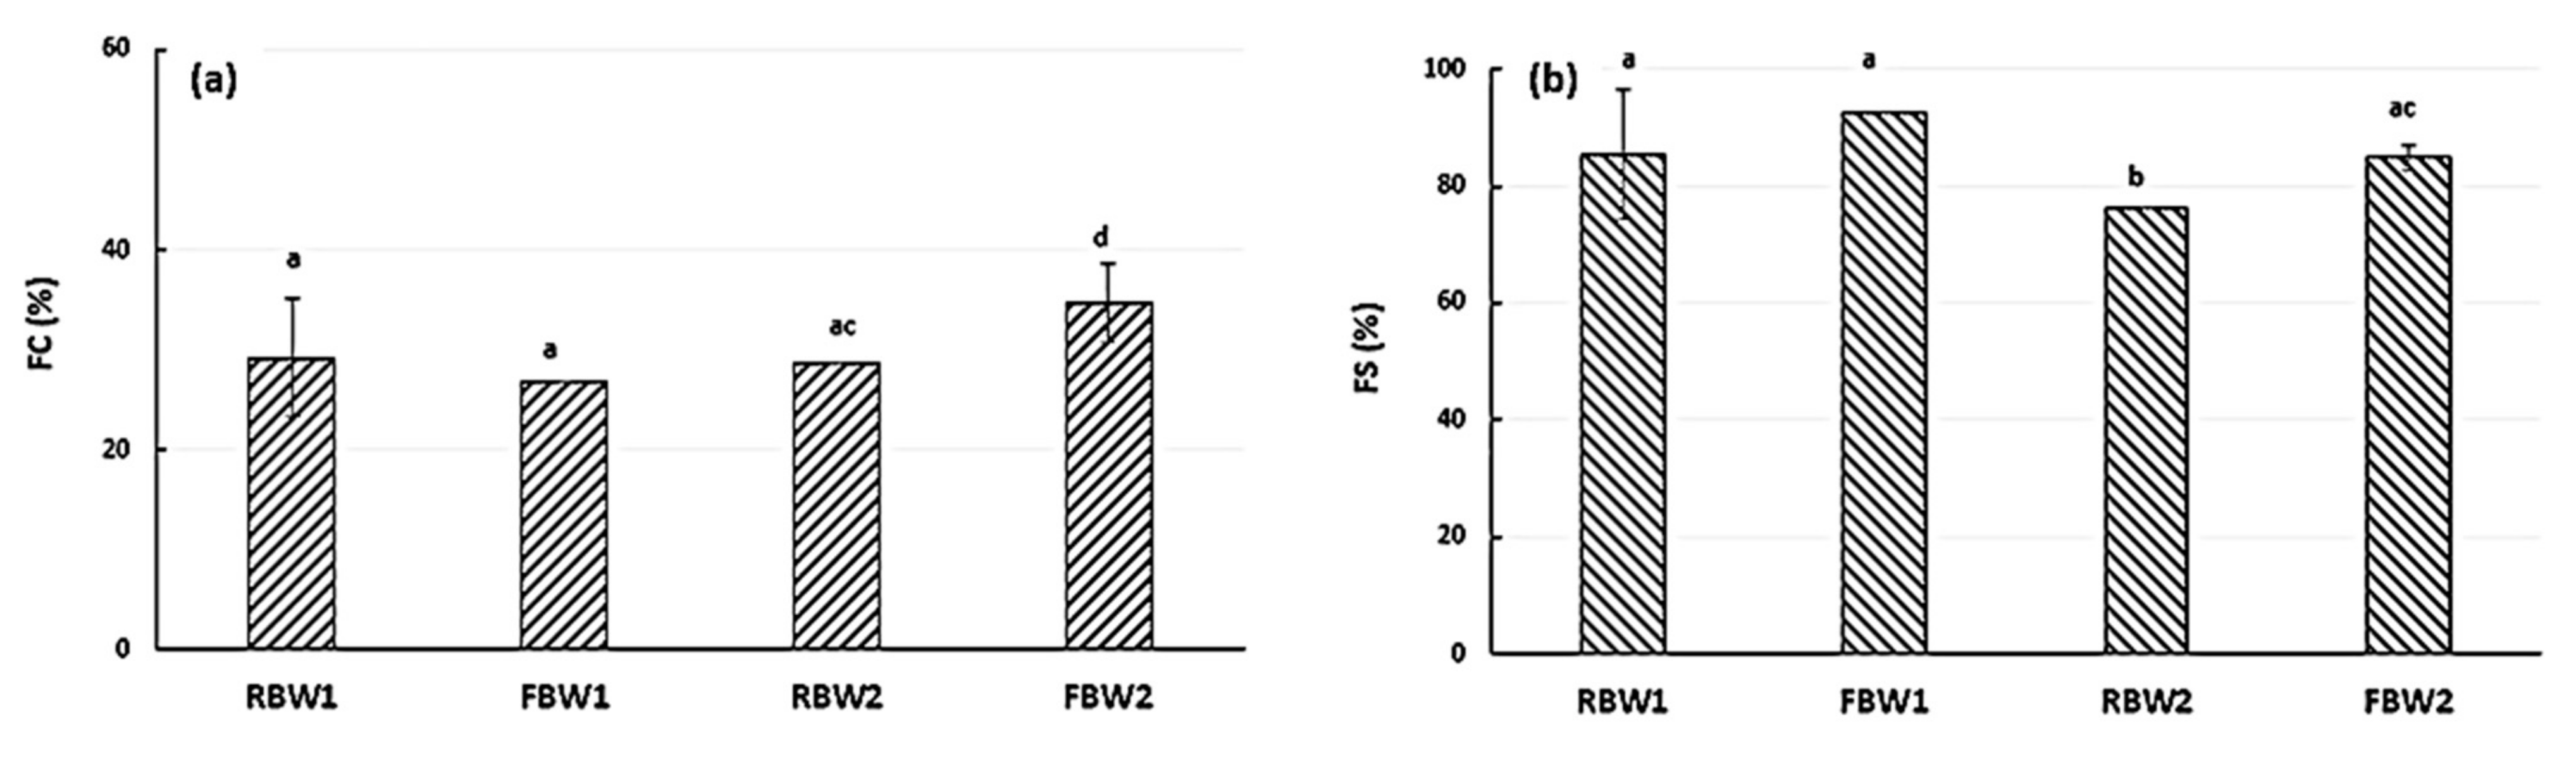
3.2. Functional Characterisation of Fermented Blanching Water

In Table 2, total polyphenol content, total flavonoid content, antioxidant activity, and total saponin content (TPC, TFC, AA, and TSC, respectively) determined in bean blanching water before and after fermentation are reported.
A slight but significant increase in total polyphenols (33.72% and 23.3% in BW1 and BW2, respectively) and flavonoids (approximately 42.3% and 52% in BW1 and BW2, respectively) due to fermentation was observed, and a corresponding increase in antioxidant capacity (approximately 25.32% and 37.72% in BW1 and BW2, respectively) was obtained. Polyphenols conjugated with organic acids or sugar groups or covalently bound to macromolecules, such as proteins and polysaccharides, could be enhanced by the enzymatic activity of microorganisms (e.g., amylases, xylanases, and glucosidases) and released in their free forms [63].
A marked increase in saponin content was recorded after 24 h of BW2 fermentation, while non-statistically significant differences were found between TSC values determined for RBW1 and FBW1.
Qian et al. [64] studied the impact of lactic fermentation on the reduction in Camellia oleifera saponins using saponin-degrading strains, such as Companilactobacillus crustorum and Bacillus subtilis, aimed at animal feed applications. Furthermore, several authors showed the β-glucosidase-producing capacity of some lactic acid bacteria (LAB), such as Lactiplantibacillus plantarum 1, Bifidobacterium infantis 14603, and Streptococcus thermophilus 14085, which allowed the splitting of the sugar side chains of steroid and triterpenoid saponins, lowering their water solubility and reducing their concentrations in fermented aqueous media [65,66]. Conversely, Dong et al. [67] reported an increase in phytochemical compounds, including polyphenols and saponins, during the fermentation of Ngoc Linh ginseng using Lactiplantibacillus plantarum (ATCC 8014). Moreover, Xu et al. [68] studied the optimal medium composition and culture conditions to promote extracellular truffle saponin production during a liquid fermentation by Tuber melanosporum. The presence of flavonoid compounds, such as rutin, turned out to be a good strategy to improve fungal saponin production.
In Figure 5, the foaming capacity and foaming stability evaluated in raw and fermented waters are reported.
A non-significant increase in the foaming capacity and stability was determined in the BW1 sample, while BW2 showed a statistically significant increase in both foaming properties, corresponding to the highest saponin values reached after 24 h of the process in BW2 (Table 1).
Fermentation is commonly associated with a reduction in foaming properties, as observed by Xing et al. [69] and Colucci Cante et al. [52], who reported foaming decreases of 50% and 21% respectively, during the fermentation of chickpea flour and cooked navy beans, respectively.
Proteins are the main components responsible for foam formation, since they favour the suspension of air bubbles, reduce their surface tension, and enhance foam stability; thus, partial proteolysis occurring during fermentation can reduce the foaming tendency [70].
However, in this work, the effect of the saponin increase was dominant, and enhanced foaming capacity and stability were observed in fermented BW2 samples due to the high interfacial activity of these natural surface-active molecules [71]. Emulsion capacity and stability indices in blanching water samples before and after 24 h of fermentation are shown in Figure 6.
Fermentation allowed an increase in emulsifying capacity of approximately 46% in FBW1, while no significant differences were found between emulsifying indices related to RBW2 and FBW2 samples, as reported in Figure 6a. Probably, the higher increase in protein content occurring during BW1 fermentation (Figure 4a) provided a greater tendency to produce emulsions than that observed in fermented BW2 samples. On the other hand, as seen in Figure 6b, a decrease in emulsifying stability was found for BW1, while the ESI in BW2 slightly increased after fermentation.
This increase could be attributed to a more marked increase in saponins during BW2 fermentation in comparison with that determined for BW1 (Table 2).
Huang et al. [72] studied the emulsifying activity of legume soaking water, such as haricot beans, garbanzo chickpeas, whole green lentils, split yellow peas, and yellow soybeans, which was associated with a high protein content and a high ratio of water-soluble carbohydrates to dry matter. Water-soluble carbohydrates released into legume soaking water likely consisted of oligosaccharides and soluble fibres; they exhibited great emulsifying activity, both alone and in combination with soy protein moieties [73,74]. Moreover, several authors, such as Damian et al. [31] and Jarzebski et al. [75], reported the ability of saponin-rich media, resulting from pulse cooking water or plant extracts, to stabilise emulsions owing to their amphiphilic nature and their high surface activities.
Clearly, it is possible to state that fermentation impacted the functional composition of blanching water, leading to a slight increase in antioxidant compounds, such as polyphenols, and molecules affecting the technological properties of the medium, such as saponins and soluble proteins, responsible for enhancing its emulsifying and foaming capacities.

3.3. Economic Considerations and Challenges

This study investigated the feasibility of functionalising blanching wastewaters using a biological treatment as a promising valorisation tool: it represents the preliminary attempt of companies to adhere to principles of sustainability and green engineering, on which the concept of the circular economy is focused. However, at the end of this exploratory phase, which regards the evaluation of the process potential, an accurate analysis of the economic convenience at larger scales should be conducted.
Although the research stage is still too preliminary to be able to draw economic conclusions, particular attention should be paid to some of the most crucial stages, such as the sterilisation operation before inoculum and possible downstream treatments.
The water samples supplied were already subjected to the blanching treatment: the number of process cycles and the time and temperature conditions applied during blanching already ensured a preliminary reduction in the native microbial charge of the medium.
Therefore, a very mild subsequent sterilisation treatment was needed before starting the fermentation. This could partially reduce expenses related to the necessary sterilisation of the medium. Moreover, possible downstream processes, such as the production of powders or liquid ingredients to be used in other formulations, will depend on the application sectors for which the fermented products may be intended and the extent of their functional potentialities, yet to be fully defined. The challenge will be to balance the significant costs involved with convenient opportunities to minimise waste disposal through their recovery and reintroduction into a new production cycle as materials with greater added value.

4. Conclusions

This work explored the valorisation of industrial wastewaters from a bean blanching treatment through a lactic fermentation process aimed at their potential reuse as sources of functional molecules in several industrial application fields. To the best of our knowledge, few studies in the literature have so far investigated the possibility of functionalising food wastewaters through lactic acid fermentation.
The fermentation process was carried out on two typologies of blanching water samples with different solid concentrations, BW1 and BW2 (0.75 °Bx and 1.25 °Bx, respectively), using Lacticaseibacillus paracasei CBA L74 as a starter, to evaluate the impact of different nutrient contents on microorganism growth and its metabolic activity.
Although lactobacillus existed in a medium lacking in nutrients, cell loads of 6.50 × 10⁷ ± 7.07 × 10⁶ CFU/mL and 3.50 × 10⁸ ± 2.12 × 10⁶ CFU/mL were reached after 24 h of the process in BW1 and BW2 samples, respectively, and a similar final lactic acid production of approximately 1.30 g/L was observed in both cases. The proteolytic activity of the microorganism was confirmed by an increasing trend in total protein during the process, which led to uncommon pH behaviour characterised by an initial decrease and unexpected rise during the last fermentation period. This trend could be due to metabolic pathways leading to the production of pH-increasing substances, such as ammonia, that occurred during fermentation. Moreover, a slight enrichment in antioxidant molecules due to fermentation was shown in terms of polyphenols and flavonoids, with subsequent increases in antioxidant capacity of approximately 25% and 38% in BW1 and BW2, respectively.
The most significant effect of fermentation was noted on the total saponin content in the bean blanching water sample characterised by the highest solid concentration (BW2), which was responsible for an improvement in foaming and emulsifying properties.
Ultimately, the results of this study demonstrate the possibility of the valorisation of industrial waters through a safe and relatively inexpensive biological treatment, enhancing the functional and technological properties of proteins, polysaccharides, and phytochemicals typically present in legumes and released during blanching.
Future developments of this work will consist of thoroughly investigating the potential of fermented bean blanching water by further optimising the process parameters and the resulting functional effects; moreover, a further challenge will be to implement a subsequent drying process to obtain a pro- or postbiotic powder ingredient with antioxidant, emulsifying, and foaming properties to be used in food and cosmetic applications.

Author Contributions

Conceptualisation, R.N., A.L.B. and R.C.C.; methodology, R.N. and R.C.C.; validation, R.C.C., A.R., T.P. and R.N.; investigation, R.C.C., A.R., T.P., F.N. and F.P.; formal analysis, R.C.C., F.N., F.P., M.G. and G.L.; visualisation, R.C.C., A.R., T.P. and F.N.; data curation, R.C.C., F.N., F.P., M.G. and G.L.; writing—original draft, R.C.C.; writing—review and editing, R.C.C., F.N., F.P., M.G., G.L. and R.N.; supervision, R.C.C., A.L.B. and R.N.; project administration, A.L.B. and R.N. All authors have read and agreed to the published version of the manuscript.

Funding

This research received no external funding.

Institutional Review Board Statement

Not applicable.

Informed Consent Statement

Not applicable.

Data Availability Statement

Not applicable.

Conflicts of Interest

The authors declare no conflict of interest.

References

  1. FAO. Global Food Losses and Food Waste. Extent, Causes, and Prevention; Food and Agricultural Organisation of the United Nations: Rome, Italy, 2011. [Google Scholar]
  2. Lobova, S.V.; Tyryshkin, V.V. Is It Possible to Change to a Circular Economy Based on Waste Recycling? An Overview of the Situation, Opportunities, and Barriers for the Altai Krai. IOP Conf. Ser. Earth Environ. Sci. 2021, 670, 012060. [Google Scholar] [CrossRef]
  3. Radu, V.M.; Chiriac, M.; Deak, G.; Pipirigeanu, M.; Izhar, T.N.T. Strategic actions for packaging waste management and reduction. IOP Conf. Ser. Earth Environ. Sci. 2020, 616, 012019. [Google Scholar] [CrossRef]
  4. Sariatli, F. Linear Economy Versus Circular Economy: A Comparative and Analyzer Study for Optimization of Economy for Sustainability. J. Econ. Sustain. Dev. 2017, 6, 31–34. [Google Scholar] [CrossRef] [Green Version]
  5. Kennedy, S.; Linnenluecke, M. Circular economy and resilience: A research agenda Circular economy and resilience: A research agenda. Bus. Strategy Environ. 2022, 31, 2754–2765. [Google Scholar] [CrossRef]
  6. Narasimmalu, A.; Ramasamy, R. Food Processing Industry Waste and Circular Economy. IOP Conf. Ser. Mater. Sci. Eng. 2020, 955, 012089. [Google Scholar] [CrossRef]
  7. Tropea, A. Food Waste Valorisation. Fermentation 2022, 8, 168. [Google Scholar] [CrossRef]
  8. Kim, S.; Lee, Y.; Lin, K.Y.; Hong, E.; Kwon, E.; Lee, J. The Valorisation of Food Waste via Pyrolysis: A Review. J. Clean. Prod. 2020, 259, 120816. [Google Scholar] [CrossRef]
  9. Baiano, A. Recovery of biomolecules from food wastes—A review. Molecules 2014, 19, 14821–14842. [Google Scholar] [CrossRef] [Green Version]
  10. Colucci Cante, R.; Prisco, I.; Garella, I.; Gallo, M.; Nigro, R. Extracting the lipid fraction from waste bilberry seeds with a hydrofluorocarbon solvent. Chem. Eng. Res. Des. 2020, 157, 174–181. [Google Scholar] [CrossRef]
  11. Colucci Cante, R.; Gallo, M.; Varriale, L.; Garella, I.; Nigro, R. Recovery of Carotenoids from Tomato Pomace Using a Hydrofluorocarbon Solvent in Sub-Critical Condition. Appl. Sci. 2022, 12, 2822. [Google Scholar] [CrossRef]
  12. Fia, R.L.; Matos, A.T.; Borges, A.C.; Fia, R.; Cecon, P.R. Treatment of wastewater from coffee bean processing in anaerobic fixed bed reactors with different support materials: Performance and kinetic modeling. J. Environ. Manag. 2012, 108, 14–21. [Google Scholar] [CrossRef]
  13. Ganesh, R.; Rajagopal, R.; Torrijos, M.; Thanikal, J.M.; Ramanujam, R. Anaerobic treatment of winery wastewater in fixed bed reactors. Bioprocess Biosyst. Eng. 2010, 33, 619–628. [Google Scholar] [CrossRef] [PubMed]
  14. Meksi, N.; Haddar, W.; Hammami, S.; Mhenni, M.F. Olive mill wastewater: A potential source of natural dyes for textile dyeing. Ind. Crops Prod. 2012, 40, 103–109. [Google Scholar] [CrossRef]
  15. Rajagopal, R.; Saady, N.M.C.; Torrijos, M.; Thanikal, J.V.; Hung, Y.-T. Sustainable Agro-Food Industrial Wastewater Treatment Using High-Rate Anaerobic Process. Water 2013, 5, 292–311. [Google Scholar] [CrossRef] [Green Version]
  16. Agyei, D.; Shanbhag, B.K.; He, L. Enzymes for food waste remediation and valorisation. In Improving and Tailoring Enzymes for Food Quality and Functionality; Yada, R.Y., Ed.; Elsevier: Cambridge, UK, 2015; pp. 123–145. [Google Scholar] [CrossRef]
  17. Abdallh, M.N.; Abdelhalim, W.S.; Abdelhalim, H.S. Industrial wastewater treatment of food industry using best techniques. Int. J. Eng. Sci. Invent. 2016, 5, 15–28. [Google Scholar]
  18. Tekerlekopoulou, A.G.; Economou, C.N.; Tatoulis, T.I. Wastewater treatment and water reuse in the food industry. In The Interaction of Food Industry and Environment; Academic Press: Cambridge, MA, USA, 2020; pp. 245–280. [Google Scholar]
  19. Díaz, A.I.; Laca, A.; Díaz, M. Fungal treatment of an effluent from sewage sludge digestion to remove recalcitrant organic matter. Biochem. Eng. J. 2021, 172, 108056. [Google Scholar] [CrossRef]
  20. Yamashita, T.; Yamamoto-Ikemoto, R. Nitrogen and phosphorus removal from wastewater treatment plant effluent via bacterial sulfate reduction in an anoxic bioreactor packed with wood and iron. Int. J. Environ. Res. Public Health 2014, 11, 9835–9853. [Google Scholar] [CrossRef] [Green Version]
  21. Kumar, G.; Shobana, S.; Nagarajan, D.; Lee, D.J.; Lee, K.S.; Lin, C.Y.; Chen, C.Y.; Chang, J.S. Biomass based hydrogen production by dark fermentation—Recent trends and opportunities for greener processes. Curr. Opin. Biotechnol. 2018, 50, 136–145. [Google Scholar] [CrossRef]
  22. Mota, V.T.; Ferraz-Júnior, A.D.N.; Trably, E.; Zaiat., M. Biohydrogen production at pH below 3.0: Is it possible? Water Res. 2018, 128, 350–361. [Google Scholar] [CrossRef] [PubMed] [Green Version]
  23. Han, M.; Behera, S.; Park, H. Anaerobic co-digestion of food waste leachate and piggery wastewater for methane production: Statistical optimization of key process parameters. J. Chem. Technol. Biotechnol. 2012, 87, 1541–1550. [Google Scholar] [CrossRef]
  24. Usmani, Z.; Sharma, M.; Gaffey, J.; Sharma, M.; Dewhurst, R.J.; Moreau, B.; Newbold, J.; Clark, W.; Thakur, V.K.; Gupta, V.K. Valorization of dairy waste and by-products through microbial bioprocesses. Bioresour Technol. 2022, 346, 126444. [Google Scholar] [CrossRef] [PubMed]
  25. Rodriguez Chiang, L.M. Methane Potential of Sewage Sludge to Increase Biogas Production. Master’s Thesis, Royal Institute of Technology (KTH), Stockholm, Sweden, 2011. [Google Scholar]
  26. Cintas, L.M.; Casaus, M.P.; Herranz, C.; Nes, I.F.; Hernández, P.E. Review: Bacteriocins of Lactic Acid Bacteria. Food Sci. Technol. 2001, 7, 281–305. [Google Scholar] [CrossRef]
  27. Juodeikiene, G.; Cizeikiene, D.; Glasner, C.; Bartkiene, E.; Dikiy, A.; Shumilina, E.; Ilić, N.; Di Berardino, S.; Foncesa, C. Evaluation of the potential of utilizing lactic acid bacteria and dairy wastewaters for methane production. Energy Explor. Exploit. 2017, 35, 388–402. [Google Scholar] [CrossRef] [Green Version]
  28. Barakat, H.; Reim, V.; Rohn, S. Stability of saponins from chickpea, soy, and faba beans in vegetarian, broccoli-based bars subjected to different cooking techniques. Food Res. Int. 2015, 76, 142–149. [Google Scholar] [CrossRef]
  29. Singh, B.; Singh, J.P.; Singh, N.; Kaur, A. Saponins in pulses and their health promoting activities: A review. Food Chem. 2017, 233, 540–549. [Google Scholar] [CrossRef]
  30. Güçlü-Üstündağ, Ö.; Mazza, G. Saponins: Properties, applications, and processing. Crit. Rev. Food Sci. 2007, 47, 231–258. [Google Scholar] [CrossRef]
  31. Damian, J.J.; Huo, S.; Serventi, L. Phytochemical content and emulsifying ability of pulses cooking water. Eur. Food Res. Technol. 2018, 244, 1647–1655. [Google Scholar] [CrossRef]
  32. Salameh, D.; Nigro, F.; Colucci Cante, R.; Passannanti, F.; Gallo, M.; Budelli, A.; Marzocchella, A.; Nigro, R. Fermentation of Rice Flour Supernatant Using Lactobacillus Paracasei Cba L74. Chem. Eng. Trans. 2019, 75, 289–294. [Google Scholar] [CrossRef]
  33. Gallo, M.; Passannanti, P.; Colucci Cante, R.; Nigro, F.; Schiattarella, P.; Zappulla, S.; Budelli, A.; Nigro, R. Lactic fermentation of cereals aqueous mixture of oat and rice flours with and without glucose addition. Heliyon 2020, 6, e04920. [Google Scholar] [CrossRef]
  34. Gallo, M.; Passannanti, F.; Colucci Cante, R.; Nigro, F.; Salameh, D.; Schiattarella, P.; Schioppa, C.; Budelli, A.; Nigro, R. Effect of the glucose addition during lactic fermentation of rice, oat, and wheat flours. Appl. Food Biotechnol. 2020, 7, 21–30. [Google Scholar] [CrossRef]
  35. Gallo, M.; Passannanti, F.; Schiattarella, P.; Esposito, A.; Colucci Cante, R.; Nigro, F.; Budelli, A.; Nigro, R. Banana Puree Lactic Fermentation: The Role of Ripeness, Heat Treatment, and Ascorbic Acid. Appl. Sci. 2021, 11, 5153. [Google Scholar] [CrossRef]
  36. Gallo, M.; Passannanti, F.; Schioppa, C.; Montella, S.; Colucci Cante, R.; Nigro, F.; Budelli, A.; Nigro, R. Enzymatic pre-treatment and lactic fermentation of wheat flour suspension at a high solid content. J. Food Process. Preserv. 2021, 45, e15299. [Google Scholar] [CrossRef]
  37. Colucci Cante, R.; Gallo, M.; Nigro, F.; Passannanti, F.; Salameh, D.; Budelli, A.; Nigro, R. Lactic fermentation of cooked navy beans by Lactobacillus paracasei CBA L74 aimed at a potential production of functional legume-based foods. Can. J. Chem. Eng. 2020, 98, 1955–1961. [Google Scholar] [CrossRef]
  38. Colucci Cante, R.; Gallo, M.; Nigro, F.; Passannanti, F.; Budelli, A.; Nigro, R. Mathematical modelling of Lactobacillus paracasei CBA L74 growth during rice flour fermentation performed with and without pH control. Appl. Sci. 2021, 11, 2921. [Google Scholar] [CrossRef]
  39. Lentini, G.; Nigro, F.; Colucci Cante, R.; Passannanti, F.; Gallo, M.; Budelli, A.L.; Nigro, R. Functional Properties of an Oat-Based Postbiotic Aimed at a Potential Cosmetic Formulation. Fermentation 2022, 8, 632. [Google Scholar] [CrossRef]
  40. Gallo, M.; Nigro, F.; Passannanti, F.; Nanayakkara, M.; Lania, G.; Parisi, F.; Salameh, D.; Budelli, A.; Barone, M.V.; Nigro, R. Effect of pH control during rice fermentation in preventing a gliadin P31-43 entrance in epithelial cells. Int. J. Food Sci. Nutr. 2019, 70, 950–958. [Google Scholar] [CrossRef]
  41. Labruna, G.; Nanayakkara, M.; Pagliuca, C.; Nunziato, M.; Iaffaldano, L.; D’Argenio, V.; Colicchio, R.; Budelli, A.L.; Nigro, R.; Salvatore, P.; et al. Celiac disease-associated Neisseria flavescens decreases mitochondrial respiration in CaCo-2 epithelial cells: Impact of Lactobacillus paracasei CBA L74 on bacterial-induced cellular imbalance. Cell Microbiol. 2019, 21, e13035. [Google Scholar] [CrossRef] [Green Version]
  42. Sarno, M.; Lania, G.; Cuomo, M.; Nigro, F.; Passannanti, F.; Budelli, A.; Fasano, F.; Troncone, R.; Auricchio, S.; Barone, M.V.; et al. Lactobacillus paracasei CBA L74 interferes with gliadin peptides entrance in Caco-2 cells. Int. J. Food Sci. 2014, 65, 953–959. [Google Scholar] [CrossRef]
  43. Sanders, E.R. Aseptic laboratory techniques: Plating methods. J. Vis. Exp. 2012, 63, e3064. [Google Scholar] [CrossRef]
  44. Bradford, M.M. A rapid and sensitive method for the quantitation of microgram quantities of protein utilizing the principle of protein-dye binding. Anal. Biochem. 1976, 72, 248–254. [Google Scholar] [CrossRef]
  45. Aikpokpodion, P.E.; Dongo, L.N. Effects of fermentation intensity on polyphenols and antioxidant capacity of cocoa beans. Int. J. Sustain. Agric. Res. 2010, 5, 66–70. [Google Scholar]
  46. Ismail, H.F.; Hashim, Z.; Soon, W.T.; Rahman, N.S.A.; Zainudin, A.N.; Majid, F.A.A. Comparative study of herbal plants on the phenolic and flavonoid content, antioxidant activities and toxicity on cells and zebrafish embryo. J. Tradit. Complement. Med. 2017, 7, 452–465. [Google Scholar] [CrossRef] [PubMed]
  47. Hiai, S.; Oura, H.; Nakajima, T. Color reaction of some sapogenins and saponins with vanillin and sulfuric acid. Planta Med. 1976, 29, 116–122. [Google Scholar] [CrossRef] [PubMed]
  48. Benzie, I.F.; Devaki, M. The ferric reducing/antioxidant power (FRAP) assay for non-enzymatic antioxidant capacity: Concepts, procedures, limitations, and applications. In Measurement of Antioxidant Activity & Capacity; Apak, R., Capanoglu, E., Shahidi, F., Eds.; Wiley Online Library: Hoboken, NJ, USA, 2018; pp. 77–106. [Google Scholar] [CrossRef]
  49. Sai-Ut, S.; Ketnawa, S.; Chaiwut, P.; Rawdkuen, S. Biochemical and functional properties of protein from red kidney, navy, and adzuki beans. Asian J. Food Agro-Ind. 2009, 2, 493–504. [Google Scholar]
  50. Cheung, L.; Wanasundara, J.; Nickerson, M.T. The effect of pH and NaCl levels on the physicochemical and emulsifying properties of a cruciferin protein isolate. Food Biophys. 2014, 9, 105–113. [Google Scholar] [CrossRef]
  51. Pearce, K.N.; Kinsella, J.E. Emulsifying properties of proteins: “Evaluation of a turbidimetric technique. J. Agric. Food Chem. 1978, 26, 16–723. [Google Scholar] [CrossRef]
  52. Colucci Cante, R.; Gallo, M.; Nigro, F.; Vitelli, C.; Passannanti, F.; Budelli, A.L.; Nigro, R. Optimization of Mixing Conditions for Improving Lactobacillus Paracasei Cba L74′ S Growth During Lactic Fermentation of Cooked Navy Beans and Functional Characterization of the Fermented Products. Chem. Eng. Trans. 2022, 93, 313–318. [Google Scholar] [CrossRef]
  53. Lindgren, S.E.; Axelsson, L.T.; McFeeters, R.F. Anaerobic L-lactate degradation by Lactobacillus plantarum. FEMS Microbiol. Lett. 1990, 66, 209–213. [Google Scholar] [CrossRef]
  54. Lorquet, F.; Goffin, P.; Muscariello, L.; Baudry, J.B.; Ladero, V.; Sacco, M.; Kleerebezem, M.; Hols, P. Characterization and functional analysis of the poxB gene, which encodes pyruvate oxidase in Lactobacillus plantarum. J. Bacteriol. 2004, 186, 3749–3759. [Google Scholar] [CrossRef] [Green Version]
  55. Quatravaux, S.; Remize, F.; Bryckaert, E.; Colavizza, D.; Guzzo, J. Examination of Lactobacillus plantarum lactate metabolism side effects in relation to the modulation of aeration parameters. J. Appl. Microbiol. 2006, 101, 903–912. [Google Scholar] [CrossRef]
  56. Nouroozi, R.V.; Noroozi, M.V.; Ahmadizadeh, M. Determination of protein concentration using Bradford microplate protein quantification assay. Dis. Diagn. 2015, 4, 11–17. [Google Scholar] [CrossRef] [Green Version]
  57. Aguirre, L.; Garro, M.S.; De Giori, G.S. Enzymatic hydrolysis of soybean protein using lactic acid bacteria. Food Chem. 2008, 111, 976–982. [Google Scholar] [CrossRef]
  58. García-Cano, I.; Rocha-Mendoza, D.; Ortega-Anaya, J.; Wang, K.; Kosmerl, E.; Jiménez-Flores, R. Lactic acid bacteria isolated from dairy products as potential producers of lipolytic, proteolytic and antibacterial proteins. Appl. Microbiol. Biotechnol. 2019, 103, 5243–5257. [Google Scholar] [CrossRef] [PubMed] [Green Version]
  59. Klupsaite, D.; Juodeikiene, G.; Zadeike, D.; Bartkiene, E.; Maknickiene, Z.; Liutkute, G. The influence of lactic acid fermentation on functional properties of narrow-leaved lupine protein as functional additive for higher value wheat bread. LWT—Food Sci. Technol. 2017, 75, 180–186. [Google Scholar] [CrossRef]
  60. Ren, Y.; Li, L. Effects of extracellular proteases and its inhibitors on the gel characteristics of soy protein induced by lactic acid bacteria. Int. J. Food Sci. Technol. 2022, 57, 1587–1597. [Google Scholar] [CrossRef]
  61. Emkani, M.; Oliete, B.; Saurel, R. Effect of Lactic Acid Fermentation on Legume Protein Properties, a Review. Fermentation 2022, 8, 244. [Google Scholar] [CrossRef]
  62. Savino, M.J.; Sánchez, L.A.; Saguir, F.M.; de Nadra, M.C. Lactic acid bacteria isolated from apples are able to catabolise arginine. World J. Microbiol. Biotechnol. 2012, 28, 1003–1012. [Google Scholar] [CrossRef]
  63. Espinosa-Páez, E.; Alanis-Guzmán, M.G.; Hernández-Luna, C.E.; Báez-González, J.G.; Amaya-Guerra, C.A.; Andrés-Grau, A.M. Increasing antioxidant activity and protein digestibility in Phaseolus vulgaris and avena sativa by fermentation with the Pleurotusostreatus fungus. Molecules 2017, 22, 2275. [Google Scholar] [CrossRef] [Green Version]
  64. Qian, B.; Yin, L.; Yao, X.; Zhong, Y.; Gui, J.; Lu, F.; Zhang, F.; Zhang, J. Effects of fermentation on the haemolytic activity and degradation of Camellia oleifera saponins by Lactobacillus crustorum and Bacillus subtilis. FEMS Microbiol. Lett. 2018, 365, fny014. [Google Scholar] [CrossRef] [Green Version]
  65. Lai, L.; Hsieh, S.; Huang, H.Y.; Chou, C.C. Effect of lactic fermentation on the total phenolic, saponin and phytic acid contents as well as anti-colon cancer cell proliferation activity of soymilk. J. Biosci. Bioeng. 2013, 115, 552–556. [Google Scholar] [CrossRef]
  66. Bolívar-Monsalve, J.; Ceballos-González, C.F.; Ramírez-Toro, C.; Bolívar, G.A. Reduction in saponin content and production of gluten-free cream soup base using quinoa fermented with Lactobacillus plantarum. Food Process. Preserv. 2018, 42, e13495. [Google Scholar] [CrossRef]
  67. Dong, L.M.; Linh, N.T.T.; Hoa, N.T.; Thuy, D.T.K.; Giap, D.D. Effect of Lactic Fermentation and Spray Drying Process on Bioactive Compounds from Ngoc Linh Ginseng Callus and Lactobacillus plantarum Viability. Microbiol. Biotechnol. Lett. 2021, 49, 346–355. [Google Scholar] [CrossRef]
  68. Xu, L.; Su, Q.; Zhang, Z.; Guan, G.; Huang, D.; Terry, N.; Wang, F. Increased Extracellular Saponin Production after the Addition of Rutin in Truffle Liquid Fermentation and Its Antioxidant Activities. Fermentation 2021, 7, 103. [Google Scholar] [CrossRef]
  69. Xing, Q.; Dekker, S.; Kyriakopoulou, K.; Boom, R.M.; Smid, E.J.; Schutyser, M.A.I. Enhanced nutritional value of chickpea protein concentrate by dry separation and solid-state fermentation. Innov. Food Sci. Emerg. Technol. 2020, 59, 102269. [Google Scholar] [CrossRef]
  70. Awuchi, C.; Victory, I.; Echeta, C. The functional properties of foods and flours. Int. J. Adv. Acad. Res. 2019, 5, 139–160. [Google Scholar]
  71. Böttcher, S.; Drusch, S. Interfacial Properties of Saponin Extracts and Their Impact on Foam Characteristics. Food Biophys. 2016, 11, 91–100. [Google Scholar] [CrossRef]
  72. Huang, S.; Liu, Y.; Zhang, W.; Dale, K.J.; Liu, S.; Zhu, J.; Serventi, L. Composition of legume soaking water and emulsifying properties in gluten-free bread. Food Sci. Technol. Int. 2018, 24, 232–241. [Google Scholar] [CrossRef]
  73. Nakamura, A.; Yoshida, R.; Maeda, H.; Furuta, H.; Corredig, M. Study of the role of the carbohydrate and protein moieties of soy soluble polysaccharides in their emulsifying properties. J. Agric. Food Chem. 2004, 52, 5506–5512. [Google Scholar] [CrossRef]
  74. Nakauma, M.; Funami, T.; Noda, S.; Ishihara, S.; Al-Assaf, S.; Nishinari, K.; Phillips, G.O. Comparison of sugar beet pectin, soybean soluble polysaccharide, and gum Arabic as food emulsifiers. Effect of concentration, pH, and salts on the emulsifying properties. Food Hydrocoll. 2008, 22, 1254–1267. [Google Scholar] [CrossRef]
  75. Jarzębski, M.; Siejak, P.; Smułek, W.; Fathordoobady, F.; Guo, Y.; Pawlicz, J.; Trzeciak, T.; Kowalczewski, P.Ł.; Kitts, D.D.; Singh, A.; et al. Plant Extracts Containing Saponins Affects the Stability and Biological Activity of Hempseed Oil Emulsion System. Molecules 2020, 25, 2696. [Google Scholar] [CrossRef] [PubMed]
Figure 1. (a) Bacterial count and (b) pH value and lactic acid production determined during the fermentation of blanching water sample BW1 (0.75 °Bx).
Fermentation 09 00350 g001
Figure 2. (a) Bacterial count and (b) pH value and lactic acid production determined during the fermentation of blanching water sample BW2 (1.25 °Bx).
Fermentation 09 00350 g002
Figure 3. (a) Glucose and total starch concentrations and (b) total protein content determined in raw (RBW1 and RBW2) and fermented (FBW1 and FBW2) bean blanching water samples at different solid concentrations (0.75 °Bx and 1.25 °Bx, for RBW1 and RBW2, respectively). Values marked with the same lowercase letters are non-statistically different (p > 0).
Fermentation 09 00350 g003
Figure 4. Total protein content (solid line) and pH values (dashed line) determined during fermentation of (a) BW1 sample, with a solid concentration of 0.75 °Bx, and (b) BW2 sample, with a solid concentration of 1.25 °Bx.
Fermentation 09 00350 g004
Figure 5. (a) Foaming capacity (FC) and (b) foaming stability (FS) in raw (RBW1 and RBW2) and fermented (FBW1 and FBW2) bean blanching water samples with different solid concentrations (0.75 °Bx and 1.25 °Bx for RBW1 and RBW2, respectively). Values marked with the same lowercase letters are non-statistically different (p > 0).
Fermentation 09 00350 g005
Figure 6. (a) Emulsifying activity index (EAI) and (b) emulsifying stability index (ESI) in raw (RBW1 and RBW2) and fermented (FBW1 and FBW2) bean blanching water samples with different solid concentrations (0.75 °Bx and 1.25 °Bx for RBW1 and RBW2, respectively). Values marked with the same lowercase letters are non-statistically different (p > 0).
Fermentation 09 00350 g006
Table 1. Raw bean blanching water (RBW) samples and respective chemical compositions.
Samples°BxDry Matter (%)pHProteins (%)Glucose (%)
RBW10.751.0685.920.020.04
RBW21.251.7016.270.050.22
Table 2. Total polyphenol content, total flavonoid content, antioxidant activity, and total saponin content (TPC, TFC, AA, and TSC, respectively) in raw and fermented blanching water with initial solid concentrations of 0.75 °Bx (RBW1 and FBW1, respectively) and 1.25 °Bx (RBW2 and FBW2, respectively). Different lowercase letters in the same row indicate statistically significant differences (p < 0.05).
RBW1FBW1RBW2FBW2
TPC (mgGAE/mL)0.086 ± 0.001 a0.115 ± 0.040 b0.245 ± 0.0025 c0.302 ± 0.0085 d
TFC (mgQE/mL)0.0026 ± 0.0061 a0.0037 ± 0.0067 b0.005 ± 0.0001 c0.0076 ± 0.0021 d
AA (mmolTE/mL)0.387 ± 0.158 a0.485 ± 0.1202 b1.052 ± 0.229 c1.449 ± 0.659 d
TSC (mgOAE/mL)1.541 ± 0.025 a1.590 ± 0.057 a2.868 ± 0.289 c6.682 ± 0.689 d
GAE: gallic acid equivalents; QE: quercetin equivalents; OAE: oleanolic acid equivalents; TE: Trolox equivalents.
Disclaimer/Publisher’s Note: The statements, opinions and data contained in all publications are solely those of the individual author(s) and contributor(s) and not of MDPI and/or the editor(s). MDPI and/or the editor(s) disclaim responsibility for any injury to people or property resulting from any ideas, methods, instructions or products referred to in the content.

