Abstract
Supplementation with saccharomyces cerevisiae culture products (SCs) has shown effectiveness in alleviating or improving the health and productivity of ruminants at a high risk of digestive and metabolic problems as a consequence of their physiological state and feeding system (i.e., Holstein cows during peak lactation). However, the effects of SC supplementation on ruminal digestion and microbial population are not yet well-understood. Hence, this study aimed to contribute to the knowledge of the effects of in vitro SC supplementation on ruminal nutrient digestibility and microbial community. This study included three treatment groups: a control group (CON, 0% SC proportion of substrate DM), a low-dose SC group (LSC, 0.10% SC proportion of substrate DM), and a high-dose SC group (HSC, 0.30% SC proportion of substrate DM). The SC product contained 7.0 × 10⁹ CFU/g. After 48 h of fermentation at 39 °C, the incubation fluid and residue were collected to measure the ruminal nutrient digestibility and microbial community. The results showed that supplemental SC tended (p = 0.096) to increase DM digestibility due to an increase (9.6%, p = 0.03) in CP digestibility and via a tendency (0.05 < p < 0.08) to increase the fiber fraction. Additionally, the 16S rRNA high-throughput sequencing results revealed that the richness and diversity of the microbiota were unchanged by SC supplementation, while the abundances of Spirochaetes, Tenericutes, and Spirochaetaceae were lower in the SC groups than those in the CON group (p < 0.05). At the genus level, the abundances of Selenomonas and Succinivibrio were increased by SC supplementation (p < 0.05), while SC supplementation decreased the abundances of Ruminococcaceae_UCG-014 and Treponema_2 (p < 0.05). Furthermore, the predicted function of the microbiota showed that carbohydrate metabolism and lipid metabolism were enriched in the SC groups compared with the CON group (p < 0.05). Except for the increases in ADF digestibility (p = 0.032) and pH (p = 0.076) at 0.30%, the supplemental level did not result in additional effects. In summary, our results demonstrate that SC supplementation could improve ruminal nutrient degradation digestibility and alter microbiota composition.
1. Introduction
During the peak lactation period, dairy cows’ feed comprises a high content of fermentable carbohydrates, which, in turn, to serves meet the nutritional needs of the dairy cows [1]. However, overfeeding with a high-concentrate diet decreases the ruminal pH, alters the ruminal microbial homeostasis [2], and triggers a susceptibility to metabolic diseases, such as subacute ruminal acidosis (SARA) and nutritional diarrhea [3], bringing great economic losses globally each year [4]. To prevent these phenomena from occurring, it was recommended to introduce some feed additives into the ruminant diet to enhance the health and productivity of the animals. These additives included plant-derived extracts [2], organic acids [5], and probiotics [6]. A saccharomyces cerevisiae culture (SC) is a group of probiotics used widely in dairy cow production and nutritional studies [7]. It has been proven to be effective in improving feed efficiency and preventing SARA [8].
The mechanisms of action of the dietary addition of SC to enhance the health and productivity of animals are not fully understood and may be attributed to several modes of action. SC may inhibit lactate-producing microbe activities, enhance the abundance of lactate-utilizing bacteria, and stabilize the rumen pH [9]. Bach et al. [10] suggested that the dietary addition of SC can provide a faster response via innate and adaptive immunity. In addition, previous studies reported that SC supplementation could promote the growth of cellulolytic and amylolytic bacteria [11,12], resulting in changed types and proportions of volatile fatty acids [13], increased feed intake [14], and enhanced nutrient digestibility [15]. The effects of dietary supplementation with SC on dairy cows have been widely studied; however, the results lack consistency [16,17]. The variability in results could be attributed to differences in the type of probiotics (strain), dosage of SC supplemented, and feeding systems used. However, to our best knowledge, few studies have been conducted on the effects of different doses of SC supplementation during the peak lactation period on nutrient digestibility and ruminal microbial communities. The in vitro fermentation technique has been widely used as a measure of assessing nutrient digestibility and the nutritive value of feed additives and modifiers of rumen fermentation [18,19].
Therefore, this study was conducted in vitro to evaluate the effects of SC supplementation level on (1) ruminal nutrient digestibility and (2) microbial composition and function. We hypothesized that supplementing with SC would improve nutrient digestibility and alter the microbial composition and would have a positive impact based on dose.
2. Materials and Methods
All experimental procedures were approved by the Ethical Committee of the College of Animal Science and Technology of China Agricultural University (permission No. AW81302102-1-2).
2.1. Rumen Fluid Preparation
During the peak lactation period, three Holstein dairy cows (658 ± 46 kg of body weight; 37.8 ± kg/d milk yield; 72 ± 15 days in milk, parity of 2) with rumen fistulae were used as rumen fluid donors for the in vitro rumen fermentation experiment in March 2021. The animals were housed in the commercial farm at Zhongdi Dairy Holding Co., Ltd. (Beijing, China). The cows were fed three times daily (at 07:00, 14:00, and 21:00) with the total mixed ratio (TMR) and had water ad libitum. They were milked daily three times daily (at 06:00, 13:00, and 20:00). The ingredients and nutrient composition of the TMR are presented in Table 1. Briefly, about 3 L of ruminal fluid was collected through the rumen fistula of each cow before morning feeding, filtered through four layers of sterile gauze, and transferred to a prewarmed vacuum bottle filled in advance with CO2 at 39 °C in a water bath.

Table 1.
The ingredients and nutrient composition of fermentation substrates (dry matter basis, %).
2.2. Experimental Design and Sample Collection
A total of 15 kg of TMR diet, the same as what was offered to the donor cows, was collected for use as substrate for the in vitro degradability trial. A saccharomyces cerevisiae culture product (SC) containing 7.0 × 10⁹ CFU/g, which was sourced from Hebei Yiran Biotechnology Co., Ltd. (Shijiazhuang, China), was added to the substrate to obtain three SC treatment groups with different concentrations based on dry matter (DM): a control group (CON, SC proportion: 0%), a low-dose SC group (LSC, SC proportion: 0.10%), and a high-dose SC group (HSC, SC proportion: 0.30%). The buffer solution was prepared following the method previously described by Kong et al. [20]. Subsequently, CO2 was introduced into the solution via bubbling until the pH value was 6.8. In vitro incubation experiments were executed in anaerobic glass bottles with a 120 mL capacity. Each individual glass bottle was loaded with 500 mg of the substrate, 25 mL of filtered rumen fluid, and 50 mL of buffer. Upon loading, the fermentation bottles were firmly sealed with aluminum caps and rubber stoppers, and all bottles were cultivated at 39 °C in a constant incubator for 48 h. Each treatment group included four replicates and four bottles without substrate as the blank.
2.3. Sample Collection, Measurement, and Calculation
2.3.1. In Vitro Degradability
After 48 h of incubation, the contents of four bottles in each treatment group were poured into a nylon bag (80 mm × 150 mm in size with 42 μm pores), washed 5 times manually in cold tap water, and then dried at 60 °C for 48 h in a forced-air oven (Wujiang Zhongda Electrical Technology Co., Ltd., Suzhou, China) to analyze the apparent nutrient degradability. The dry matter (DM), crude protein (CP), neutral detergent fiber (NDF), and acid detergent fiber (ADF) contents in the original substrates and residual samples were measured according to a previous study by Kong et al. [21]. The starch content of the original substrates and residuals were determined via a starch content assay kit (Megazyme Co., Ltd., Wicklow, Ireland), following the description by Rabadi et al. [22].
2.3.2. DNA Extraction and Sequencing
After 48 h of incubation, we collected twelve incubation fluid samples (4 samples per treatment; 3 treatment groups) and divided them into 2 mL sterile tubes for microbiota analyses. According to the manufacturer’s instructions, the incubation fluid DNA was extracted using the Omega Stool DNA kit (Omega Bio-Tek, Norcross, GA, USA). DNA concentration and quantity were determined by a vis spectrophotometer (NanoDrop 2000 UN, Thermo Scientific, Waltham, MA, USA) and 1% agarose gel electrophoresis. The hypervariable region V3-V4 of the bacterial 16S rRNA gene were amplified by universal pairs 338F (5′-ACTCCTACGGGAGGCAGCAG-3′) and 806R (5′-GGACTACHVGGGTWTCTAAT-3′) [23]. The PCR reaction mixture included 4 μL 5 × Fast Pfu buffer, 2 μL 2.5 mM dNTPs, 0.8 μL of each primer (5 μM), 0.4 μL Fast Pfu polymerase, 10 ng of template DNA, and ddH2O to reach a final volume of 20 µL. The PCR amplification cycling conditions consisted of an initial denaturation at 95 °C for 3 min, followed by 27 cycles of denaturing at 95 °C for 30 s, annealing at 55 °C for 30 s, extension at 72 °C for 45 s, and single extension at 72 °C for 10 min, ending at 4 °C. All samples were amplified in triplicate, and the PCR products were extracted from 2% agarose gel and purified using the AxyPrep DNA Gel Extraction Kit (Axygen Biosciences, Union City, CA, USA) according to manufacturer’s instructions and quantified using Quantus™ Fluorometer (Promega, Madison, WI, USA). Finally, purified amplicons were pooled in equimolar amounts and paired-end sequenced using an Illumina MiSeq PE300 platform (Illumina, Inc., San Diego, CA, USA). The raw reads were deposited at the NCBI Sequence Read Archive (SRA) database (project number: PRJNA946193).
2.3.3. Bioinformatic Analysis
To obtain high-quality data, clean reads were assembled using FASTP (version 0.18.0) [24]. FLASH (version 1.2.11) software was used for merging the paired-end clean reads [25]. The cleaned sequences were then assigned to operational taxonomic units (OTUs) clustered with a 97% similarity by UPARSE (version 10.0.240) [26]. From each OTU, the longest sequence was selected as a representative sequence for each OTU, and its taxonomy annotation was analyzed using an RDP Classifier (version 2.2) [27], compared with the SILVA v138 16S rRNA database, with a confidence threshold of 70%. Alpha diversity indices were calculated according to a previous method by Pitta et al. [28], and a principal coordinates analysis (PCoA) plot was generated using R software (version 2.15.3) [29]. The linear discriminant analysis effect size (LEfse) was conducted to investigate microbiome biomarkers between the three treatment groups. In addition, the potential function of the microbiome was determined using PICRUSt2 software [30].
2.4. Statistical Analysis
The alpha diversity of the microbial data, relative abundance of microbiota, and microbiota function data were initially submitted to a Kolmogorov–Smirnov normality test. Then, all data were analyzed based on the GLM procedure of SAS 9.2 (SAS Institute Inc., Cary, NC, USA). The following model was used to analyze the data: Yij = µ + αi + εij, where Yij is the dependent variable, µ is the overall mean, αi is the treatment effect (CON, LSC and HSC), and εij is the residual error. Furthermore, an estimate statement was used to evaluate the effect of the SC supplementation (both SC dosages combined versus control) and different dosages (LSC versus HSC); p-values ˂ 0.05 were considered a significant difference, and the tendency was stated at 0.05 ≤ p ≤ 0.10.
3. Results
3.1. In Vitro Nutrient Digestibility and Incubation Fluid pH Value
As shown in Table 2, compared to the CON group, DM digestion tended (p = 0.096) to increase as a result of a significant increase in CP (p < 0.01) digestion, and a tendency to increase the NDF (p = 0.071) and ADF (p = 0.058) digestion were observed in the SC supplementation groups. Compared to the LSC group, no effect on starch digestibility (p = 0.921) was observed in the HSC group, but a tendency (p = 0.076) to demonstrate a higher pH was observed in the HSC group.
Table 2.
Effects of different doses of saccharomyces cerevisiae culture on nutrient digestibility and incubation fluid pH value in vitro.
3.2. Bacterial Diversity
A total of 1,255,898 high-quality reads were generated from the incubated ruminal fluid samples of the 3 treatment groups. A total of 3573 operational taxonomic units (OTUs) were generated based on a 97% sequence similarity. SC supplementation did not affect the Chao1 index (p = 0.934) or Shannon index value (p = 0.125, Figure 1A,B), and there was no significant difference between the LSC and HSC groups (p > 0.05, Figure 1A,B), indicating that SC supplementation did not affect the diversity and richness of the microbial community. In addition, PCOA plots based on the Bray–Curtis distance metrics were used to reveal the differences in the microbial composition of the three groups, and we did not observe strong clustering among treatment variables (Figure 1C).
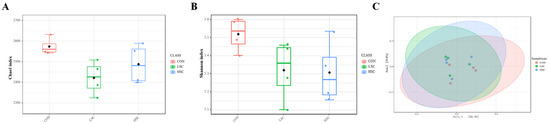
Figure 1.
Effects of different doses of saccharomyces cerevisiae culture on diversity of microbial community in incubated ruminal fluid. The alpha diversity indices including the Chao1 (A) and Shannon indices (B) were calculated based on OTUs level. Principal coordinate analysis (PCOA) of microbial community in the incubated ruminal fluid which was calculated using Bray–Curtis distance metrics (C). CON, no supplementation with SC; LSC, low-dose SC supplementation; HSC, high-dose SC supplementation.
3.3. Bacterial Composition and Difference
At the taxonomic level, 21 phyla were identified from the 12 samples, and the taxonomic classification rate was 99.99%. Among these, the predominant phyla were Firmicutes (40.19%), Bacteroidetes (46.53%), Proteobacteria (10.18%), and Spirochaetes (0.73%) (Figure 2A). Compared with the CON group, SC supplementation decreased the relative abundances of Spirochaetes (p = 0.041) and Tenericutes (p = 0.042, Figure 2D). At the family level, 101 families were identified in the incubation fluid samples, and the taxonomic classification rate was 97.75%. Among these, the dominant families were Prevotellaceae (31.53%), Veillonellaceae (25.46%), Succinivibrionaceae (7.20%), Lachnospiraceae (8.52%), and Ruminococcaceae (4.81%) (Figure 2B). The relative abundances of Spirochaetaceae (p = 0.041) and Lachnospiraceae (p = 0.099) were lower in the SC group than in the CON group (Figure 2E). Conversely, SC supplementation had a tendency to increase the relative abundances of Veillonellaceae (p = 0.069) compared to the CON group (Figure 2E). On the other hand, 248 genera were identified, and the taxonomic classification rate was 82.28%. Prevotella_1 (21.93%), Selenomonas (10.03%), Prevotella_7 (5.36%), Succinivibrionaceae_UCG-001 (3.79%), RC9_gut_group (4.31%), Succiniclasticum (4.01%), Succinivibrio (4.02%) were the predominant genera in the three groups (Figure 2C). Higher abundances of Ruminococcaceae_UCG-014 (p = 0.031) and Treponema_2 (p = 0.035) were observed in CON group than in the SC group (Figure 2F), while SC supplementation increased the relative abundances of Selenomonas (p = 0.027) and Succinivibrio (p = 0.041) in comparison to the CON group (Figure 2F). We also performed an LEfSe analysis to reveal the differential different genera among the three groups: there were six, and one biomarker genera was significantly different (p < 0.05 and LDA > 2) in the CON and HSC groups. Lachnoclostridium_12, Lachnospiraceae_NK4A136_group, Anaerosporobacter, uncultured_Erysipelotrichaceae_bacterium, Oscillospira, and Catonella were enriched in the CON group, while Olsenella was enriched in the HSC group (Figure 3).
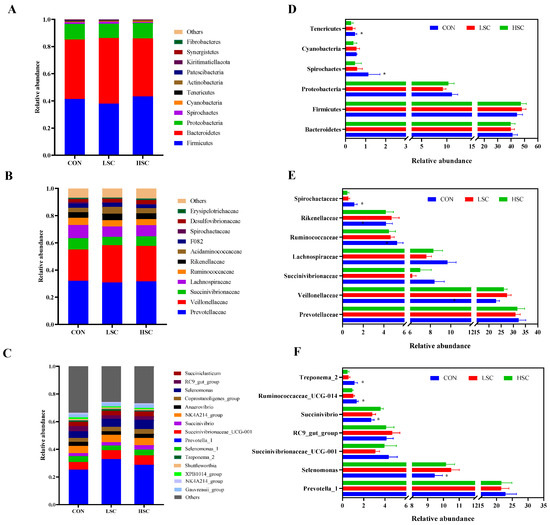
Figure 2.
The bacterial community composition and significant differences among the three groups. Relative abundance of bacterial community at phylum level (A), family level (B), and genus level (C). Analysis of differences in the relative abundance of bacteria community at the phylum level (D); family level (E), genus level (F). CON, no supplementation with SC; LSC, low-dose SC supplementation; HSC, high-dose SC supplementation. *: indicates significantly differences between SC groups versus control group (p < 0.05).
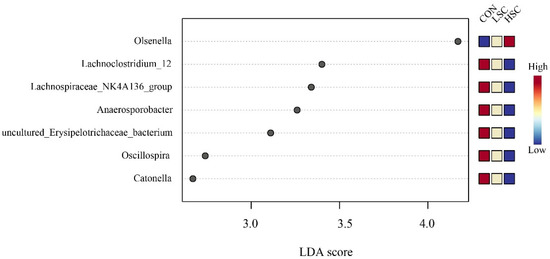
Figure 3.
Linear discriminant analysis effect size approach identifying biomarker genera among the three groups. CON, no supplementation with SC; LSC, low-dose SC supplementation; HSC, high-dose SC supplementation. Biomarker genera in this figure was significant (p < 0.05) and had an LDA Score >2, which was considered a significant.
3.4. Predicted Functions of Bacterial
To investigate the functional characteristics of the bacterial fermentation solution, PICRUSt 2 was used to predict potential functions and compare the differences among the three groups (Table 3), wherein pathways (KEGG level 2) with relative abundances greater than 1% were analyzed. The abundances of carbohydrate metabolism (p = 0.021), the metabolism of other amino acids (p = 0.038), and lipid metabolism (p = 0.029) significantly increased in the SC supplementation groups, and the abundances of the metabolism of cofactors and vitamins (p = 0.065), energy metabolism (p = 0.081), glycan biosynthesis and metabolism (p = 0.093), and cell growth and death (p = 0.081) tended to increase in the SC supplementation groups; however, a higher abundance of the metabolism of terpenoids and polyketides was observed in the CON group (p = 0.018). In addition, the abundances of the carbohydrate metabolism (p = 0.079), amino acid metabolism (p = 0.090), and lipid metabolism (p = 0.056) tended to be greater in the HSC group compared with the LSC group.
Table 3.
Effects of different doses of saccharomyces cerevisiae culture on predictive functions in the bacterial community.
4. Discussion
During the peak lactation period, dairy cows are commonly fed a high-grain diet to meet their nutritional requirements for a high milk yield, resulting an increased risk of the presentation of metabolic diseases [3]. Subacute ruminal acidosis (SARA) is the most major metabolic disease in modern intensive dairy feeding systems, which brings a great economic loss by reducing matter intake and milk production [4]. Previous studies have indicated that dietary supplementation with SC is one of the most effectively ways of preventing the occurrence of SARA [31]; however, the effects of SC on dairy cows are inconsistent. Furthermore, to our best knowledge, little is known about the effects of SC supplementation during the peak lactation period on nutrient digestibility and microbial communities; hence, this study was conducted based on an in vitro condition.
As an essential contributor to maintain the homeostasis of the rumen environment, the ruminal pH is a comprehensive indicator of fermentation status. However, there is a lack of consistent effects on the ruminal pH in response to SC supplementation. For instance, Sun at al. [32] observed an increase in the ruminal pH when feeding 100 g/d of SC during the high-yield period. This positive effect may be associated with an increase in the populations of lactate-utilizing bacteria, which reduce lactic acid accumulation in the rumen [9]. In contrast, some studies observed no effect on the ruminal pH in response to SC supplementation [33,34]; thisis consistent with our results, as no a positive effect on ruminal pH was observed in the SC groups. Different results cloud be closely related to different sources, lactation strategies, and the dosage of SC. Furthermore, regarding the lack of an effect of SC supplementation on ruminal pH in the current study, the timing of the sample collection is likely the main reason. Consistent with the ruminal pH, the DM and the digestibility of other nutrients in response to SC supplementation were variable. According to Williams et al. [35], lactating dairy cows supplemented with 10 g/d SC exhibited a positive effect in terms of DM digestibility. Similarly, Knollinger et al. [36] reported a positive effect on nutrients’ apparent digestibility when cows in the early lactation stage were fed with SC products. In contrast, a previous study suggested that the addition of SC to diets had no effect on the nutrient digestibility of dairy cows [37]. In the current study, SC supplementation increased the in vitro CP digestibility, which is agreement with the results of Mwenya et al. [38] and Wholt et al. [39]. A study was conducted by Lascano et al. [40], who reported a higher apparent NDF and ADF digestibility in SC cows than those in a control group; this is in line with the results from our study and may be because SC contains glucose, furan mannose, and chitin, which contribute to the promotion of the growth of cellulose-degrading bacteria, thus enhancing the utilization of fibrous material [41].
To some degree, the rumen environment is moldable, and positive adjustments can impact its microbial composition and structure, leading an enhanced productivity and nutrient utilization [42]. In the current study, no changes in the richness and diversity of ruminal bacterial in response to SC supplementation were observed. This is in concordance with a study by Jiang et al. [43], who demonstrated that dietary supplementation with SC did not affect the α diversity and β diversity of the ruminal bacteria of dairy cows. A previous study by Mizrahi et al. [44] may be support this result, stating that the rumen has the ability to rapidly absorb SC products; moreover, the functional redundancy of rumen microbiota maintains the steady state of ruminal microecology. The benefits of SC supplementation on the ruminal bacterial community in our study were reflected in the bacterial composition. Consistent with previous studies on dairy cows [2,13], the dominant phyla in our study were Bacteroidetes, Firmicutes, and Proteobacteria. However, the abundances of Bacteroidetes, Firmicutes, and Proteobacteria were not changed by SC supplementation, and this also proved that there was a lack of significant differences in the richness and diversity of ruminal bacteria among the three groups. The abundances of Spirochaetes and Tenericutes were significantly decreased in the SC groups, proving that SC has the ability to improve the immunity of animals. Spirochaetes and Tenericutes have been reported to cause gastrointestinal infection or inflammation [45,46]. At the family level, the relative abundances of Spirochaetaceae clearly decreased with SC supplementation, while the relative abundances of Veillonellaceae showed an increasing trend. Several Spirochete taxa are reported to be closely related to disease, such as the human syphilis infection, human periodontal infections, and bovine digital dermatitis [47,48]; hence, this result demonstrated that SC supplementation improved the health and immunity of dairy animals as the SC products contain a variety of bioactive compounds such as beta glucans, B vitamins, nucleotides, and amino acids, which are closely linked to activation of the immune system [49]. Veillonellaceae belong to the phylum Firmicutes and are known for being an important bacterial family for ruminants to degrade and utilize cellulose [50]. Meanwhile, Palmonari et al. [51] reported that the Veillonellaceae family performs essential functions in preventing the decrease in the rumen pH by fermenting lactic acid in other organic compounds, such as propionic or valeric acid, with beneficial effects on reducing the risk of rumen acidosis, signaling that SC products could enhance lactic-acid-utilizing and fiber-degrading bacteria. At the genus level, there were some different genera represented in the three groups. A study by Xue et al. [52] reported a higher abundance of Selenomonas in the rumen of cows with high yield of milk and fat, indicating that Selenomonas are positively correlated with feed efficiency; furthermore, Selenomonas contain species that are highly specialized in the degradation of fucoidans and other complex polysaccharides, and they may play an important role in polysaccharide degradation, validating a higher abundance of Selenomonas and improving nutrient digestibility in response to SC supplementation. Treponema_2 belong to the phylum Spirochaetes, and Jiang et al. [53] reported that the addition of SC to the diet had a tendency to reduce the abundance of Spirochaetes, which is inconsistent with the result in this study. However, their function in the rumen is still largely uncharted, and more research is needed to explain the lower numbers of Treponema_2 in the rumen in the case of SC supplementation. Succinivibrio are gram-negative bacteria, and they are thought to be essential contributors to fermentation and use of soluble nutrients. A similar study was reported by Zhu et al. [13] in which a higher abundance of Succinivibrio in the rumen was observed when lactating dairy cows were fed an SC product, which is consistent with our result. In contrast, other studies reported no effect of SC supplementation in the abundance of Succinivibrio [54,55], confirming the metabolic diversity of this genus in the rumen.
In the current study, to further explore the effect of SC supplementation on rumen microbial function, PICRUSt2 was used to predict the rumen microbial function, which differed among the three treatment groups. Notably, at the KEGG pathway level 2, genes involved in carbohydrate metabolism, amino acid metabolism, and lipid metabolism to different degrees were enriched in the SC groups, which is consistent with a previous study on the yeast culture supplementation of rumen bacteria and metabolites in finishing bulls [56]. Although this experiment clearly showed that supplementation with SC altered bacterial composition and function, which, in turn, increased nutrient degradability, especially for CP, more in vivo studies are needed to explore the effects of SC supplementation on dairy cattle, especially during the peak lactation period.
5. Conclusions
This study investigated the responses of ruminal nutrient digestibility and microbial to SC supplementation at different doses. The results demonstrated that supplementation with SC implied a significantly increased CP degradability. Additionally, SC supplementation affected the microbiota composition, in which the abundances of Selenomonas and Succinivibrio were significantly increased, and the abundances of Spirochaetes and Treponema_2 were lower. On the other hand, the richness and diversity of the microbiota were not changed and were without additional dose effects. These findings provide a preliminary suggestion for the rational use of SC in dairy cattle during the peak lactation period.
Author Contributions
Conceptualization, S.L. and W.W.; methodology, D.D. and Y.L.; software, C.G. and C.D.; validation, D.D., Y.L. and F.K.; formal analysis, X.X.; investigation, D.D. and Y.L.; resources, X.X.; data curation, D.D.; writing—original draft preparation, D.D.; writing—review and editing, D.D. and F.K.; visualization, D.D.; supervision, S.L. and W.W.; project administration, S.L.; funding acquisition, S.L. and W.W. All authors have read and agreed to the published version of the manuscript.
Funding
This study was funded by the China Agricultural Research System of Ministry of Finance and Ministry of Agriculture and Rural Affairs (CARS36).
Institutional Review Board Statement
All experimental procedures and animal experiments were performed following the guidelines of the Ethics Committee. This study was approved by the Institutional Animal Care and Use Committee of the College of Animal Science and Technology of China Agricultural University (permission No. AW81302102-1-2).
Informed Consent Statement
Not applicable.
Data Availability Statement
The raw sequencing data are available from NCBI and BioProject number is PRJNA946193.
Acknowledgments
We would like to thank Hebei Yiran Biotechnology Co., Ltd. for providing the samples of saccharomyces cerevisiae culture product.
Conflicts of Interest
The authors declare no conflict of interest.
References
- Xue, F.; Nan, X.; Sun, F.; Pan, X.; Guo, Y.; Jiang, L.; Xiong, B. Metagenome sequencing to analyze the impacts of thiamine supplementation on ruminal fungi in dairy cows fed high-concentrate diets. AMB Express 2018, 8, 158–169. [Google Scholar] [CrossRef] [PubMed]
- Mickdam, E.; Khiaosa-Ard, R.; Metzler-Zebeli, B.U.; Klevenhusen, F.; Chizzola, R.; Zebeli, Q. Rumen microbial abundance and fermentation profile during severe subacute ruminal acidosis and its modulation by plant derived alkaloids in vitro. Anaerobe 2016, 39, 4–13. [Google Scholar] [CrossRef] [PubMed]
- Enemark, J.M. The monitoring, prevention and treatment of sub-acute ruminal acidosis (SARA): A review. Vet. J. 2008, 176, 32–43. [Google Scholar] [CrossRef] [PubMed]
- Gozho, G.N.; Krause, D.O.; Plaizier, J.C. Ruminal lipopolysaccharide concentration and inflammatory response during grain-induced subacute ruminal acidosis in dairy cows. J. Dairy Sci. 2007, 90, 856–866. [Google Scholar] [CrossRef] [PubMed]
- Shen, Y.Z.; Ding, L.Y.; Chen, L.M.; Xu, J.H.; Zhao, R.; Yang, W.Z.; Wang, H.R.; Wang, M.Z. Feeding corn grain steeped in citric acid modulates rumen fermentation and inflammatory responses in dairy goats. Animal 2019, 13, 301–308. [Google Scholar] [CrossRef]
- Ishaq, S.L.; Alzahal, O.; Walker, N.; Mcbride, B. An Investigation into Rumen Fungal and Protozoal Diversity in Three Rumen Fractions, during High-Fiber or Grain-Induced Sub-Acute Ruminal Acidosis Conditions, with or without Active Dry Yeast Supplementation. Front. Microbiol. 2017, 8, 1943. [Google Scholar] [CrossRef]
- Amin, A.B.; Mao, S. Influence of yeast on rumen fermentation, growth performance and quality of products in ruminants: A review. Anim. Nutr. 2021, 7, 31–41. [Google Scholar] [CrossRef]
- Fonty, G.; Chaucheyras-Durand, F. Effects and modes of action of live yeasts in the rumen. Biologia 2006, 61, 741–750. [Google Scholar] [CrossRef]
- Broadway, P.; Carroll, J.; Sanchez, N. Live Yeast and Yeast Cell Wall Supplements Enhance Immune Function and Performance in Food-Producing Livestock: A Review. Microorganisms 2015, 3, 417–427. [Google Scholar] [CrossRef]
- Bach, A.; Guasch, I.; Elcoso, G.; Chaucheyras-Durand, F.; Castex, M.; Fàbregas, F.; Garcia-Fruitos, E.; Aris, A. Changes in gene expression in the rumen and colon epithelia during the dry period through lactation of dairy cows and effects of live yeast supplementation. J. Dairy Sci. 2018, 101, 2631–2640. [Google Scholar] [CrossRef]
- Ogunade, I.M.; Lay, J.; Andries, K.; Mcmanus, C.J.; Bebe, F. Effects of live yeast on differential genetic and functional attributes of rumen microbiota in beef cattle. J. Anim. Sci. Biotechnol. 2019, 10, 1–7. [Google Scholar] [CrossRef] [PubMed]
- Mao, H.L.; Mao, H.L.; Wang, J.K.; Liu, J.X.; Yoon, I. Effects of Saccharomyces cerevisiae fermentation product on in vitro fermentation and microbial communities of low-quality forages and mixed diets. J. Anim. Sci. 2013, 7, 3291–3298. [Google Scholar] [CrossRef]
- Zhu, W.; Wei, Z.; Xu, N.; Yang, F.; Yoon, I.; Chung, Y.; Liu, J.; Wang, J. Effects of Saccharomyces cerevisiae fermentation products on performance and rumen fermentation and microbiota in dairy cows fed a diet containing low quality forage. J. Anim. Sci. Biotechnol. 2017, 8, 36. [Google Scholar] [CrossRef] [PubMed]
- Dias, J.; Silva, R.B.; Fernandes, T.; Barbosa, E.F.; Gracas, L.; Araujo, R.C.; Pereira, R.; Pereira, M.N. Yeast culture increased plasma niacin concentration, evaporative heat loss, and feed efficiency of dairy cows in a hot environment. J. Dairy Sci. 2018, 101, 5924–5936. [Google Scholar] [CrossRef]
- Dann, H.M.; Drackley, J.K.; Mccoy, G.C.; Hutjens, M.F.; Garrett, J.E. Effects of Yeast Culture (Saccharomyces cerevisiae) on Prepartum Intake and Postpartum Intake and Milk Production of Jersey Cows1. J. Dairy Sci. 2000, 83, 123–127. [Google Scholar] [CrossRef] [PubMed]
- Zaworski, E.M.; Shriver-Munsch, C.M.; Fadden, N.A.; Sanchez, W.K.; Yoon, I.; Bobe, G. Effects of feeding various dosages of Saccharomyces cerevisiae fermentation product in transition dairy cows. J. Dairy Sci. 2014, 97, 3081–3098. [Google Scholar] [CrossRef]
- Olagaray, K.E.; Sivinski, S.E.; Saylor, B.A.; Mamedova, L.K.; Sauls-Hiesterman, J.A.; Yoon, I.; Bradford, B.J. Effect of Saccharomyces cerevisiae fermentation product on feed intake parameters, lactation performance, and metabolism of transition dairy cattle. J. Dairy Sci. 2019, 102, 8092–8107. [Google Scholar] [CrossRef] [PubMed]
- Yáñez-Ruiz, D.R.; Bannink, A.; Dijkstra, J.; Kebreab, E.; Morgavi, D.P.; Kiely, P.O.; Reynolds, C.K.; Schwarm, A.; Shingfield, K.J.; Yu, Z.; et al. Design, implementation and interpretation of in vitro batch culture experiments to assess enteric methane mitigation in ruminants—A review. Anim. Feed Sci. Technol. 2016, 216, 1–18. [Google Scholar] [CrossRef]
- Liu, W.; Wang, Q.; Song, J.; Xin, J.; Zhang, S.; Lei, Y.; Yang, Y.; Xie, P.; Suo, H. Comparison of Gut Microbiota of Yaks From Different Geographical Regions. Front. Microbiol. 2021, 12, 666940. [Google Scholar] [CrossRef] [PubMed]
- Kong, F.; Lu, N.; Liu, Y.; Zhang, S.; Jiang, H.; Wang, H.; Wang, W.; Li, S. Aspergillus oryzae and Aspergillus niger Co-Cultivation Extract Affects In Vitro Degradation, Fermentation Characteristics, and Bacterial Composition in a Diet-Specific Manner. Animals 2021, 11, 1248. [Google Scholar] [CrossRef]
- Kong, F.; Gao, Y.; Tang, M.; Fu, T.; Diao, Q.; Bi, Y.; Tu, Y. Effects of dietary rumen–protected Lys levels on rumen fermentation and bacterial community composition in Holstein heifers. Appl. Microbiol. Biotechnol. 2020, 104, 6623–6634. [Google Scholar] [CrossRef] [PubMed]
- Al-Rabadi, G.J.S.; Gilbert, R.G.; Gidley, M.J. Effect of particle size on kinetics of starch digestion in milled barley and sorghum grains by porcine alpha-amylase. J. Cereal Sci. 2009, 50, 198–204. [Google Scholar] [CrossRef]
- Bi, Y.; Zeng, S.; Zhang, R.; Diao, Q.; Tu, Y. Effects of dietary energy levels on rumen bacterial community composition in Holstein heifers under the same forage to concentrate ratio condition. BMC Microbiol. 2018, 18, 69. [Google Scholar] [CrossRef]
- Chen, S.; Zhou, Y.; Chen, Y.; Gu, J. Fastp: An ultra-fast all-in-one FASTQ preprocessor. Bioinformatics 2018, 34, 1884–1890. [Google Scholar] [CrossRef]
- Magoč, T.; Salzberg, S.L. FLASH: Fast length adjustment of short reads to improve genome assemblies. Bioinformatics 2011, 27, 2957–2963. [Google Scholar] [CrossRef]
- Edgar, R.C. UPARSE: Highly accurate OTU sequences from microbial amplicon reads. Nat. Methods 2013, 10, 996–998. [Google Scholar] [CrossRef]
- Cole, J.R.; Wang, Q.; Cardenas, E.; Fish, J.; Chai, B.; Farris, R.J.; Kulam-Syed-Mohideen, A.; McGarrell, D.M.; Marsh, T.; Garrity, G.M. The Ribosomal Database Project: Improved alignments and new tools for rRNA analysis. Nucleic Acids Res. 2009, 37, D141–D145. [Google Scholar] [CrossRef]
- Pitta, D.W.; Kumar, S.; Vecchiarelli, B.; Shirley, D.J.; Bittinger, K.; Baker, L.D.; Ferguson, J.D.; Thomsen, N. Temporal dynamics in the ruminal microbiome of dairy cows during the transition period. J. Anim. Sci. 2014, 92, 4014–4022. [Google Scholar] [CrossRef] [PubMed]
- Costantini, M.S.; Medeiros, M.C.I.; Crampton, L.H.; Reed, F.A. Wild gut microbiomes reveal individuals, species, and location as drivers of variation in two critically endangered Hawaiian honeycreepers. PeerJ 2021, 9, e1229. [Google Scholar] [CrossRef]
- Langille, M.G.I.; Zaneveld, J.; Caporaso, J.G.; Mcdonald, D.; Knights, D.; Reyes, J.A.; Clemente, J.C.; Burkepile, D.E.; Vega Thurber, R.L.; Knight, R.; et al. Predictive functional profiling of microbial communities using 16S rRNA marker gene sequences. Nat. Biotechnol. 2013, 31, 814–821. [Google Scholar] [CrossRef]
- Alzahal, O.; Dionissopoulos, L.; Laarman, A.H.; Walker, N.; Mcbride, B.W. Active dry Saccharomyces cerevisiae can alleviate the effect of subacute ruminal acidosis in lactating dairy cows. J. Dairy Sci. 2014, 97, 7751–7763. [Google Scholar] [CrossRef]
- Sun, X.; Wang, Y.; Wang, E.; Zhang, S.; Wang, Q.; Zhang, Y.; Wang, Y.; Cao, Z.; Yang, H.; Wang, W.; et al. Effects of Saccharomyces cerevisiae Culture on Ruminal Fermentation, Blood Metabolism, and Performance of High-Yield Dairy Cows. Animals 2021, 11, 2401. [Google Scholar] [CrossRef]
- Lascano, G.J.; Zanton, G.I.; Heinrichs, A.J. Concentrate levels and Saccharomyces cerevisiae affect rumen fluid-associated bacteria numbers in dairy heifers. Livest. Sci. 2009, 126, 189–194. [Google Scholar] [CrossRef]
- Hossain, S.A.; Parnerkar, S.; Haque, N.; Gupta, R.S.; Tyagi, A.K. Influence of dietary supplementation of live yeast (Saccharomyces cerevisiae) on nutrient utilization ruminal and biochemical profiles of Kankrej calves. Int. J. Appl. Anim. Sci. 2012, 1, 30–38. [Google Scholar]
- Williams, P.E.; Tait, C.A.; Innes, G.M.; Newbold, C.J. Effects of the inclusion of yeast culture (Saccharomyces cerevisiae plus growth medium) in the diet of dairy cows on milk yield and forage degradation and fermentation patterns in the rumen of steers. J. Anim. Sci. 1991, 7, 3016–3026. [Google Scholar] [CrossRef] [PubMed]
- Knollinger, S.E.; Poczynek, M.; Miller, B.; Mueller, I.; de Almeida, R.; Murphy, M.R.; Cardoso, F.C. Effects of Autolyzed Yeast Supplementation in a High-Starch Diet on Rumen Health, Apparent Digestibility, and Production Variables of Lactating Holstein Cows. Animals 2022, 12, 2445. [Google Scholar] [CrossRef]
- Harrison, G.A.; Hemken, R.W.; Dawson, K.A.; Harmon, R.J.; Barker, K.B. Influence of addition of yeast culture supplement to diets of lactating cows on ruminal fermentation and microbial populations. J. Dairy Sci. 1988, 71, 2967–2975. [Google Scholar] [CrossRef]
- Mwenya, B.; Santoso, B.; Sar, C.; Pen, B.; Morikawa, R.; Takaura, K.; Umetsu, K.; Kimura, K.; Takahashi, J. Effects of yeast culture and galacto-oligosaccharides on ruminal fermentation in holstein cows. J. Dairy Sci. 2005, 88, 1404–1412. [Google Scholar] [CrossRef]
- Wohlt, J.E.; Finkelstein, A.D.; Chung, C.H. Yeast culture to improve intake, nutrient digestibility, and performance by dairy cattle during early lactation. J. Dairy Sci. 1991, 4, 1395–1400. [Google Scholar] [CrossRef] [PubMed]
- Lascano, G.J.; Heinrichs, A.J.; Tricarico, J.M. Substitution of starch by soluble fiber and Saccharomyces cerevisiae dose response on nutrient digestion and blood metabolites for precision-fed dairy heifers. J. Dairy Sci. 2012, 95, 3298–3309. [Google Scholar] [CrossRef]
- Zhou, X.; Ouyang, Z.; Zhang, X.; Wei, Y.; Tang, S.; Ma, Z.; Tan, Z.; Zhu, N.; Teklebrhan, T.; Han, X. Sweet Corn Stalk Treated with Saccharomyces cerevisiae Alone or in combination with Lactobacillus Plantarum: Nutritional Composition, Fermentation Traits and Aerobic Stability. Animals 2019, 9, 598. [Google Scholar] [CrossRef] [PubMed]
- Ghazanfar, S.; Ahmed, I.; Khalid, N. Probiotic Yeast: Mode of Action and Its Effects on Ruminant Nutrition; Intechopen: Madrid, Spain, 2017. [Google Scholar]
- Jiang, Y.; Ogunade, I.M.; Pech-Cervantes, A.A.; Fan, P.X.; Li, X.; Kim, D.H.; Arriola, K.G.; Poindexter, M.B.; Jeong, K.C.; Vyas, D.; et al. Effect of sequestering agents based on a Saccharomyces cerevisiae fermentation product and clay on the ruminal bacterial community of lactating dairy cows challenged with dietary aflatoxin B1. J. Dairy Sci. 2020, 103, 1431–1447. [Google Scholar] [CrossRef] [PubMed]
- Mizrahi, I.; Wallace, R.J.; Moraïs, S. The rumen microbiome: Balancing food security and environmental impacts. Nat. Rev. Microbiol. 2021, 19, 553–566. [Google Scholar] [CrossRef]
- Dennis, V.A.; Dixit, S.; O’Brien, S.M.; Alvarez, X.; Pahar, B.; Philipp, M.T. LiveBorrelia burgdorferi Spirochetes Elicit Inflammatory Mediators from Human Monocytes via the Toll-Like Receptor Signaling Pathway. Infect. Immun. 2009, 77, 1238–1245. [Google Scholar] [CrossRef] [PubMed]
- Chen, L.; Wang, W.; Zhou, R.; Ng, S.C.; Li, J.; Huang, M.; Zhou, F.; Wang, X.; Shen, B.; Kamm, M.A.; et al. Characteristics of Fecal and Mucosa-Associated Microbiota in Chinese Patients With Inflammatory Bowel Disease. Medicine 2014, 93, e51. [Google Scholar] [CrossRef] [PubMed]
- Wu, Y.; Yao, Y.; Dong, M.; Xia, T.; Li, D.; Xie, M.; Wu, J.; Wen, A.; Wang, Q.; Zhu, G.; et al. Characterisation of the gut microbial community of rhesus macaques in high-altitude environments. BMC Microbiol. 2020, 20, 68–83. [Google Scholar] [CrossRef]
- Nordhoff, M.; Moter, A.; Schrank, K.; Wieler, L.H. High prevalence of treponemes in bovine digital dermatitis-a molecular epidemiology. Vet. Microbiol. 2008, 131, 293–300. [Google Scholar] [CrossRef]
- Li, J.; Xing, J.; Li, D.; Wang, X.; Zhao, L.; Lv, S.; Huang, D. Effects of beta-glucan extracted from Saccharomyces cerevisiae on humoral and cellular immunity in weaned piglets. Arch. Anim. Nutr. 2005, 59, 303–312. [Google Scholar] [CrossRef]
- Li, L.; Qu, L.; Li, T. Supplemental dietary selenohomolanthionine affects growth and rumen bacterial population of shaanbei white cashmere wether goats. Front. Microbiol. 2022, 13, 942848. [Google Scholar] [CrossRef]
- Palmonari, A.; Federiconi, A.; Cavallini, D.; Sniffen, C.J.; Mammi, L.; Turroni, S.; Amico, F.D.; Holder, P.; Formigoni, A. Impact of molasses on ruminal volatile fatty acid production and microbiota composition in vitro. Animals 2023, 13, 728. [Google Scholar] [CrossRef]
- Xue, M.Y.; Sun, H.Z.; Wu, X.H.; Liu, J.X.; Guan, L.L. Multi-omics reveals that the rumen microbiome and its metabolome together with the host metabolome contribute to individualized dairy cow performance. Microbiome 2020, 8, 64. [Google Scholar] [CrossRef] [PubMed]
- Jiang, Y.; Ogunade, I.M.; Qi, S.; Hackmann, T.J.; Staples, C.R.; Adesogan, A.T. Effects of the dose and viability of Saccharomyces cerevisiae. 1. Diversity of ruminal microbes as analyzed by Illumina MiSeq sequencing and quantitative PCR. J. Dairy Sci. 2017, 100, 325–342. [Google Scholar] [CrossRef] [PubMed]
- Mullins, C.R.; Mamedova, L.K.; Carpenter, A.J.; Ying, Y.; Allen, M.S.; Yoon, I.; Bradford, B.J. Analysis of rumen microbial populations in lactating dairy cattle fed diets varying in carbohydrate profiles and Saccharomyces cerevisiae fermentation product. J. Dairy Sci. 2013, 96, 5872–5881. [Google Scholar] [CrossRef] [PubMed]
- Jiao, P.; Wei, C.; Sun, Y.; Xie, X.; Zhang, Y.; Wang, S.; Hu, G.; Alzahal, O.; Yang, W. Screening of live yeast and yeast derivatives for their impact of strain and dose on in vitro ruminal fermentation and microbial profiles with varying media pH levels in high-forage beef cattle diet. J. Sci. Food Agric. 2019, 99, 6751–6760. [Google Scholar] [CrossRef]
- Gao, K.; Geng, C. Alterations in the rumen bacterial communities and metabolites of finishing bulls fed high-concentrate diets supplemented with active dry yeast and yeast culture. Front. Microbiol. 2022, 13, 908244. [Google Scholar] [CrossRef]


Disclaimer/Publisher’s Note: The statements, opinions and data contained in all publications are solely those of the individual author(s) and contributor(s) and not of MDPI and/or the editor(s). MDPI and/or the editor(s) disclaim responsibility for any injury to people or property resulting from any ideas, methods, instructions or products referred to in the content. |
© 2023 by the authors. Licensee MDPI, Basel, Switzerland. This article is an open access article distributed under the terms and conditions of the Creative Commons Attribution (CC BY) license (https://creativecommons.org/licenses/by/4.0/).