Article

Optimization of Coconut Milk Kefir Beverage by RSM and Screening of Its Metabolites and Peptides

by
Muna Mahmood Taleb Abadl
1,
Anis Asyila Marzlan
1,
Rabiha Sulaiman
1,
Faridah Abas
2 and
Anis Shobirin Meor Hussin
1,3,*
1
Department of Food Technology, Faculty of Food Science and Technology, Universiti Putra Malaysia, Serdang 43400, Selangor Darul Ehsan, Malaysia
2
Department of Food Science, Faculty of Food Science and Technology, Universiti Putra Malaysia, Serdang 43400, Selangor Darul Ehsan, Malaysia
3
Halal Products Research Institute, Universiti Putra Malaysia, Serdang 43400, Selangor Darul Ehsan, Malaysia
*
Author to whom correspondence should be addressed.
Fermentation 2023, 9(5), 430; https://doi.org/10.3390/fermentation9050430
Submission received: 1 March 2023 / Revised: 23 March 2023 / Accepted: 17 April 2023 / Published: 28 April 2023
(This article belongs to the Special Issue New Research in Production of Antimicrobial Compounds by Fermentation)

Abstract

:
Probiotic foods such as kefir drinks help to improve the health and well-being of consumers. Since Salmonella resistance to current antibiotic drugs is rising at an alarming rate worldwide, especially in Africa and Asia, this has raised the need for alternative ways of preventing and treating infectious diseases in humans and animals. Thus, a dairy-free probiotic drink can be an alternative for people with milk allergies or for those who avoid dairy products as a lifestyle choice. This study aims to optimize the quality of the coconut milk kefir drink for its antioxidant and antimicrobial activities and to identify the peptides and metabolites present. The time, temperature, and inoculum size that resulted in the optimal antioxidant and antimicrobial activities using Response Surface Methodology (RSM) were found to be 13.4 h, 25 °C, and 5.4 g/100 mL, respectively. The metabolic changes of coconut milk kefir at the beginning and end of fermentation were identified using 1H-NMR-based metabolomics. Some of the metabolites that were identified in the optimized product are γ-Aminobutyric acid, Biotin, Riboflavin, Butyrate, Lactate, and Caprylate. Moreover, 10 peptide sequences were identified using LC-MS/MS. The findings of this study demonstrated a high potential for coconut milk fermented using kefir grains as a functional healthy drink.

1. Introduction

Kefir is a beverage made by fermenting milk using kefir grains containing a complex microbial diversity of lactic acid bacteria, yeasts, and acetic acid bacteria. It is reported that kefir first appeared in the Caucasus Mountains, where it has long been popular. In the last decade or so, kefir has gained popularity globally due to its health and nutritional benefits and its versatility [1]. Several studies reported that kefir is considered a probiotic beverage of high nutritional and healthy values [2]. Antimicrobial activity is one of the well-known health benefits of kefir. The antimicrobial activity is caused by the bioactive compounds of kefir, such as organic acids, acetaldehyde, and bioactive peptides produced during fermentation, as well as the presence of lactic acid bacteria [3]. Kefir bioactive compounds are reported to prevent gastrointestinal disorders and maintain healthy and balanced gut microbiota [4]. Due to the increase in pathogenic bacteria resistant to antibiotics, recent studies suggest the urgent need for natural alternatives to reduce the use of antibiotics [5].
Coconut (Cocos nucifera L.) fruit has been a stable commodity used in many South Asian countries for a long time. One of the most widely used products of the coconut is coconut milk. Coconut milk is a white milky liquid that is extracted from the kernel of the mature coconut and is made of around 54% moisture, 35–37% fat, and 9–11% non-fat solids [6]. Various studies have been conducted to investigate the health benefits of coconut milk. Coconut milk contains lauric acid, which has been shown to initiate the apoptosis of cancer cells [7]. Moreover, it contains many different vitamins such as vitamin C, B complex, and E, which are known to have antioxidant properties, as well as minerals such as potassium, magnesium, and calcium [8].
The consumption of “lactose-free” beverages and foods is a worldwide trend, especially with the increase in the diagnosis of lactose intolerance and allergies [9] and the increase in the number of vegetarians and vegans [10]. There has been constant growth in the plant-based milk beverage market. Technological advances in research have enabled alternatives that increase product quality, increase production, and improve product appearance and palatability [11]. The global coconut milk market is expected to reach $5.8 billion by 2030, growing at a CAGR of 17.3% during the forecast period of 2022–2030 [12], while the kefir market is foreseen to increase to $2.45 billion by 2030, at a CAGR of 5.9% [13]. Therefore, creating and optimizing coconut milk kefir could play a vital role in filling a market need for more plant-based alternatives to dairy products. Given the importance of antioxidant and probiotic activities among kefir properties, this study aims to develop and optimize the fermentation process concerning both of these activities in the beverage. Accordingly, this study investigates the effects of fermentation factors such as time, temperature, and inoculum size on the pH, antioxidant activity, and antimicrobial activity, and evaluates the metabolites and bioactive peptides of the optimized product (Figure S1).

2. Materials and Methods

2.1. Coconut Milk Kefir Production

Kefir grains were purchased from a local store in Malaysia (http://mykefirworld.com/, accessed on 4 February 2022) and propagated by being inoculated daily in sterile low-fat pasteurized cow milk for two weeks. Kefir grains were then sieved out using a plastic sieve, washed with sterile distilled water, and transferred to 1000 mL of coconut milk. The coconut milk used had 13.4% fat, 7.2% carbohydrates, and 4.7% protein. The coconut milk kefir samples were subjected to freeze-drying. A total of 3 g of each sample was then dissolved in 10 mL of sterile distilled water. The sample was vortexed and centrifuged at 10,000 rpm for 15 min, and the supernatant was filtered out to be used for further testing and analyses.

2.2. Experimental Design

The Response Surface Methodology (RSM) was coupled with a Box Behnken Design (RSM-BBD) and consisted of 15 experimental runs that were used to encompass the possible combinations of factor levels containing the central point (three replicates) used for the optimization. The ranges of the independent variables in the design were prescribed into three levels, which are 25, 30, and 35 °C for temperature (x1); 1.8, 3.6, and 5.4 g/100 mL for inoculum size (x2); and 6, 18, and 30 h for incubation time (x3) (Table 1). The following response variables were measured: pH (y1); DPPH scavenging activity (y2); ABTS+ scavenging activity (y3); FRAP (y4); and antimicrobial activity against Bacillus subtilis (y5), Salmonella Typhimurium (y6), Escherichia coli (y7), and Staphylococcus aureus (y8).

2.3. pH

The pH was measured using a pH meter (3505 pH meter, Jenway, England, UK).

2.4. Antibacterial Activity

The antibacterial inhibitory activity [14] was adopted in this experiment. Four types of bacteria were used in this study: Salmonella Typhimurium ATCC14028, Escherichia coli ATCC12229, Bacillus subtilis ATCC6633, and Staphylococcus aureus ATCC6538. They were grown in nutrient broth for 24 h at 37 °C. The cell density of the microbial inoculant was adjusted to 106 CFU/mL. An aliquot (100 µL) of the sample was added directly to the 96-well micro-titer plate, and 100 µL of the fresh suspension was added. The absorbance was measured at 0 h after 24 h using an ELISA spectrophotometer at 600 nm. The percentage of inhibition of microbial growth was calculated according to the following equation:
I mg   % =   A c A 24 A 0     A c × 100
where Img% is the percentage of inhibition of the microbial growth, A24h is the absorbance of the mixture at 600 nm at 24 h, A0h is the absorbance of the mixture at 0 h, and Ac is the absorbance of the control at the same wavelength. All the antimicrobial tests were carried out sixfold.

2.5. Antioxidant Assays

2.5.1. Diphenyl-2-picryl-hydrazyl Assay

The diphenyl-2-picryl-hydroxyl (DPPH) assay was performed with some modifications [15]. Briefly, a 0.1 mmol/L DPPH solution was freshly made in a 95% ethanol solution. 50 µL of the sample was reacted with 200 µL of the DPPH solution in a 96-well micro-titer plate and kept at room temperature for 30 min. The absorbance (A) was measured at 517 nm using an ELISA spectrophotometer (PowerWave × 340, Bio-Tek 430 Instruments, Burlington, VT, USA). A control sample was prepared with the sample. The percentage of inhibition of DPPH radical-scavenging activity I% was calculated according to the following equation:
I   % = Ac As Ac × 100
where I% is the As, which is the absorbance of the sample at 517 nm, and Ac is the absorbance of the control at the same wavelength. All DPPH tests were carried out in triplicates.

2.5.2. 2,2′-Azino-bis (3-Ethylbenzothiazoline-6-sulfonic Acid) Diammonium Salt Assay

The 2,2′-azino-bis (3-ethylbenzothiazoline-6-sulfonic acid) diammonium salt (ABTS+) radical scavenging activity was used with some modifications [16]. 7.0 mM ABTS+ solution was mixed with 2.45 mM potassium persulfate and then stored in the dark at room temperature for 12–16 h before use. The mixture was afterward diluted using 80% ethanol to reach an absorbance of 0.700 ± 0.02 at 734 nm. An amount of 170 µL of this diluted ABTS+ solution was mixed with 20 µL of the sample in a 96-well micro-titer plate and stored at 30 °C for 6 min. The absorbance of the samples was measured at 734 nm. The percentage of inhibition of the ABTS+ cation radical-scavenging activity (I%) was calculated according to the same equation as the DPPH analysis (Equation (2)). All ABTS tests were carried out in triplicates.

2.5.3. Ferric Reducing Antioxidant Power Assay

The ferric-reducing antioxidant power (FRAP) method was carried out with some modifications [17]. The 100 mL of 300 mM acetate buffer (pH 3.6) with 10 mL of a 10 mM 2,4,6-Tripyridyl-S-triazine (TPTZ) solution in 40 mM Hydrogen Chloride (HCl) and one volume of 20 mM Ferric (III) chloride (FeCl3) were mixed to prepare the working FRAP reagent. 0.3 mL of sample was mixed with 2.7 mL of the FRAP reagent in a 96-well micro-titer plate and incubated for 30 min at 37 °C. It was then measured using an ELISA spectrophotometer at 593 nm. Different concentrations of Iron (II) sulfate heptahydrate (FeSO4·7H2O) were used to form a standard curve. The results were expressed as FRAP values (mmol Fe(II)/10 mL sample). All FRAP tests were carried out in triplicates.

2.6. 1H-NMR Metabolomics Analysis

The 1H-NMR metabolomics analysis method was used in this study [18]. The coconut milk kefir (CMK) was evaluated against the non-fermented coconut milk (CM), which was used as a reference. The 10 mg of each sample was mixed with 0.375 mL of methanol-d4 (CH3OH-d4) without any internal standard and 0.375 mL of potassium dihydrogen phosphate (KH2PO4) buffer in deuterium oxide (D2O) (adjusted to pH 6) containing 0.1% trimethyl-silyl propionic acid (TSP) in sixfold. The mixture was vortexed for 1 min and sonicated in an ultrasonicator (Branson, MI, USA) at 30 °C for 15 min. The solution was then centrifuged at 13,000 rpm for l0 min, and an aliquot of 600 μL of the supernatant was transferred to an NMR tube for 1H-NMR analysis. Spectra were recorded at 26 °C on a Varian Unity INOVA 500 MHz spectrometer (Varian Inc., Palo Alto, CA, USA), with a frequency of 499.887 MHz. A total of 64 scans were conducted for each sample and recorded with an acquisition time of 193 s, a pulse width of 3.75 μL, and a relaxation delay of 1.0 s. Tetramethylsilane (TMS) was employed as an internal standard, and all spectra were manually phased and bucketed using Chenomx software version 8.3, with standard bins of δ 0.05 ranging from region δ 0.50 to 10.00. The residual methanol region (δ 3.28 to 3.33) and water region (δ 4.70 to 4.96) were excluded from the analysis.

2.7. Identification of Peptides

The identification of the peptides was performed using liquid chromatography with tandem mass spectrometry (LC-MS/MS) (Q-TOF) (Agilent 6520, (Agilent Technologies, Santa Clara, CA, USA). The mobile phase and the sample were prepared as instructed by the laboratory technician at Monash University, Malaysia Campus, as the analysis was performed using their facilities. The mobile phase A was 0.1% formic acid in water and the mobile phase B was 0.1% formic acid in acetonitrile, and both mobile phases were degassed for 15 min in a sonicator bath. The freeze-dried samples were diluted in 0.75 mL of solvent A, and 10 μL was injected into LC/MS-MS to identify the peptide sequence using the Agilent 1200 HPLC-Chip/MS Interface, coupled with the Agilent 6520 Accurate-Mass Q-TOF LC-MS. The column used was Large Capacity Chip, 300 Å, C18, 160 nL enrichment column, and 75 umx150 mm analytical column. The flow rate was set at 4 μL/min from the Agilent 1200 Series Capillary Pump and 0.3 μL/min from Agilent 1200 Series Nano Pump. The injection volume was 0.5 μL. The mass spectra parameters were ion polarity (positive), voltage 175 V, gas temperature 325 °C, and gas flow 5 L/min. The acquired data were processed with PEAKS Studio 6.0, and protein sequence matching was carried out using BLAST searches in the SWISS-PROT (https://www.uniprot.org/, accessed on 20 December 2022). The identified peptides were compared with the APD3 antimicrobial database(https://aps.unmc.edu/AP/, accessed on 20 December 2022).

2.8. Statistical Analysis

The RSM experimental design and analysis were performed using Minitab statistical software (Minitab 16.0, Minitab Incorporation, USA). The software was also used to develop the model equation, graph the surface plot, and predict the optimum independent variable values for six response variables. The statistical significance of estimated second-order response models was a 95% confidence level of the total error. Moreover, statistical differences between the samples and the controls were evaluated by one-way analysis of variance (ANOVA). Results are expressed as the mean of three determinations ± standard deviation (SD). Mean value differences at p < 0.05 were considered statistically significant.

3. Results and Discussion

3.1. Coconut Milk Kefir Optimization

The combined effect of temperature (°C, x1), inoculum size (g/100 mL, x2), and incubation time (h, x3) (Table 1) on pH (y1), DPPH scavenging activity (%, y2), ABTS+ scavenging activity (%, y3), FRAP (mmol Fe(II)/10 mL, y4), and antimicrobial activity against Bacillus subtilis (%, y5) Salmonella Typhimurium (%, y6), Escherichia coli (%, y7), and Staphylococcus aureus (%, y8) were determined using RSM-BBD (Table 2). A mathematical model was used to describe the behavior of response variables, and the second-order polynomial model was generated from the statistical analysis (Table 3). A second-order polynomial equation was proposed for the prediction of responses. The response surface models (Equations (3)–(10)) were as follows:
y1 = 4.552 + 0.213 x1 − 0.608 x2 − 0.141 x3 − 0.005 x12 + 0.016 x1x2 + 0.002 x32
y2 = 51.989 + 0.450 x1 + 4.527 x2 + 0.554 x3 − 0.142 x1x2 − 0.016 x32
y3 = 22.889 − 0.756 x1 + 0.543 x2 + 4.670 x3 − 0.125 x32
y4 = 4711.2 − 297.753 x1 − 125.123 x2 + 21.321 x3 + 4.897 x12 + 20.470 x22 − 0.521 x32
y5 = −86.944 + 4.645 x1 + 16.378 x2 + 7.976 x3 − 0.524 x1x2 − 0.124 x1x3 − 0.107 x32
y6 = −211.864 + 14.438 x1 + 6.421 x2 + 7.760 x3 − 0.206 x12 − 0.103 x1x3 − 0.241 x2x3 − 0.084 x32
y7 = 23.730 + 0.037 x1 + 9.034 x2 + 5.161 x3 − 0.375 x2x3 − 0.082 x3
y8 = −215.961 + 12.992 x1 + 18.232 x2 + 8.428 x3 − 0.149 x12 − 0.444 x1x2 − 0.115 x1x3 − 0.196 x2x3 − 0.111 x32
where temperature (x1); inoculum size (x2); incubation time (x3); pH (y1); DPPH scavenging activity (y2); ABTS+ scavenging activity (y3); FRAP (y4); and antimicrobial activity against Bacillus subtilis (y5), Salmonella Typhimurium (y6), Escherichia coli (y7), and Staphylococcus aureus (y8).
The results obtained were analyzed using analysis of variance (ANOVA) to assess the “Goodness of fit”, and only significant (p < 0.05) data were included in the final reduced model. It should be noted that some variables were kept in the reduced model despite their insignificance (p > 0.05), especially linear terms if a quadratic or interaction term containing this variable was significant (p < 0.05) [19]. Multiple regression was used to analyze the data, determine the regression coefficients of the quadratic equations, and fit the experimental data.
The coefficient of determination (R2) is an important measure of response variable variation explained by a linear model. After the reduction of the insignificant terms in the model, R2 values of response variables indicate that the quadratic polynomial model well explains the variations in 6 response variables [19,20], i.e., pH (99.04%); FRAP (85.67%); antimicrobial activity against B. subtilis (91.99%), S. Typhimurium (95.55%), E. coli (83.8%), and S. aureus (97.34%). However, the R2 for the two remaining response variables, DPPH and ABTS+ scavenging activities, were 73.7% and 79.13%, respectively. Thus, around 75% of the response variations could be accurately explained by the response-surface model as a function of three variables (temperature, inoculum size, and incubation time). To be able to assess whether our model provides a better fit than an intercept-only model, it is important to look at the lack of fit (p-value) [21]. The results showed a non-significant (p > 0.05) lack of fit for the regression models fitted for pH, DPPH, and FRAP, indicating the fit of these models for these responses.
The second-order linear effect of temperature (x1), as seen in Table 3, was significant (p < 0.05) for FRAP, antimicrobial activity against B. subtilis, antimicrobial activity against Salmonella Typhimurium, and antimicrobial activity against S. aureus. The effect of inoculum size (x2) was significant for all responses except ABTS+ scavenging activity and FRAP, whereas time (x2) has a significant effect for all responses. When it comes to the quadratic effect, temperature quadratic effect (x1 x1) was significant in the case of pH, FRAP, and antimicrobial activity against Salmonella Typhimurium and S. aureus. The inoculum size quadratic effect (x2 x2) was only significant for FRAP whereas the time (x3 x3) quadratic effect was significant for all responses. The interaction effect of temperature and inoculum size was highly significant (p < 0.05) for half of the responses (pH, DPPH scavenging activity, antimicrobial activity against B. subtilis, and antimicrobial activity against S. aureus). On the other hand, the p-value of the interaction effect in the case of temperature and time was significant in the antimicrobial effect against B. subtilis, Salmonella Typhimurium, and S. aureus, and the interaction of inoculum size and time was significant while measuring the antimicrobial effect against Salmonella Typhimurium, E. coli, and S. aureus.

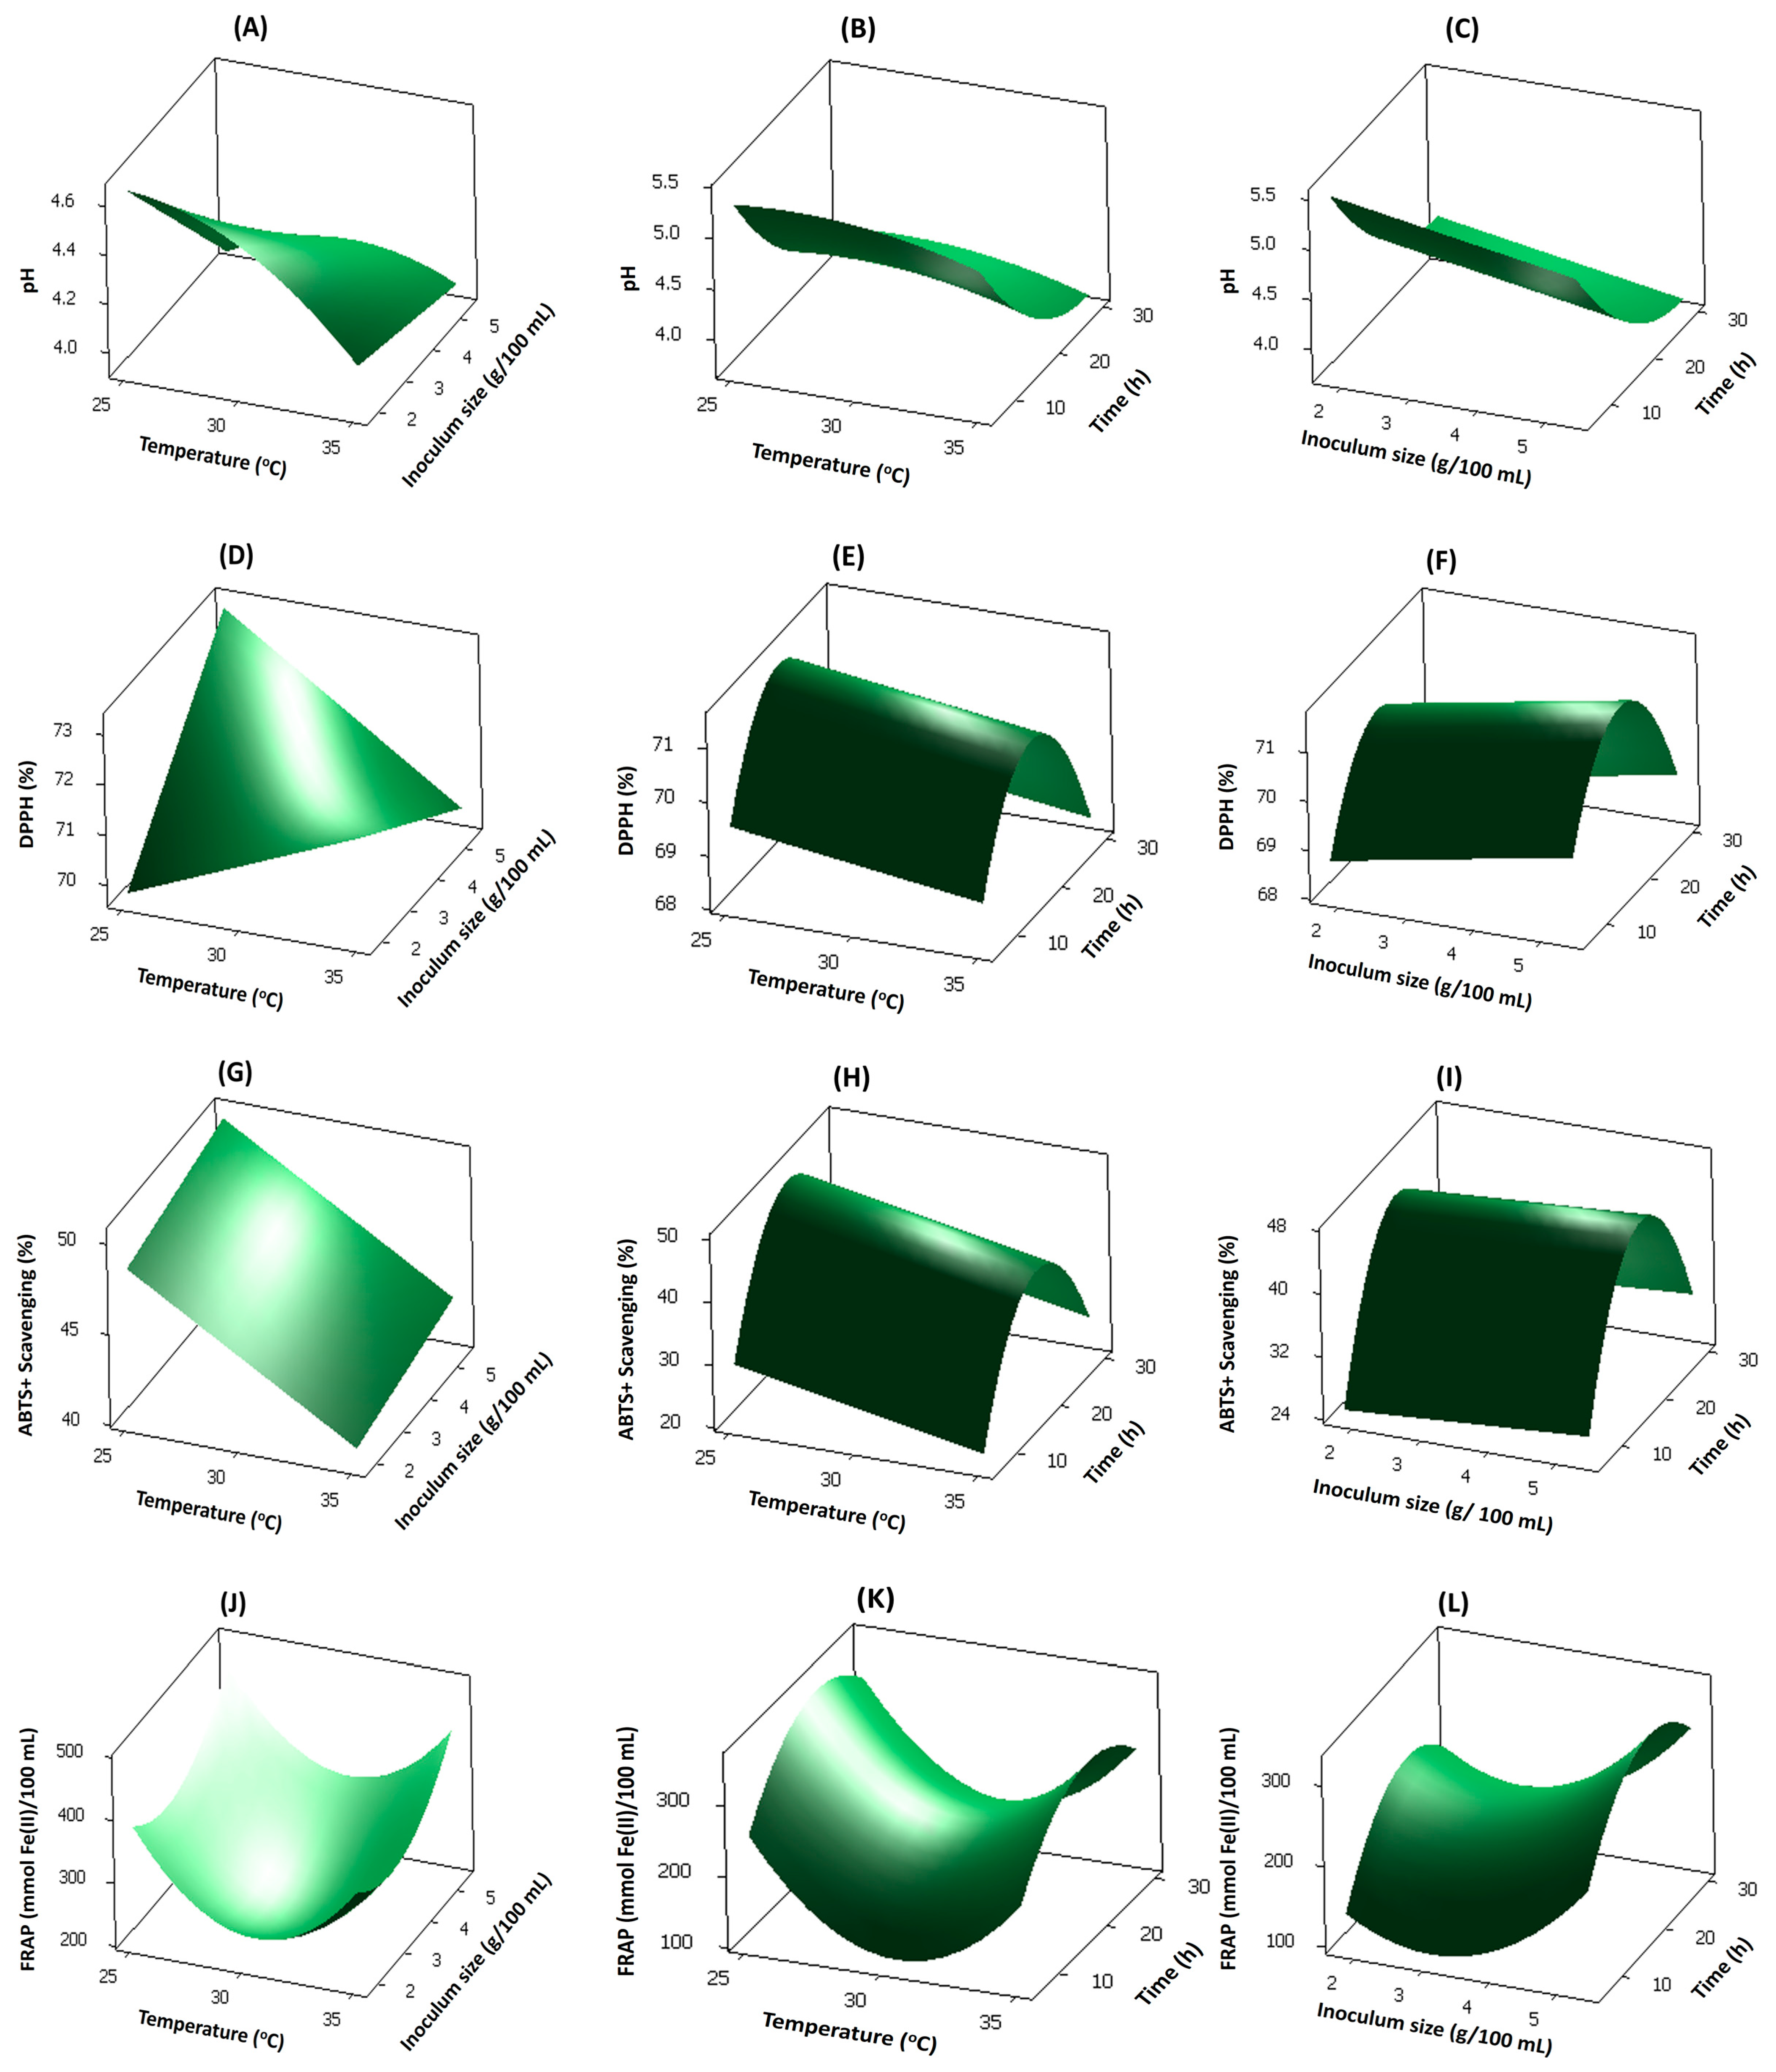
3.2. Effect of Process Variables on Response Variables

3.2.1. Effect of Process Variables on pH

The sign and magnitude of the coefficients for the linear, quadratic, and interaction effects of all response variables were reported (Table 3). When the independent variable level increased, a negative coefficient showed a decrease in the response variable, while a positive coefficient indicated an increase in the response variable [22]. The significant effects on pH (p < 0.05) were observed for the linear term: inoculum size (x2) and incubation time (x3); for the quadratic term: temperature (x1x1) and incubation time (x3x3); and lastly, for the interaction term: temperature and inoculum size (x1x2). Their effects are illustrated in Figure 1A–C, where the ANOVA data demonstrates that the lack of fit was insignificant, the model was significant, and the R2 values for the developed model were 99%.
Concerning the combined effects exhibited by both the temperature and inoculum size [Figure 1A], the pH values showed a very prominent decrease when the temperature was raised from 25 to 35 °C at the smallest inoculum size. However, this negative linear effect became more evident as the inoculum size increased, which could be explained by the higher inoculum level causing higher activity during fermentation [23].
As can be noted, the quadratic effect of temperature alteration significantly relied on the inoculum size. From a visual analysis in Figure 1B, for the temperature tested, pH values decreased with increasing fermentation time, as a longer fermentation time gave the microbes more time to consume the sugars available and lowered the pH level even further. Figure 1C shows the effect of inoculum size and fermentation time on pH. As was observed, the increase in fermentation time engendered a decrease in pH, which can be explained by the fact that higher fermentation temperatures can promote an increase in the metabolic activity of LAB bacteria and, as a result, an increase in the production of organic acids [24].

3.2.2. Effect of Process Variables on Antioxidants

The influences of all three independent variables, temperature (x1), inoculum size (x2), and incubation time (x3), on the DPPH radical scavenging activity (y2), are shown in Figure 1D–F. Two linear variables, one quadratic variable, and one interaction term had significant effects on the values of the DPPH radical scavenging activity (Table 3). As observed in Figure 1D, a significant interaction was found between temperature and inoculum size. Depending on the inoculum size, the quadratic effect of temperature changes significantly, and at the largest inoculum size, the DPPH values steadily decrease when moving from 20 to 35 °C. In contrast, the DPPH value increased significantly for the largest inoculum size. Figure 1D,E shows that regardless of the fermentation temperature and the inoculum size, the DPPH activity inclined with time, reaching a maximum at approximately 20 h and then declining as the fermentation was allowed to continue for longer.
The antioxidant activity of the coconut milk kefir drink was also measured by an ABTS+ scavenging activity using single electron transfer reactions to evaluate the redox potential of the analyzed compounds [25]. The linear, quadratic, and interaction variables had significant effects on the ABTS+ radical scavenging (Table 3). The effect of the independent variables on the ABTS values is shown in Figure 1G–I. As depicted in Figure 1G, a gradual and linear demotion in the ABTS value was disclosed when the fermentation temperature increased. This linear effect became more prominent as the inoculum size increased. At the largest inoculum size, ABTS steadily decreased when moving from 25 to 35 °C. Both DPPH and ABTS values decreased with increased temperature as it could lead to the denaturation of thermolabile antioxidants such as polyphenols, thus decreasing the radical scavenging activity of a compound [22]. The antioxidant properties of milk and dairy products are strongly affected by handling, processing, distribution, storage length, and conditions [26]. Figure 1H,I shows that, as with DPPH values, the ABTS level continued to increase with time until around 20 h and then started decreasing as time progressed. This agrees with the study of Ozcan et al. [27], which shows that the DPPH and ABTS+ radical scavenging activities can decrease with prolonged fermentation time.
For FRAP, all linear and all quadratic variables—temperature (x1), inoculum size (x2), and incubation time (x3)—possessed significant effects. The effect of the independent variables on the FRAP values is shown in Figure 1J–L. Figure 1J shows high FRAP values obtained at a temperature of around 25 °C and an inoculum size of around 5 g/100 mL. At a constant inoculum amount, an increase in temperature up to an estimated 30 °C decreased the FRAP values, and at a temperature >30 °C, an increase in FRAP was observed. Figure 1K shows that the FRAP value decreases with increasing temperature (up to 30 °C) and time (<10 h). In contrast, at constant time, increasing the temperature even further had a positive effect on the FRAP values. However, at a constant temperature, increasing the time >20 h decreased the FRAP values. A similar trend is observed by increasing the time at a constant inoculum size in Figure 1L. However, at a constant rate, FRAP values show a slight decrease with inoculum size < 4 g/100 mL before they start to increase again.

3.2.3. Effect of Process Variables on Antimicrobial Properties

Kefir has an antibacterial effect against many pathogenic organisms due to the presence of lactic acid bacteria, which compete with pathogens for nutrients. Moreover, kefir fermentation causes the inherent formation of organic acids, hydrogen peroxide, acetaldehyde, carbon dioxide, and bacteriocins [28]. The coefficients of determination obtained for the antimicrobial effect against B. subtilis (R2 = 91.99%), Salmonella Typhimurium (R2 = 95.55%), E. coli (R2 = 83.80%), and S. aureus (R2 = 97.34%) indicate that the model is appropriate for explaining up to >83.80% variability (Table 3).
The results concerning the effect of independent variables on the antimicrobial effects against B. subtilis, Salmonella Typhimurium, E. coli, and S. aureus of coconut milk kefir beverages were found to show a similar trend, although with some unique features (Figure 2). Both B. subtilis [Figure 2A–C] and S. aureus [Figure 2J–L] are Gram-positive bacteria. At a constant inoculum size, the antimicrobial effect of the beverage against B. subtilis [Figure 2A] and S. aureus [Figure 2J] continues to increase with temperature until approximately 32 °C, after which it starts to decrease. The mesophilic temperature of about 32 °C is optimum for the growth of mesophilic kefir bacteria and yeasts, which can compete with the pathogens over nutrients and inhibit their growth at that temperature [29]. Kefir lactic acid bacteria also ferment the milk and form many compounds such as organic acids, hydrogen peroxide, acetaldehyde, carbon dioxide, and bacteriocins, which have an antibacterial effect against many pathogenic organisms. Whereas at a constant temperature, the antimicrobial effect against these two pathogens increases steadily with the increase in the inoculum size. At the same time, Figure 2B,C,K,L, it is illustrated that regardless of the temperature and inoculum size, the antimicrobial effect against B. subtilis and S. aureus increases with time up to 20 h before it declines. E. coli and Salmonella Typhimurium are harmful Gram-negative bacteria that can be present in food and beverages. The antimicrobial effect of Salmonella Typhimurium [Figure 2D] and E. coli [Figure 2G] increases with inoculum size at a constant temperature. The bacteriocin named lacticin, 3147, produced by Lactococcus lactis strain DPC3147 isolated from kefir grains, had antimicrobial activity against E. coli, L. monocytogenes, Salmonella Typhimurium, S. enteritidis, S. flexneri, and Y. enterocolitica [30]. As with the antimicrobial effect against B. subtilis and S. aureus, the antimicrobial effect against E. coli and Salmonella Typhimurium increases with time >20 h and decreases until fermentation. The antimicrobial effect resulting from fermenting cow milk with kefir milk could depend on the fermentation time [31]. In that study, the broadest antimicrobial spectra against eight food pathogens and spoilage organisms were obtained after at least 36–48 h of fermentation for all types of kefirs used.

3.3. Validation and Verification of the Predictive Model

The optimum temperature, inoculum size, and fermentation time of coconut milk kefir were predicted using response surface plots and response optimization. The optimum coconut milk kefir production to obtain a drink with potent antioxidant and antimicrobial properties was at a temperature of 25 °C, an inoculum size of 5.4 g/100 mL, and a time of 13.5 h, where the maximum values for DPPH, ABTS+ scavenging activity, FRAP, antimicrobial effects against B. subtilis, Salmonella Typhimurium, E. coli, and S. aureus, and the targeted pH were reported (Table 4). To confirm the predicted value of response variables, the optimum coconut milk kefir conditions were revalidated, and experimental values were compared to the predicted values. Predicted values within the range of the experimental values showed the RSM model had a good correlation.

3.4. Peptide Sequencing

Peptide sequencing was performed to identify bioactive peptides and determine the molecular weight range of antibacterial peptides. A total of 10 peptides were identified from two different proteins. PEAKS STUDIO chromatography of the peptides of COS1_COCNU Cocosin 1 OS (Figure S2) and PEAKS STUDIO chromatography of the peptides of COCNU 11S globulin isoform 2 OS (Figure S3) can be found in the Supplementary Materials.
Table 5. Peptide sequences identified from COS1_COCNU Cocosin 1 OS (Cocos nucifera protein of coconut milk kefir) and their similarity to known antimicrobial peptides at the APD3 website for antimicrobial peptides database.
PeptidesMW (Da)Net ChargeActivityDatabase SimilarityReference
LTRGDEVAIFTPR14751Anti-Gram+ and Gram−GSEIQPR (38.46%)[32]
DEVAIFTPR10470Anti-Gram+ and Gram−GSEIQPR (40%)[32]
GDEVAIFTPR1104−1Anti-Gram+ and Gram−RLGDGCTR (33.33%)[33]
RVKLTRGDEVAIFTPR18583AnticancerRLGDGCTR (37.5%)[33]
LNALEPTR9131AnticancerRLGDGCTR (33.33%)[33]
Table 6. Peptide sequences identified from COCNU 11S globulin isoform 2 OS (Cocos nucifera protein of coconut milk kefir) and their similarity to known antimicrobial peptides at the APD3 website for antimicrobial peptides database.
PeptidesMW (Da)Net ChargeActivityDatabase SimilarityReference
LTRGDEVAIFAPR14451Anti-Gram+ and Gram−GSEIQPR (38.46%)[32]
GDEVAIFAPR10740Anti-Gram+ and Gram−RLGDGCTR (33.33%)[32]
RVKLTRGDEVAIFAPR18283AnticancerRLGDGCTR(37.5%)[32]
IERLNALEPTR13111Anti-Gram−IVRVAVALRRIR (41.66%)[34]
AMVSSIVGK8911Anti-Gram+ and Gram−, Anti-MRSA, anti-sepsisKVTKSVKSIPVKI (40%)[35]
As seen in Table 5 and Table 6, the identified peptides demonstrated very low molecular weights, ranging from 891 Da to 1858 Da. The identified peptides were all cationic except for the peptide GDEVAIFTPR, while the peptides RVKLTRGDEVAIFTPR and RVKLTRGDEVAIFAPR showed the highest charge (+3). These findings are in line with those from several previous studies showing that the majority of antimicrobial peptides identified are cationic peptides of 5–50 residues with a positive net charge of +2 and +9 and low molecular weight [36,37,38]. Cationic peptides share similar mechanisms for the inhibition of the growth of target bacteria via the accumulation of positively charged peptides on the negatively charged bacterial cell wall, causing the formation of membrane pores and disruption of the bacterial cytoplasmic membrane, resulting in the leakage of ions and metabolites and, eventually, cell death [39]. The peptides identified from coconut milk kefir were novel, similar to previously known antimicrobial peptides in the APD3 antimicrobial peptide database (Table 5 and Table 6). The APD3 database contains many natural antimicrobial peptides (AMPs), including 80 parasites, 105 anti-HIV, 172 antiviral, 185 anticancer, 959 antifungal, and 2169 antibacterial peptides [40]. The screening of novel antimicrobial peptides from bacteriocin-producing Carnobacterium was previously carried out by Stoffels et al. [32] and identified the GSEIQPR peptide, which showed 38.46% similarity to the peptides LTRGDEVAIFTPR and LTRGDEVAIFAPR and 40% similarity to the peptide DEVAIFTPR sequenced in the present study [32]. Moreover, the RLGDGCTR peptide from Mishra et al. [33] exhibited 33.33% similarity to two peptide sequences, GDE-VAIFTPR and GDEVAIFAPR, which show intense antimicrobial effects, and 37.5% similarity to another two peptide sequences, RVKLTRGDEVAIFTPR and RVKLTRGDEVAIFAPR, with strong anticancer activity. Hilpert et al. [34] reported the anti-Gram-negative bacteria activity of the identified peptide sequence IVRVAVALRRIR, which has a 41.66% similarity to the coconut milk kefir peptide IERLNALEPTR. In another study, the peptide sequence KVTKSVKSIPVKI showed strong antimicrobial, anti-MRSA, and antisepsis activities and had a 40% similarity to AMVSSIVGK [35].

3.5. Bioactive Metabolites

The metabolites were extracted from lyophilized coconut milk and coconut milk with kefir to determine the effects of the introduction of kefir grains during the fermentation of coconut milk. The 1H-NMR metabolomics profiling of coconut milk kefir (CMK) and coconut milk (CM) was observed in Figure 3.
The metabolite profile of coconut milk kefir (CMK) was observed to contain more bioactive metabolites compared to coconut milk (CM) (Table 7). CM showed higher sugar contents such as xylose (4.7923 mmol/L) and sucrose (2.9443 mmol/L) than CMK, which has 2.3029 and 2.0539 mmol/L xylose and sucrose, respectively. However, lactic acid, biotin, butyrate, caprylic acid, and riboflavin were only detected in CMK (1.0271, 0.0816, 0.0557, 0.6683, and 0.1440 mmol/L, respectively). GABA in CMK (0.1642 mmol/L) was found at a higher concentration compared to that in CM (0.0657 mmol/L).
CM showed higher sugar contents such as xylose (4.7923 mmol/L) and sucrose (2.9443 mmol/L) than CMK, which has 2.3029 and 2.0539 mmol/L xylose and sucrose, respectively. However, lactic acid, biotin, butyrate, caprylic acid, and riboflavin were only detected in CMK (1.0271, 0.0816, 0.0557, 0.6683, and 0.1440 mmol/L, respectively) as a result of the fermentation process. GABA in CMK (0.1642 mmol/L) was found at a higher concentration compared to that in CM (0.0657 mmol/L).
These bioactive compounds can have different health benefits, including antioxidant properties. Feng et al. [41] found that a diet supplemented with biotin in juvenile Jian carp (Cyprinus carpio var. Jian) improved antioxidant status and depressed lipid peroxidation and protein oxidation in all studied tissues and serum. Moreover, the study of Al-Qudah and Ismail [42] showed a strong correlation between low biotin serum levels and oxidant by-products, suggesting a role for biotin as an antioxidant. A study conducted on the effect of sodium butyrate on the antioxidant stability in sub-acute ruminal acidosis in dairy goats showed that sodium butyrate could improve the oxidative status in sub-acute ruminal acidosis [43]. GABA is a non-protein amino acid widely distributed in nature and acts as a major inhibitory neurotransmitter in the central nervous system [44]. GABA is produced by glutamate decarboxylase, which catalyzes the irreversible decarboxylation of l-glutamate to GABA [45]. GABA is well-known for its physiological functions, such as the induction of hypotension as well as diuretic and tranquilizer effects [46]. In a recent study, Muhialdin et al. [47] fermented dragon fruit juice, and the major bioactive metabolites were identified using NMR spectroscopy. Lactic acid is one of the major fermentation products responsible for fermented foods’ biological activities. Riboflavin has physiological effects due to its antioxidant effects [48]. According to Zhu et al. [49], the antioxidant activity of fermented soymilk may be related to the presence of riboflavin.

4. Conclusions

This research is a groundbreaking effort in the optimization of a kefir drink made from coconut milk. The optimal fermentation parameters were found to be: temperature = 25 °C, inoculum size = 5.4 g/100 mL, and fermentation time = 13.5 h. As a result of these conditions, no significant difference was observed between the experimental values and the predicted values. Results showed that the selected fermentation parameters were able to produce coconut milk kefir with high antimicrobial (against Salmonella Typhimurium, E. coli, B. subtilis, and S. aureus) and antioxidant activities (DPPH, ABTS, and FRAP). The optimized product was then analyzed using LC-MS/MS, and as a result, 11 peptide sequences with potential antimicrobial effects were identified. Comparing the coconut milk kefir to normal coconut milk using 1HNMR led to the identification of some metabolites, such as γ-Aminobutyric acid, Biotin, Riboflavin, Butyr-ate, Lactate, and Caprylate, that either resulted from or increased due to the fermentation process. This study proved the validity of the selected regression models to sufficiently explain the factor-response relationship during coconut milk fermentation with kefir grains and that the predicted optimum fermentation conditions are valid to generate bioactive peptides and metabolites.

Supplementary Materials

The following supporting information can be downloaded at: https://www.mdpi.com/article/10.3390/fermentation9050430/s1. Figure S1: Graphical abstract, Figure S2: PEAKS STUDIO chromatography of the peptides of COS1_COCNU Cocosin 1 OS (Cocos nucifera obtained from the fermentation of coconut milk with kefir grains); and Figure S3: PEAKS STUDIO chromatography of the peptides of COCNU 11S globulin isoform 2 OS (Cocos nucifera obtained from the fermentation of coconut milk with kefir grains).

Author Contributions

Investigation, Data curation, Formal analysis, Writing—original draft, Visualization, M.M.T.A.; Writing—review and editing, A.A.M., A.S.M.H. and R.S.; Conceptualization, F.A. and A.S.M.H.; Supervision and Funding acquisition, A.S.M.H. All authors have read and agreed to the published version of the manuscript.

Funding

This research was funded by the Universiti Putra Malaysia under the Geran Universiti Putra Malaysia (GP-IPS/2017/9578000) and the APC was funded by the Universiti Putra Malaysia.

Institutional Review Board Statement

Not applicable.

Informed Consent Statement

Not applicable.

Data Availability Statement

Data are contained within the article.

Acknowledgments

The authors would like to thank the Faculty of Food Science and Universiti Putra Malaysia for the facilities provided.

Conflicts of Interest

The authors declare no conflict of interest.

References

  1. Abadl, M.M.; Mohsin, A.Z.; Sulaiman, R.; Abas, F.; Muhialdin, B.J.; Hussin, A.S. Biological activities and physiochemical properties of low-fat and high-fat coconut-based kefir. Int. J. Gastron. Food Sci. 2022, 30, 100624. [Google Scholar] [CrossRef]
  2. de Oliveira Leite, A.M.; Miguel, M.A.L.; Peixoto, R.S.; Rosado, A.S.; Silva, J.T.; Paschoalin, V.M.F. Microbiological, technological and therapeutic properties of kefir: A natural probiotic beverage. Braz. J. Microbiol. 2013, 44, 341–349. [Google Scholar] [CrossRef] [PubMed]
  3. Rosa, D.D.; Dias, M.M.S.; Grześkowiak, Ł.M.; Reis, S.A.; Conceição, L.L.; Maria do Carmo, G.P. Milk kefir: Nutritional, microbiological and health benefits. Nutr. Res. Rev. 2017, 30, 82–96. [Google Scholar] [CrossRef] [PubMed]
  4. Ahmed, Z.; Wang, Y.; Ahmad, A.; Khan, S.T.; Nisa, M.; Ahmad, H.; Afreen, A. Kefir and Health: A Contemporary Perspective. Crit. Rev. Food Sci. Nutr. 2013, 53, 422–434. [Google Scholar] [CrossRef] [PubMed]
  5. Tóth, A.G.; Csabai, I.; Maróti, G.; Jerzsele, Á.; Dubecz, A.; Patai, Á.V.; Judge, M.F.; Nagy, S.Á.; Makrai, L.; Bányai, K.; et al. A glimpse of antimicrobial resistance gene diversity in kefir and yoghurt. Sci. Rep. 2020, 10, 22458. [Google Scholar] [CrossRef]
  6. Rethinam, P. International scenario of coconut sector. In The Coconut Palm (Cocos nucifera L.)-Research and Development Perspectives; Springer: Singapore, 2019; pp. 21–56. [Google Scholar]
  7. Lappano, R.; Sebastiani, A.; Cirillo, F.; Rigiracciolo, D.C.; Galli, G.R.; Curcio, R.; Malaguarnera, R.; Belfiore, A.; Cappello, A.R.; Maggiolini, M. The lauric acid-activated signaling prompts apoptosis in cancer cells. Cell Death Discov. 2017, 3, 17063. [Google Scholar] [CrossRef]
  8. DebMandal, M.; Mandal, S. Coconut (Cocos nucifera L.: Arecaceae): In health promotion and disease prevention. Asian Pac. J. Trop. Med. 2011, 3, 241–247. [Google Scholar] [CrossRef]
  9. De Martinis, M.; Sirufo, M.M.; Suppa, M.; Ginaldi, L. New perspectives in food allergy. Int. J. Mol. Sci. 2020, 21, 1474. [Google Scholar] [CrossRef]
  10. Iguacel, I.; Huybrechts, I.; Moreno, L.A.; Michels, N. Vegetarianism and veganism compared with mental health and cognitive outcomes: A systematic review and meta-analysis. Nutr. Rev. 2021, 79, 361–381. [Google Scholar] [CrossRef]
  11. dos Santos, D.C.; de Oliveira Filho, J.G.; Santana, A.C.A.; de Freitas, B.S.M.; Silva, F.G.; Takeuchi, K.P.; Egea, M.B. Optimization of soymilk fermentation with kefir and the addition of inulin: Physicochemical, sensory and technological characteristics. LWT 2019, 104, 30–37. [Google Scholar] [CrossRef]
  12. Straits Research. Coconut Milk Market: Information by Packaging Type (Plastic Bottles, Tetra Packs), Category (Organic, Conventional), End-Users (Household, Food Services), and Region—Forecast till 2030. 2022. Available online: https://straitsresearch.com/report/coconut-milk-market (accessed on 14 March 2023).
  13. The Brainy Insights. Global Kefir Market, Industry Analysis, Trends, Analysis and Forecast, 2022 to 2030. 2022. Available online: https://www.thebrainyinsights.com/report/kefir-market-12895#summary (accessed on 14 March 2023).
  14. Rodrigues, K.L.; Caputo, L.R.G.; Carvalho, J.C.T.; Evangelista, J.; Schneedorf, J.M. Antimicrobial and healing activity of kefir and kefiran extract. Int. J. Antimicrob. Agents 2005, 25, 404. [Google Scholar] [CrossRef] [PubMed]
  15. Brand-Williams, W.; Cuvelier, M.-E.; Berset, C. Use of a free radical method to evaluate antioxidant activity. LWT-Food Sci. Technol. 1995, 28, 25–30. [Google Scholar] [CrossRef]
  16. Re, R.; Pellegrini, N.; Proteggente, A.; Pannala, A.; Yang, M.; Rice-Evans, C. Antioxidant activity applying an improved ABTS radical cation decolorization assay. Free Radic. Biol. Med. 1999, 26, 1231–1237. [Google Scholar] [CrossRef] [PubMed]
  17. Benzie, I.F.; Strain, J.J. The ferric reducing ability of plasma (FRAP) as a measure of “antioxidant power”: The FRAP assay. Anal. Biochem. 1996, 239, 70–76. [Google Scholar] [CrossRef]
  18. Kadum, H.; Hamid, A.A.; Abas, F.; Ramli, N.S.; Mohammed, A.K.S.; Muhialdin, B.J.; Jaafar, A.H. Bioactive Compounds Responsible for Antioxidant Activity of Different Varieties of Date (Phoenix dactylifera L.) Elucidated by 1H-NMR Based Metabolomics. Int. J. Food Prop. 2019, 22, 462–476. [Google Scholar] [CrossRef]
  19. Hussein, F.A.; Chay, S.Y.; Zarei, M.; Auwal, S.M.; Hamid, A.A.; Wan Ibadullah, W.Z.; Saari, N. Whey protein concentrate as a novel source of bifunctional peptides with angiotensin-I converting enzyme inhibitory and antioxidant properties: RSM study. Foods 2020, 9, 64. [Google Scholar] [CrossRef]
  20. Koh, W.Y.; Utra, U.; Rosma, A.; Effarizah, M.E.; Rosli, W.I.; Park, Y.H. Development of a novel fermented pumpkin-based beverage inoculated with water kefir grains: A response surface methodology approach. Food Sci. Biotechnol. 2018, 27, 525–535. [Google Scholar] [CrossRef]
  21. Harrell, F.E., Jr.; Harrell, F.E. Multivariable modeling strategies. In Regression Modeling Strategies: With Applications to Linear Models, Logistic and Ordinal Regression, and Survival Analysis; Springer: Cham, Switzerland, 2015; pp. 63–102. [Google Scholar]
  22. Marzlan, A.A.; Muhialdin, B.J.; Abedin, N.H.Z.; Mohammed, N.K.; Abadl, M.M.T.; Roby, B.H.M.; Hussin, A.S.M. Optimized supercritical CO2 extraction conditions on yield and quality of torch ginger (Etlingera elatior (Jack) RM Smith) inflorescence essential oil. Ind. Crops Prod. 2020, 154, 112581. [Google Scholar] [CrossRef]
  23. Pandey, S.M.; Mishra, H.N. Optimization of the prebiotic & probiotic concentration and incubation temperature for the preparation of synbiotic soy yoghurt using response surface methodology. LWT-Food Sci. Technol. 2015, 62, 458–467. [Google Scholar]
  24. Wu, S.; Li, D.; Li, S.-J.; Bhandari, B.; Yang, B.-l.; Chen, X.D.; Mao, Z.-H. Effects of incubation temperature, starter culture level and total solids content on the rheological properties of yogurt. Int. J. Food Eng. 2009, 5, 1–17. [Google Scholar] [CrossRef]
  25. Wojdyło, A.; Nowicka, P.; Bąbelewski, P. Phenolic and carotenoid profile of new goji cultivars and their anti-hyperglycemic, anti-aging and antioxidant properties. J. Funct. Foods 2018, 48, 632–642. [Google Scholar] [CrossRef]
  26. Khan, I.T.; Nadeem, M.; Imran, M.; Ullah, R.; Ajmal, M.; Jaspal, M.H. Antioxidant properties of Milk and dairy products: A comprehensive review of the current knowledge. Lipids Health Dis. 2019, 18, 41. [Google Scholar] [CrossRef] [PubMed]
  27. Ozcan, T.; Sahin, S.; Akpinar-Bayizit, A.; Yilmaz-Ersan, L. Assessment of antioxidant capacity by method comparison and amino acid characterisation in buffalo milk kefir. Int. J. Dairy Technol. 2019, 72, 65–73. [Google Scholar] [CrossRef]
  28. Guzel-Seydim, Z.B.; Kok-Tas, T.; Greene, A.K.; Seydim, A.C. Review: Functional Properties of Kefir. Crit. Rev. Food Sci. Nutr. 2011, 51, 261–268. [Google Scholar] [CrossRef] [PubMed]
  29. John, S.M.; Deeseenthum, S. Properties and benefits of kefir-A review. Songklanakarin J. Sci. Technol. 2015, 37, 275–282. [Google Scholar]
  30. Santos, A.; San Mauro, M.; Sanchez, A.; Torres, J.; Marquina, D. The antimicrobial properties of different strains of Lactobacillus spp. isolated from kefir. Syst. Appl. Microbiol. 2003, 26, 434–437. [Google Scholar] [CrossRef]
  31. Kim, D.-H.; Jeong, D.; Kim, H.; Kang, I.-B.; Chon, J.-W.; Song, K.-Y.; Seo, K.-H. Antimicrobial Activity of Kefir against Various Food Pathogens and Spoilage Bacteria. Korean J. Food Sci. Anim. Resour. 2016, 36, 787–790. [Google Scholar] [CrossRef]
  32. Stoffels, G.; Nissen-Meyer, J.; Gudmundsdottir, A.; Sletten, K.; Holo, H.; Nes, I. Purification and characterization of a new bacteriocin isolated from a Carnobacterium sp. Appl. Environ. Microbiol. 1992, 58, 1417–1422. [Google Scholar] [CrossRef]
  33. Mishra, A.; Gauri, S.S.; Mukhopadhyay, S.K.; Chatterjee, S.; Das, S.S.; Mandal, S.M.; Dey, S. Identification and structural characterization of a new pro-apoptotic cyclic octapeptide cyclosaplin from somatic seedlings of Santalum album L. Peptides 2014, 54, 148–158. [Google Scholar] [CrossRef]
  34. Hilpert, K.; Elliott, M.; Jenssen, H.; Kindrachuk, J.; Fjell, C.D.; Körner, J.; Ulrich, A.S. Screening and characterization of surface-tethered cationic peptides for antimicrobial activity. Chem. Biol. 2009, 16, 58–69. [Google Scholar] [CrossRef]
  35. Guo, Y.; Huang, E.; Yuan, C.; Zhang, L.; Yousef, A.E. Isolation of a Paenibacillus sp. strain and structural elucidation of its broad-spectrum lipopeptide antibiotic. Appl. Environ. Microbiol. 2012, 78, 3156–3165. [Google Scholar] [CrossRef] [PubMed]
  36. Arulrajah, B.; Muhialdin, B.J.; Zarei, M.; Hasan, H.; Saari, N. Lacto-fermented Kenaf (Hibiscus cannabinus L.) seed protein as a source of bioactive peptides and their applications as natural preservatives. Food Control 2020, 110, 106969. [Google Scholar] [CrossRef]
  37. Hancock, R.E.; Sahl, H.-G. Antimicrobial and host-defense peptides as new anti-infective therapeutic strategies. Nat. Biotechnol. 2006, 24, 1551–1557. [Google Scholar] [CrossRef] [PubMed]
  38. Muhialdin, B.J.; Hassan, Z.; Abu Bakar, F.; Algboory, H.L.; Saari, N. Novel antifungal peptides produced by Leuconostoc mesen-teroides DU15 effectively inhibit growth of Aspergillus niger. J. Food Sci. 2015, 80, M1026–M1030. [Google Scholar] [CrossRef] [PubMed]
  39. Guilhelmelli, F.; Vilela, N.; Albuquerque, P.; Derengowski, L.; Silva-Pereira, I.; Kyaw, C. Antibiotic development challenges: The various mechanisms of action of antimicrobial peptides and of bacterial resistance. Front. Microbiol. 2013, 4, 353. [Google Scholar] [CrossRef] [PubMed]
  40. Wang, G.; Li, X.; Wang, Z. APD3: The antimicrobial peptide database as a tool for research and education. Nucleic Acids Res. 2016, 44, D1087–D1093. [Google Scholar] [CrossRef]
  41. Feng, L.; Zhao, S.; Chen, G.; Jiang, W.; Liu, Y.; Jiang, J.; Zhou, X. Antioxidant status of serum, muscle, intestine and hepatopancreas for fish fed graded levels of biotin. Fish Physiol. Biochem. 2014, 40, 499–510. [Google Scholar] [CrossRef]
  42. Qudah, K.M.; Ismail, Z.B. The relationship between serum biotin and oxidant/antioxidant activities in bovine lameness. Res. Vet. Sci. 2012, 92, 138–141. [Google Scholar] [CrossRef]
  43. Ma, N.; Abaker, J.A.; Bilal, M.S.; Dai, H.; Shen, X. Sodium butyrate improves antioxidant stability in sub-acute ruminal acidosis in dairy goats. BMC Vet. Res. 2018, 14, 275. [Google Scholar] [CrossRef]
  44. Manyam, B.V.; Katz, L.; Hare, T.A.; Kaniefski, K.; Tremblay, R.D. Isoniazid-induced elevation of CSF GABA levels and effects on chorea in Huntington’s disease. Ann. Neurol. Off. J. Am. Neurol. Assoc. Child Neurol. Soc. 1981, 10, 35–37. [Google Scholar] [CrossRef]
  45. Bown, A.W.; Shelp, B.J. The Metabolism and Functions of [gamma]-Aminobutyric Acid. Plant Physiol. 1997, 115, 1–5. [Google Scholar] [CrossRef] [PubMed]
  46. Siragusa, S.; De Angelis, M.; Di Cagno, R.; Rizzello, C.G.; Coda, R.; Gobbetti, M. Synthesis of γ-aminobutyric acid by lactic acid bacteria isolated from a variety of Italian cheeses. Appl. Environ. Microbiol. 2007, 73, 7283–7290. [Google Scholar] [CrossRef] [PubMed]
  47. Muhialdin, B.J.; Kadum, H.; Zarei, M.; Hussin, A.S. Effects of metabolite changes during lacto-fermentation on the biological activity and consumer acceptability for dragon fruit juice. LWT 2020, 121, 108992. [Google Scholar] [CrossRef]
  48. Del Valle, M.J.; Laiño, J.E.; de LeBlanc, A.D.M.; de Giori, G.S.; LeBlanc, J.G. (Soyamilk fermented with riboflavin-producing Lactobacillus plantarum CRL 2130 reverts and prevents ariboflavinosis in murine models. Br. J. Nutr. 2016, 116, 1229–1235. [Google Scholar] [CrossRef]
  49. Zhu, Y.-Y.; Thakur, K.; Feng, J.-Y.; Cai, J.-S.; Zhang, J.-G.; Hu, F.; Wei, Z.-J. Riboflavin-overproducing lactobacilli for the enrich-ment of fermented soymilk: Insights into improved nutritional and functional attributes. Appl. Microbiol. Biotechnol. 2020, 104, 5759–5772. [Google Scholar] [CrossRef] [PubMed]
Figure 1. Response surface plots illustrating the combined effects of time, inoculum size, and temperature on coconut milk kefir with regard to pH (AC), DPPH (DF), ABTS+ (GI), and FRAP (JL).
Fermentation 09 00430 g001
Figure 2. Response surface plots illustrating the combined effects of time, inoculum size, and temperature on coconut milk kefir concerning antimicrobial activity against B. subtilis (AC), Salmonella Typhimurium (DF), E. coli (GI), and S. aureus (JL).
Fermentation 09 00430 g002
Figure 3. 1H-NMR metabolomics profiling of coconut milk kefir (CMK) and coconut milk (CM).
Fermentation 09 00430 g003
Table 1. Experimental range and levels of independent variables.
FactorsCodeVariable Levels
−10+1
Temperature (°C)x1253035
Inoculum size (g/100 mL)x21.83.65.4
incubation time (h)x361830
Table 2. Box–Behnken design (BBD) for the observed responses under different experimental conditions.
Runx1x2x3Responses
CA
(°C)
CA (g/100 mL)CA
(h)
y1y2
(%)
y3
(%)
y4 (mmol Fe(II)/10 mL)y5
(%)
y6
(%)
y7
(%)
y8
(%)
1−125−11.80184.6570.23245.611384.64885.9087.7895.6584.61
2+135−11.80184.0471.37040.214296.68599.6499.28100.0096.22
3−125+15.40184.0072.65260.113445.389100.0099.2199.65100.00
4+135+15.40183.9868.66332.806491.68594.8699.9799.9795.61
5−12503.6−165.2268.01424.435217.79662.4367.5468.1565.04
6+13503.6−165.1269.25427.153211.13083.4178.7071.7682.75
7−12503.6+1303.9968.87725.481365.94491.2998.6299.7389.22
8+13503.6+1303.7067.98925.241257.79682.4385.0292.9179.31
9030−11.8065.6067.94324.559144.09376.4070.3669.2274.68
10030+15.4064.9971.42126.574245.38983.0689.7499.8885.67
11030−11.8+1304.1568.50334.111237.61188.42100.0099.8286.59
12030+15.4+1303.8168.97232.816201.13081.7798.5898.0880.68
1303003.60184.3371.33247.574219.35298.5198.5799.8099.65
1403003.60184.2872.35445.639200.57498.9399.9999.9798.39
1503003.60184.2571.68547.287227.61197.8499.32100.0098.63
C coded values; A actual values temperature (x1); inoculum size (x2); incubation time (x3); pH (y1); DPPH scavenging activity (y2); ABTS+ scavenging activity (y3); FRAP (y4); antimicrobial activity against Bacillus subtilis (y5), Salmonella Typhimurium (y6), Escherichia coli (y7), and Staphylococcus aureus (y8).
Table 3. Analysis of variance and regression coefficients of the full quadratic model.
y1y2
(%)
y3
(%)
y4 (mmol Fe(II)/10 mL)y5
(%)
y6
(%)
y7
(%)
y8
(%)
RCPVRCPVRCPVRCPVRCPVRCPVRCPVRCPV
Intercept
Constant4.552 51.989 22.889 4711.20 −86.944 −211.86 23.730 −215.96
Linear
x10.2130.0530.4500.082−0.7560.105−297.750.0014.6440.00214.4380.0110.0370.93512.9920.008
x2−0.6080.0014.5270.0350.5430.655−125.120.06616.3770.0396.4210.0049.0340.01118.2320.006
x3−0.1410.0000.5540.0044.6710.00021.320.0137.9760.0007.7600.0005.1610.0008.4280.000
Quadratic
x1x1−0.0050.012 4.900.002 −0.2060.022 −0.1490.032
x2x2 20.470.035
x3x30.00240.000−0.0160.004−0.1250.000−0.520.020−0.1070.000−0.0840.000−0.08230.005−0.1110.000
Interaction
x1x20.01640.004−0.14240.042 −0.5240.045 −0.4440.021
x1x3 −0.1240.006−0.1030.008 −0.1150.002
x2x3 −0.2410.018−0.3750.027−0.1960.017
R299.04% 73.70% 79.13% 85.67% 91.99% 95.55% 83.80% 97.34%
R2-adjust98.33% 59.09% 70.79% 74.92% 85.99% 91.10% 74.80% 93.80%
p-value0.000 0.018 0.002 0.005 0.001 0.000 0.002 0.000
F value138.22 5.04 9.48 7.97 15.32 21.47 9.31 27.47
Lack of fit (p-value)0.223 0.167 0.024 0.056 0.014 0.031 0.000 0.044
Lack of fit (F-value)3.80 5.32 41.08 17.10 69.01 31.30 4161.17 21.81
Regression coefficient (RC); p-value (PV); temperature (x1); inoculum size (x2); incubation time (x3); pH (y1); DPPH scavenging activity (y2); ABTS+ scavenging activity (y3); FRAP (y4); antimicrobial activity against Bacillus subtilis (y5), Salmonella Typhimurium (y6), Escherichia coli (y7), and Staphylococcus aureus (y8).
Table 4. Predicted and experimental values of response variables.
Response VariablesGoalMaximum/Minimum Values
PredictedExperimental (n = 3)
pHIn range4.24.17 ± 0.21
DPPH scavenging activity (%)Maximize72.671.17 ± 3.67
ABTS+ scavenging activity (%)Maximize47.0643.63 ± 3.42
FRAP (mmol Fe(II)/10 mL)Maximize437.045419.6 ± 17.7
Antimicrobial activity against B. subtilis (%)Maximize93.190.4 ± 1.35
Antimicrobial activity against Salmonella Typhimurium (%)Maximize97.397.2 ± 1.54
Antimicrobial activity against E. coli (%)Maximize10099.6 ± 0.64
Antimicrobial activity against S. aureus (%)Maximize94.894.7 ± 1.65
All the values are means ± standard deviation.
Table 7. The chemical shifts and concentrations (mmol/L) of the metabolites identified in coconut milk kefir (CMK) and coconut milk (CM).
Metabolites1H-NMR Characteristic SignalsCMK CM
Butyrateδ 0.88 (t)0.0557ND
Threonineδ 1.316 (d)ND0.2543
Lactic acidδ 1.32 (d), δ 4.14 (q)1.0271ND
Alanineδ 1.46 (d)0.04420.1167
Biotinδ 1.61 (dd)0.0816ND
Caprylic acidδ 1.61 (br. S.)0.6683ND
4-Aminobutyrate (GABA)δ 1.89 (m), δ 2.28 (t), δ 3.00 (t)0.16420.0657
gamma-Butyrolactoneδ 2.24 (m)0.3383ND
3-Hydroxybutyrateδ 2.314 (m), δ 2.414 (m)ND0.3137
Malic acidδ 2.36 (dd), δ 2.66 (dd)ND0.2602
Riboflavinδ 2.5 (t)0.1440 ND
Lysineδ 3.02 (t)0.07080.1281
Cholineδ 3.189 (s), δ 3.507 (dd), δ 4.056 (m)0.02130.0157
Carnitineδ 3.22 (s)0.0101ND
Glucuronateδ 3.289 (t)2.52085.2900
Xyloseδ 3.42 (t), δ 3.51 (dd)2.30294.7923
Sucrose δ 3.67 (s), δ 3.87 (dd), δ 4.04 (t), δ 4.21 (d), 5.4 (d)2.05392.9443
2-Aminobutyrateδ 3.718 (dd)1.8177ND
Leucineδ 3.722 (m)ND1.8325
Guanidoacetateδ 3.78 (s)0.29670.9874
Ethanolamineδ 3.81 (d)0.2621.5021
Gluconate4.15 (d)0.30701.5317
O-Acetylcarnitineδ 5.57 (q)ND0.0176
Disclaimer/Publisher’s Note: The statements, opinions and data contained in all publications are solely those of the individual author(s) and contributor(s) and not of MDPI and/or the editor(s). MDPI and/or the editor(s) disclaim responsibility for any injury to people or property resulting from any ideas, methods, instructions or products referred to in the content.

