Article

Optimization Conditions for Ethanol Production from Sweet Sorghum Juice by Thermotolerant Yeast Saccharomyces cerevisiae: Using a Statistical Experimental Design

1
Department of Biotechnology, Faculty of Technology, Khon Kaen University, Khon Kaen 40002, Thailand
2
Walai Rukhavej Botanical Research Institute, Mahasarakham University, Maha Sarakham 44150, Thailand
3
Department of Biological Chemistry, Faculty of Agriculture, Yamaguchi University, Yamaguchi 753-8515, Japan
4
Research Center for Thermotolerant Microbial Resources, Yamaguchi University, Yamaguchi 753-8515, Japan
5
Center for Alternative Energy Research and Development (AERD), Khon Kaen University, Khon Kaen 40002, Thailand
*
Author to whom correspondence should be addressed.
Fermentation 2023, 9(5), 450; https://doi.org/10.3390/fermentation9050450
Submission received: 31 March 2023 / Revised: 27 April 2023 / Accepted: 8 May 2023 / Published: 9 May 2023
(This article belongs to the Section Industrial Fermentation)

Abstract

:
The optimum fermentation conditions for ethanol production from sweet sorghum juice (SSJ) by the thermotolerant yeast Saccharomyces cerevisiae DBKKUY-53 were determined using a statistical experimental design. Based on the Plackett–Burman design (PBD), yeast cell concentration, sugar concentration, and yeast extract were the significant independent fermentation factors affecting the ethanol production from SSJ at 37 °C by S. cerevisiae DBKKUY-53. These significant factors were optimized using response surface methodology (RSM) based on a central composite design (CCD). The result revealed that the optimum conditions for ethanol fermentation were 7.85 × 10⁷ cells/mL yeast cell concentration, 247 g/L sugar concentration, and 9.99 g/L yeast extract. Verification of the ethanol production using the optimum conditions revealed that the maximum ethanol concentration of 99.75 g/L and the productivity of 2.77 g/L/h were achieved. When the ethanol production was carried out in a 2 L fermentor under optimum conditions, the ethanol concentration was 101.81 g/L and the productivity was 2.83 g/L/h. This finding suggested that the thermotolerant yeast S. cerevisiae DBKKUY-53 has excellent potential for commercial ethanol production at high temperatures.

1. Introduction

Increasing crude oil prices and releasing carbon dioxide and other greenhouse gases into the atmosphere from fossil fuels made alternative biofuels more attractive. Several alternative biofuels, particularly bioethanol, and biodiesel, have been produced and used worldwide. Various renewable biomasses, such as agricultural crops and residues, agro-food and forestry residues, and urban wastes, can be used as feedstocks for biofuels and other bioproduct production via biorefinery platforms [1,2]. Concerning bioethanol, recent commercial production depends mainly on agricultural resources, specifically corn (in the USA), sugarcane (in Brazil), wheat, corn, and cassava (in China), and cassava and blackstrap molasses (in Thailand) [3]. In Thailand, the principal raw materials, cassava and blackstrap molasses, have been employed in various industrial sectors, including food, feed, organic acid, alcoholic beverages, and starch production. As a result, if demand for other industrial sectors exceeds demand for bioenergy production, an insufficient supply of these raw materials may have occurred. Recent research focuses on searching for renewable energy crops, and sweet sorghum (Sorghum bicolor L. Moench) has been identified as one of the high-potential alternative energy crops for bioethanol production due to its stalks containing highly soluble carbohydrates, specifically fermentable sugars such as sucrose, glucose, and fructose. In addition, the plant contains insoluble components such as cellulose and hemicellulose, which can be converted to ethanol via biorefinery platforms by valorizing lignocellulosic feedstock [1,2,4,5]. Sweet sorghum can be planted and harvested within 100−120 days, a shorter cultivation period than sugarcane [6,7]. Additionally, it can be cultivated in all climates and soil types and requires only a small amount of fertilizer while using 1/3 as much water as sugarcane [8]. Based on the literature review, sweet sorghum gave a high ethanol yield (600–650 gal/acre) compared with the ethanol yield from corn (450 gal/acre) [9].
In tropical and subtropical countries, including Thailand, the average daytime temperature is usually high throughout the year, reaching 41 °C in the summer [3]. Therefore, the ethanol-producing microorganisms should be tolerated and maintain their ability to produce ethanol at high temperatures. Ethanol production at high temperatures using thermotolerant ethanologenic microbes is one of the most effective platforms for increasing ethanol production efficiency, specifically in tropical and subtropical regions. This platform has several advantages, e.g., less cooling cost, a high production rate, and decreased bacterial contamination [10,11]. Furthermore, ethanol recovery during ethanol production at high temperatures using a gas stripping process to minimize the inhibitory effect of ethanol stress on microbial cells can also be practical. Several thermotolerant microbes, specifically thermotolerant yeasts for high-temperature ethanol fermentation, have been identified and proposed, such as Kluyveromyces marxianus [10,12,13], Pichia kudriavzevii [14,15,16,17], Saccharomyces cerevisiae [18,19], Candida glabrata [16], Meyerozyma guilliermondii [20], and Saccharomycodes ludwigii [21]. Among them, thermotolerant S. cerevisiae exhibits excellent potential in ethanol production using sugar-based materials as feedstock [11,18].
A “one-factor at a time” technique is traditionally used to optimize fermentation conditions [22]. However, this technique has several disadvantages, such as requiring many experimental sets, being time-consuming, and requiring more chemicals and materials. Furthermore, the interaction among factors cannot be evaluated [23]. Statistical experimental design methods have recently been widely used for fermentation optimization conditions, including the ethanol production process [14,18,19,20,24]. The advantages of using a statistical experimental design are minimizing the experimental number, reducing the chemicals and materials, evaluating the main interactive effects among each factor, and building a second-order polynomial equation to achieve the optimum fermentation conditions [25,26].
Many factors influence ethanol production, such as substrate concentration, microbial cell concentration, pH, nitrogen source, and macro- and micronutrient supplementation, and the impact of these factors on ethanol production performance depends on several factors, such as microbial species, fermentation conditions, and types of raw materials [14,18,19,20,24]. In a previous study, we successfully isolated thermotolerant yeast, namely S. cerevisiae DBKKUY-53, exhibiting the high potential to grow and produce ethanol at a high temperature of up to 40 °C, with an ethanol concentration of 85.01 g/L [11]. However, the optimization of fermentation conditions for ethanol production from SSJ by this newly isolated yeast using a statistical experimental design has not yet been evaluated. Therefore, this investigation aims to screen and optimize the fermentation conditions for high-temperature ethanol production from SSJ by the thermotolerant yeast S. cerevisiae DBKKUY-53. Based on the statistical experimental design, the critical and significant fermentation factors influencing ethanol production from SSJ by S. cerevisiae DBKKUY-53 at 37 °C were identified and optimized.

2. Materials and Methods

2.1. Chemicals and Culture Mediums

Yeast extract, malt extract, and peptone (bacteriological grade) were purchased from TM Media (Titan Biotech Ltd., Delhi, India). Glucose and sodium chloride (analytical grade) were obtained from KemAusTM, New South Wales, Australia. Isopropanol and ethanol (HPLC grade) were procured from Sigma Aldrich Corporation, St. Louis, MI, USA. Ammonium nitrate, urea, diammonium phosphate, and magnesium sulfate (analytical grade) were obtained from Sigma Aldrich Corporation, St. Louis, MI, USA. A yeast extract malt extract (YM) medium comprising 3 g/L yeast extract, 3 g/L malt extract, 5 g/L peptone, and 10 g/L glucose was used to cultivate yeast cells.

2.2. Plant Material

The sweet sorghum (cv. KKU 40) used in this study was obtained from the Faculty of Agriculture, Khon Kaen University, Thailand. After extracting the juice from its stalks, the sugar content in the juice was concentrated by evaporation to 75 °Brix, and the resulting syrup was kept at −18 °C until use.

2.3. Microorganism and Inoculum Preparation

Thermotolerant yeast S. cerevisiae DBKKUY-53 isolated from soil samples [11] was used in the current study. The yeast cells were grown in YM medium and incubated in a controlled incubator shaker (JSR, Gongju, Republic of Korea) at 150 rpm and 30 °C for 15 h. After that, the active yeast cells (5% v/v) were transferred into SSJ containing 100 g/L total sugar and incubated in a controlled incubator shaker at 150 rpm and 30 °C. After 12 h of incubation, the yeast cells were collected by centrifugation at 5000 rpm for 10 min at 20 °C. The resulting cells were resuspended in 0.85% (w/v) NaCl and used as a starter culture for ethanol fermentation throughout the experiments.

2.4. Fermentation Conditions

For screening and optimization experiments, the ethanol fermentation was carried out in batch mode under static conditions at 37 °C. The ethanol fermentation medium comprising SSJ as a raw material was prepared based on the statistical experimental design and transferred into a 500 mL air-locked Erlenmeyer flask with a final working volume of 400 mL. For the verification experiment, the ethanol fermentation was carried out in a 2 L fermenter (Biostat®B, B. Braun Biotech, Melsungen, Germany) with a 1.5 L working volume using the optimum fermentation conditions obtained from the experimental design. The fermentation was conducted at 37 °C with an agitation rate of 100 rpm for 72 h. During fermentation, the samples were withdrawn and subjected to ethanol analysis.

2.5. Screening of the Fermentation Factors Affecting Ethanol Production by S. cerevisiae DBKKUY-53 at 37 °C

The most significant independent fermentation variables or factors affecting ethanol production from SSJ by thermotolerant yeast S. cerevisiae DBKKUY-53 at 37 °C were screened using the Plackett–Burman design (PBD) [27]. Based on the literature review, eight independent fermentation factors, including initial sugar concentration [11,18], initial pH [18,19,20], initial cell concentration [18,19], ammonium nitrate [28], urea [11,29], yeast extract [11,19,30], diammonium phosphate [28], and magnesium sulfate [19,20,31], were investigated. Based on the PBD, twelve experimental runs were generated. The experimental codes and actual values (high and low) of each independent factor for the PBD are presented in Table 1. The effect of independent factors was evaluated by Equation (1) as follows:
E ( x i ) = 2 ( M i + M i ) N
where E ( x i )   represents the concentration effect of the tested factors, M i + and M i are the responses from experimental runs where the factor X i   was measured at high and low levels, respectively, and N is the number of experimental runs. The experimental error of dummy factors or variables, the numerical variables used in regression analysis, was calculated by Equation (2):
V e f f = ( E d ) 2 n
where V e f f represents the variance of the concentration effect of dummy variables, E d is the concentration effect of the dummy variables, and n is the number of dummy variables. The standard error (SE) of the concentration effect was the square root of the variance of the effect. The Student’s t-test was performed as follows (Equation (3)) to determine the significance level (p value) of each factor.
t ( x i ) = E ( x i ) S E
where E ( x i ) represents the concentration effect of the factor xi. The Design-Expert 7.0.0 Demo version (Stat-Ease Inc., Minneapolis, MN, USA) was used to evaluate the analysis of variance (ANOVA) and perform a regression analysis for constructing the second-order polynomial equation and significant terms.

2.6. Optimization Conditions for Ethanol Production from SSJ by S. cerevisiae DBKKUY-53 at 37 °C

The significant independent fermentation factors influencing ethanol production from SSJ by thermotolerant S. cerevisiae DBKKUY-53 at 37 °C screened and selected based on the PBD, including cell concentration, sugar concentration, and yeast extract, were subjected to optimization experiments using the central composite design (CCD). The experimental codes and actual values of these significant factors for CCD design are summarized in Table 2. Regression analysis was performed on the data generated from the experimental design using the Design-Expert 7.0.0 Demo version (Stat-Ease Inc., Minneapolis, MN, USA). The predictive model of the design was presented as a second-order polynomial function as Equation (4):
Y = β 0 + β i X i     + β i i X i 2 + β i j X i X j
where Y is the predicted response, X i and X j are the independent variables, β 0 is a constant term, β i represents the linear coefficients, β i i represents the squared coefficients, and β i j represents the cross-product or interaction coefficients.
An ANOVA was determined to evaluate the statistically significant independent factors using the Design-Expert 7.0.0 Demo version. The coefficient of determination (R2) was used to express the quality of the experimental design. A verification experiment was performed using the optimized fermentation conditions determined from the response surface plots and equations established from the statistical experimental model.

2.7. Analytical Methods

The viable yeast cell numbers were analyzed by a direct microscopic method using a hemocytometer (Boeco, Hamburg, Germany, and the total soluble solids of the fermentation medium were determined using a hand-held refractometer (Atago, Tokyo, Japan) [32]. The fermentation broth was centrifuged at 13,000 rpm for 10 min, and the supernatant was then analyzed for total residual sugars by the phenol sulfuric acid method [33]. Ethanol concentration (P, g/L) was analyzed by gas chromatography (GC) (Shimadzu GC-14B, Kyoto, Japan) using a polyethylene glycol (PEG-20 M) packed column and flame ionization detector. Nitrogen was used as a carrier gas, and 2-propanol was used as an internal standard [30]. The volumetric ethanol productivity (Qp, g/L/h) was calculated by the following equations: Qp = P/t, where P is the ethanol concentration (g/L) and t is the fermentation time (h), giving the highest ethanol concentration. The ethanol yield (Yp/s, g/g) was calculated as the actual ethanol produced per sugar consumed. All experiments were performed in duplicate and repeated twice. The experimental data were presented as mean ± standard deviation (SD).

3. Results and Discussion

3.1. Screening of the Fermentation Factors Affecting Ethanol Production from SSJ at 37 °C by Thermotolerant S. cerevisiae DBKKUY-53 Using PBD

Screening of the significant independent fermentation factors affecting ethanol production from SSJ at 37 °C by thermotolerant yeast S. cerevisiae DBKKUY-53 was carried out by PBD, one of the power tools for screening and selection of the most significant factors for the production process [27]. Based on the PBD, 12 experimental runs were performed to evaluate the effect of each independent factor on ethanol production, and the response values, i.e., ethanol concentrations and productivities from the predicted and experimental or actual values, are summarized in Table 3. The actual ethanol contents obtained in this study ranged from 59.56 g/L to 90.96 g/L, which was relatively close to the model or predicted values (60.75−92.15 g/L). Similarly, the actual ethanol productivities ranged from 1.22 g/L/h to 3.75 g/L/h, in line with the predicted values (1.04−3.57 g/L/h).
An ANOVA was carried out and summarized in Table 4. The results revealed that the most significant independent factors influencing ethanol concentration screened from the p values of each factor were sugar concentration (A), cell concentration (C), and yeast extract (F), while those affecting ethanol productivity were cell concentration (C) and yeast extract (F). Based on the p values of these independent factors, sugar (A) and cell concentrations (C) had a more pronounced effect on ethanol concentration than yeast extract (F). Likewise, cell concentration (C) also exhibited a more pronounced impact on ethanol productivity than yeast extract (F). Based on these findings, three significant independent factors, including sugar concentration (A), cell concentration (C), and yeast extract (F), were selected for further optimization experiments using response surface methodology (RSM) based on the CCD.

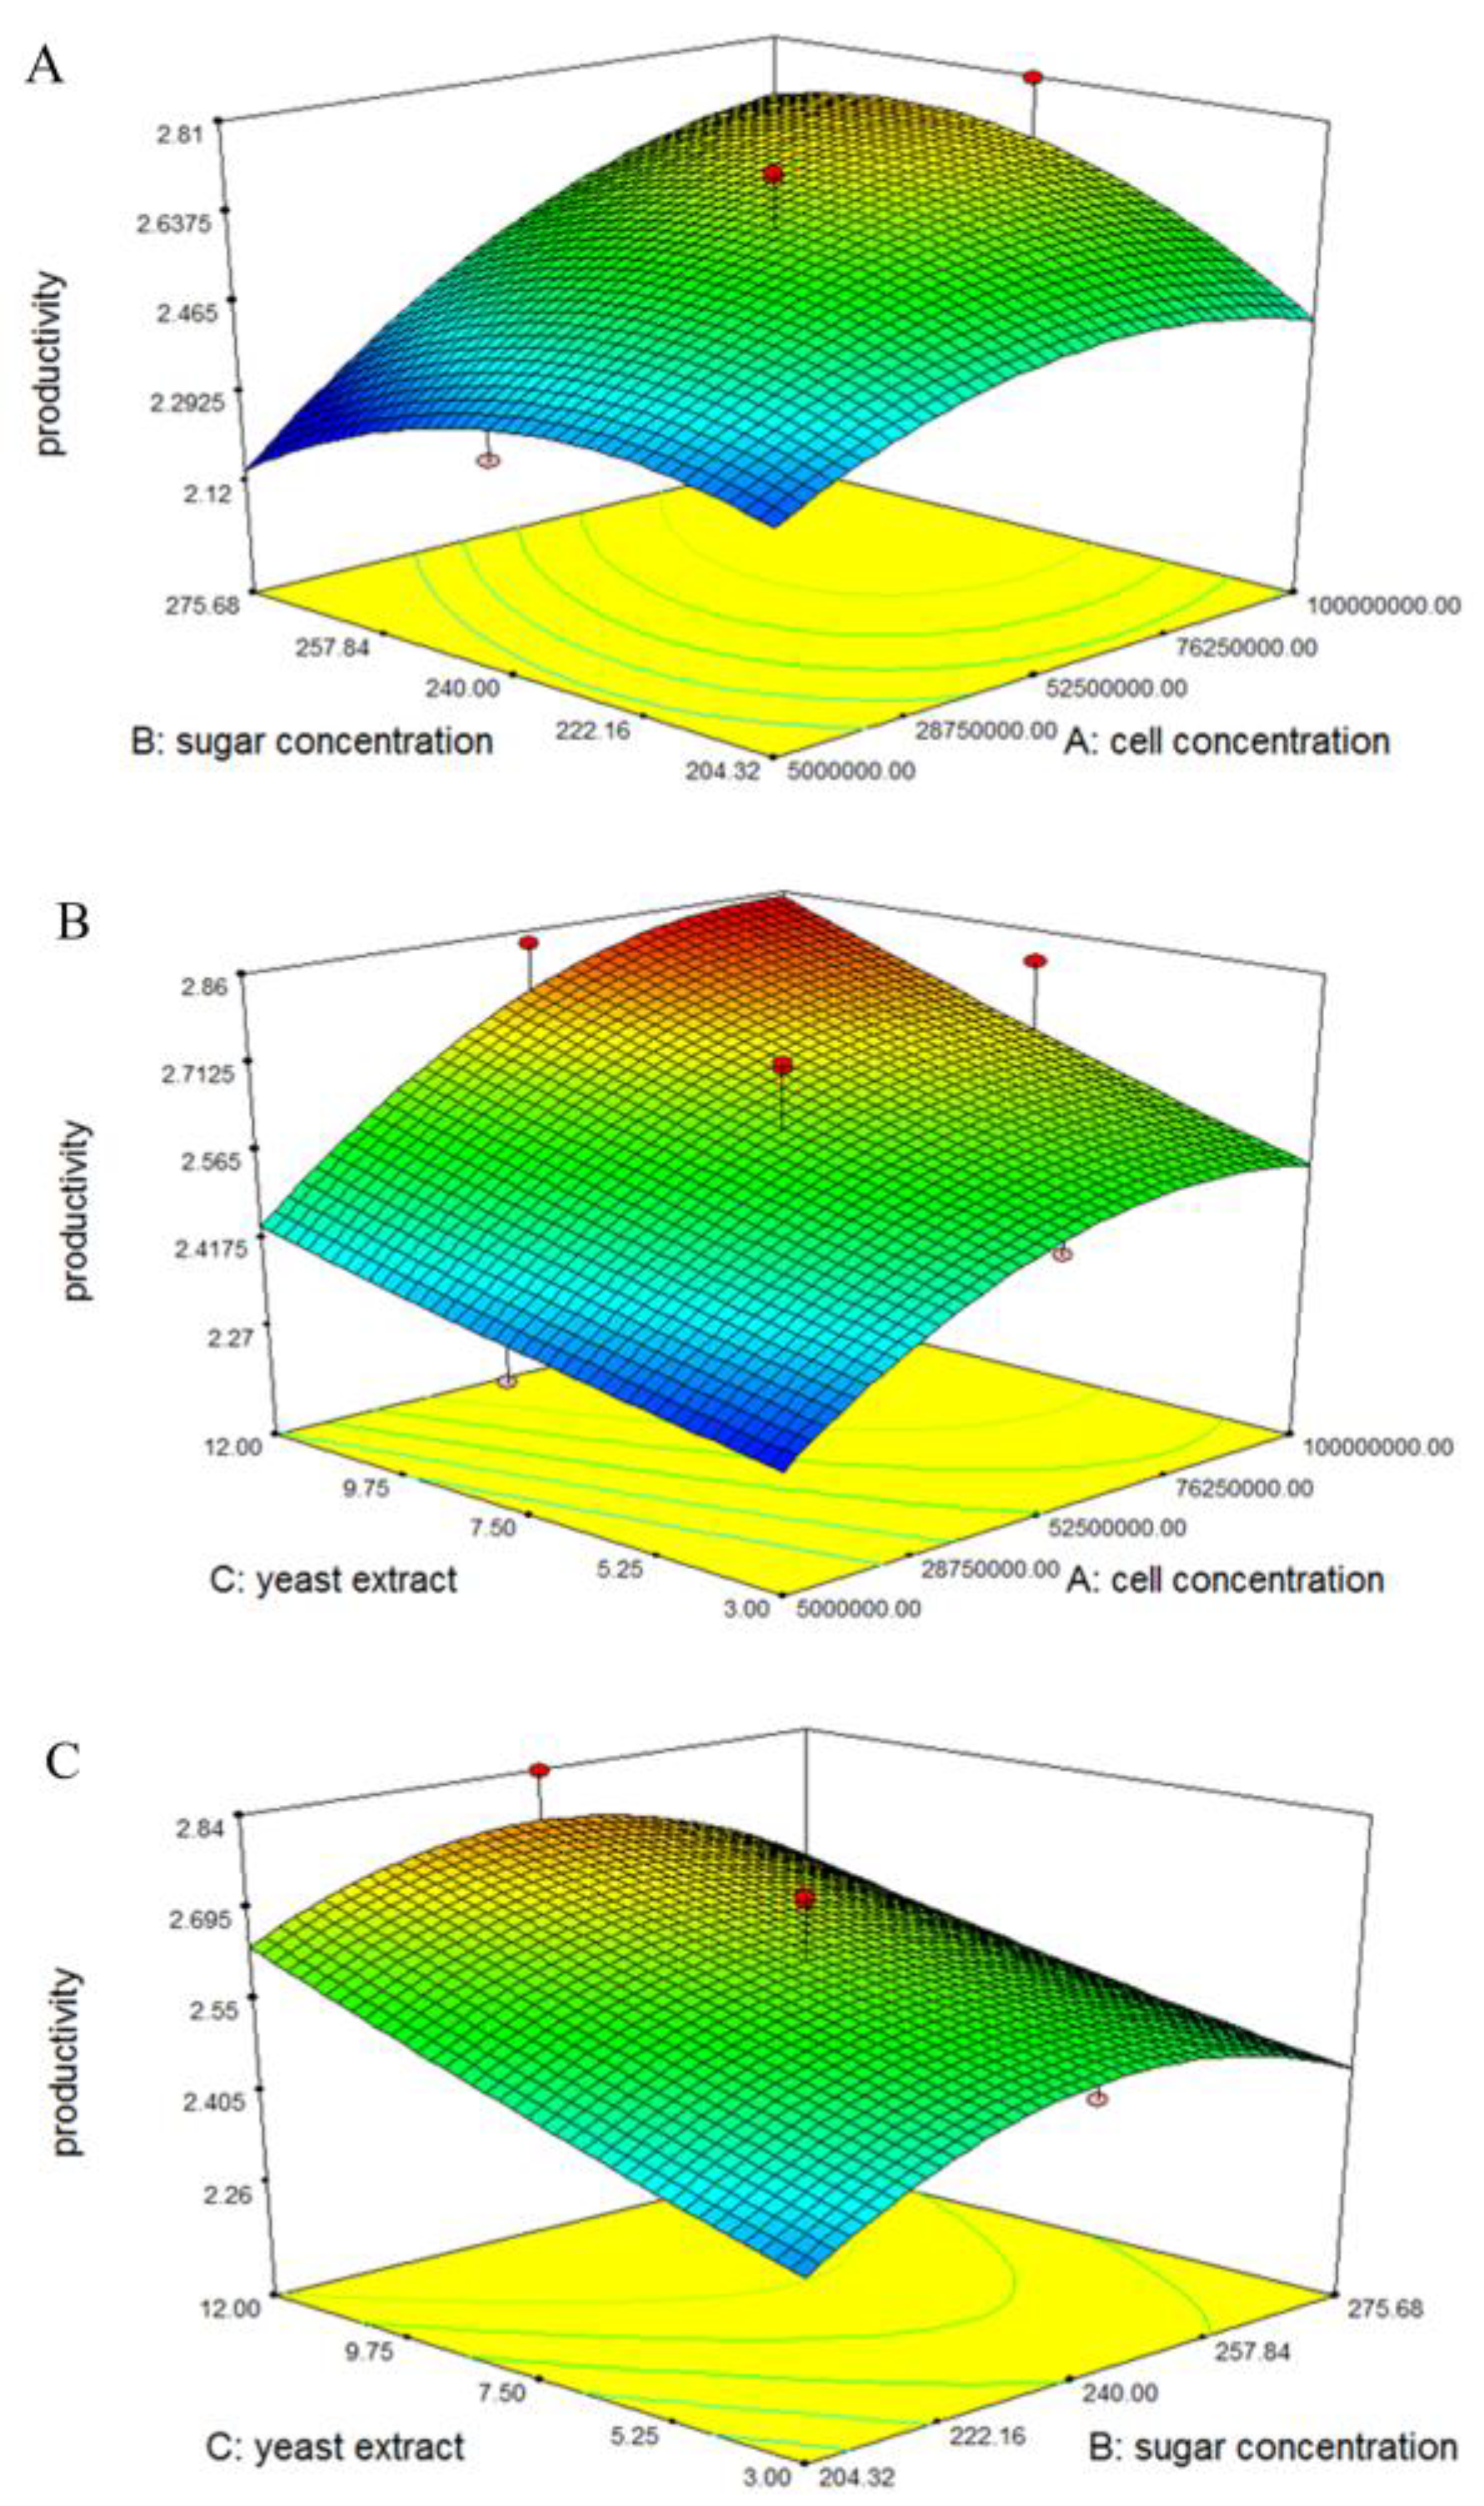
3.2. Optimization of Fermentation Conditions for Ethanol Production from SSJ at 37 °C by Thermotolerant S. cerevisiae DBKKUY-53 Using CCD

The RSM based on the CCD was applied to evaluate the optimal values and interaction effects of the selected significant independent factors, i.e., cell concentration (A), sugar concentration (B), and yeast extract (C), influencing ethanol production at 37 °C by S. cerevisiae DBKKUY-53. The CCD matrices comprise 19 experimental runs, and the predicted and actual values of ethanol concentrations and productivities are shown in Table 5. Regarding the ethanol concentrations from all experimental runs, the actual values varied from 81.42 g/L to 102.14 g/L, closely related to the predicted values (80.60−99.23 g/L). The highest ethanol titer was detected in run no. 17 (5.25 × 10⁷ cell concentration, 240 g/L sugar concentration, and 12 g/L yeast extract), while the lowest was observed in run no. 11 (5.25 × 10⁷ cell concentration, 180 g/L sugar concentration, and 7.5 g/L yeast extract). A three-factor quadratic polynomial equation for predicting the ethanol concentration as a function of cell concentration, sugar concentration, and yeast extract was generated using the experimental data from the CCD experiment, and the resulting equation (Equation (5)) was as follows:
P (g/L) = 94.69 + 3.6A + 2.54C − 4.53B2
where P is ethanol concentration (g/L), and A, B, and C are the code factors of cell concentration, sugar concentration, and yeast extract, respectively.
The statistical ANOVA was evaluated using the Fisher’s F-test, and the results are presented in Table 6. The results demonstrated that the established model was statistically significant, with a p value less than 0.05 (0.0044), while the p value of the lack of fit for the established model was greater than 0.05 (0.4813), indicating that the model was reliable. The good fit of the model can be determined from the coefficient of determination (R2 value), which should be close to 1.0. In this study, the R2 value was 0.85, implying that the established model could explain 85% of the ethanol concentration. Based on the ANOVA, the linear terms of A and C and the quadratic term of B2 were statistically significant since the p values were less than 0.05, indicating that cell concentration, sugar concentration, and yeast extract strongly affect ethanol production by thermotolerant S. cerevisiae DBKKUY-53 in terms of ethanol content.
The interactive effect of cell concentration, sugar concentration, and yeast extract on the ethanol concentration produced by S. cerevisiae DBKKUY-53 was determined using three-dimensional (3-D) response surfaces and contour plots (Figure 1). Figure 1A illustrates the effect of cell and sugar concentrations on ethanol content when yeast extract was fixed at the center level. The results revealed that increasing the cell concentration to a maximum value and the sugar concentration to approximately 240 g/L gave the highest value of ethanol content. Sugar concentrations higher than 240 g/L reduced ethanol concentration, possibly due to the synergetic effect of a high-temperature condition and high osmotic pressure [10,13]. The effect of cell concentration and yeast extract on ethanol production when sugar concentration was fixed at the center point was summarized in Figure 1B. It was found that ethanol concentration increased when initial cell concentration and yeast extract were increased, suggesting the positive effect of these two factors on ethanol production by S. cerevisiae DBKKUY-53. Increasing the sugar concentration or yeast extract to maximum levels did not enhance the ethanol concentration, specifically when yeast cells were fixed at the center point (Figure 1C). Based on the 3-D response surfaces, contour plots, and ANOVA data of the CCD experiment, sugar concentration seems to be the major factor affecting ethanol concentration, followed by cell concentration and yeast extract. The p values of these significant factors were 0.0005, 0.0026, and 0.0201, respectively, significantly lower than 0.05.
Concerning ethanol productivity, the experimental values varied from 2.26 g/L/h to 2.84 g/L/h, in line with the predicted values (2.24−2.75 g/L/h) (Table 5). The highest and lowest ethanol productivities were detected in experimental runs 17 and 11, respectively. The experimental data were further used to generate a three-factor quadratic polynomial equation for predicting ethanol productivity as a function of cell concentration, sugar concentration, and yeast extract, and the predicted equation (Equation (6)) was as follows:
Qp (g/L/h) = 2.63 + 0.10A + 0.07C – 0.13B2
where Qp is ethanol productivity (g/L/h), and A, B, and C are the code factors of cell concentration, sugar concentration, and yeast extract, respectively. The ANOVA was conducted, and the results revealed that the model was highly significant (p value less than 0.05) (Table 7). Additionally, the lack of fit of the model was not statistically significant (p value higher than 0.05), suggesting that the established model was reliable and could be used to predict the response variable in this study. The model’s coefficient of determination (R2) was relatively high (0.85), indicating a high accuracy between the experimental or actual and predicted values and a high accuracy of the model to explain the response variable, i.e., ethanol productivity. The linear terms of cell concentration (A) and yeast extract (C) and the quadratic term of sugar concentration (B2) exhibited statistical significance since the p values were lower than 0.05, indicating that these three independent factors significantly affect ethanol productivity; specifically, sugar concentration has a stronger impact on ethanol productivity than others.
The 3-D response surfaces and contour plots were generated based on the established model and experimental data from the CCD experiment to observe the interactive effect of cell concentration, sugar concentration, and yeast extract on ethanol productivity (Figure 2). When yeast extract is fixed at the center point, increase the concentrations of yeast cells to a maximum value and sugar to approximately 240 g/L, yielding the highest ethanol productivity. A slight decrease in ethanol productivity was detected when the sugar concentration exceeded 240 g/L (Figure 2A). Figure 2B illustrates the effect of cell concentration and yeast extract on ethanol productivity. Increasing the concentrations of microbial cells and yeast extract while the sugar concentration was fixed at the center point, led to an increase in ethanol productivity, in line with the ethanol concentration observed in Figure 1B. The ethanol productivity slightly increased when cell concentration was fixed, sugar concentration was increased to a middle level (approximately 240 g/L), and yeast extract was increased to a maximum value (12 g/L) (Figure 2C).
Apart from ethanol concentration and productivity, the ethanol yield of the experimental values for the CCD experiments was also determined. As shown in Table 5, the ethanol yield ranged from 0.35 g/g to 0.49 g/g, depending on the combinations of each factor, with experimental runs 17 and 13 giving the highest and lowest values, respectively. It should be noted in the current study that high concentrations of sugar or low concentrations of yeast cells tend to provide a low level of ethanol yield at 37 °C.
The optimum conditions for ethanol production from SSJ at 37 °C by thermotolerant S. cerevisiae DBKKUY-53 were determined using the second-order polynomial equation for ethanol concentration (Equation (5)) and productivity (Equation (6)). As a result, a cell concentration of 7.85 × 10⁷ cells/mL, a sugar concentration of 247 g/L, and yeast extract at a concentration of 9.99 g/L were found to be the optimum conditions. A verification experiment in a 500 mL Erlenmeyer flask was performed using the optimum conditions obtained from the second-order polynomial model, and the maximum ethanol concentration of 99.75 g/L and productivity of 2.77 g/L/h were achieved in the current study, which was relatively close to the predicted values (97.12 g/L ethanol concentration and 2.70 g/L/h ethanol productivity). A further experiment in a 2 L fermenter was also carried out to validate the optimum conditions for ethanol production from SSJ by S. cerevisiae DBKKUY-53. As a result, a maximum ethanol concentration of 101.81 g/L and a productivity of 2.83 g/L/h were attained, slightly higher than the predicted values and the values detected on a flask scale, possibly due to the appropriate mixing and aeration in the fermenter system.
The ethanol production profile of S. cerevisiae DNKKUY-53 in a 2 L fermenter is illustrated in Figure 3. The ethanol concentration increased sharply and reached a maximum value at 36 h of fermentation, with an ethanol yield of 0.45 g/g, corresponding to 88.24% fermentation efficiency. On the other hand, the sugar concentration decreased in parallel with an increase in ethanol concentration, and the remaining sugar in the fermentation medium was 22.96 g/L (Figure 3A). The viable cells increased during the first 24 h, slightly decreased, and reached a low level at 60 h after fermentation (Figure 3B). A reduction in viable yeast cells might be due to an adverse effect of ethanol and high-temperature stress on cell growth and metabolic activity in yeast cells, similar to those reported by Limtong et al. [10], Nuanpeng et al. [11], Pilap et al. [21], and Tofighi et al. [34]. A comparative analysis of ethanol production from SSJ by S. cerevisiae DBKKUY-53 with other yeast species using SSJ as feedstock was performed, and the results revealed that the ethanol concentration and productivity produced by this thermotolerant yeast were higher than those of S. cerevisiae NRRL Y-2034 [35], S. cerevisiae SEMF1 [36], and S. cerevisiae KKU-VN8 [18].
The current study demonstrated that cell concentration, sugar concentration, and yeast extract significantly affected the ethanol production from SSJ at 37 °C by thermotolerant S. cerevisiae DBKKUY-53. It has been previously reported that an initial cell concentration affects microbial cell growth and fermentation metabolic activity, specifically sugar consumption and fermentation rate. Increasing the yeast cell concentration reduces the lag phase of cell growth and increases the rate of sugar consumption, resulting in high ethanol productivity and yield [11,18]. The optimum cell concentration for ethanol production from SSJ by S. cerevisiae DBKKUY-53 at 37 °C was 7.85 × 10⁷ cells/mL, in good agreement with Charoensopharat et al. [12], Techaparin et al. [18], and Phong et al. [19].
Concerning sugar concentration, it impacts both microbial cell growth and ethanol fermentation efficiency. High sugar concentrations caused osmotic pressure, reducing cell growth, viability, and enzyme activity in the ethanol production pathway, resulting in low ethanol concentration, productivity, and yield [37,38]. This study also showed that ethanol concentration and productivity decreased when the sugar concentration of the fermentation medium increased. Practically, the sugar concentrations used for industrial ethanol production are often less than 200 g/L. In this study, the thermotolerant yeast S. cerevisiae DBKKUY-53 could withstand and produce a high ethanol concentration and productivity at a sugar concentration of 247 g/L, suggesting its potential for very high-gravity ethanol fermentation at a relatively high temperature.
Apart from being a carbon source, nitrogen is also one of the most critical factors affecting ethanol production. Both organic and inorganic nitrogen have been used as nitrogen sources for microbial growth and ethanol fermentation, and their impact on ethanol production depends on several factors, specifically microbial species, types of feedstock, and fermentation conditions. For instance, Li et al. [39] reported that ammonium sulfate improved ethanol production by S. cerevisiae under very high gravity fermentation using corn starch as feedstock. Another study by Laopaiboon et al. [30] pointed out that yeast extract supplementation improved the ethanol production by S. cerevisiae NP01 under very high gravity fermentation using SSJ as feedstock. Recently, Phong et al. [19] demonstrated that inorganic nitrogen, including ammonium nitrate, ammonium sulfate, diammonium phosphate, and urea, did not improve ethanol production. However, yeast extract at 4.95 g/L could enhance ethanol production by S. cerevisiae at 40 °C using pineapple waste hydrolysate as a raw material. In the current study, yeast extract significantly affected ethanol production from SSJ at 37 °C by S. cerevisiae DBKKUY-53. The optimum yeast extract concentration was 9.99 g/L, similar to that reported by Deesuth et al. [40].
According to our previous studies, the newly isolated thermotolerant yeast S. cerevisiae DBKKUY-53 exhibited an ability to withstand a high temperature of up to 45 °C, and it can also produce relatively higher ethanol concentrations, especially at 37 °C and 40 °C, than S. cerevisiae SC90, one of the industrial yeast strains typically used for ethanol production on a commercial scale in Thailand [11]. Furthermore, the thermotolerant yeast S. cerevisiae DBKKUY-53 also exhibited high ethanol production performance via an immobilized system using alginate-loofah matrices [24]. In this study, the thermotolerant yeast could withstand high sugar concentrations and produce high levels of ethanol concentration (101.81 g/L) and productivity (2.83 g/L/h) at 37 °C under optimal fermentation conditions, suggesting its potential for very high-gravity ethanol production at high-temperature conditions. Considering the potential of the thermotolerant yeast S. cerevisiae DBKKUY-53 demonstrated in previous and current studies, this yeast strain can be a good candidate for high-temperature ethanol production using agricultural products as feedstocks at a commercial scale.

4. Conclusions

High ethanol production efficiency at high-temperature fermentation depends not only on thermotolerant ethanologenic yeasts and types of feedstock but also on fermentation conditions. This study applied the statistical experimental design to optimize the fermentation conditions for ethanol production from SSJ at 37 °C by the thermotolerant yeast S. cerevisiae DBKKUY-53. Different independent fermentation factors, including sugar concentration, yeast cell concentration, pH of the fermentation medium, ammonium nitrate, urea, yeast extract, diammonium phosphate, and magnesium sulfate, were screened for their impact on ethanol production by S. cerevisiae BDKKUY-53 using PBD, and the results revealed that only three independent fermentation factors, i.e., sugar concentration, cell concentration, and yeast extract, significantly affected ethanol production by this thermotolerant yeast. The RSM based on the CCD pointed out that the optimum fermentation conditions for ethanol production from SSJ at 37 °C were a sugar concentration of 247 g/L, a cell concentration of 7.85 × 10⁷ cells/mL, and yeast extract at 9.99 g/L. The maximum ethanol concentration of 101.81 g/L and productivity of 2.83 g/L/h were achieved under the optimum condition, which was higher than other S. cerevisiae strains using SSJ as feedstock. A recent study demonstrated that under optimum fermentation conditions, the thermotolerant yeast S. cerevisiae DBKKUY-53 could produce relatively high ethanol concentration and productivity, and this thermotolerant yeast can be used for ethanol production at high temperatures using agricultural products as feedstock.

Author Contributions

Conceptualization, S.T., P.K. and P.T.; methodology, S.N. and P.T.; software, S.N. and P.T.; validation, S.N., S.T. and P.T.; formal analysis, P.T.; investigation, S.N. and P.T.; resources, P.K., M.Y. and P.T.; data curation, S.N. and P.T.; writing—original draft preparation, S.T., P.K. and P.T.; writing—review and editing, P.K., M.Y. and P.T.; visualization, S.N.; supervision, S.T. and P.T.; project administration, P.T.; funding acquisition, P.T. All authors have read and agreed to the published version of the manuscript.

Funding

This research was funded by the Center for Alternative Energy Research and Development, Khon Kaen University (Grant number R05-66), and the Fundamental Fund of Khon Kaen University, Khon Kaen, Thailand.

Institutional Review Board Statement

Not applicable.

Informed Consent Statement

Not applicable.

Data Availability Statement

Not applicable.

Acknowledgments

The authors thank the Faculty of Agriculture, Khon Kaen University, Khon Kaen, Thailand, for providing sweet sorghum juice.

Conflicts of Interest

The authors declare no conflict of interest.

References

  1. Manzanares, P. The role of biorefinering research in the development of a modern bioeconomy. Acta Innov. 2020, 37, 47–56. [Google Scholar] [CrossRef]
  2. Silveira, M.H.L.; Morais, A.R.C.; Lopes, A.M.D.C.; Olekszyszen, D.N.; Bogel-Łukasik, R.; Andreaus, J.; Ramos, L.P. Current pretreatment technologies for the development of cellulosic ethanol and biorefineries. ChemSusChem 2015, 8, 3366–3390. [Google Scholar] [CrossRef] [PubMed]
  3. Eiadpum, A.; Limtong, S.; Phisalaphong, M. High-temperature ethanol fermentation by immobilized coculture of Kluyveromyces marxianus and Saccharomyces cerevisiae. J. Biosci. Bioeng. 2012, 3, 325–329. [Google Scholar] [CrossRef]
  4. da Costa Lopes, A.M.; Lins, R.M.G.; Rebelo, R.A.; Lukasik, R.M. Biorefinery approach for lignocellulosic biomass valorisation with an acidic ionic liquid. Green Chem. 2018, 20, 4043–4057. [Google Scholar] [CrossRef]
  5. Girio, F.M.; Fonseca, C.; Carvalheiro, F.; Duarte, L.C.; Marques, S.; Bogel-Lukasik, R. Hemicelluloses for fuel ethanol: A review. Bioresour. Technol. 2010, 101, 4775–4800. [Google Scholar] [CrossRef]
  6. Jaisil, P.; Putto, C. Analysis of feedstocks for ethanol production in Thailand. Alternative Energy 2010, 5, 30–34. [Google Scholar]
  7. Laopaiboon, L.; Thanonkeo, P.; Jaisil, P.; Laopaiboon, P. Ethanol production from sweet sorghum juice in batch and fed-batch fermentations by Saccharomyces cerevisiae. World J. Microbiol. Biotechnol. 2007, 23, 1497–1501. [Google Scholar] [CrossRef]
  8. Prasad, S.; Singh, A.; Jain, N.; Joshi, H.C. Ethanol production from sweet sorghum syrup for utilization as automotive fuel in India. Energy Fuels 2007, 21, 2415–2420. [Google Scholar] [CrossRef]
  9. Wu, X.; Staggenborg, S.; Propheter, J.L.; Rooney, W.L.; Yu, J.; Wang, D. Features of sweet sorghum juice and their performance in ethanol fermentation. Ind. Crop. Prod. 2010, 31, 164–170. [Google Scholar] [CrossRef]
  10. Limtong, S.; Sringiew, C.; Yongmanitchai, W. Production of fuel ethanol at high temperature from sugar cane juice by a newly isolated Kluyveromyces marxianus. Bioresour. Technol. 2007, 98, 3367–3374. [Google Scholar] [CrossRef]
  11. Nuanpeng, S.; Thanonkeo, S.; Yamada, M.; Thanonkeo, P. Ethanol production from sweet sorghum juice at high temperatures using a newly isolated thermotolerant yeast Saccharomyces cerevisiae DNKKU Y-53. Energies 2016, 9, 253. [Google Scholar] [CrossRef]
  12. Charoensopharat, K.; Thanonkeo, P.; Thanonkeo, S.; Yamada, M. Ethanol production from Jerusalem artichoke tubers at high temperature by newly isolated thermotolerant inulin-utilizing yeast Kluyveromyces marxianus using consolidated bioprocessing. Antonie Leeuwenhoek 2015, 108, 173–190. [Google Scholar] [CrossRef] [PubMed]
  13. Pilap, W.; Thanonkeo, S.; Klanrit, P.; Thanonkeo, P. The potential of the newly isolated thermotolerant Kluyveromyces marxianus for high-temperature ethanol production using sweet sorghum juice. 3 Biotech 2018, 8, 126. [Google Scholar] [CrossRef] [PubMed]
  14. Chamnipa, N.; Thanonkeo, S.; Klanrit, P.; Thanonkeo, P. The potential of the newly isolated thermotolerant yeast Pichia kudriavzevii RZ8-1 for high-temperature ethanol production. Braz. J. Microbiol. 2018, 49, 378–391. [Google Scholar] [CrossRef]
  15. Phong, H.X.; Klanrit, P.; Dung, N.T.P.; Yamada, M.; Thanonkeo, P. Isolation and characterization of thermotolerant yeasts for the production of second-generation bioethanol. Ann. Microbiol. 2019, 69, 765–776. [Google Scholar] [CrossRef]
  16. Avchar, R.; Lanjekar, V.; Kshirsagar, P.; Dhakephalkar, P.K.; Dagar, S.S.; Baghela, A. Buffalo rumen harbours diverse thermotolerant yeasts capable of producing second-generation bioethanol from lignocellulosic biomass. Renew. Energ. 2021, 173, 795–807. [Google Scholar] [CrossRef]
  17. Aouine, M.; Elalami, D.; Koraichi, S.I.; Haggoud, A.; Barakat, A. Exploring natural fermented foods as a source for new efficient thermotolerant yeasts for the production of second-generation bioethanol. Energies 2022, 15, 4954. [Google Scholar] [CrossRef]
  18. Techaparin, A.; Thanonkeo, P.; Klanrit, P. High-temperature ethanol production using thermotolerant yeast newly isolated from Greater Mekong Subregion. Braz. J. Microbiol. 2017, 48, 461–475. [Google Scholar] [CrossRef]
  19. Phong, H.X.; Klanrit, P.; Dung, N.T.P.; Thanonkeo, S.; Yamada, M.; Thanonkeo, P. High-temperature ethanol fermentation from pineapple waste hydrolysate and gene expression analysis of thermotolerant yeast Saccharomyces cerevisiae. Sci. Rep. 2022, 12, 13965. [Google Scholar] [CrossRef]
  20. Nguyen, P.V.; Nguyen, K.H.V.; Nguyen, N.L.; Ho, X.T.T.; Truong, P.H.; Nguyen, K.C.T. Lychee-derived, thermotolerant yeasts for second-generation bioethanol production. Fermentation 2022, 8, 515. [Google Scholar] [CrossRef]
  21. Pilap, W.; Thanonkeo, S.; Klanrit, P.; Thanonkeo, P. The potential of multistress tolerant yeast, Saccharomycodes ludwigii, for second-generation bioethanol production. Sci. Rep. 2022, 12, 22062. [Google Scholar] [CrossRef]
  22. Wang, Y.X.; Lu, Z.X. Optimization of processing parameters for the mycelial growth and extracellular polysaccharide production by Boletus sp. ACCC50328. Process Biochem. 2005, 40, 1043–1051. [Google Scholar] [CrossRef]
  23. Bezerra, M.A.; Santelli, R.E.; Oliveira, E.P.; Villar, L.S.; Escaleira, L.A. Response surface methodology (RSM) as a tool for optimization in analytical chemistry. Talanta 2008, 76, 965–977. [Google Scholar] [CrossRef] [PubMed]
  24. Nuanpeng, S.; Thanonkeo, S.; Klanrit, P.; Thanonkeo, P. Ethanol production from sweet sorghum by Saccharomyces cerevisiae DBKKUY-53 immobilized on alginate-loofah matrices. Braz. J. Microbiol. 2018, 49, 140–150. [Google Scholar] [CrossRef] [PubMed]
  25. Ferreira, S.L.C.; Bruns, R.E.; Ferreira, H.S.; Matos, G.D.; David, J.M.; Brandão, G.C.; da Silva, E.G.P.; Portugal, L.A.; dos Reis, P.S.; Souza, A.S.; et al. Box-Behnken design: An alternative for the optimization of analytical methods. Anal. Chim. Acta 2007, 597, 179–186. [Google Scholar] [CrossRef]
  26. Singh, A.; Tuteja, S.; Singh, N.; Bishnoi, N.R. Enhanced saccharification of rice straw and hull by microwave-alkali pretreatment and lignocellulolytic enzyme production. Bioresour. Technol. 2011, 102, 1773–1782. [Google Scholar] [CrossRef]
  27. Plackett, R.L.; Burman, J.P. The design of optimum multifactorial experiments. Biometrika 1946, 33, 305–325. [Google Scholar] [CrossRef]
  28. Pornthap, T.; Sudarat, T.; Kannikar, C.; Mamoru, Y.; Thanonkeo, P.; Charoensuk, K.; Yamada, M. Ethanol production from Jerusalem artichoke (Helianthus tuberosus L.) by Zymomonas mobilis TISTR548. Afr. J. Biotechnol. 2011, 10, 10691–10697. [Google Scholar] [CrossRef]
  29. Yu, J.; Zhang, X.; Tan, T. Optimization of media conditions for the production of ethanol from sweet sorghum juice by immobilized Saccharomyces cerevisiae. Biomass Bioenergy 2009, 33, 521–526. [Google Scholar] [CrossRef]
  30. Laopaiboon, L.; Nuanpeng, S.; Srinophakun, P.; Klanrit, P.; Laopaiboon, P. Ethanol production from sweet sorghum juice using very high gravity technology: Effects of carbon and nitrogen supplementations. Bioresour. Technol. 2009, 100, 4176–4182. [Google Scholar] [CrossRef]
  31. Pereira, F.; Guimarães, P.M.R.; Teixeira, J.A.; Domingues, L. Optimization of low-cost medium for very high gravity ethanol fermentations by Saccharomyces cerevisiae using statistical experimental designs. Bioresour. Technol. 2010, 101, 7856–7863. [Google Scholar] [CrossRef]
  32. Zoecklein, B.U.; Fugelsang, K.C.; Gump, B.H.; Nury, F.S. Wine Analysis and Production; Chapman & Hall: New York, NY, USA, 1995. [Google Scholar]
  33. Mecozzi, M. Estimation of total carbohydrate amount in environmental samples by the phenol-sulphuric acid method assisted by multivariate calibration. Chemom. Intell. Lab. Syst. 2005, 79, 84–90. [Google Scholar] [CrossRef]
  34. Tofighi, A.; Assadi, M.M.; Asadirad, M.H.A.; Karizi, S.Z. Bio-ethanol production by a novel autochthonous thermo-tolerant yeast isolated from wastewater. J. Environ. Health Sci. Eng. 2014, 12, 107. [Google Scholar] [CrossRef] [PubMed]
  35. Phutela, U.G.; Kaur, J. Process optimization for ethanol production from sweet sorghum juice using Saccharomyces cerevisiae strain NRRL Y-2034 by response surface methodology. Sugar Tech 2014, 16, 411–421. [Google Scholar] [CrossRef]
  36. Zhao, S.; Wang, B.; Liang, X. Enhanced ethanol production from stalk juice of sweet sorghum by response surface methodology. Afr. J. Biotechnol. 2012, 11, 6117–6122. [Google Scholar]
  37. Bai, F.W.; Chen, L.J.; Zhang, Z.; Anderson, W.A.; Moo-Young, M. Continuous ethanol production and evaluation of yeast cell lysis and viability loss under very high gravity medium conditions. J. Biotechnol. 2004, 110, 287–293. [Google Scholar] [CrossRef]
  38. Ozmihci, S.; Kargi, F. Comparison of yeast strains for batch ethanol fermentation of cheese-whey powder (CWP) solution. Lett. Appl. Microbiol. 2007, 44, 602–606. [Google Scholar] [CrossRef]
  39. Li, Z.; Wang, D.; Shi, Y.C. Effects of nitrogen source on ethanol production in very high gravity fermentation of corn starch. J. Taiwan Inst. Chem. Eng. 2017, 70, 229–235. [Google Scholar] [CrossRef]
  40. Deesuth, O.; Laopaiboon, P.; Klanrit, P.; Laopaiboon, L. Improvement of ethanol production from sweet sorghum juice under high gravity and very high gravity conditions: Effects of nutrient supplementation and aeration. Ind. Crops Prod. 2015, 74, 95–102. [Google Scholar] [CrossRef]
Figure 1. Response surfaces and contour plots of interaction between cell concentration (cells/mL) and sugar concentration (g/L) (A), cell concentration (cells/mL) and yeast extract concentration (g/L) (B), and sugar concentration (g/L) and yeast extract concentration (g/L) (C) on ethanol concentration (g/L) at 37 °C by thermotolerant S. cerevisiae DBKKUY-53 using SSJ as raw material.
Fermentation 09 00450 g001
Figure 2. Response surfaces and contour plots of interaction between cell concentration (cells/mL) and sugar concentration (g/L) (A), cell concentration (cells/mL) and yeast extract concentration (g/L) (B), and sugar concentration (g/L) and yeast extract concentration (g/L) (C) on ethanol productivity (g/L/h) at 37 °C by thermotolerant S. cerevisiae DBKKUY-53 using SSJ as raw material.
Fermentation 09 00450 g002
Figure 3. The ethanol production profile of thermotolerant S. cerevisiae DBKKUY-53 at 37 °C in a 2 L fermenter using SSJ as raw material. (A) ▲, sugar concentration (g/L); ●, ethanol concentration (g/L); and (B) ♦, log viable cell concentration (cells/mL) and ×, total soluble solid (° Brix).
Fermentation 09 00450 g003
Table 1. Codes and actual values of the independent fermentation factors for the PBD experiment.
CodeIndependent FactorUnitLow Level (−1)High Level (+1)
ASugar concentrationg/L180250
BpH 4.55.5
CCell concentrationCells/mL1 × 1061 × 108
DAmmonium nitrateg/L0.01.5
EUreag/L0.01.5
FYeast extractg/L0.09.0
GDiammonium phosphateg/L0.01.5
HMagnesium sulfateg/L0.53.0
Table 2. Codes and actual values of the significant independent factors for the CCD experiment.
CodeIndependent FactorUnitLevels
−1.68−1.000+1.00+1.68
ACell concentrationCells/mL5.00 × 1062.43 × 1075.25 × 1078.07 × 1071.00 × 108
BSugar concentrationg/L180204240276300
CYeast extractg/L3.04.87.510.212.0
Table 3. The experimental matrices, the predicted and actual values of ethanol concentrations, and productivities from the PBD experiment.
RunIndependent Factor and LevelP (g/L)Qp (g/L/h)
ABCDEFGHModelActualModelActual
1−1−1+1−1+1+1−1+175.0775.12 ± 2.013.173.10 ± 0.04
2−1+1−1+1+1−1+1+164.4165.54 ± 1.681.261.35 ± 0.01
3+1−1−1−1+1−1+1+171.9370.81 ± 2.011.551.46 ± 0.02
4+1−1+1+1+1−1−1−185.3787.64 ± 0.622.442.43 ± 0.01
5+1+1−1−1−1+1−1+180.3182.55 ± 2.321.661.66 ± 0.09
6+1+1−1+1+1+1−1−184.8382.57 ± 0.421.701.72 ± 0.00
7−1+1+1+1−1−1−1+173.3372.22 ± 0.982.112.02 ± 0.01
8−1+1+1−1+1+1+1−180.0379.98 ± 1.483.233.31 ± 0.03
9−1−1−1−1−1−1−1−160.7559.56 ± 2.211.041.22 ± 0.03
10+1−1+1+1−1+1+1+192.1590.96 ± 2.403.573.75 ± 0.05
11+1+1+1−1−1−1+1−185.8185.88 ± 0.332.462.38 ± 0.00
12−1−1−1+1−1+1+1−172.0573.26 ± 0.392.212.03 ± 0.01
Table 4. An analysis of variance (ANOVA) of PBD for ethanol production from SSJ at 37 °C by thermotolerant S. cerevisiae DBKKUY-53.
FactorSum SquaredfMean SquareF Valuep Value
Prob > F
Remark
Ethanol concentration (P, g/L)
A465.391465.3959.780.0045Significant
B10.78110.781.380.3241
C275.721275.7235.420.0095Significant
D27.88127.883.580.1548
E0.6410.640.080.7935
F152.571152.5719.600.0214Significant
G3.8213.820.490.5339
H11.40111.401.460.3129
Ethanol productivity (Qp, g/L/h)
A0.01210.0120.250.6530
B0.2010.204.300.1298
C4.7614.76101.440.0021Significant
D0.002410.00240.050.8347
E0.008110.00810.170.7065
F1.8511.8539.520.0081Significant
G0.3910.398.250.0639
H0.005510.00550.120.7555
Table 5. The experimental matrices, the predicted and actual values of ethanol concentrations, and productivities from the CCD experiment.
RunIndependent FactorP (g/L)Qp (g/L/h)Yp/s (g/g)
ABCModelActualModelActual
18.07 × 1072044.885.8484.12 ± 2.032.382.34 ± 0.030.46 ± 0.02
25.25 × 1072407.594.0792.33 ± 1.892.612.56 ± 0.020.44 ± 0.01
38.07 × 10727610.298.0994.53 ± 1.602.722.63 ± 0.010.41 ± 0.01
45.25 × 1072407.594.0790.47 ± 2.012.612.51 ± 0.040.43 ± 0.03
58.07 × 10720410.292.9390.80 ± 0.682.582.52 ± 0.000.48 ± 0.00
65.25 × 1072407.594.0797.75 ± 0.982.612.72 ± 0.010.47 ± 0.01
72.43 × 10727610.285.3585.61 ± 1.672.372.38 ± 0.020.43 ± 0.02
82.43 × 10720410.289.3588.69 ± 2.422.482.46 ± 0.010.45 ± 0.01
98.07 × 1072764.893.2692.42 ± 1.202.592.57 ± 0.010.41 ± 0.01
105.00 × 1062407.584.4782.40 ± 0.422.352.29 ± 0.000.40 ± 0.00
115.25 × 1071807.580.6081.42 ± 0.982.242.26 ± 0.010.47 ± 0.01
125.25 × 1072407.594.0797.41 ± 2.302.612.71 ± 0.030.48 ± 0.02
132.43 × 1072764.882.2982.99 ± 0.622.282.31 ± 0.010.35 ± 0.00
145.25 × 1072403.090.7289.91 ± 1.682.522.50 ± 0.010.42 ± 0.01
151.00 × 1082407.596.82101.03 ± 1.042.682.81 ± 0.020.47 ± 0.01
165.25 × 1072407.594.0792.08 ± 0.632.612.56 ± 0.010.44 ± 0.01
175.25 × 10724012.099.23102.14 ± 2.412.752.84 ± 0.030.49 ± 0.03
185.25 × 1073007.583.0984.39 ± 1.742.302.34 ± 0.020.39 ± 0.01
192.43 × 1072044.884.0286.01 ± 0.682.332.39 ± 0.010.45 ± 0.01
Table 6. An analysis of variance (ANOVA) of CCD for ethanol concentration at 37 °C by thermotolerant S. cerevisiae DBKKUY-53.
FactorSum SquaredfMean SquareF Valuep Value
Prob > F
Remark
Model638.91970.996.160.0044Significant
A182.281182.2815.820.0026Significant
B8.7318.730.760.4046
C87.85187.857.620.0201Significant
AB41.10141.103.570.0883
AC1.5211.520.130.7243
BC2.6912.690.230.6391
A228.69128.692.490.1456
B2295.111295.1125.610.0005Significant
C20.1810.180.020.9022
Residual115.221011.52
Lack of fit58.88511.781.050.4813Not significant
Pure Error56.34511.27
Cor Total754.1319
R20.85
Table 7. An analysis of variance (ANOVA) of CCD for ethanol productivity at 37 °C by thermotolerant S. cerevisiae DBKKUY-53.
FactorSum SquaredfMean SquareF Valuep Value
Prob > F
Remark
Model0.49090.0556.160.0044Significant
A0.14010.14015.810.0026Significant
B0.006710.00670.760.4046
C0.06810.0687.620.0201Significant
AB0.03210.0323.570.0882
AC0.001210.00120.130.7238
BC0.002110.00210.230.6391
A20.02210.0222.490.1457
B20.23010.23025.610.0005Significant
C20.000110.00010.020.9023
Residual0.089100.0089
Lack of fit0.04550.00911.050.4811Not significant
Pure Error0.04350.0086
Cor Total0.58019
R20.850
Disclaimer/Publisher’s Note: The statements, opinions and data contained in all publications are solely those of the individual author(s) and contributor(s) and not of MDPI and/or the editor(s). MDPI and/or the editor(s) disclaim responsibility for any injury to people or property resulting from any ideas, methods, instructions or products referred to in the content.

