Abstract
Ultrasound-assisted fermentation is a promising approach for improving food products’ nutritional and sensory qualities. This study compared the effects of ultrasound-assisted fermentation on chickpea-based beverages’ nutritive and sensory components. Proximate, phytochemical, and microstructural data were examined to evaluate the effectiveness of the processing techniques. The processed samples demonstrated significantly higher (p < 0.05) nutritional and sensory outcomes compared to the unfermented sample. The unfermented sample had a total phytochemical level of 55.41 g/mL, whereas the fermented and ultrasound-assisted fermented samples had phytochemical contents of 66.71 and 64.51 µg/mL, respectively. With values of 8.37 ± 0.11 and 7.21 ± 0.06, respectively, on a 9-point hedonic scale, the sensory evaluation revealed that the traditionally fermented sample had a greater acceptability rate than the ultrasound-treated sample. The presence of organic acids in the final product was shown to be significantly impacted by fermentation, with propanoic having the highest concentrations of 1.79 ± 3 × 10⁻⁵a, 5.56 ± 2 × 10⁻⁵b, and 3.50 ± 0.00344c mg/mL for the unfermented, fermented, and ultrasound-assisted fermented beverages, respectively. According to these results, using ultrasound-assisted fermentation with reduced fermentation time can improve chickpea-based beverages’ nutritional and functional benefits.
1. Introduction
A good source of fibre, minerals, vitamins, minerals, and energy, chickpeas may also include phytochemicals that have health benefits [1,2]. Many health advantages, such as the prevention of diabetes, hypertension, cancer, cholesterol and heart disorders, obesity, and enhanced gut health, are brought on by these nutritional and bioactive components [3]. Functional foods are products formulated using scientific research and are recognized to provide additional physiological benefits beyond their fundamental nutritional functions. These foods can lower the chance of developing chronic diseases and improve gut health when included in a regular diet [4,5]. Because they are derived from plants rather than animals and have a high nutritional value, chickpea milk and soymilk are great alternatives to animal milk [6]. They also serve as a functional beverage due to their high nutritional and health benefits. To produce plant milk or beverages, chickpea is mixed with other food items, such as yam [7], wheat [8], lupin [9], and coconut [10]. Plant milk is an emulsion obtained when legumes, cereals, pseudocereals, nuts, and oilseeds are blended with water to resemble cow’s milk. Plant-based milk is becoming increasingly popular due to consumer interest sparked by concerns about health (including lactose intolerance and animal milk allergies), the environment, and long-term sustainability [11].
Again, chickpeas are becoming increasingly popular as a plant-based substitute for beverages derived from dairy and soy because of their high protein and fibre, low fat, and potential health benefits. They also provide many phytochemicals such as polyphenols, flavonoids, and carotenoids, all of which have a variety of benefits for one’s health [12]. However, the processing of chickpea-based beverages may impact their nutritional value, sensory appeal, and shelf life, which may limit their acceptability and marketability. For instance, using conventional processing methods such as heating might result in the denaturation of proteins, the loss of phytochemicals, and changes to the sensory properties of the final product [13]. In addition, the thermal processing of chickpea drinks reduced the quantity of important amino acids, particularly lysine, histidine, and methionine, according to [9]. According to [14], conventional food processing methods such as heating, drying, and smoking can lead to changes in the sensory properties of the food. More specifically, smoking can lead to the formation of polycyclic aromatic hydrocarbons (PAHs), which can affect the flavour and aroma of the food. Heating and drying can also lead to changes in the sensory properties of food.
Since ancient times, the food and beverage industries employed fermentation as an effective and affordable way to preserve, enhance flavour, and improve the nutritional value of items, generally having a major impact on the product’s physicochemical attributes [15,16]. Recent studies focused on plant-based fermented milk’s antioxidant qualities and process optimization [17]. In 2017, the US food market’s fastest-growing segment, with a market value of USD 1347 billion, was fermented beverages. The importance of probiotic-rich fermented beverages in human diets across the globe can be seen in the fact that fermentation is a practical, cost-effective process that plays a crucial role in preserving and enhancing food’s nutritional and sensory qualities [5]. Lactic acid bacteria potentially enhance fermented beans’ biological and anti-oxidant qualities [2]. High levels of antioxidants found in soymilk, a historically fermented food, were associated with antiradical properties. Many health advantages of fermented soymilk were demonstrated, including anticancer activity, digestive function, and B vitamin levels [18]. Due to the rise in allergic responses, nonallergenic chickpea milk is a superior alternative to soymilk [2]. In addition to improving the nutritional and bioactive properties of food substrates, fermentation is a preservation method. It is claimed by [19] that fermentation involves using microorganisms and enzymes to break down complex organic substances and remained an essential step in developing many food products. Furthermore, fermentation of legumes using LAB was recorded to improve their total phenolic acid [20], including antifungal phenolic acids [21], organoleptic properties [22], and reduced anti-nutritional factors [20]. Plant-based products benefit from this technique by having better safety, nutritional value, and shelf life.
A potentially beneficial technique for improving the nutritional value, phytochemical and organic acid content, colour, and sensory profile of a variety of food products recently emerged: ultrasound-assisted fermentation. Ultrasound attracted much interest as a method of promoting enzyme activities, metabolic performance, and microorganism growth during food fermentation [23,24]. To improve the extraction and release of intracellular components such as proteins, carbohydrates, and phytochemicals and to encourage the growth of probiotic microorganisms, the benefits of fermentation are combined with those of ultrasound application to enhance the nutritional and functional qualities of the finished product [25,26].
Additionally, it was demonstrated that ultrasound-assisted fermentation improves the nutritional value of fermented products. Ref. [27] found that ultrasound-assisted fermentation increased black soybeans’ antioxidant activity and total phenolic content. In a 2021 study, Ref. [28] looked into the impact of ultrasound on the stability of fermented milk. They found that during storage, ultrasound-assisted fermentation led to a lower pH and a higher titratable acidity, which boosted the fermented milk’s stability during storage by providing unfavourable conditions for microbial growth. Therefore, it is feasible that using ultrasound to encourage fermentation in chickpea-based beverages could offer a novel and sustainable method for creating useful and enticing drinks that offer more health advantages than those provided by conventional drinks.
According to Refs. [29,30], ultrasound can accelerate a variety of chemical processes, including the Maillard reaction (MR), oxidation, esterification, and proteolysis, as fermented foods mature. When compared to foods produced by conventional fermentation, ultrasound-assisted fermentation is anticipated to enhance the quality of fermented foods simultaneously with favourable texture, colour, flavour, and taste [31,32]. According to research by Refs. [32,33,34], numerous elements of food products, including proximate content, microstructure, phytochemical and organic acid content, colour, and sensory profile, were demonstrated to benefit from the use of ultrasound-assisted fermentation. Fermented milk, soybeans, and grape pomace are a few examples of food items that were researched in this regard. The precise effects of ultrasound-assisted fermentation on chickpea beverages are yet to be studied. Therefore, the goal of this study is to examine how the nutritional, sensory, and consumer approval of beverages made from chickpeas are affected by ultrasound-assisted fermentation.
The main objective was to assess any variations in the beverages’ nutritional composition, such as changes in the amounts of proteins, carbs, and other crucial elements that might take place throughout the fermentation process. High-performance liquid chromatography (HPLC) was used to evaluate these alterations. Furthermore, the impact of ultrasound-assisted fermentation on the general sensory profile of beverages made from chickpeas was evaluated. The study measured the scent and colour changes in the beverages using colourimetry and electronic nose (eNose) technology. The acceptance of the beverages among customers, investigations on consumer taste, and acceptability were also carried out. The use of ultrasound-assisted fermentation in this study may help create unique chickpea-based drinks with better nutritional and sensory qualities. Ultimately, this research may open the door to creating novel, nutrient-dense, and consumer-pleasing functional food products.
2. Materials and Methods
2.1. Formulation of Ultrasound-Assisted Chickpea Fermented Milk
2.1.1. Chickpea Milk Preparation
As Ref. [7] demonstrated, fresh boiled Cicer arietinum (chickpea) beverage was made with some minor adjustments. In a nutshell, 200 g of chickpeas were measured out, followed by overnight soaking in NaHCO3, after which the chickpeas were dehusked after being removed from the water. The dehulled chickpeas were blanched in a solution containing 0.5% NaHCO3 for 30 min at a temperature of 100 °C, washed in clean water from the tap, and then blended at high speed for 5 min with sufficient hot distilled water at a temperature of 60 °C to obtain a solid content of 16%. The obtained chickpea milk was pasteurized in a water bath at 60 °C for 30 min.
2.1.2. Ultrasound-Assisted Chickpea Milk Preparation
Fermentation of chickpea beverages was achieved based on previous experiments carried out to establish optimal ultrasonic and fermentation parameters (under review). These parameters were obtained using response surface methodology (RSM) coupled with Box–Behnken design (BBD). The LAB used, Lacticaseibacillus paracasei S2601-8, was isolated from a bacteria compound obtained from Danyang Yihe Food Co., Ltd. (Danyang, China) and cultured in MRS broth. A 3% volume of the culture was then centrifuged and washed in saline water twice. The washed cells were then suspended in 1% glucose solution for 30 min, after which the solution was added to the prepared beverage; thus, an inoculum size of 3% Lacticaseibacillus paracasei S2601-8 was added to a chickpea beverage that had 16% solid content. Before the ultrasonication process, the beverage was allowed to ferment at 43.5 °C. After a fermentation period of 3 h, the beverage was subjected to an ultrasonic treatment with optimum parameters consisting of a treatment duration of 80 min, a frequency of 27.5 kHz, and a power density of 100 W/L. Throughout the procedure, the ultrasonic bath was kept at a constant temperature of 43.5 °C. After receiving ultrasonic treatment, the beverage was left to undergo fermentation for a further 11 h and 40 min. The time spent undergoing ultrasound therapy was factored into the total fermentation time of 16 h. Fermentation was carried out in an optical shaker at 200 rpm. The process involved in the beverage preparation is captured in Figure 1. The unfermented, fermented, and UAF chickpea beverages were dispensed into sterile containers (500 mL each) for storage at 4 °C prior to analyses.
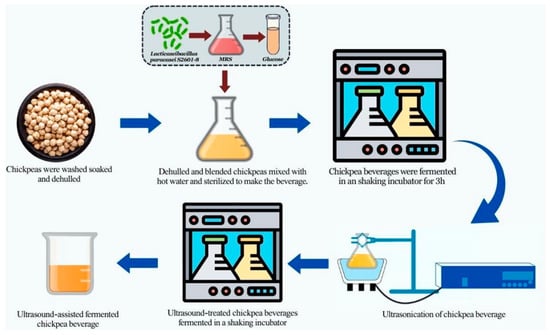
Figure 1.
Graphical illustration of the beverage preparation process.
2.2. Proximate Analysis
The following parameters were measured using Ref. [35]’s recommended procedures: moisture content, total solids, fat, protein, ash, and carbohydrates. The formulae for obtaining the proximate contents are described below.
The moisture content of the chickpea beverages was determined using the formula:
where W1 = weight of empty crucible, W2 = weight of crucible and sample, and W3 = weight of crucible and sample after drying in the oven.
The amount of solid by difference was computed by deducting the moisture percentage from one hundred (100):
Total solids = 100 − %Moisture content
The ash content of the chickpea beverages sample was determined using the formula:
where W1 = weight of empty crucible, W2 = weight of crucible and sample, and W3 = weight of crucible with lid and ash.
The amount of crude protein was obtained using titration. The % of nitrogen and crude protein of the chickpea beverage sample were obtained using the formula:
Calculation: 1 mL of 0.01 N HCl titrated against sample = 0.0015 g;
Titre volume = (A − B) mL;
%Crude Protein = %Nitrogen × Conversion factor (6.25) [36]
- where; A = volume of 0.01 mol/L HCl titrated against sample;
- B = volume of 0.01 mol/L HCl titrated against blank =1.2 mL;
- W = weight of sample = 2 mL;
- V = total volume of sample digest = 50 mL;
- V1 = volume of sample digest distilled = 5 mL.
Using the Soxhlet equipment, the crude fat of the samples was ascertained. The formula below was used to determine the percentage of crude fat (ether extract) removed from the sample:
Finally, the total carbohydrate content was measured by;
2.3. Effect of Ultrasound Treatment on Chickpea Beverage Fermentation
2.3.1. Scanning Electron Microscopy (SEM) Analysis
A slightly modified version of the SEM method reported by Ref. [37] was utilized to investigate the structures of both unfermented and fermented materials. Double-sided adhesive tape was used to secure the raw and cultured samples to a copper sample holder. Following this step, a conductive layer of gold powder was vacuum sprayed onto the entire assembly (diameter: roughly 10 nm). Their structures were analyzed using an acceleration voltage of 15 kV and a Hitachi S-3400N, which Hitachi High Technologies in Tokyo, Japan, manufactured.
2.3.2. Atomic Force Microscopy (AFM) Analysis
The method outlined by Ref. [37] with slight modifications, was used to determine the topography of chickpea beverages samples. The samples were dissolved in 0.01 M saline phosphate buffer (pH 8.0) to prepare a 10 μg/mL final concentration. The solution was heated in a thermostatic water bath (50 °C) for 10 min and centrifuged (4000 rpm, 10 min). Next, 5 μL aliquots of the supernatant were rapidly pipetted onto a newly cleaved mica substrate and dried in an incubator (25 °C) for 12 h in Petri dishes. A multimode microscope (Bruker, Santa Barbara, CA, USA) was used to generate the AFM images of the samples. The lens was used in Peak Force QNM mode with a Bruker ScanAsyst needle at a typical spring and resonance frequency of 25.1 N/m and 300 kHz, respectively.
2.3.3. Fourier Transform Infrared (FTIR) Spectroscopy
The FTIR spectroscopy approach described by Ref. [37] was utilized with minor changes to identify the chemical structure of unfermented and fermented materials. With a mortar and pestle (both made of agate), 4 mg of freeze-dried fermented and unfermented (control) chickpea beverages were ground separately and well combined with 200 mg of dried spectroscopic grade KBr (at 105 °C for 24 h) powder. The resulting mixture was compressed with a hydraulic machine (10 t) in 1–2 mm-thick see-through (transparent) glass-like pellets. The pellets were scanned at a resolution of 4 cm−1 in a wavenumber range of 4000–400 cm−1, with 128 scans using the Nicolet IS50 equipment (Thermo Nicolet Corporation, Waltham, MA, USA). The blank (KBr pellet without test samples) utilized in the parameter setup was provided as reference spectra.
2.4. High-Performance Liquid Chromatography (HPLC) Analysis
2.4.1. Organic Acids
Analysis of organic acids, mainly mallic, lactic, acetic, propanoic, and citric acid, was performed by following the method proposed by Ref. [38] with few modifications. A standard curve was used as a reference for the various organic acids with concentrations of 0.05, 0.2, 0.5, 2, and 5 mg/mL. Subsequently, the chickpea beverages were centrifuged, and the obtained supernatant was filtered using a 0.45 mm membrane filter. Next, 20 mL of the filtered sample was injected into an Agilent1100 HPLC system with an Agilent ZORBAX SB-Aq column (250 mm × 4.6 mm), and quantification was conducted using a diode array detector (DAD). The conditions were: mobile phase A: 0.1% phosphoric acid aqueous solution; mobile phase B: methanol; detection wavelength: 210 nm; column temperature 40 °C; flow rate 1 mL/min; and sample volume 10 uL.
2.4.2. Phytochemicals
The quantitative identification of phytochemicals was conducted using HPLC-MS. The sample extraction was carried out using a Superclean LC-18 cartridge (Supelco, Bellefonte, PA, USA) after it was conditioned with 10 mL methanol and deionized water. The samples (5 mL), each with pH adjusted to 2 using a 7.2 M HCL, were separately dispensed into the Supelclean LC-18 cartridge. The phenolic acids, flavonols, and anthocyanins were separately eluted using 3.0 mL each of methanol, acetonitrile (20%, pH 2.5), and methanolic HCl (0.01%), respectively. The eluents were transferred into dark sample vials and stored, awaiting filtration and subsequent instrumental analysis.
Polyphenol testing was conducted according to Ref. [38] with some modifications. Quickly, 2 g of the chickpea sample was weighed into a 10 mL centrifuge tube containing 5 mL of 70% methanol solution, oscillated and mixed, ultrasonicated for 30 min, and centrifuged. The supernatant was collected and put in a liquid phase vial for testing, using Agilent 1100; triple quadrupole mass spectrometer API4000 with Agilent Poroshell 120 EC-C18 2.7µm column (3 × 50 mm). The conditions set for the chromatography were mobile phase A: 0.5% formic acid in water; mobile phase C: acetonitrile solution, flow rate: 0.6 mL/min, injection volume: 10 µL, and column temperature: 35 °C.
Mass spectrometry was used to quantify the polyphenols present in conjunction with the quantitative identification of phytochemicals using HPLC-MS, set as spray voltage 4.5–5.5 kv: desolvation temperature 500 °C; and desolvation gas (N2) 1000 L/h. The mass spectrometry scanning conditions were also set as ESI+ mode: spray voltage 5.5 kv; desolvation temperature 500 °C; desolvation gas (N2) 1000 L/h, and ESI-mode: spray voltage 4.5 kv; desolvation temperature 500 °C; and desolvation gas (N2) 1000 L/h.
2.5. Microbiological Analysis of Chickpea Beverage Samples
The microbial quality of the chickpea beverage samples was evaluated with standard methods. The samples were diluted four times before plating. The colonies enumerated after the incubation period were expressed as the log colony-forming unit as in Equation (6) [39].
The mesophilic aerobic bacteria enumeration of the chickpea beverage samples was determined by pour plate technique, culturing 1 mL of serial dilutions on plate count agar (PCA) (M0024, Hangwei, Hangzhou Microbial Reagent Co., Ltd., Hangzhou, China) [39]. The plates were counted and expressed as log cfu mL−1. Additionally, the Staphylococcus aureus count was carried out by spread plating 0.1 mL of appropriate dilutions on Baird Parker agar (BPA) (BW, Shanghai Bio-way Technology Co., Ltd., Shanghai, China). In an inverted position, the plates were incubated at 37 °C for 24 h [40]. Staphylococcus aureus colonies on Baird Parker agar are characterized by round shape, being slimy/smooth, convex with a diameter of 2 to 3 mm, with a greyish to black colour, and having a clear halo that develops around the edge of the colony [41]. Colonies with typical black shiny and narrow white margins, surrounded by a clear zone extending into the opaque medium, were counted and expressed as log cfu mL−1. Finally, the yeast and mould count of the chickpea samples was determined by spread plating 0.1 mL of appropriate dilutions aseptically on Rose Bengal chloramphenicol agar (RBCA) supplemented with 100 mg/L chloramphenicol and incubated at 25 °C for 5 days [40,42]. The colonies with pink colour were counted and expressed as log cfu mL−1.
2.6. Sensory Profile
2.6.1. Colour Determination
The colour of the chickpea beverage samples was measured using a CR-400 model colourimeter with a xenon lamp as a light source. The angle was 45°, and viewing was carried out at 0°. After standardization, the colour values L* representing light to dark, a* representing redness to greenness, and b* representing yellowness to blueness were measured. The total colour changes (ΔE), chroma, browning index, and hue angle (Ho) were calculated using Equations (7)–(12) [43]. The hue parameter describes what people think when they describe the colour green, red, and yellow, among others, while chroma represents the intensity or purity of the hue. The browning index refers to food products’ enzymatic and non-enzymatic browning, which can significantly impact their flavour, colour, and texture [44].
where “o” denotes the colour values of raw chickpeas with no treatment.
X = (a∗ + 1.75L∗)(6.645L∗ + a∗ − 3.012b∗)
Hue angle (Ho) = tan − 1(b∗a∗), (when a > 0)
Hue angle (Ho) = 180 + tan − 1(b∗a∗), (when a < 0)
2.6.2. eNose Analysis
The UAF’s effect on the beverage’s aroma was examined using an electronic nose and the method outlined by Ref. [45]. The PEN3 electronic nose apparatus, which the German company Airsense Analytics created, was used in this investigation. Two positioned pumps, one of which is utilized to monitor the sample gas compounds being sucked through the sensor array, and an array of ten partly selective metal-oxide semiconductors (MOS) gas sensors, are its main components. Table 1 lists the characteristics of these sensors made of metal-oxide-semiconductor (MOS) gas sensors that are partially selective.

Table 1.
Gas sensors of the PEN3 electronic nose system and their features.
A 5 mL chickpea milk sample was added to a 20 mL transparent vessel, sealed with plastic wrap, after which the sampling needle connected to Teflon was inserted. The needle sucked in the volatile compounds in the headspace at a 300 mL/min injection flow rate while a Luer Lock needle connected to a charcoal filter maintained constant air pressure in the sampling vessel. The measurement and flush time were 120 and 140 s, respectively. The stable response signs of each sensor were extracted for analysis.
2.6.3. Consumer Sensory Analysis Tests
Consumer selection for the sensory evaluation of the chickpea products was conducted using the method reported by Ref. [45] with slight modification. The selection criterion was the nonexistence of allergic reactions to soy products and the consumption of fermented chickpeas. The consumers were divided into three separate sessions. Each of the three consumer sessions had 35 different participants. Throughout the test, 60% of the participants were female, and 40% were male. All the consumers that participated in the study were chickpea products consumers and were in Jiangsu University (Zhenjiang city, Jiangsu Province, China). The participants in the sensory analysis completed an informed consent form before data collection after approval of the study protocol by the School of Food and Biological Engineering, Jiangsu University.
The test was conducted at the School of Food and Biological Engineering, Jiangsu University, in a food laboratory that had fluorescent lights with a uniform level of lighting, was well ventilated (good ventilation), quiet, comfortable, and had controlled conditions to avoid distractions. All the conditions were equal for all tests. The room temperature was 24 ± 1 °C. A 9-point hedonic scale was used for the sensory evaluation of the chickpea products, and the participants were instructed in a brief orientation session about the evaluation. Each chickpea product was assigned a random 3-digit code and randomly presented to the participants to avoid a first-order effect [46,47,48].
Next, 25 mL of chickpea samples were served in a monodic format to the participants in transparent (colourless) plastic cups coded with 3 random digits at room temperature (24 ± 1 °C). Each participant was given a glass of water (and crackers, biscuits) to rinse their mouth (clear taste buds) before and after each sample tasting, and a total of three samples were evaluated. The attributes evaluated were the appearance, colour, texture, flavor, aroma, taste, mouthfeel, consistency, and overall acceptability of the chickpea samples. The scores of 1 = dislike extremely, 2 = dislike, 3 = dislike moderately, 4 = dislike slightly, 5 = neither like nor dislike, 6 = like slightly, 7 = like moderately, 8 = like, and 9 = like extremely were used by the participants after each sample tasting to assign a numerical value to individual attributes.
2.6.4. Statistical Analysis
The samples were analyzed in triplicate, and the results are presented as means standard deviations. A multiple T-test was used to compare paired variables, and Tukeys’ test assessed the mean difference at p < 0.05.
3. Results
3.1. Proximate Analysis of Treated and Untreated Chickpea Beverages
A common technique for figuring out the nutritional makeup of food products is proximate analysis, which measures the amounts of macronutrients such as proteins, carbs, and fats, as well as micronutrients such as vitamins and minerals [36]. According to research by Ref. [32], fermentation and ultrasound-assisted fermentation are beneficial for increasing the proximate content of a variety of food products, including fermented milk, soybeans, and grape pomace. Although not many studies particularly focus on the effect of these techniques on the proximate content of chickpea-based beverages, the advantages of these methods could make them useful for improving the nutritional value of these drinks as well. The proximate contents of the chickpea beverages (Table 2) did not show significant changes. However, the protein content reduced significantly between the various samples with values of 0.71, 0.69, and 0.67 for UCB, FCB, and UAFCB, respectively. The carbohydrate content also saw a significant increase between the unprocessed and processed beverages with values of 7.85 ± 0.20, 12.95 ± 0.32, and 13.45 ± 1.45 for UCB, FCB, and UAFCB, respectively.
Table 2.
Comparison of the various proximate contents of chickpea beverages.
Complex carbohydrates and proteins can be broken down into simpler forms during fermentation, improving their availability for absorption and utilization by the body [49], contrary to the observations made in this study. The crude carbohydrate content after fermentation and UAF increased significantly (Table 2). To further understand this, it is important to note that the solid contents of the chickpea beverages also increased due to the presence of the microorganisms used for the fermentation, thus affecting the carbohydrate content. It is safe to say the carbohydrate content obtained from the treated samples is not accurate. Similarly, Refs. [19,50] found that the application of ultrasonic waves causes a more even distribution of microorganisms throughout the fermentation medium, which affects the action of the microorganisms on the product.
Furthermore, proteins and carbs, for example, can be released more readily during ultrasound treatment, encouraging their breakdown and increasing their bioavailability [25]. Using ultrasonic waves can shorten fermentation times while increasing cell development and product yield. Ref. [2] in a study discovered that during fermentation, the quantities of some critical amino acids for human health, including lysine and tryptophan, increased. This accounts for the slight decrease in crude protein contents observed after treatments. This observation can be applied to the other proximate contents.
3.2. Effect of Processing on Structural Qualities of Ultrasound-Assisted Fermentation on Chickpea Beverages
3.2.1. Influence of Ultrasonication on Structural Integrity via AFM
The atomic force microscope (AFM) visualizes conformational changes in structures of samples that cannot be viewed with other visual-enhancing methods and displays image surfaces of biological structures in their natural environment and oligomeric forms. This analysis compared the topographic and nanostructural changes in UCB to those in UAFCB. Both samples’ structures were distinct when viewed with an atomic force microscope, with varying distributions and sizes of aggregates present. The ultrasound treatment further aided in the even distribution of the particles present due to the breakdown of bonds present in the sample. The topological representation of the UCB showed narrow and evenly distributed aggregates, with only a few especially significant structures, making the structure have a smooth-like view. In a review by Ref. [51], the authors revealed that the plant liquids or suspensions had a smooth and homogeneous surface with occasional big aggregates, which is in line with the observation made in this study. The authors opined that the presence of proteins in the beverage potentially contributed to the formation of aggregates.
In contrast, the UAFCB exhibited a more heterogeneous surface with larger aggregates and a higher degree of surface roughness due to the dispersion of particles. The combined actions of ultrasonic therapy and fermentation, which encourage the breakdown of complex proteins and polysaccharides into simpler molecules, are responsible for these alterations [52]. According to the results (Figure 2), ultrasonication significantly impacted the CB, with UAFCB’s structural makeup displaying a superior fermented chickpea beverage. UAF has the potential to be a useful technique for improving the physicochemical characteristics and nutritional value of beverages made from chickpeas.
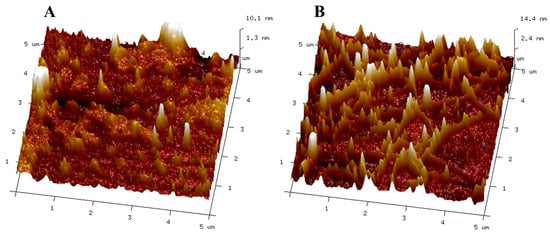
Figure 2.
Atomic force microscopy images showing the differences in the topology of the unfermented chickpea beverage (A) and the ultrasound-assisted fermented beverage (B).
3.2.2. Influence of Ultrasonication on Structural Integrity via SEM
Ultrasonication and fermentation are two food processing technologies that were shown to change the microstructure of food products. These changes affect the properties of the product as a whole. Ultrasound, for instance, was known to change the structure of proteins, thereby making them easier to dissolve and better at emulsifying [53]. It was shown that ultrasonication also helps break down complex carbohydrates, such as oligosaccharides, improving the texture and digestibility of the product and the shelf life of food products [54]. These characteristics of ultrasonic treatments are similar to products that underwent fermentation. Scanning electron microscopy (SEM) was used to identify the morphological characteristics of UAFCB. A comparison of the images of SEM between UCB, FCB, and the UAFCB showed that the processed samples were more porous compared to the unprocessed samples, with the UAFCB sample having a more porous and rough surface (Figure 3). The compact nature observed in the UCB due to the bonds present was cleaved during fermentation. Ultrasonication further cleaved the bonds, making the various components of the sample free and available to be utilized by the LAB. The micrograph of the unfermented sample, as seen in Figure 3A, revealed a smooth continuous surface with no visible fractures and a few tiny pores on the surface, as described by [7]. The structure also showed visible continuous sheet-like structures that indicate the presence of starch and protein structures, similar to the observations made by [55]. A visible degradation of the cell wall is seen, changing it to a more loosened, irregular, rough surface with pits of the fermented chickpea sample in Figure 3B, which is also characterized by the increase in the sizes of the pores present with visible structural differences. The particles of the fermented chickpea sample characteristically showed a heterogenous and rough surface depicted by some cavitations due to the breakdown of cell structures by Lacticaseibacillus paracasei S2601-8 during fermentation. Refs. [7,56] opined that there was a degradation of starch and protein components of the cell walls by the LAB, which accounts for the availability of organic acids, phenolic content, and free amino acids among other nutraceuticals, bioactive, and nutritional components of the beverages by facilitating the diffusion of nutrients, gases, and metabolic products and improved digestibility of nutrients. These changes indicate the biological and chemical transformations that occur during fermentation, which were shown to improve the nutritional quality, flavour, and shelf-life of legume-based products.
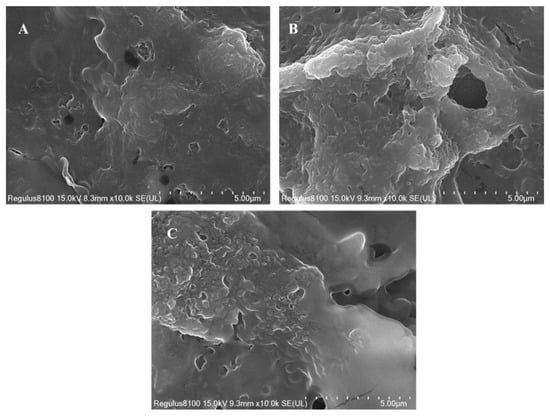
Figure 3.
Scanning electron images showing the differences in the microstructure of the unfermented chickpea beverage (A), the fermented beverage (B), and the ultrasound-assisted fermented beverage (C).
The UAFCB sample particles displayed a more rough, porous, and loose surface with evenly distributed particles and even larger cavitations than the fermented samples (Figure 3B), similar to the description of whey proteins observed by Ref. [57]. The analysis found that the cavitation phenomena, which produced a sponge effect, contributed to the UAFB’s loosened structure (Figure 3C). There was an increase in the amount of reducing sugar present because the phenomenon caused covalent, non-covalent, hydrogen, and disulfide connections between the molecules of the cell wall to break, increasing the concentration of lactic acid. Bond breaking could increase the bioavailability of polyphenols. The breakage of the bonds of the chickpea cells resulted in smaller particles with an increased surface area and improved bioavailability of nutrients for the fermenting microorganisms [58].
3.2.3. Influence of Ultrasonication on Structural Integrity via FTIR
The positions of the chemical structure of chickpea beverages shown as peaks of lignin, hemicellulose, and cellulose examined the structural changes of the UCB, FCB, and UAFCB were observed with FTIR (Figure 4). Minor increases in peak values were observed in the C-I and C-Br stretch and the carbonyl (C=O) stretch after each processing technique. However, the C≡C terminal alkyne (monosubstituted) stretch and the aromatic and amines stretch observed a decrease in the peak values. The peak ranges observed were within the iodo C-I, C≡C terminal alkyne, carbonyl (C=O), and NH2 stretches with varying peak values. Chickpea fermentation results in beverages high in protein, soluble fibre, and bioactive components compared to unfermented beverages, making them appealing to health-minded drinkers, according to Refs. [59,60]. Including ultrasonication makes fermented chickpea drinks more stable and uniform by changing the structure of the proteins and making it easier for the particles to spread out, thereby altering the overall chemical structure of the drink [61]. FTIR spectroscopy is a powerful analytical method that can investigate molecular structure changes in food systems [62]. It can reveal the presence of alcohol and hydroxyl groups, alkane and alkene groups, nitrogen-oxy groups, sulfuroxy groups, aryl groups, and aliphatic iodo groups in legumes [63].
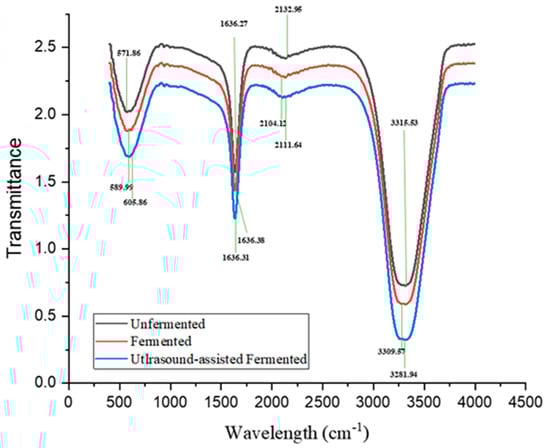
Figure 4.
FTIR analysis showing the differences in chemical structures of the unfermented chickpea beverage, the fermented beverage, and the ultrasound-assisted fermented beverage.
According to Refs. [63,64], FTIR results usually have peaks observed at the aliphatic iodo compounds, and C-I and C-Br stretch between 500 and 600 cm−1. In this study, the peak observed for the unfermented sample recorded at 571.86 cm−1 significantly shifted to 589.99 cm−1 for the fermented sample. Similarly, the aliphatic iodo peak observed for the UAFCB was recorded at 605.86 cm−1, which is significantly different from the UCB and the FCB. The presence of a peak in the aliphatic bromo-iodo compounds stretch indicates the presence of iodine and bromide compounds as nutritional components of chickpeas [65]. Again, the FTIR spectra samples showed changes in the fingerprint region of 2111.64 cm−1, 2104.12 cm−1, and 2132.56 cm−1 for the alkyne regions of the UAFCB, FCB, and UCB, respectively. According to Ref. [64], the C≡C terminal alkyne (monosubstituted) falls within the 2100–2140 cm−1 range, implying that the peak observed is triple bond carbon compounds. A significant alteration in the peak location for the C≡C terminal alkyne is observed in this study after treatment, consistent with the range proposed by [64].
Meanwhile, the characteristic region for the typical absorption of phenolic compounds is primarily responsible for the band found between 1700 cm−1 and 1200 cm−1. This region is characterized by the stretching band of carbonyl (C=O) groups. The biological substances, particularly organic compounds, including ketones, aldehydes, esters, and carboxyls, gave off absorption bands between 1800 and 750 cm−1 [56,64]. In line with this, the peaks of 1636.27 cm−1, 1636.31 cm−1, and 1636.38 cm−1 for UCB, FCB, and UAFCB fall within the above range. It was noted that ultrasonication can change FCB’s lipid and carbohydrate content [19]. This observation also aligns with high fatty acid, such as linoleic and oleic acid, and the phenolic content of chickpeas [66]. The modifications in peak positions observed could result from the asymmetrical stretching vibration of hemicellulose and cellulose due to the treatment processes utilized and could further influence the fermented chickpea beverage’s structural integrity and overall quality.
Additionally, the wide range between 3500 and 3000 cm−1 characterizes aromatic compounds and amines found in amino acids, peptides, proteins, alkaloids, DNA, and RNA because of amino (NH2) groups [7,63]. The peaks obtained are similar to what [67] described. Ref. [68] found that applying ultrasonication to a sample can cause changes in the amide I and amide II regions of FTIR spectra, which are related to protein secondary structures. According to [69], ultrasonication could induce changes in protein conformations, leading to higher protein unfolding. This alteration can be observed in the peak values of 3289.14 cm−1 in the UAFCB, being different from the UCB, which recorded a peak value of 3315.35 cm−1 and the FCB, which also recorded a peak value of 3309.57 cm−1 (Figure 4). The measured peak values fell between the broad range of 3500 and 3000 cm−1, which is typical of aromatic chemicals and also amines that were identified in amino acids, peptides, proteins, alkaloids, DNA, and RNA because of amine (NH2) groups [7,63]. Amino acids, peptides, and proteins are known to be present in large concentrations in chickpeas [66]. These changes in protein structures can significantly impact the beverage’s overall structural integrity, enhancing its stability and functional properties. According to the findings obtained, chickpea contains significant amounts of carbohydrates, protein, and lipids in addition to several functional groups, such as amine, carboxyl, and hydroxyl. Protein was related to the amine group, whereas fatty acids and carbohydrates were related to the carboxyl group. The hydroxyl group is connected to both lipids and carbohydrates.
3.3. High-Performance Liquid Chromatography (HPLC) Analysis
3.3.1. Organic Acids Content of Ultrasound-Assisted Chickpea Beverages
The amount of organic acid produced in chickpea-based beverages can be affected by fermentation and fermentation assisted by ultrasound. These techniques might increase the production and release of organic acids, improving the finished product’s sensory qualities and nutritional worth. Bacteria cause the breakdown of carbohydrates during fermentation, producing metabolites, including organic acids such as lactic acid and acetic acid [49]. Moreover, the release of bound organic acids during fermentation can be achieved by the activity of microbial enzymes, which enhances the bioavailability of these acids and the acidity levels of the finished product [70]. The creation of organic acids during fermentation can improve the nutritional value of chickpea beverages as well as their flavor and consistency, making the final product more delectable and appealing overall [36,71]. The organic content of the processed beverages increased compared to the unprocessed ones. However, the organic acid concentrations obtained after ultrasonic treatment were significantly lower than that of the fermented sample. The concentration of propanoic acid recorded was the highest, especially in the FCB, with a value of 5.56 mg/mL, followed by lactic acid, while citric acid content reduced drastically.
Chickpeas are recorded to contain some organic acids. According to Ref. [72], chickpea varieties have varying naturally occurring organic acid contents. In order to increase the formation and release of organic acids in beverages derived from chickpeas, it is feasible to treat chickpeas using ultrasound. This approach would work well due to the possibility that the ultrasound treatment of chickpeas damages their cell walls, making them more vulnerable to the activity of microbial enzymes and encouraging the release of intracellular substances such as organic acids [25]. Additionally, the capacity of ultrasonic treatment to speed up the fermentation process leads to a higher output of organic acids in a shorter amount of time [73]. Ultrasound-assisted fermentation is beneficial for increasing the organic acid content of several food products, including fermented milk and kefir [74]. However, compared to the outcomes achieved when the beverages were just fermented, the use of UAF resulted in a sizable drop in the organic content discovered in this experiment (Table 3).
Table 3.
Organic acid content of chickpea beverage samples after fermentations.
Even though the generation of lactic acid was the main focus of this work, other organic acids were identified in the samples. Except for citric acid, most of the organic acid levels in chickpea beverages increased during fermentation. This finding is comparable to that of Ref. [38], who discovered that fermentation reduced the amount of citric acid in chickpea beverages. Using ultrasound during fermentation resulted in an extra reduction in citric acid content. The naturally occurring organic acid noted to be the most abundant was propanoic acid, a short-chain fatty acid. According to Ref. [75], Lactiplantibacillus paracasei may ferment substrates such as lactose and other sugars to produce propanoic acid. In this process, lactose is broken down into lactic acid, which is subsequently changed into propanoic acid by the action of certain enzymes generated by the bacterium. This process further explains the reduced lactic acid concentration observed compared to the propanoic acid concentrations. In contrast, acetic acid was discovered to have the lowest concentration of naturally occurring organic acids, as seen in the UCB sample (Table 3), though it increased after fermentation. The significant drop in organic acid levels observed after UAF was potentially caused by damage to microbial cells, which are crucial for generating enzymes required for forming organic acids.
3.3.2. Phytochemicals of Ultrasound-Assisted Chickpea Beverages
Phytochemicals, also known as phytonutrients, are naturally occurring compounds that may be found in plants and are known to give various advantages to human health [76], with factors including the genotype, the conditions of production, and the processing processes used. This study analyzed and compared the effect of ultrasound-assisted fermentation of chickpea beverages to unfermented beverages. According to the findings presented in Table 4, the total polyphenol derivatives were high, with concentrations ranging from 0.1040 ± 003 to 35.60 ± 05 µg/mL. In contrast, the phytosterol content reduced significantly in the processed samples. There are approximately seven different polyphenols, with phenolic acids being the most common.
Table 4.
Phytochemical content of chickpea beverage samples.
The manner of product processing could affect the finished product’s phytochemical profile. Fermentation is one type of processing that might change the amount of polyphenols present in chickpeas. According to Ref. [77], certain microorganisms, such as lactic acid bacteria, can create enzymes that hydrolyze bound forms of polyphenols during the fermentation process. This enhances the polyphenols’ bioavailability as well as their antioxidant activity. Additionally, particular fermentation conditions might encourage the creation of additional phenolic compounds, which can increase the health-promoting characteristics of fermented chickpea products. This interpretation may be seen quite plainly in the results obtained in Table 4. Some phytochemicals, including chlorogenic acid, biochanin A, p-coumaric acid, cinnamic acid, rosmarinic acid, quinic acid, salvianolic acid, and ellagic acid, had significantly higher concentrations after fermentation. The breakdown of plant cell walls and the release of cell-bound compounds during fermentation by enzymes produced by Lacticaseibacillus paracasei could account for these increases in phytochemical concentrations. This makes it easier for these chemicals to be released and used. In contrast, others, such as stigmasterol and β-sitosterol, had significantly lower concentrations.
According to Ref. [19], ultrasound-assisted fermentation is emerging as a potentially useful method for boosting the levels of bioactive chemicals in various foods, including chickpeas. Again, according to [78,79], phytochemicals bound to their polysaccharide subunits are less easily released. However, with ultrasonication, the chemical bond dissociation effect enhances phenolic acids bond cleavage into their aglycon derivatives, releasing the phenolic compound into the samples as observed; consequently, ultrasound-assisted fermentation can lead to a higher release of bound polyphenol [80]. According to previous research, adding fermentation to ultrasound treatment significantly increases the total polyphenolic content (TPC) and antioxidant activity of various food products, including soybean and grape pomace [81]. The current investigation supports this finding. Compared to the samples that were not fermented, the phytochemical content of the UAF samples showed a considerable rise.
Once more, the concentration of phytosterols found was dramatically reduced. The phytosterol stigmasterol dropped from 11.70 ± 05 µg/mL in the UCB to 4.670 ± 04 and 2.410 ± 03 µg/mL in the FCB and UAFCB, respectively. At the same time, the level of β-sitosterol dropped from 20.30 ± 05 µg/mL to 9.31333 µg/mL in the UCB and UAFCB, respectively. A similar observation was made by Ref. [17]. They concluded that the decline in phytosterol content might be attributable to the dehydration or oxidation that occurs in an oxygen-rich environment when substrates are subjected to heat or ultraviolet light. Subsequently, the exposure of the samples to prolonged heat as an essential parameter in the fermentation process of the heat produced due to the ultrasound treatment significantly impacted the phytosterol contents. This was found to be the case when the samples were exposed to heat for a longer period of time. Table 4 and Figure 5 show that salicylic acid, caffeic acid, tanshinone IIA, epicatechin gallate, and glycyrrhetinic acid were not substantially different from one another in any of the samples (p > 0.05). According to Ref. [82], the fluctuations in pH during the fermentation process may cause these polyphenolic chemicals without causing any substantial alteration.
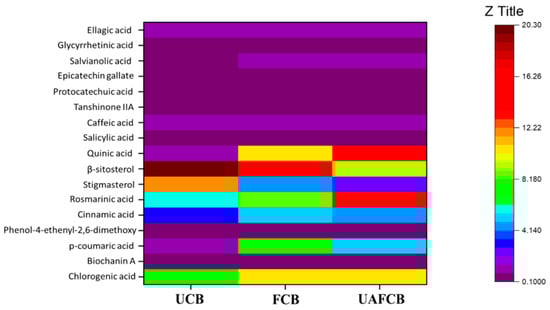
Figure 5.
Multivariate heatmap showing the varying phytochemical contents of the various samples.
The sample that was fermented had the highest overall phytochemical content, whereas the samples that were not fermented had the lowest. It is reasonable to conclude that fermentation was a significant contributor to the rise in the observed phytochemical content. In spite of this, the application of ultrasound had a significant impact on the phytochemical composition of the samples as compared to the sample that was not treated. The difference between the FCB and UAFCB in terms of the total phytochemical content was not very large either.
3.4. Microbial Enumeration
A food product’s physicochemical, chemical, and bioactive composition is significantly influenced by its microbiological quality [83]. In addition, a food product’s microbiological quality significantly impacts how long it can be preserved [84]. The main determinants of the risk of microbial infection in beverages made from high-resistance environmental bacteria are the circumstances of the chickpeas in their raw state and their handling, processing, and storage [85]. Yeast and mesophilic bacterial growth can be impacted by the water activity of raw materials and end products [86]. Creating a consumable good that is secure and stable over time depends critically on the microbiological quality of the chickpea beverages produced. In light of the previous, consider that it was essential to evaluate the beverage’s microbiological quality due to the high moisture content, examining the products’ microbiological composition focused on mesophilic bacteria, Staphylococcus aureus, yeast, and mould. However, there were no detected microorganisms except for mesophilic bacteria.
Table 5 provides a summary of the data that were gathered. There was no Staphylococcus aureus present or any indication of yeast or mould growth. They were potentially preoccupied with making the drinks, which could be one explanation for their absence. The obtained chickpea milk was heated in a water bath at 60 °C for 30 min as a means to obtain a sterile product. Staphylococcus aureus cannot endure high temperatures for an extended period of time, as opined by [87]. Additionally, it is well known that yeast cannot thrive in hot environments [88]. The aerobic mesophilic bacteria count is typically used to determine the degree of food freshness, estimate product stability or shelf life, and evaluate the microbiological quality of foods [89,90].
Table 5.
Microbial quality of processed chickpea beverages.
On the other hand, mesophilic bacteria were found potentially because Lacticaseibacillus paracasei S2601-8 was present in the treated beverages. The mesophilic bacteria cell counts of 2.26 ± 0.03 and 2.41 ± 0.02 log cfu mL−1 for FCB and UAFCB, respectively, are lower than the recommended daily minimum consumption level [91]. The absence of any signs of microbiological contamination could be because meticulous attention was paid to maintaining a high degree of hygienic standards during the processing step.
3.5. Sensory Profile
3.5.1. Effect of Processing on Appearance and Colour UAF on Chickpea Beverages
Given that colour is the first feature consumers consider when selecting whether to accept a product, colour is a crucial quality index that influences perception, preference, and purchasing power [48,92]. Chickpea beverages’ quality can be primarily judged by their colour, significantly impacting how well consumers welcome their products. Therefore, after being produced with fermentation and UAF, measurements of the colour characteristics of the chickpea beverages were taken. The findings are presented in Table 6. The results demonstrate that most colour indices did not exhibit significantly significant variation. Notwithstanding, the processing technique made the processed beverages appear more brown in colour compared to the unfermented beverages.
Table 6.
Colour of chickpea beverage samples before and after processing.
An object’s ability to reflect or transmit light is described by the chromatic indicator L*, an indicator of lightness value. It denotes the sample’s whiteness. The green colour is represented by negative (−) a*, the red colour by positive (+) a*, the yellow colour by positive (+) b*, and the blue colour by negative (−) b* [93]. Except for the L* value obtained for UCB and UAFCB, there was no significant difference (p < 0.05) in the L* values of any of the samples. The raw freshly prepared samples had a pale-yellow colour. Although all samples contained yellow, the treated samples also contained green, as shown by their negative (−) a* values. However, the three samples did not show a significant difference in these colour differences. The use of heat during the production of the beverages potentially caused a Maillard reaction, which would possibly result in the existence of the yellow colour observed [94]. Ref. [13] claims that chickpea beverages have this effect, with a higher level of browning observed after fermentation. According to Ref. [36], fermentation time and temperature were important variables affecting the beverage’s final colour as a factor significantly affecting Maillard reactions.
The browning index is an important metric since it determines the purity of the brown colour produced during processing by enzymatic and non-enzymatic reactions [48]. The non-enzymatic browning begins with a low energy order, eventually transitioning into autocatalysis [94]. Compared to the FCB and the UAFCB, the UCB’s browning index value was statistically (p < 0.05) different. Compared to UCB, FCB and UAFCB had higher browning indices, in line with the finding by Ref. [94] that cooking or processing foods cause chemical processes that give them a brown colour. Additionally, the samples became discoloured potentially due to fermentation and ultrasonic cavitation, which encouraged the formation of free radicals due to the presence of minerals in chickpeas and the oxidation of phenolic compounds, causing a series of changes that increased the browning index [95]. The type and amount of phenolic compounds in the chickpea substrates impact how much of this enzymatic browning occurs [96].
Chroma values describe the intensity of the colour value and the saturation level [97]. Colour purity can be seen in chroma values. With no grey or white colour present, a high chroma value indicates the presence of highly reflecting materials or fluorescent surfaces [97]. Consequently, the more pure or bright the colour is, the higher the chroma values are [48]. The chroma values found in this research varied from 32.0 to 38.2. No significant (p < 0.05) difference was found since the values obtained were so close together. However, the sample that underwent fermentation had the lowest chromatic index. A previous investigation by [98] discovered that fermented food items treated with ultrasound had a larger increase in chromaticity. The high chromaticity of the ultrasound-treated sample is a sign of the purity of the colours in the sample. This may be accounted for by the chickpeas’ cellular-bound yellow pigmentation’s sensitivity to cavitation, as well as the effects of the processing methods’ osmotic and hydrodynamic properties [99].
Hue is a phrase used to describe colour perception in its most basic form, as the dominant wavelength dictates. It refers to the degree of redness and yellowness, with 0 or 360 denoting red, 90 denoting yellow, 180 denoting green, and 270 denoting blue [93]. Chickpea beverages’ appearance is influenced by several elements, including colour, optical, and geometric properties. The hue angle was calculated to determine the colour of the chickpea beverages. The chickpea beverages tested in this study had a yellow tint, according to the hue angle values that ranged from 86.61 ± 3.81 to 92.69863 ± 0.26106. Enzymes produced by bacteria during the fermentation process may impact the pigments and result in the creation of metabolites, which in turn may impact the samples’ chroma [100]. Furthermore, the samples’ colour can be definitively attributed, in large part, to the fermentation processing technology used to improve the chickpea beverage.
3.5.2. eNose Analysis
A radar chart of eNose sensor responses, which showed distinctive fragrance patterns for each sample, was used to highlight the sensor array reactions to the volatile organic compounds (VOCs) contained in UCB, FCB, and UAFCB. Similar scent print patterns were seen in all three samples’ eNose sensor responses to VOCs (Figure 6). The sensitivity of the FCB and UAFCB were very similar, with a minute distinction of the nitrogen oxide compound present. The volatile compounds in the UCB recorded the least volatile compounds. According to Ref. [101], the sensors’ non-specificity enables them to identify volatile compounds of both organic and inorganic origins. The three samples’ headspace volatile compositions were not noticeably different based on the sensor array’s response to VOCs, which produced scent prints with similar patterns and intensities.
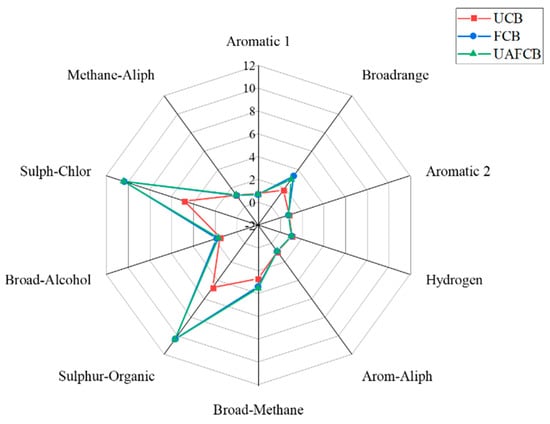
Figure 6.
A radar plot of gas sensors of chickpea beverage samples from different processing methods.
Different reactions were seen from sensors S2 (primarily sensitive to nitrogen oxide), S6 (primarily sensitive to methane), S7 (primarily sensitive to sulfides), and S9 (primarily sensitive to aromatic sulfides). Although fermented and the UAF beverages had the maximum and similar intensities in the sensors stated above, the UAFCB displayed a minutely higher sensitivity at S2 (primarily sensitive to nitrogen oxide), further indicating that the UAF improved the fermentation process even by a minute improvement [102]. This result implies that the optimized sample outperformed the others in the fragrance analysis despite the composition of all samples being similar.
3.5.3. Consumer Acceptability Test
Between the processed chickpea beverages (fermented and ultrasound-treated) and the control (unfermented), the analysis of variance revealed no appreciable variations in sensory characteristics (Table 7). The acceptability of each sample by consumers was evaluated using its acceptability index (Figure 7). The UCB sample showed a higher acceptance index of 7.03 ± 1.80 for all criteria than the processed samples; [45] defined acceptable as an acceptability score of less than 70%, and thus scores below 70% were deemed undesirable.
Table 7.
Sensory characteristics of processed chickpea beverages based on a 9-point hedonic scale.
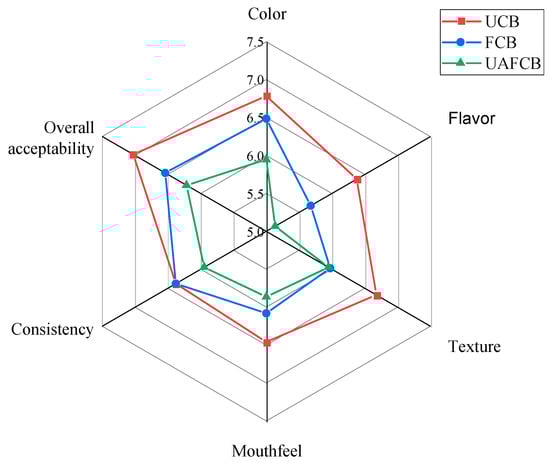
Figure 7.
Radar plot showing sensory scores of chickpea beverage samples.
Table 7 compares the various processing methods by utilizing analysis of variance to show the acceptance outcomes for the processed beverage samples. The acceptance index for each attribute was under 60%. Furthermore, there were no appreciable variations in the acceptability of certain features among the different processing techniques. All samples fell below the threshold (≥70) for all sensory qualities, resulting in low acceptance, according to the [45] hypothesis, which states that an acceptability score of 70% is regarded as acceptable. Aside from the general acceptability of the UCB sample, the sensory qualities were all below the thresholds.
4. Conclusions
This study compared the effects of ultrasound-assisted fermentation on chickpea-based beverages’ nutritive and sensory components. The results indicate that the nutritional value of chickpea-based beverages was boosted by both the traditional and ultrasound-assisted fermentation procedures. The presence of different organic acids in the beverage was attributed to the fermentation time and the metabolic pathways available to the Lacticaseibacillus paracasei S2601-8 strain. The application of ultrasound treatment successfully broke down complicated molecules and released enzymes, making it easier for microorganisms to access nutrients, leading to better fermentation and homogenization. However, the microstructural analysis indicated that the processing techniques applied to the beverages, especially the application of ultrasound, significantly impacted the beverage’s quality. Despite this, the appearance of processed beverages, such as colour, did not significantly affect consumers’ acceptance. On the other hand, the aroma significantly influenced general acceptance. Overall, the fermented and ultrasound-assisted fermented beverages resembled one another, with only a few notable variations in their properties, proving that ultrasound therapy had no different effects on the beverage’s outcome from traditional fermentation techniques. The development of this novel, wholesome, and appealing food product may significantly benefit from further study to evaluate the economic viability of this technique and further evaluate the processing parameters. Special consideration can be given to better optimize the fermentation time to prevent degradation in the nutritional contents of the product.
Author Contributions
Conceptualization, N.A.N.J. and Y.M.; Methodology, N.A.N.J. and G.B.; Software, J.-N.E. and G.B.; Formal analysis, E.I.; Investigation, N.A.N.J., Y.L., G.B. and E.I.; Resources, Y.M.; Data curation, N.A.N.J., S.Y.-S.S.A., J.-N.E., Y.L. and E.I.; Writing—original draft, N.A.N.J. and S.Y.-S.S.A.; Writing—review & editing, J.-N.E. and Y.M.; Supervision, Y.M.; Funding acquisition, Y.M. All authors have read and agreed to the published version of the manuscript.
Funding
This research was funded by Zhenjiang Key Research and Development Program (Modern Agriculture) grant number NY2020020 and the APC was funded by Nana Adwoa Nkuma Johnson.
Institutional Review Board Statement
Not applicable.
Informed Consent Statement
Informed consent was obtained from all subjects involved in the study.
Data Availability Statement
The data presented in this study are available on request from the corresponding author.
Conflicts of Interest
The authors declare no conflict of interest.
References
- Merga, B.; Haji, J. Economic Importance of Chickpea: Production, Value, and World Trade. Cogent Food Agric. 2019, 5, 1615718. [Google Scholar] [CrossRef]
- Wang, S.; Chelikani, V.; Serventi, L. Evaluation of Chickpea as Alternative to Soy in Plant-Based Beverages, Fresh and Fermented. LWT 2018, 97, 570–572. [Google Scholar] [CrossRef]
- Samtiya, M.; Aluko, R.E.; Dhewa, T. Potential Health Benefits of Plant Food-Derived Bioactive Components: An Overview. Foods 2021, 10, 839. [Google Scholar] [CrossRef] [PubMed]
- Cencic, A.; Chingwaru, W. The Role of Functional Foods, Nutraceuticals, and Food Supplements in Intestinal Health. Nutrients 2010, 2, 611–625. [Google Scholar] [CrossRef] [PubMed]
- Nazhand, A.; Souto, E.B.; Lucarini, M.; Souto, S.B.; Durazzo, A.; Santini, A. Ready to Use Therapeutical Beverages: Focus on Functional Beverages Containing Probiotics. Beverages 2020, 6, 26. [Google Scholar] [CrossRef]
- Mullins, A.P.; Arjmandi, B.H. Health Benefits of Plant-Based Nutrition: Focus on Beans in Cardiometabolic Diseases. Nutrients 2021, 13, 519. [Google Scholar] [CrossRef]
- Zhang, X.; Zhang, S.; Xie, B.; Sun, Z. Influence of Lactic Acid Bacteria Fermentation on Physicochemical Properties and Antioxidant Activity of Chickpea Yam Milk. J. Food Qual. 2021, 2021, 5523356. [Google Scholar] [CrossRef]
- Benali, A.; En-nahli, Y.; Elbaouchi, A.; Kabbour, M.R.; Kumar, S. Nutritional and Technological Optimization of Wheat-Chickpea- Milk Powder Composite Flour and Its Impact on Rheological and Sensorial Properties of Leavened Flat Bread. Foods 2021, 10, 1843. [Google Scholar] [CrossRef]
- Lopes, M.; Pierrepont, C.; Duarte, C.M.; Filipe, A.; Medronho, B.; Sousa, I. Legume Beverages from Chickpea and Lupin, as New Milk Alternatives. J. Ren. Nutr. 2020, 20, e7–e15. [Google Scholar] [CrossRef]
- Rincon, L.; Braz Assunção Botelho, R.; de Alencar, E.R. Development of Novel Plant-Based Milk Based on Chickpea and Coconut. LWT 2020, 128, 109479. [Google Scholar] [CrossRef]
- Sethi, S.; Tyagi, S.K.; Anurag, R.K. Plant-Based Milk Alternatives an Emerging Segment of Functional Beverages: A Review. J. Food Sci. Technol. 2016, 53, 3408–3423. [Google Scholar] [CrossRef] [PubMed]
- Mathew, S.E.; Shakappa, D. A Review of the Nutritional and Antinutritional Constituents of Chickpea (Cicer arietinum) and Its Health Benefits. Crop Pasture Sci. 2022, 73, 401–414. [Google Scholar] [CrossRef]
- Gupta, N.; Quazi, S.; Jha, S.K.; Siddiqi, M.K.; Verma, K.; Sharma, S.; Khan, R.H.; Bhagyawant, S.S. Chickpea Peptide: A Nutraceutical Molecule Corroborating Neurodegenerative and ACE-I Inhibition. Nutrients 2022, 14, 4824. [Google Scholar] [CrossRef] [PubMed]
- Moreira, R.; Roura, S.I.; Valle, C.E. Quality of Swiss Chard Produced by Conventional and Organic Methods. LWT-Food Sci. Technol. 2003, 36, 135–141. [Google Scholar] [CrossRef]
- Nkhata, S.G.; Ayua, E.; Kamau, E.H. Fermentation and Germination Improve Nutritional Value of Cereals and Legumes through Activation of Endogenous Enzymes. Food Sci. Nutr. 2018, 6, 2446–2458. [Google Scholar] [CrossRef]
- Popova, A.; Mihaylova, D. Antinutrients in Plant-Based Foods: A Review. Open Biotechnol. J. 2019, 13, 68–76. [Google Scholar] [CrossRef]
- Zhao, Y.S.; Eweys, A.S.; Zhang, J.Y.; Zhu, Y.; Bai, J.; Darwesh, O.M.; Zhang, H.B.; Xiao, X. Fermentation Affects the Antioxidant Activity of Plant-Based Food Material through the Release and Production of Bioactive Components. Antioxidants 2021, 10, 2004. [Google Scholar] [CrossRef]
- Zhu, Y.Y.; Thakur, K.; Feng, J.Y.; Cai, J.S.; Zhang, J.G.; Hu, F.; Wei, Z.J. B-Vitamin Enriched Fermented Soymilk: A Novel Strategy for Soy-Based Functional Foods Development. Trends Food Sci. Technol. 2020, 105, 43–55. [Google Scholar] [CrossRef]
- Ojha, K.S.; Mason, T.J.; O’Donnell, C.P.; Kerry, J.P.; Tiwari, B.K. Ultrasound Technology for Food Fermentation Applications. Ultrason. Sonochem. 2017, 34, 410–417. [Google Scholar] [CrossRef]
- Chaturvedi, S.; Chakraborty, S. Optimization of Extraction Process for Legume-Based Synbiotic Beverages, Followed by Their Characterization and Impact on Antinutrients. Int. J. Gastron. Food Sci. 2022, 28, 100506. [Google Scholar] [CrossRef]
- Boeck, T.; Ispiryan, L.; Hoehnel, A.; Sahin, A.W.; Coffey, A.; Zannini, E.; Arendt, E.K. Lentil-Based Yogurt Alternatives Fermented with Multifunctional Strains of Lactic Acid. Foods 2022, 11, 2013. [Google Scholar] [CrossRef] [PubMed]
- Demarinis, C.; Verni, M.; Pinto, L.; Rizzello, C.G.; Baruzzi, F. Use of Selected Lactic Acid Bacteria for the Fermentation of Legume-Based Water Extracts. Foods 2022, 11, 3346. [Google Scholar] [CrossRef] [PubMed]
- Dong, Z.Y.; Liu, Y.; Xu, M.; Zhang, T.H.; Ren, H.; Liu, W.; Li, M.Y. Accelerated aging of grape pomace vinegar by using additives combined with physical methods. J. Food Process. Eng. 2020, 43, e13398. [Google Scholar] [CrossRef]
- Gao, X.; Liu, E.; Zhang, J.; Yang, L.; Huang, Q.; Chen, S.; Ma, H.; Ho, C.; Liao, L. Accelerating Aroma Formation of Raw Soy Sauce Using Low Intensity Sonication. Food Chem. 2020, 329, 127118. [Google Scholar] [CrossRef] [PubMed]
- Chemat, F.; Rombaut, N.; Sicaire, A.; Meullemiestre, A.; Abert-vian, M. Ultrasound Assisted Extraction of Food and Natural Products. Mechanisms, Techniques, Combinations, Protocols and Applications. A Review. Ultrason. Sonochem. 2017, 34, 540–560. [Google Scholar] [CrossRef] [PubMed]
- Lopeda-correa, M.; Vald, B.E.; Osorio-tob, J.F. Ultrasound-Assisted Extraction of Phenolic Compounds from Adenaria Floribunda Stem: Economic Assessment. Foods 2022, 11, 2904. [Google Scholar] [CrossRef]
- Lai, J.; Xin, C.; Zhao, Y.; Feng, B.; He, C.; Dong, Y.; Fang, Y.; Wei, S. Optimization of Ultrasonic Assisted Extraction of Antioxidants from Black Soybean (Glycine max var) Sprouts Using Response Surface Methodology. Molecules 2013, 18, 1101–1110. [Google Scholar] [CrossRef]
- Carrillo-lopez, L.M.; Garcia-galicia, I.A.; Tirado-gallegos, J.M.; Sanchez-Vega, R.; Huerta-jimenez, M.; Ashokkumar, M.; Alarcon-rojo, A.D. Recent Advances in the Application of Ultrasound in Dairy Products: Effect on Functional, Physical, Chemical, Microbiological and Sensory Properties. Ultrason. Sonochem. 2021, 73, 105467. [Google Scholar] [CrossRef]
- Ma, X.; Li, T.; He, Y.; Chen, M.; Zhou, J.; Yin, L.; Ma, H. Preliminary Study on Ultrasonic Ageing Zhenjiang Vinegar Mechanism Based on Maillard Simulation System. J. Food Qual. 2020, 2020, 1087863. [Google Scholar] [CrossRef]
- Alves, L.D.L.; Donadel, J.Z.; Athayde, D.R.; Stefanello, M.; Klein, B.; Fagundes, M.B.; De Menezes, C.R.; Barin, J.S.; Cezar, P.; Campagnol, B.; et al. Effect of Ultrasound on Proteolysis and the Formation of Volatile Compounds in Dry Fermented Sausages. Ultrason. Sonochem. 2020, 67, 105161. [Google Scholar] [CrossRef]
- Yıkmıs, S.; Bozgeyik, E.; Simsek, M.A. Ultrasound Processing of Verjuice (Unripe Grape Juice) Vinegar: Effect on Bioactive Compounds, Sensory Properties, Microbiological Quality and Anticarcinogenic Activity. J. Food Sci. Technol. 2020, 57, 3445–3456. [Google Scholar] [CrossRef] [PubMed]
- Yu, Z.; Su, Y.; Zhang, Y.; Zhu, P.; Mei, Z.; Zhou, X. Potential Use of Ultrasound to Promote Fermentation, Maturation, and Properties of Fermented Foods: A Review. Food Chem. 2021, 357, 129805. [Google Scholar] [CrossRef] [PubMed]
- Wang, X.; Kristo, E.; Lapointe, G. Food Hydrocolloids The Effect of Apple Pomace on the Texture, Rheology and Microstructure of Set Type Yogurt. Food Hydrocoll. 2019, 91, 83–91. [Google Scholar] [CrossRef]
- Nirmal, N.P.; Khanashyam, A.C.; Mundanat, A.S.; Shah, K.; Babu, K.S.; Thorakkattu, P.; Al-asmari, F.; Pandiselvam, R. Valorization of Fruit Waste for Bioactive Compounds and Their Applications in the Food Industry. Foods 2023, 12, 556. [Google Scholar] [CrossRef]
- Nemo, R.; Bacha, K. Microbial, Physicochemical and Proximate Analysis of Selected Ethiopian Traditional Fermented Beverages. LWT-Food Sci. Technol. 2020, 131, 109713. [Google Scholar] [CrossRef]
- Mefleh, M.; Faccia, M.; Natrella, G.; Caponio, F.; Summo, C.; De Angelis, D.; Pasqualone, A. Development and Chemical-Sensory Characterization of Chickpeas-Based Beverages Fermented with Selected Starters. Foods 2022, 11, 3578. [Google Scholar] [CrossRef]
- Akpabli-Tsigbe, N.D.K.; Ma, Y.; Ekumah, J.N.; Osabutey, J.; Hu, J.; Xu, M.; Johnson, N.A.N. Single-Frequency Ultrasonic Extraction of Bioactive Chlorogenic Acid from Heilong48 Soybean Variety: Parametric Optimization and Comprehensive Evaluation of Physicochemical and Bioactive Properties. Food Sci. Nutr. 2022, 10, 374–387. [Google Scholar] [CrossRef]
- Zhang, P.; Tang, F.; Cai, W.; Zhao, X. Evaluating the Effect of Lactic Acid Bacteria Fermentation on Quality, Aroma, and Metabolites of Chickpea Milk. Front. Nutr. 2022, 9, 1069714. [Google Scholar] [CrossRef]
- Oba, D.O.; Okunola, O.J.; Oranusi, S.U.; Okagbue, H.I. Data on Microbial and Physicochemical Assessment of Mixed Fruit Wine Produced from Physically Damaged Fruits. Data Br. 2018, 19, 678–686. [Google Scholar] [CrossRef]
- Poliseli-scopel, F.H.; Hernández-herrero, M.; Guamis, B.; Ferragut, V. Comparison of Ultra High Pressure Homogenization and Conventional Thermal Treatments on the Microbiological, Physical and Chemical Quality of Soymilk. LWT-Food Sci. Technol. 2012, 46, 42–48. [Google Scholar] [CrossRef]
- Lucia, M.; Rahayu, S.; Haerah, D.; Wahyuni, D. Detection of Staphylococcus Aureus and Streptococcus Agalactiae: Subclinical Mastitis Causes in Dairy Cow and Dairy Buffalo (Bubalus bubalis). Am. J. Biomed. Res. 2017, 5, 8–13. [Google Scholar] [CrossRef]
- Zheng, X.; Yan, Z.; Han, B.; Zwietering, M.H.; Samson, R.A.; Boekhout, T.; Nout, M.J.R. Complex Microbiota of a Chinese “Fen” Liquor Fermentation Starter (Fen-Daqu), Revealed by Culture-Dependent and Culture-Independent Methods. Food Microbiol. 2012, 31, 293–300. [Google Scholar] [CrossRef] [PubMed]
- Boateng, I.D.; Yang, X.; Li, Y. Optimization of Infrared-Drying Parameters for Ginkgo biloba L. Seed and Evaluation of Product Quality and Bioactivity. Ind. Crop. Prod. 2020, 160, 113108. [Google Scholar] [CrossRef]
- Plesoianu, A.M.; Nour, V. Effect of Some Polysaccharide-Based Edible Coatings on Fresh White Button Mushroom (Agaricus bisporus) Quality during Cold Storage. Agriculture 2022, 12, 1491. [Google Scholar] [CrossRef]
- Monteiro, S.S.; Ribeiro, S.R.; Soquetta, M.B.; Pires, F.J.; Wagner, R.; Severo da Rosa, C. Evaluation of the Chemical, Sensory and Volatile Composition of Sapota-Do- Solimões Pulp at Di Ff Erent Ripening Stages. Food Res. Int. 2018, 109, 159–167. [Google Scholar] [CrossRef]
- Craine, E.B.; Murphy, K.M.; Bramwell, S.; Ross, C.F.; Fisk, S. Strategic Malting Barley Improvement for Craft Brewers through Consumer Sensory Evaluation of Malt and Beer. J. Food Sci. 2021, 86, 3628–3644. [Google Scholar] [CrossRef]
- Jere, A.D.; Mbachi, A.; Mlotha, V.; Thuy, U.; Phan, X.; Adhikari, K. Acceptability of Traditional Cooked Pumpkin Leaves Seasoned with Peanut Flour Processed from Blanched, Deskinned and Raw Peanuts of Different Varieties. Sci. Afr. 2020, 10, e00598. [Google Scholar] [CrossRef]
- Boateng, I.D.; Saalia, F.K.; Zhang, W.; Yang, X.; Li, Y. Non-Thermal Pretreatment Affects Ginkgo biloba L. Seed’s Product Qualities, Sensory, and Physicochemical Properties. J. Food Sci. 2022, 87, 94–111. [Google Scholar] [CrossRef]
- Capozzi, V.; Fragasso, M.; Romaniello, R.; Berbegal, C.; Russo, P.; Spano, G. Spontaneous Food Fermentations and Potential Risks for Human Health. Fermentation 2017, 3, 49. [Google Scholar] [CrossRef]
- Huang, G.; Chen, S.; Dai, C.; Sun, L.; Sun, W.; Tang, Y.; Xiong, F.; He, R.; Ma, H. Effects of Ultrasound on Microbial Growth and Enzyme Activity. Ultrason. Sonochem. 2017, 37, 144–149. [Google Scholar] [CrossRef]
- Kumar, M.; Tomar, M.; Potkule, J.; Punia, S.; Dhakane-lad, J.; Singh, S.; Dhumal, S.; Chandra, P.; Bhushan, B.; Anitha, T.; et al. Functional Characterization of Plant-Based Protein to Determine Its Quality for Food Applications. Food Hydrocoll. 2022, 123, 106986. [Google Scholar] [CrossRef]
- Larsen, L.R.; Van Der Weem, J.; Caspers-weiffenbach, R.; Schieber, A.; Weber, F. Effects of Ultrasound on the Enzymatic Degradation of Pectin. Ultrason. Sonochem. 2021, 72, 105465. [Google Scholar] [CrossRef]
- Kentish, S.; Ashokkumar, M. The Physical and Chemical Effects of Ultrasound. In Ultrasound Technologies for Food and Bioprocessing; Springer: New York, NY, USA, 2011; pp. 1–12. [Google Scholar] [CrossRef]
- Chemat, F.; Khan, M.K. Applications of Ultrasound in Food Technology: Processing, Preservation and Extraction. Ultrason. Sonochem. 2011, 18, 813–835. [Google Scholar] [CrossRef] [PubMed]
- Zafar, T.A.; Aldughpassi, A.; Al-mussallam, A. Microstructure of Whole Wheat versus White Flour and Wheat- Chickpea Flour Blends and Dough: Impact on the Glycemic Response of Pan Bread. Int. J. Food Sci. 2020, 2020, 8834960. [Google Scholar] [CrossRef] [PubMed]
- Akpabli-Tsigbe, N.D.K.; Ma, Y.; Ekumah, J.N.; Osabutey, J.; Hu, J.; Xu, M.; Johnson, N.A.N. Novel Solid-State Fermentation Extraction of 5-O-Caffeoylquinic Acid from Heilong48 Soybean Using Lactobacillus Helviticus: Parametric Screening and Optimization. LWT 2021, 149, 111809. [Google Scholar] [CrossRef]
- Chandrapala, J.; Zisu, B.; Palmer, M.; Kentish, S.; Ashokkumar, M. Effects of Ultrasound on the Thermal and Structural Characteristics of Proteins in Reconstituted Whey Protein Concentrate. Ultrason. Sonochem. 2011, 18, 951–957. [Google Scholar] [CrossRef]
- Abesinghe, A.M.N.L.; Islam, N.; Vidanarachchi, J.K.; Prakash, S.; Silva, K.F.S.T.; Karim, M.A. Effects of Ultrasound on the Fermentation pro Fi Le of Fermented Milk Products Incorporated with Lactic Acid Bacteria. Int. Dairy J. 2019, 90, 1–14. [Google Scholar] [CrossRef]
- Gupta, M.; Abu-ghannam, N. Barley for Brewing: Characteristic Changes during Malting, Brewing and Applications of Its. Compr. Rev. Food Sci. Food Saf. 2010, 9, 318–328. [Google Scholar] [CrossRef]
- Ayyash, M.; Liu, S.-Q.; Al Mheiri, A.; Aldhaheri, M.; Raeisi, B.; Al-Nabulsi, A.; Osaili, T.; Olaimat, A. In Vitro Investigation of Health-Promoting Benefits of Fermented Camel Sausage by Novel Probiotic Lactobacillus plantarum: A Comparative Study with Beef Sausages Mutamed. LWT-Food Sci. Technol. 2018, 99, 346–354. [Google Scholar] [CrossRef]
- Ashokkumar, M.; Lee, J.; Kentish, S.; Grieser, F. Bubbles in an Acoustic Field: An Overview. Ultrason. Sonochem. 2007, 14, 470–475. [Google Scholar] [CrossRef]
- Fadlelmoula, A.; Pinho, D.; Carvalho, V.H.; Catarino, S.O.; Minas, G. Fourier Transform Infrared (FTIR) Spectroscopy to Analyse Human Blood over the Last 20 Years: A Review towards Lab-on-a-Chip Devices. Micromachines 2022, 13, 187. [Google Scholar] [CrossRef] [PubMed]
- Dıblan, S.; Kadiroğlu, P.; Aydemir, L.Y. FT-IR Spectroscopy Characterization and Chemometric Evaluation of Legumes Extracted with Different Solvents. Food Health 2018, 4, 80–88. [Google Scholar] [CrossRef]
- Bayu, A.; Nandiyanto, D.; Oktiani, R.; Ragadhita, R. How to Read and Interpret FTIR Spectroscope of Organic Material. Indones. J. Sci. Technol. 2019, 4, 97–118. [Google Scholar] [CrossRef]
- Mi’skiewicz, K.; Rosicka-kaczmarek, J.; Nebesny, E. Effects of Chickpea Protein on Carbohydrate Reactivity in Acrylamide Formation in Low Humidity Model Systems. Foods 2020, 9, 167. [Google Scholar] [CrossRef] [PubMed]
- Jukanti, A.K.; Gaur, P.M.; Gowda, C.L.L.; Chibbar, R.N. Nutritional Quality and Health Benefits of Chickpea (Cicer arietinum L.): A Review. Br. J. Nutr. 2012, 108, S11–S26. [Google Scholar] [CrossRef]
- Kadiroğlu, P.; Aydemir, L.Y.; Akcakaya, F.G. Prediction of Functional Properties of Registered Chickpea Samples Using FT-IR Spectroscopy and Chemometrics. LWT 2018, 93, 463–469. [Google Scholar] [CrossRef]
- Zhao, F.; Zhai, X.; Liu, X.; Lian, M.; Liang, G.; Cui, J.; Dong, H. Properties, and Enzymolysis of Walnut Protein Isolate. Molecules 2022, 27, 208. [Google Scholar] [CrossRef]
- Kang, S.; Zhang, J.; Guo, X.; Lei, Y.; Yang, M. Effects of Ultrasonic Treatment on the Structure, Functional Properties of Chickpea Protein Isolate and Its Digestibility. Foods 2022, 11, 880. [Google Scholar] [CrossRef]
- Adebo, O.A.; Medina-Meza, I.G. Impact of Fermentation on the Phenolic Compounds and Antioxidant Activity of Whole Cereal Grains. Molecules 2020, 25, 927. [Google Scholar] [CrossRef]
- Mengesha, Y.; Tebeje, A.; Tilahun, B. Review Article A Review on Factors Influencing the Fermentation Process of Teff (Eragrostis Teff) and Other Cereal-Based Ethiopian Injera. Int. J. Food Sci. 2022, 2022, 4419955. [Google Scholar] [CrossRef]
- Toker, C.; Karhan, M.; Ulger, S.; Departments, S.; Crops, F. Endogenous Organic Acid Variations in Different Chickpea (Cicer arietinum L) Genotypes Endogenous Organic Acid Variations in Different Chickpea (Cicer arietinum L.) Genotypes. Acta Agric. Scand. Sect. B-Plant Soil Sci. 2004, 54, 42–44. [Google Scholar] [CrossRef]
- Wang, H.; Tao, Y.; Li, Y.; Wu, S.; Li, D.; Liu, X.; Han, Y.; Manickam, S.; Loke, P. Application of Ultrasonication at Different Microbial Growth Stages during Apple Juice Fermentation by Lactobacillus Plantarum: Investigation on the Metabolic Response. Ultrason. Sonochem. 2021, 73, 105486. [Google Scholar] [CrossRef] [PubMed]
- Vieira, C.P.; Rosario, A.I.L.S.; Lelis, C.A.; Rekowsky, B.S.S.; Carvalho, A.P.A.; Rosário, D.K.A.; Elias, T.A.; Costa, M.P.; Foguel, D.; Conte-junior, C.A. Bioactive Compounds from Kefir and Their Potential Benefits on Health: A Systematic Review and Meta-Analysis. Oxid. Med. Cell. Longev. 2021, 2021, 9081738. [Google Scholar] [CrossRef] [PubMed]
- Suwannakham, S.; Yang, S. Enhanced Propionic Acid Fermentation by Propionibacterium Acidipropionici Mutant Obtained by Adaptation in a Fibrous-Bed Bioreactor. Biotechnol. Bioeng. 2005, 91, 325–337. [Google Scholar] [CrossRef] [PubMed]
- Leitzmann, C. Characteristics and Health Benefits of Phytochemicals. Complement. Med. Res. 2016, 23, 69–74. [Google Scholar] [CrossRef]
- Sharma, R.; Garg, P.; Kumar, P.; Bhatia, S.K.; Kulshrestha, S. Microbial Fermentation and Its Role in Quality Improvement of Fermented Foods. Fermentation 2020, 6, 106. [Google Scholar] [CrossRef]
- Engmann, F.N.; Ma, Y.; Tchabo, W.; Ma, H. Ultrasonication Treatment Effect on Anthocyanins, Color, Microorganisms and Enzyme Inactivation of Mulberry (Moraceae Nigra) Juice. J. Food Process. Preserv. 2015, 39, 854–862. [Google Scholar] [CrossRef]
- Ismail, B.B.; Yusuf, H.L.; Pu, Y.; Zhao, H.; Guo, M.; Liu, D. Ultrasound-Assisted Adsorption/Desorption for the Enrichment and Purification of Flavonoids from Baobab (Adansonia Digitata) Fruit Pulp. Ultrason. Sonochem. 2020, 65, 104980. [Google Scholar] [CrossRef]
- Bu, K.; Wito, I.; Mikucka, W.; Zieli, M. Valorization of Distillery Stillage by Polyphenol Recovery Using Microwave-Assisted, Ultrasound-Assisted and Conventional Extractions. J. Environ. Manag. 2022, 322, 116150. [Google Scholar] [CrossRef]
- Ojha, K.S.; Tiwari, B.K.; Donnell, C.P.O. Effect of Ultrasound Technology on Food and Nutritional Quality. Adv. Food Nutr. Res. 2018, 84, 207–240. [Google Scholar] [CrossRef]
- Jiménez-López, J.; Ruiz-Medina, A.; Ortega-Barrales, P.; Llorent-Martínez, E.J. Phytochemical pro Fi Le and Antioxidant Activity of Caper Berries (Capparis spinosa L.): Evaluation of the in Fl Uence of the Fermentation Process. Food Chem. 2018, 250, 54–59. [Google Scholar] [CrossRef]
- Weragama, D.; Weerasingha, V.; Jayasumana, L.; Adikari, J.; Vidanarachchi, J.K.; Priyashantha, H. The Physicochemical, Microbiological, and Organoleptic Properties and Antioxidant Activities of Cream Cheeses Fortified with Dried Curry Leaves (Murraya koenigii L.) Powder. Food Sci. Nutr. 2021, 9, 5774–5784. [Google Scholar] [CrossRef] [PubMed]
- Alp, D.; Bulantekin, Ö. The Microbiological Quality of Various Foods Dried by Applying Different Drying Methods: A Review. Eur. Food Res. Technol. 2021, 247, 1333–1343. [Google Scholar] [CrossRef] [PubMed]
- Khairuzzaman; Chowdhury, F.M.; Zaman, S.; Al Mamun, A.; Bari, L. Food Safety Challenges towards Safe, Healthy, and Nutritious Street Foods in Bangladesh. Int. J. Food Sci. 2014, 2014, 483519. [Google Scholar] [CrossRef] [PubMed]
- Ferragut, V.; Hernández-herrero, M.; Teresa, M.; Borras-suarez, M.; González-linares, J. Ultra-High-Pressure Homogenization (UHPH) System for Producing High-Quality Vegetable-Based Beverages: Physicochemical, Microbiological, Nutritional and Toxicological Characteristics. J. Sci. Food Agric. 2014, 95, 953–961. [Google Scholar] [CrossRef]
- Cebri, G.; Condón, S.; Tecnología, P.M. Physiology of the Inactivation of Vegetative Bacteria by Thermal Treatments: Mode of Action, Influence of Environmental Factors and Inactivation Kinetics. Foods 2017, 6, 107. [Google Scholar] [CrossRef]
- Rachon, G.; Raleigh, C.P.; Pawlowsky, K. Heat Resistance of Yeast Ascospores and Their Utilisation for the Validation of Pasteurisation Processes for Beers. J. Inst. Brew. 2021, 127, 149–159. [Google Scholar] [CrossRef]
- Park, J.; Kim, M. Comparison of Dry Medium Culture Plates for Mesophilic Aerobic Bacteria in Milk, Ice Cream, Ham, and Codfish Fillet Products. Prev. Nutr. Food Sci. 2013, 18, 269–272. [Google Scholar] [CrossRef]
- Pothakos, V.; Samapundo, S.; Devlieghere, F. Total Mesophilic Counts Underestimate in Many Cases the Contamination Levels of Psychrotrophic Lactic Acid Bacteria (LAB) in Chilled-Stored Food Products at the End of Their Shelf-Life. YFMIC 2012, 32, 437–443. [Google Scholar] [CrossRef]
- Terpou, A.; Papadaki, A.; Lappa, I.K.; Kachrimanidou, V.; Bosnea, L.A.; Kopsahelis, N. Probiotics in Food Systems: Significance and Emerging Strategies Towards Improved Viability and Delivery of Enhanced Beneficial Value. Nutrients 2019, 11, 1591. [Google Scholar] [CrossRef]
- Wang, L.; Xu, B.; Wei, B.; Zeng, R. Low Frequency Ultrasound Pretreatment of Carrot Slices: E Ff Ect on the Moisture Migration and Quality Attributes by Intermediate-Wave Infrared Radiation Drying. Ultrason. Sonochem. 2018, 40, 619–628. [Google Scholar] [CrossRef] [PubMed]
- Malik, S.; Krishnaswamy, K.; Mustapha, A. Physical Properties of Complementary Food Powder Obtained from Upcycling of Greek Yogurt Acid Whey with Kodo and Proso Millets. J. Food Process. Eng. 2021, 44, e13878. [Google Scholar] [CrossRef]
- Tamanna, N.; Mahmood, N. Food Processing and Maillard Reaction Products: Effect on Human Health and Nutrition. Int. J. Food Sci. 2015, 2015, 526762. [Google Scholar] [CrossRef]
- Zhang, L.; Wang, X.; Hu, Y.; Abiola, O.; Ma, H. Dual-Frequency Multi-Angle Ultrasonic Processing Technology and Its Real-Time Monitoring on Physicochemical Properties of Raw Soymilk and Soybean Protein. Ultrason. Sonochem. 2021, 80, 105803. [Google Scholar] [CrossRef]
- Derardja, A.E.; Pretzler, M.; Kampatsikas, I.; Radovic, M.; Fabisikova, A.; Zehl, M.; Barkat, M.; Rompel, A. Current Research in Food Science Polyphenol Oxidase and Enzymatic Browning in Apricot (Prunus armeniaca L.): Effect on Phenolic Composition and Deduction of Main Substrates. Curr. Res. Food Sci. 2022, 5, 196–206. [Google Scholar] [CrossRef] [PubMed]
- Kumar, R.; Kumar, A.; Jayachandran, L.E.; Srinivasa, P. Sequential Microwave—Ultrasound Assisted Extraction of Soymilk and Optimization of Extraction Process. LWT 2021, 151, 112220. [Google Scholar] [CrossRef]
- Zhang, Q.A.; Shen, Y.; Fan, X.H.; García Martín, J.F. Preliminary Study of the Effect of Ultrasound on Physicochemical Properties of Red Wine. CYTA-J. Food 2016, 14, 55–64. [Google Scholar] [CrossRef]
- Oladejo, A.O.; Ma, H.; Qu, W.; Zhou, C. Effects of Ultrasound on Mass Transfer Kinetics, Structure, Carotenoid and Vitamin C Content of Osmodehydrated Sweet Potato (Ipomea batatas). Food Bioprocess Technol. 2017, 10, 1162–1172. [Google Scholar] [CrossRef]
- Makarewicz, M. The Interactions between Polyphenols and Microorganisms, Especially Gut Microbiota. Antioxidants 2021, 10, 188. [Google Scholar] [CrossRef]
- Tyagi, H.; Daulton, E.; Bannaga, A.S.; Arasaradnam, R.P.; Covington, J.A. Non-Invasive Detection and Staging of Colorectal Cancer Using a Portable Electronic Nose. Sensors 2021, 21, 5440. [Google Scholar] [CrossRef]
- Baietto, M.; Wilson, A.D.; Bassi, D.; Ferrini, F. Evaluation of Three Electronic Noses for Detecting Incipient Wood Decay. Sensors 2010, 10, 1062–1092. [Google Scholar] [CrossRef] [PubMed]
Disclaimer/Publisher’s Note: The statements, opinions and data contained in all publications are solely those of the individual author(s) and contributor(s) and not of MDPI and/or the editor(s). MDPI and/or the editor(s) disclaim responsibility for any injury to people or property resulting from any ideas, methods, instructions or products referred to in the content. |
© 2023 by the authors. Licensee MDPI, Basel, Switzerland. This article is an open access article distributed under the terms and conditions of the Creative Commons Attribution (CC BY) license (https://creativecommons.org/licenses/by/4.0/).