Article

Extracellular Production of the Taiwan-Native Norovirus P Domain Overexpressed in Pichia pastoris

Department of Biochemical Science and Technology, National Taiwan University, Taipei 106216, Taiwan
*
Author to whom correspondence should be addressed.
Fermentation 2023, 9(6), 498; https://doi.org/10.3390/fermentation9060498
Submission received: 25 April 2023 / Revised: 19 May 2023 / Accepted: 22 May 2023 / Published: 23 May 2023
(This article belongs to the Section Microbial Metabolism, Physiology & Genetics)

Abstract

:
Many efforts in norovirus vaccine development have focused on subunit or recombinant protein vaccines, such as subviral P particles formed by the protruding (P) domain of VP1. P particles are immunogenic and have a region with a human histo-blood group antigen binding site, an interaction critical for infecting the host. In the past, only intracellular NoV P proteins expressed in Escherichia coli and Pichia pastoris were reported, and the low yield and difficulty in purification limited their applications. In this study, the Taiwan-native NoV P domain was successfully expressed and secreted by P. pastoris. The secretion efficiency was greatly enhanced by integrating oligosaccharyl transferase (Ost1) into the α-factor signal peptide and coexpressing Hac1. The production of NoV P in fermentation cultures reached 345 mg/L, and the purity and recovery were 94.8% and 66.9%, respectively, after only ion-exchange chromatography. Transmission electron microscopy analysis showed that the small P particles were mostly ring-, square-, and triangle-shaped, with diameters of 10-15 nm. The biological activity of NoV P was confirmed by saliva-binding assay using human histo-blood group antigen. This study describes the secretion and characterization of the Taiwan-native norovirus P domain in P. pastoris. Particles formed from the P domain were similar in size, morphology, and binding ability to those expressed intracellularly. The strategy described in this study provides great potential in scale-up production and antiviral vaccine development.

1. Introduction

Norovirus (NoV) is the leading cause of acute gastroenteritis, infecting approximately 684 million people worldwide, with more than 200,000 people dying each year [1,2]. Currently, there is no effective treatment for norovirus-infected patients, and vaccination is still the most promising way to prevent disease and reduce infection and death. It is challenging to produce attenuated or inactivated whole NoV vaccines due to the lack of a reliable cell culture system [3,4]. Therefore, most efforts in NoV vaccine development have been put on subunit or recombinant protein vaccines, such as virus-like particles (VLPs) formed by the major capsid protein VP1 [5,6] or subviral P particles formed by the protrusion (P) domain of VP1 [7,8,9,10]. Both VLPs and P particles are immunogenic and contain the region with a binding site for human histo-blood group antigen (HBGA), an interaction that is critical for infecting the host [7,11].
Intracellular NoV VLP expression has been reported using the insect cell Spodoptera frugiperda (Sf9), and partial purification was achieved by sucrose gradient centrifugation [11,12]. Tomé-Amat et al. reported the successful expression and secretion of VLPs in Pichia pastoris, and the purity reached 90% after ion-exchange chromatography [13]. In contrast, only intracellular expression of NoV P protein in Escherichia coli or P. pastoris was reported. Up to 20 mg/L P protein in a soluble form was expressed in E. coli under optimal conditions [11,14] and 210 mg/L P protein was obtained in the inclusion bodies [15]. It required refolding to restore the correct protein structure and activity for the insoluble NoV P protein in inclusion bodies. P. pastoris is another extensively used expression system with natural folding and posttranslational modification advantages. In previous publications, Chen and coworkers showed that the intracellular concentration of NoV P protein expressed in P. pastoris reached approximately 220 mg/L after 120 h of methanol induction and a simplified purification procedure based on surface histidines and the charge on NoV P protein [16,17]. However, no extracellular NoV P protein expression in P. pastoris has been reported.
P. pastoris, an extensively used expression system, usually facilitates recombinant protein secretion with the pre-pro leader sequence of the α-mating factor from Saccharomyces cerevisiae [18,19]. Although some proteins are readily secreted, the complexity of the secretory mechanism frequently limits the secretion of many other heterologous proteins [20,21]. Fitzgerald and Glick reported that cotranslational translocation into the endoplasmic reticulum (ER) was enhanced by modifying a secretion signal made up of the S. cerevisiae oligosaccharyl transferase (Ost1) signal sequence, followed by the α-factor pro-region [20,22]. Barrero et al. demonstrated that the secretion of model proteins from P. pastoris was enhanced when the Ost1 signal sequence was paired with the α factor pro-region [23]. Once proteins enter the ER lumen environment, correctly folded and assembled proteins are required for export from the ER to the Golgi apparatus and are then transported outside the cell [20]. The overexpression of folding accessory proteins, such as BiP/Kar2p assisting in ER protein folding, protein disulfide isomerase (PDI), and the transcriptional regulator Hac1p, has been shown to improve the secretory efficiency [18,24,25]. Among these accessory proteins, Hac1p plays a prominent role in activating the unfolded protein response (UPR). This transcription factor promotes the UPR target gene expression by binding to the UPR response elements (UPREs) in the promoters [21,26]. Overexpression of HAC1 has been reported to improve the secretion of alkaline lipase and mouse interleukin 10 [25,27].
In this study, we demonstrated that the extracellular recombinant NoV P protein was expressed by P. pastoris, and the secretion efficiencies were greatly enhanced by integrating the Ost1 pre-region and coexpressing Hac1. The resultant recombinant NoV P protein was characterized by LC-MS/MS, the morphology of NoV P was analyzed by transmission electron microscopy after purification by ion-exchange chromatography, and its immune response was verified by a saliva-binding assay.

2. Materials and Methods

2.1. Strains and Media

E. coli DH5α (GIBCO-BRL Life Technologies, Grand Island, NY, USA) was grown in LB medium and used for plasmid manipulation. The P. pastoris KM71H (Arg+, Muts) and pPICZαA plasmids (Invitrogen Thermo Fisher Scientific, Waltham, MA, USA) were used. All strains were selected and grown in yeast extract peptone dextrose (YPD) medium under pressure of either 100 µg/mL hygromycin B (MDBio, Taipei, Taiwan) or Zeocin (Invitrogen, Waltham, MA, USA). Buffered glycerol-complexed medium (BMGY) and buffered methanol-complexed medium (BMMY) were used for culture and induction, respectively, according to the manufacturer’s instructions (Invitrogen).

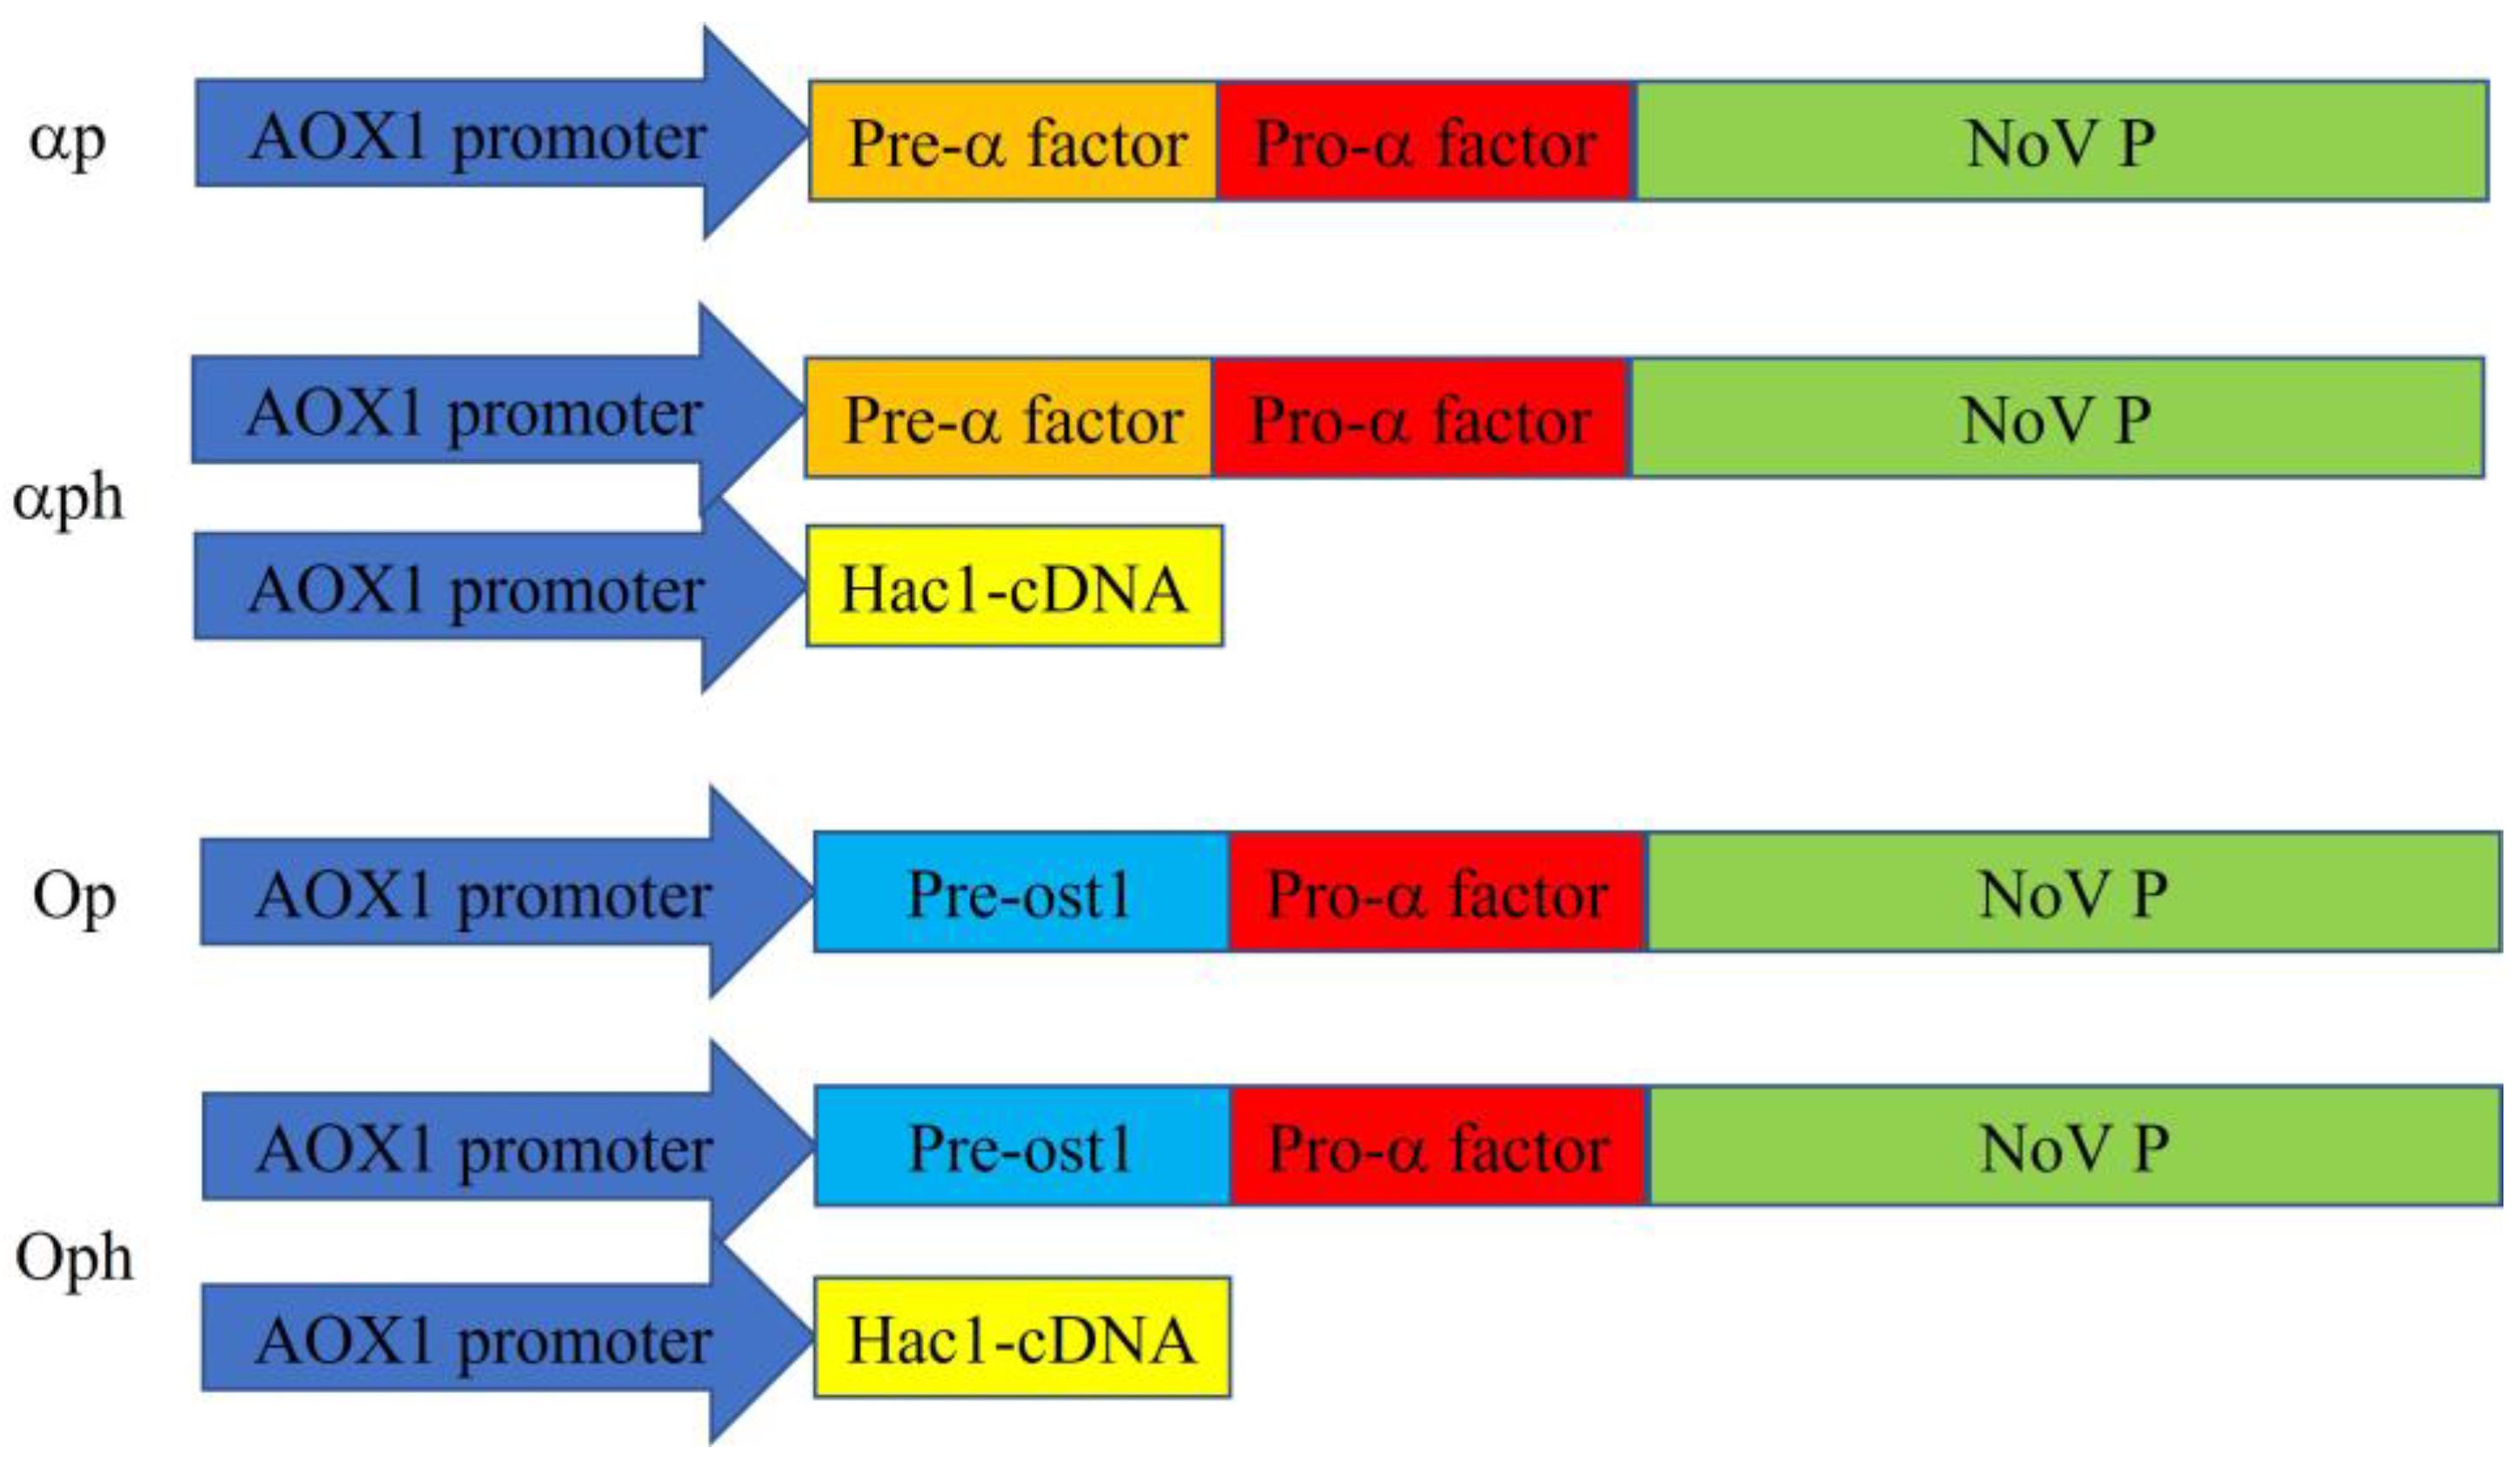
2.2. Cloning of the P Domain and Plasmid Construction

The amplification of the P domain has been described previously using the cDNA clone of the human norovirus GII.4 strain HuNV/GII.4/YJB1/2009/Chiayi (NCBI GenBank accession number MG049692) [16]. The PCR fragment was cloned into the EcoRI/XbaI sites of pPICZαA (Invitrogen) or pre-Ost1-pro-α factor(I) constructed as described by Barrero et al. [23] to generate the expression plasmids pPICZαA-NoV P and pre-Ost1-pro-α-factor(I)-NoV P, respectively. Plasmids were linearized and then transformed by electroporation into P. pastoris KM71H (Invitrogen) using 100 ng of linear DNA; the resultant strains were named αp and Op, respectively. Using a P. pastoris cDNA clone as a template, the intronless HAC1 gene fragment was amplified by PCR with the primers HAC1-F-EcoR1 and HAC1-R-XhoI. The PCR fragments were cloned into the EcoRI/XhoI sites of pPICHB, a modified pPICZB (Invitrogen) plasmid with Zeocin replacement by hygromycin, to generate the expression plasmid pPICHB-HAC1. Plasmids were linearized and subsequently transformed into P. pastoris αp and Op strains. The resulting strains were designated as αph and Oph. The plasmid construction is shown in Figure 1. The primers used for plasmid construction and sequencing are listed in Table 1.

2.3. Transformant Screening and Flask Culture

The transformants of αp, Op, αph, and Oph were selected under antibiotic pressure, followed by 96 deep-well plate culture and methanol induction. The target proteins were assayed by Coomassie brilliant blue and Western blot, and the transformants with the highest yields were selected for flask cultures. The procedure for flask cultures and induction were described previously [16].

2.4. AOX Activity Assay

The AOX activity was measured using the method described by Stasyk et al. [28]. Following methanol induction, 5 × 10⁷ cells were harvested by centrifugation and resuspended in AOX activity reagent. The cell suspension was then incubated at 30 °C for 30 min, and the absorbance was measured at 410 nm. Three independent experiments were performed.

2.5. RNA Expression Level Analysis

The mRNA expression level of the transcription factor HAC1 was verified by real-time PCR. The procedure has been described in detail elsewhere [29]. The primers used for real-time PCR are listed in Table 2. For the endogenous reference gene, 18S rRNA was used, and relative fold differences were calculated using the 2−ΔΔCT method.

2.6. Fermentation

Fermentation was performed as previously described using a 5 L fermenter (Biostat A, Sartorius, Göttingen, Germany) [16]. The fermentation was divided into batch, fed-batch, and induction phases. The durations of 44, 68, 92, and 116 h of fermentation correspond to 24, 48, 72, and 96 h of methanol induction, respectively. Two liters of BMGY supplemented with 4% (v/v) glycerol and 4.35 mL/L PTM 4 trace salts was used for the batch phase. Once the glycerol was depleted as evidenced by the DO spike, 250 mL of 50% (v/v) glycerol containing 12 mL/L PTM 4 trace salts were fed into the fermenter. The induction stage was initiated using 100% methanol supplemented with 12 mL/L PTM 4 as the DO occurred again. Samples were collected every 24 h for further analysis.

2.7. Purification of NoV P Protein

The tag-free NoV P proteins were purified according to the purification scheme published elsewhere [17]. Initially, the supernatant was obtained by centrifugation and the sample volume used was twice the volume of the column. It was subsequently subjected to chromatographic purification using a HiTrap™ DEAE FF column (GE Healthcare Life Sciences, Pittsburgh, PA, USA) and AKTA fast-performance liquid chromatography (FPLC) (UPC 900/P-920, Amersham Pharmacia Biotech, Piscataway, NJ, USA) with elution achieved through a stepwise gradient of buffer (20 mM Tris-HCl pH 8.5, 1 M NaCl). Chromatographic fractions containing NoV P were stored at 4 °C for analysis, and their total protein concentrations were assayed by the Bradford method (Bio-Rad, Hercules, CA, USA). The protein purity calculation method is as follows: (P protein concentration determined by ELIS/total protein concentration) × 100%.

2.8. Gel Filtration Analysis

The molecular weight of the purified NoV P protein was measured by gel filtration chromatography as described previously [17]. The molecular weights of the eluted fractions were determined according to gel filtration standards (Bio-Rad, catalog #151-1901). The running buffer for gel filtration contained 25 mM NaH2PO4 and 0.15 M NaCl, pH 7.4.

2.9. SDS–PAGE and Western Blot Analysis

The 12% SDS–PAGE and Western blot analysis was performed by standard biochemistry protocols. The anti-norovirus GII.4 monoclonal antibody (ab167024, Abcam, Waltham, MA, USA) and HRP-conjugated anti-mouse IgG antibody (PerkinElmer, Waltham, MA, USA) were used for NoV P protein detection.

2.10. Indirect ELISA

The ELISA was performed followed the report of Fu et al. [15]. The NoV P protein after DEAE column purification was used as a standard. Three independent experiments were performed.

2.11. Saliva-Binding Assay

The saliva-bind assay was performed according to the report from Tomé-Amat et al. [13] using a human saliva sample of blood type B. The Bradford method (Bio-Rad) was used to determine the total protein concentration. Three independent experiments were performed.

2.12. Identification of NoV P by LC-MS/MS

The spots excised from stained gels were prepared according to standard mass spectrometry sample preparation protocols. LC-MS/MS services were provided by Energensis Biomedical (Taipei, Taiwan). MS/MS signals were analyzed using the MASCOT search engine (http://www.matrixscience.com, accessed on 12 September 2022) with human norovirus GII major capsid protein sequences in NCBI Entrez (GenBank: ATN44699.1).

2.13. Particle Size Analysis and Transmission Electron Microscopy (TEM)

The particle size of the purified NoV P was determined through dynamic light scattering (DLS) using a HORIBA SZ-100 nanoparticle analyzer (Horiba, Kyoto, Japan) at room temperature. The TEM service was provided by Core Facilities-imaging, Academia Sinica (Taipei, Taiwan), using an FEI Tecnai G2 F20 S-TWIN field transmission electron microscope at an accelerating voltage of 100 kV.

2.14. Statistical Analysis

Statistical differences were examined by one-way ANOVA and the t-test. Statistical significance was determined at p < 0.05. The experiments were conducted at least three times; all data are expressed as mean ± SD.

3. Results

3.1. Expression of NoV P Protein from Flask Cultures

The expression of tag-free NoV P by P. pastoris αp, Op, αph, and Oph strains from flask cultures is shown in Figure 2. Figure 2A,B illustrates the time profiles of cell growth by turbidity and the AOX promoter efficiencies by AOX activity for these four strains. No significant differences in cell density or AOX activity were found throughout the experiment, suggesting that replacement of the pre-region of the α-factor with the Ost1 signal peptide and coexpression of Hac1 did not lead to cell growth defects or promoter efficiency differences. In addition, the copy numbers of the P. pastoris αp, Op, αph, and Oph strains were the same as shown in Supplementary Figure S1 using the primers as listed in Supplementary Table S1.
Figure 2C,D shows the SDS–PAGE and Western blot analysis of the protein samples collected at induction on days 3 and 4 from different strains. The estimated molecular weight of recombinant NoV P protein was 36 kDa, close to the theoretical value of 35.8 kDa. The NoV P protein production levels of αph, Op, and Oph were greater than that of αp, as evidenced by the band intensities on days 3 and 4. Western blotting with anti-NoV serum also confirmed the expression of NoV P protein. The NoV P protein concentrations were determined by ELISA. As shown in Figure 2E, all the NoV P protein production increased with methanol induction time; the concentrations reached 29.8 ± 2.3 (αp), 35.7 ± 1.9 (αph), 37.2 ± 3.63 (Op), and 41.0 ± 2.2 μg/mL (Oph), respectively, at induction on day 4. The strains with Ost1-modified α-factor, Op and Oph, produced more NoV P protein than their counterparts, αp and αph, indicating the Ost1 pre-region replacement enhanced the protein secretion. The strains that coexpressed Hac1, αph, and Oph produced more NoV P protein than αp and Op, suggesting that the secretion efficiency was enhanced by coexpression of Hac1. To further confirm that the increase in NoV P was due to enhanced transcription efficiency, the mRNA expression level of Hac1 was determined by RT-qPCR. As shown in Figure 2F, the mRNA expression levels of Hac1 did not show a significant difference before methanol induction for all the strains. The relative expression levels of Hac1 showed 13.9- and 26.8-fold increases in P. pastoris αph and Oph in response to methanol induction, respectively. In contrast, no increase was found in P. pastoris αp and Op. These results suggested that the improvement of extracellular production of NoV P protein was attributed to the Ost1-modified signal peptide or additional expression of Hac1.

3.2. NoV P Protein Production in Fermenter Cultures

The P. pastoris Oph strain confirmed to enhance NoV P protein secretion was selected for fermentation production. Figure 3A illustrates the representative fermentation parameters of P. pastoris Oph at the batch, fed-batch, and induction phases. The switches of batch to fed-batch and fed-batch to induction phases were initialized as spikes of dissolved oxygen occurred. The accumulation of base feeding was in accordance with the feeding of methanol, indicating that most methanol was metabolized via the dissimilative pathway, and base feeding was required to neutralize the formation of carbonic acid. The production of NoV P in response to methanol induction was evidenced by SDS–PAGE and Western blotting analysis of supernatants from fermentation cultures (Figure 3B). At 24 h of methanol induction, which corresponds to 44 h of fermentation, the SDS–PAGE gel first showed a band of 35.8 kDa corresponding to the molecular weight of the P protein, and the band intensity increased with the induction time. Western blotting analysis also confirmed the expression of the NoV P protein. The NoV P protein concentration in the fermentation supernatant measured by indirect ELISA is shown in Figure 3C. NoV P protein production increased with methanol induction and reached 345.2 ± 35.1 mg/L at 96 h of methanol induction, which corresponds to 116 h of fermentation.

3.3. NoV P Protein Verification by LC-MS/MS

The NoV P protein separated by SDS–PAGE was extracted from the gel for LC-MS/MS analysis. As illustrated in Figure 3D, the peptide fragments were 73% identical to the P protein sequence. In addition, the bands at 75 kDa increased with induction time and were identified as Kar2p/BiP by LC-MS/MS (Supplementary Table S2). This result was consistent with the study by Guerfal et al., who found that the strains expressing HAC1 had increased secretion of Kar2p [25].

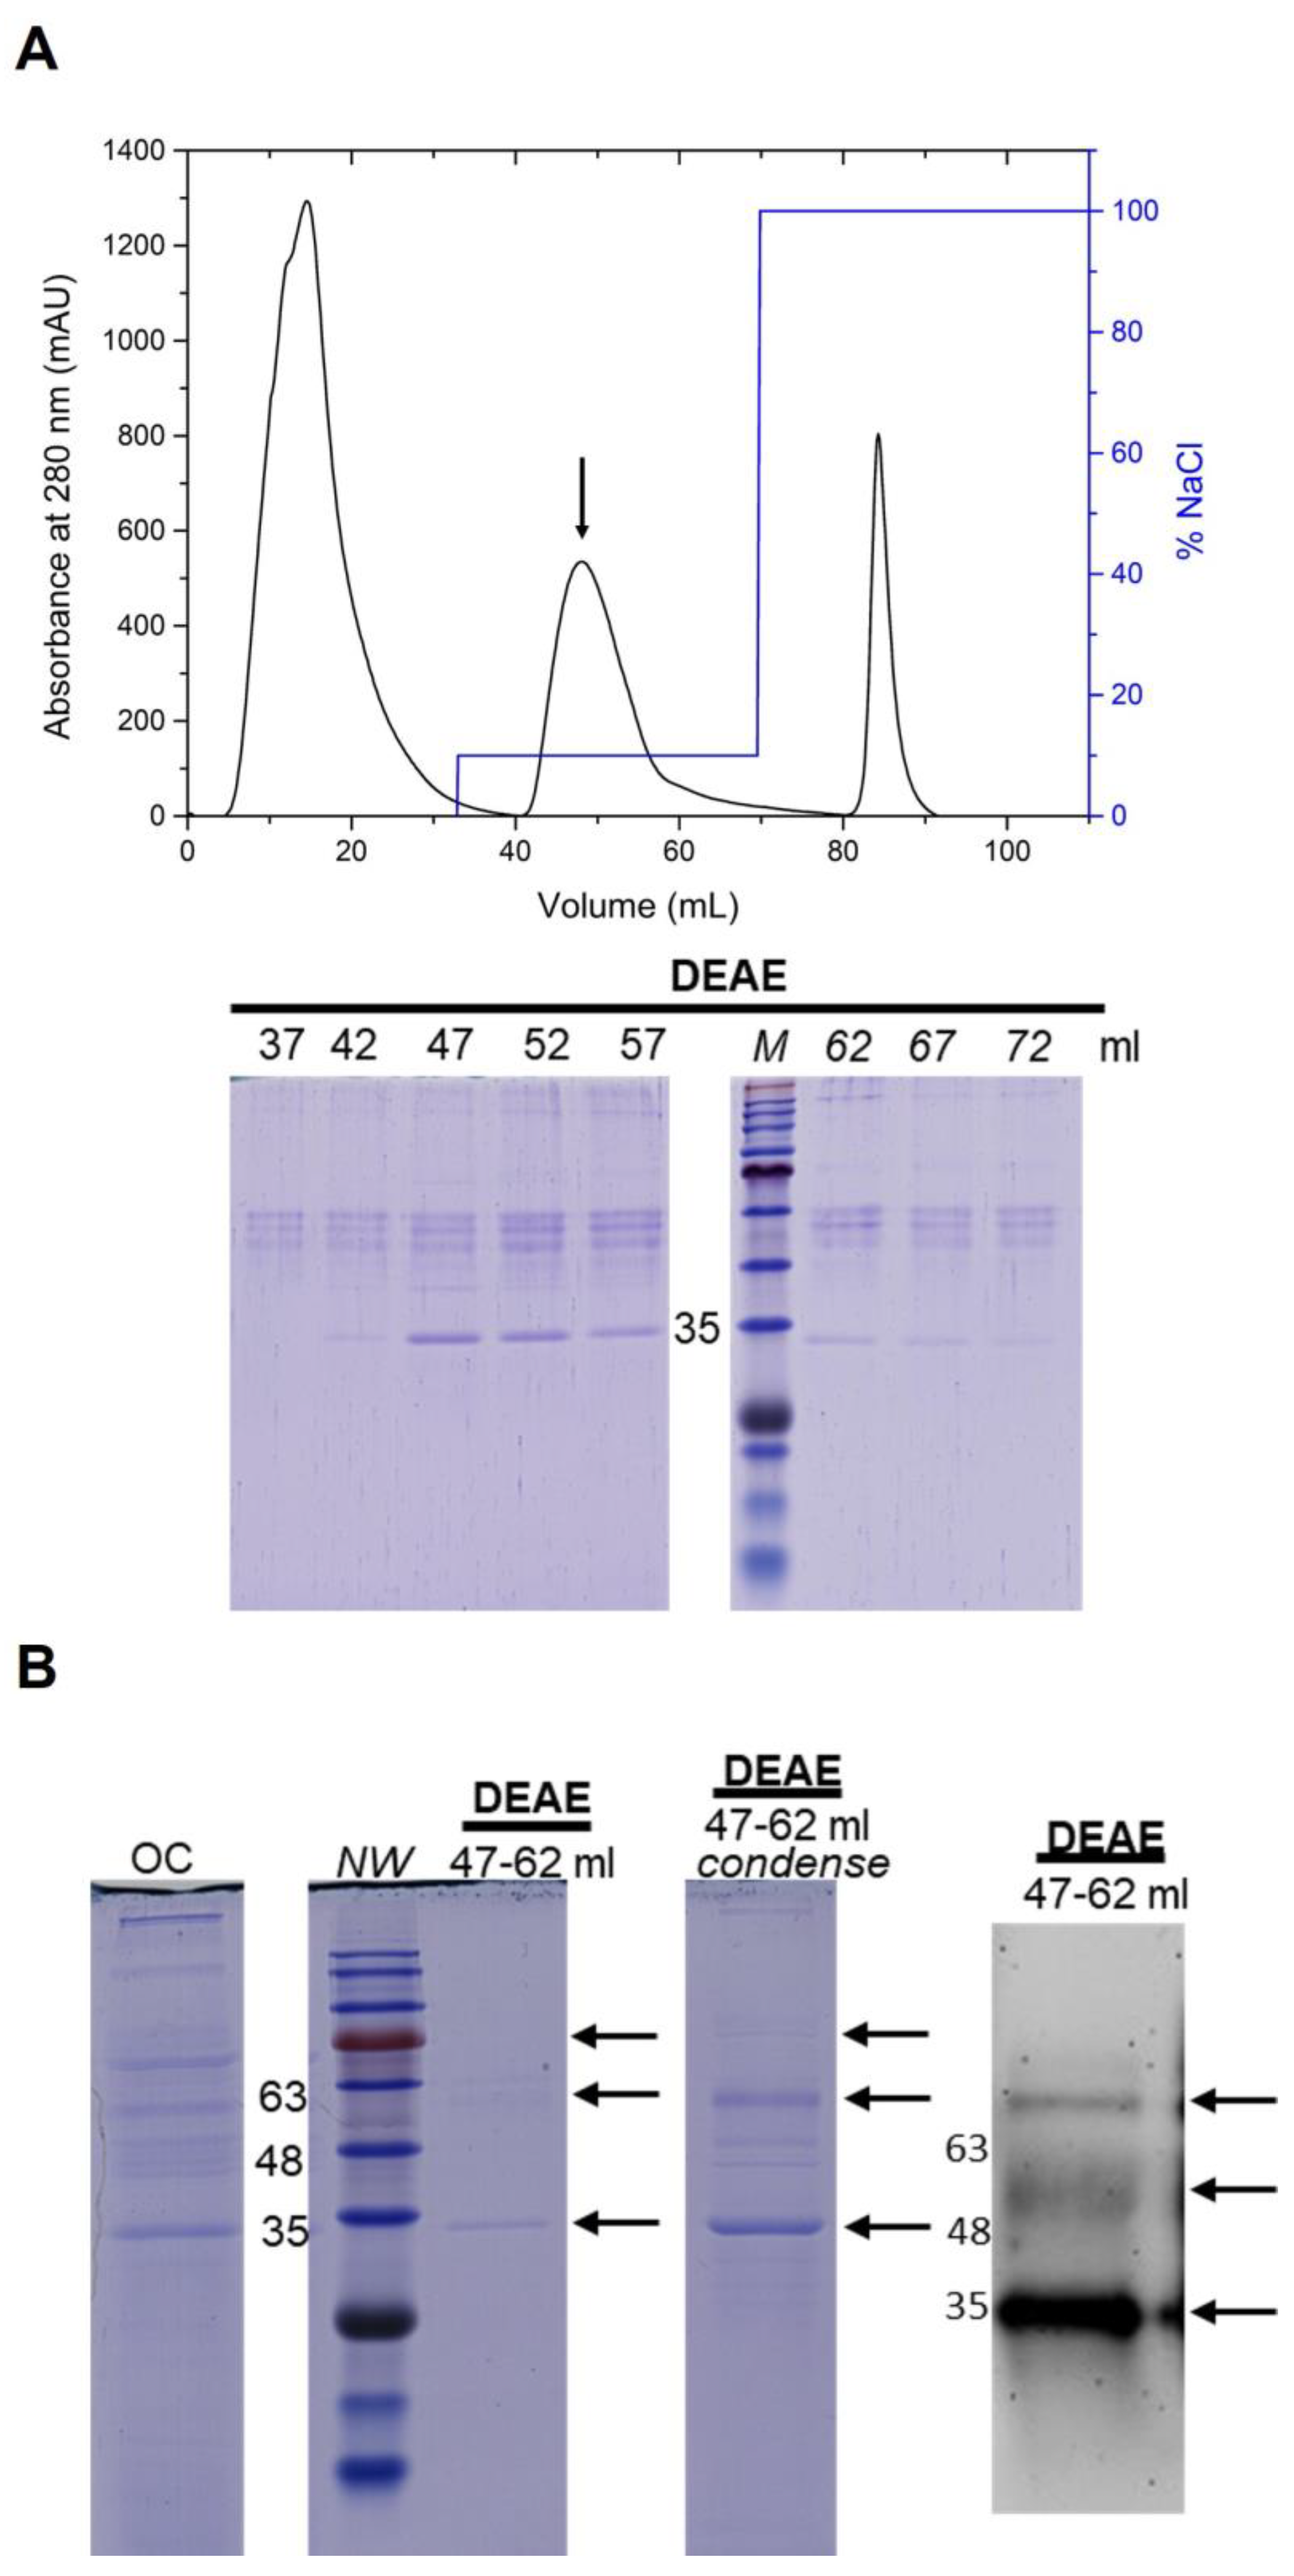
3.4. Purification of the NoV P Protein by Anion-Exchange Chromatography

After 96 h of methanol induction, the supernatant was collected to purify NoV P using anion-exchange chromatography on a DEAE column. Figure 4A shows the chromatograph of stepwise elution with 0.10 M NaCl and SDS–PAGE. The 47–62 mL elution fractions containing NoV P were pooled together and analyzed. As shown in Figure 4B, a band around 35 kDa was observed on the SDS–PAGE gel and confirmed as NoV P protein by Western blotting analysis. The purity and recovery of the NoV P protein are summarized in Table 3. The NoV P protein purity in the fermentation supernatant was 66.1 ± 3.4%, while the purity after stepwise elution with a buffer containing 0.10 M NaCl could reach 94.8 ± 4.1%. The recovery of NoV P protein purified through one-time anion-exchange chromatography from fermenter cultures was 66.9 ± 5.9%.

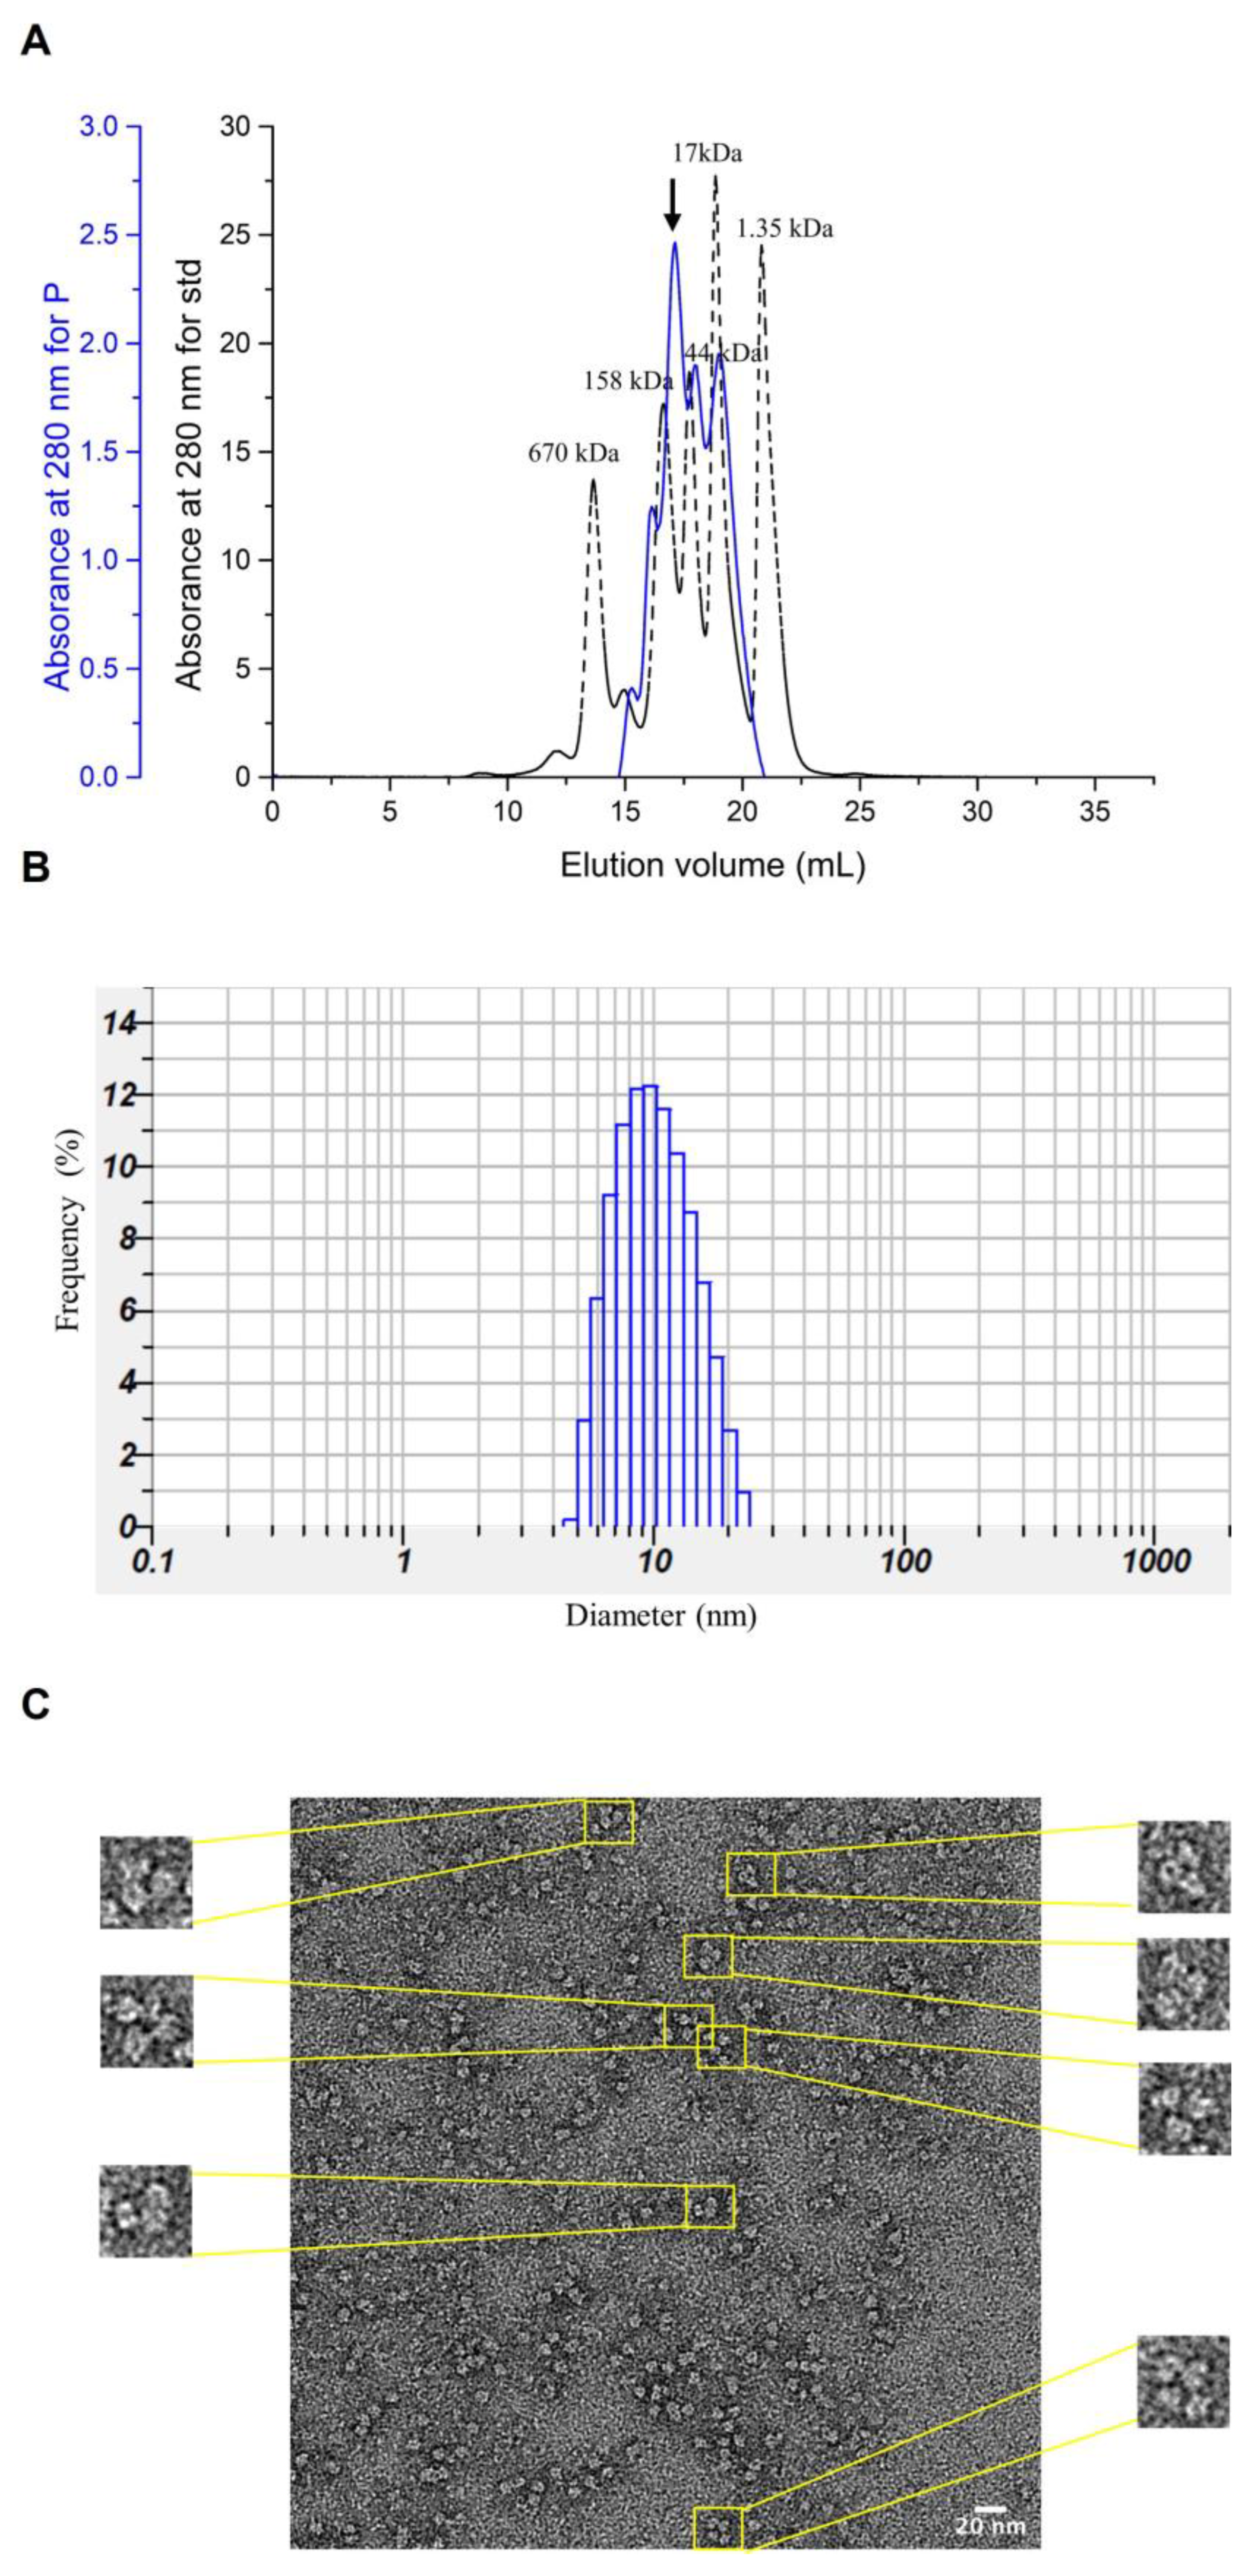
3.5. Characterization of Purified NoV P Complexes and Verification by TEM

The morphology of the purified NoV P was characterized by gel filtration and transmission electron microscopy. Figure 5A illustrates the gel filtration chromatograph of the purified NoV P protein using Bio-Rad’s gel filtration standards to determine the molecular weight. Most of the NoV P protein was eluted between 158 kDa and 44 kDa, as shown by the arrow in the figure. Figure 5B shows that the purified NoV P protein has a diameter of 10.7 ± 3.9 nm, which is consistent with the TEM images. The TEM images are shown in Figure 5C, and purified NoV P proteins exhibiting ring, triangle, and square shapes were observed. These results suggested that most NoV P proteins were in the form of P-dimer, and some formed small P particles with diameters of 10–15 nm, which is consistent with our previous report [16].

3.6. Saliva-Binding Assay of NoV P

HBGA epitope binding in saliva was used for the biological activity assay of the purified NoV P protein. As shown in Figure 6, the binding pattern is positively correlated with both NoV P concentrations at fixed saliva concentrations and saliva concentrations at fixed NoV P concentrations. The binding of NoV P to saliva confirmed that NoV P particles contained domains necessary for saliva-binding.

4. Discussion

In this study, we demonstrated that NoV P protein was secreted into the culture medium, and the secretion efficiencies were greatly enhanced by modifying the α factor signal peptide and coexpressing Hac1 in P. pastoris. The NoV P protein reached 345 mg/L after 96 h of induction, and the purification was simplified to one step to achieve 94.8% purity and 66.9% recovery. The high yield of extracellular NoV P protein benefited from better secretion efficiency due to the modification of the α-factor signal peptide and coexpression of Hac1. These observations confirmed the secretion enhancement strategy proposed by Barrero et al. [23,30] and Guerfal et al. [25]. Similar results were also reported by Rieder et al., who demonstrated that using the Ost1 signal peptide increased the secretion of enzymes [31], and by Li et al., who showed that protein misfolding was reduced and ER-specific secretion was increased by coexpression of Hac1 [32]. Taken together, the improvement of extracellular production of NoV P protein was attributed to the Ost1-modified signal peptide or additional expression of Hac1.
Notably, in addition to the high yield and easy purification of NoV P protein, our results show that the NoV P polymer formation proportion was lower than that found previously [16]. Our previous study showed that Taiwan-native NoV P protein tended to form small ring-, square-, and triangle-shaped particles with 14–15 nm diameter. The size-exclusion chromatograph of intracellular tag-free NoV P showed a major peak between 158 and 670 kDa. In contrast, the major peaks for extracellular NoV P in this study were found between 17 and 158 kDa, and two minor peaks were found between 158 and 670 kDa. Tan et al. reported that P-dimers have a high potential to assemble into P particles and can be dynamically exchanged between dimers, 12-mers, 18-mers, 24-mers, and 36-mers. The formation of P-dimers is immediate and efficient. However, the formation of P particles might depend on protein concentration, intermolecular polymerization interactions in the P region, and the addition of short chains of cysteine residues [11,14,30]. Although the mechanism of the intermolecular interactions forming P particles is still unclear, it was not surprising that the intracellular NoV P formed more P particles than its extracellular counterpart. Tan and Jiang also found more than a 700-fold increase in the binding sensitivity of the P particle to HBGAs in comparison to the P-dimer [11]. However, the binding capacity to HBGA did not appear to be significantly different between intra- and extracellular NoV P. This might be explained by the mixture of P particles and P-dimers in our intra- or extracellular samples.
Therefore, the P particle was considered a protein vaccine for norovirus. At present, double- and triple-valent vaccines based on P particles have entered clinical animal experiments [33], including Norovirus/Rotavirus [7], Norovirus/Influenza Virus Vaccine [10], and Norovirus, Hepatitis E, and Astrovirus P vaccines [9]. These experiments show that P particle vaccines have the potential to prevent a variety of diseases. P particles have demonstrated the potential of an antigen presentation platform.

5. Conclusions

Taiwan-native Nov P was successfully expressed and secreted by P. pastoris, and the secretion efficiency was improved by coexpression of Hac1 and the Ost1 pre-region modified α factor signal peptide. The production of NoV P in fermentation cultures reached 354 mg/L, and the purity and recovery were 94.8% and 66.9%, respectively, after only ion-exchange chromatography. The morphology of NoV P was analyzed using transmission electron microscopy, and its binding ability to HBGA was demonstrated. The strategy described in this study provides great potential for scaling up production and antiviral vaccine development.

Supplementary Materials

The following supporting information can be downloaded at: https://www.mdpi.com/article/10.3390/fermentation9060498/s1, Table S1: The primers used for real-time PCR to determine the copy number; Figure S1: Detection of copy number in the Pichia pastoris genome by relative-absolute quantification PCR; Table S2: Results of the MASCOT search for the identification of the sequenced peptides from the band of 75 kDa of Figure 2B.

Author Contributions

M.-L.C. designed and performed the experiments, analyzed the data, and wrote the manuscript. C.-F.Y. performed the experiments and analyzed the data. C.-T.H. acquired funding, participated in discussions, and revised the manuscript. All authors have read and agreed to the published version of the manuscript.

Funding

This work was supported by the Ministry of Science and Technology, Taiwan, ROC (MOST-108-2313-B-002-052-MY3).

Institutional Review Board Statement

Not applicable.

Informed Consent Statement

Not applicable.

Data Availability Statement

All data generated or analyzed during this study are included in this published article and its Supplementary Materials.

Conflicts of Interest

The authors declare no conflict of interest.

References

  1. Patel, M.M.; Widdowson, M.-A.; Glass, R.I.; Akazawa, K.; Vinje, J.; Parashar, U.D. Systematic literature review of role of noroviruses in sporadic gastroenteritis. Emerg. Infect. Dis. 2008, 14, 1224–1231. [Google Scholar] [CrossRef]
  2. Li, J.; Predmore, A.; Divers, E.; Lou, F. New interventions against human norovirus: Progress, opportunities, and challenges. Annu. Rev. Food Sci. Technol. 2012, 3, 331–352. [Google Scholar] [CrossRef]
  3. Lucero, Y.; Vidal, R.; O’Ryan, G.M. Norovirus vaccines under development. Vaccine 2018, 36, 5435–5441. [Google Scholar] [CrossRef]
  4. Takanashi, S.; Saif, L.J.; Hughes, J.H.; Meulia, T.; Jung, K.; Scheuer, K.A.; Wang, Q. Failure of propagation of human norovirus in intestinal epithelial cells with microvilli grown in three-dimensional cultures. Arch. Virol. 2014, 159, 257–266. [Google Scholar] [CrossRef]
  5. Parra, G.I.; Bok, K.; Taylor, R.; Haynes, J.R.; Sosnovtsev, S.V.; Richardson, C.; Green, K.Y. Immunogenicity and specificity of norovirus Consensus GII.4 virus-like particles in monovalent and bivalent vaccine formulations. Vaccine 2012, 30, 3580–3586. [Google Scholar] [CrossRef]
  6. El-Kamary, S.S.; Pasetti, M.F.; Mendelman, P.M.; Frey, S.E.; Bernstein, D.I.; Treanor, J.J.; Ferreira, J.; Chen, W.H.; Sublett, R.; Richardson, C.; et al. Adjuvanted intranasal Norwalk virus-like particle vaccine elicits antibodies and antibody-secreting cells that express homing receptors for mucosal and peripheral lymphoid tissues. J. Infect. Dis. 2010, 202, 1649–1658. [Google Scholar] [CrossRef]
  7. Tan, M.; Huang, P.; Xia, M.; Fang, P.-A.; Zhong, W.; McNeal, M.; Wei, C.; Jiang, W.; Jiang, X. Norovirus P particle, a novel platform for vaccine development and antibody production. J. Virol. 2011, 85, 753–764. [Google Scholar] [CrossRef]
  8. Fang, H.; Tan, M.; Xia, M.; Wang, L.; Jiang, X. Norovirus P particle efficiently elicits innate, humoral and cellular immunity. PLoS ONE 2013, 8, e63269. [Google Scholar] [CrossRef]
  9. Xia, M.; Wei, C.; Wang, L.; Cao, D.; Meng, X.-J.; Xiang, X.; Tan, M. A trivalent vaccine candidate against hepatitis E virus, norovirus, and astrovirus. Vaccine 2016, 34, 905–913. [Google Scholar] [CrossRef]
  10. Xia, M.; Tan, M.; Wei, C.; Zhong, W.; Wang, L.; McNeal, M.; Jiang, X. A candidate dual vaccine against influenza and noroviruses. Vaccine 2011, 29, 7670–7677. [Google Scholar] [CrossRef]
  11. Tan, M.; Jiang, X. The p domain of norovirus capsid protein forms a subviral particle that binds to histo-blood group antigen receptors. J. Virol. 2005, 79, 14017–14030. [Google Scholar] [CrossRef]
  12. Tamminen, K.; Huhti, L.; Koho, T.; Lappalainen, S.; Hytönen, V.P.; Vesikari, T.; Blazevic, V. A comparison of immunogenicity of norovirus GII-4 virus-like particles and P-particles. Immunology 2012, 135, 89–99. [Google Scholar] [CrossRef]
  13. Tomé-Amat, J.; Fleisher, L.; Parker, S.A.; Bardliving, C.; Batt, C.A. Secreted production of assembled Norovirus virus-like particles from Pichia pastoris. Microb. Cell Factories 2014, 13, 134. [Google Scholar] [CrossRef]
  14. Tan, M.; Jiang, X. Norovirus P particle: A subviral nanoparticle for vaccine development against norovirus, rotavirus and influenza virus. Nanomedicine 2012, 7, 889–897. [Google Scholar] [CrossRef]
  15. Fu, L.; Jin, H.; Yu, Y.; Yu, B.; Zhang, H.; Wu, J.; Yin, Y.; Yu, X.; Wu, H.; Kong, W. Characterization of NoV P particle-based chimeric protein vaccines developed from two different expression systems. Protein Expr. Purif. 2017, 130, 28–34. [Google Scholar] [CrossRef]
  16. Chen, Y.L.; Chang, P.J.; Huang, C.T. Small P particles formed by the Taiwan-native norovirus P domain overexpressed in Komagataella pastoris. Appl. Microbiol. Biotechnol. 2018, 102, 9707–9718. [Google Scholar] [CrossRef]
  17. Chen, Y.L.; Huang, C.T. Establishment of a two-step purification scheme for tag-free recombinant Taiwan native norovirus P and VP1 proteins. J. Chromatogr. B Anal. Technol. Biomed. Life Sci. 2020, 1159, 122357. [Google Scholar] [CrossRef]
  18. Ahmad, M.; Hirz, M.; Pichler, H.; Schwab, H. Protein expression in Pichia pastoris: Recent achievements and perspectives for heterologous protein production. Appl. Microbiol. Biotechnol. 2014, 98, 5301–5317. [Google Scholar] [CrossRef]
  19. Brake, A.J.; Merryweather, J.P.; Coit, D.G.; Heberlein, U.A.; Masiarz, F.R.; Mullenbach, G.T.; Urdea, M.S.; Valenzuela, P.; Barr, P.J. Alpha-factor-directed synthesis and secretion of mature foreign proteins in Saccharomyces cerevisiae. Proc. Natl. Acad. Sci. USA 1984, 81, 4642–4646. [Google Scholar] [CrossRef]
  20. Delic, M.; Valli, M.; Graf, A.B.; Pfeffer, M.; Mattanovich, D.; Gasser, B. The secretory pathway: Exploring yeast diversity. FEMS Microbiol. Rev. 2013, 37, 872–914. [Google Scholar] [CrossRef]
  21. Idiris, A.; Tohda, H.; Kumagai, H.; Takegawa, K. Engineering of protein secretion in yeast: Strategies and impact on protein production. Appl. Microbiol. Biotechnol. 2010, 86, 403–417. [Google Scholar] [CrossRef]
  22. Fitzgerald, I.; Glick, B.S. Secretion of a foreign protein from budding yeasts is enhanced by cotranslational translocation and by suppression of vacuolar targeting. Microb. Cell Fact. 2014, 13, 125. [Google Scholar] [CrossRef]
  23. Barrero, J.J.; Casler, J.C.; Valero, F.; Ferrer, P.; Glick, B.S. An improved secretion signal enhances the secretion of model proteins from Pichia pastoris. Microb. Cell Fact. 2018, 17, 161. [Google Scholar] [CrossRef]
  24. Duan, G.; Ding, L.; Wei, D.; Zhou, H.; Chu, J.; Zhang, S.; Qian, J. Screening endogenous signal peptides and protein folding factors to promote the secretory expression of heterologous proteins in Pichia pastoris. J. Biotechnol. 2019, 306, 193–202. [Google Scholar] [CrossRef]
  25. Guerfal, M.; Ryckaert, S.; Jacobs, P.P.; Ameloot, P.; Van Craenenbroeck, K.; Derycke, R.; Callaewert, N. The HAC1 gene from Pichia pastoris: Characterization and effect of its overexpression on the production of secreted, surface displayed and membrane proteins. Microb. Cell Fact. 2010, 9, 49. [Google Scholar] [CrossRef]
  26. Travers, K.J.; Patil, C.K.; Wodicka, L.; Lockhart, D.J.; Weissman, J.S.; Walter, P. Functional and genomic analyses reveal an essential coordination between the unfolded protein response and ER-associated degradation. Cell 2000, 101, 249–258. [Google Scholar] [CrossRef]
  27. Zhao, X.; Xie, W.; Lin, Y.; Lin, X.; Zheng, S.; Han, S. Combined strategies for improving the heterologous expression of an alkaline lipase from Acinetobacter radioresistens CMC-1 in Pichia pastoris. Process Biochem. 2013, 48, 1317–1323. [Google Scholar] [CrossRef]
  28. Stasyk, O.V.; Nazarko, T.Y.; Sibirny, A.A. Methods of plate pexophagy monitoring and positive selection for ATG gene cloning in yeasts. Methods Enzymol. 2008, 451, 229–239. [Google Scholar]
  29. Chang, C.-H.; Hsiung, H.-A.; Hong, K.-L.; Huang, C.-T. Enhancing the efficiency of the Pichia pastoris AOX1 promoter via the synthetic positive feedback circuit of transcription factor Mxr1. BMC Biotechnol. 2018, 18, 81. [Google Scholar] [CrossRef]
  30. Barrero, J.J.; Pagazartaundua, A.; Glick, B.S.; Valero, F.; Ferrer, P. Bioreactor-scale cell performance and protein production can be substantially increased by using a secretion signal that drives co-translational translocation in Pichia pastoris. N. Biotechnol. 2021, 60, 85–95. [Google Scholar] [CrossRef]
  31. Rieder, L.; Ebner, K.; Glieder, A.; Sørlie, M. Novel molecular biological tools for the efficient expression of fungal lytic polysaccharide monooxygenases in Pichia pastoris. Biotechnol. Biofuels 2021, 14, 122. [Google Scholar] [CrossRef]
  32. Li, L.; Huang, C.; Zhao, F.; Deng, T.; Lin, Y.; Zheng, S.; Liang, S.; Han, S. Improved production and characterization of Volvariella volvacea Endoglucanase 1 expressed in Pichia pastoris. Protein Expr. Purif. 2018, 152, 107–113. [Google Scholar] [CrossRef]
  33. Tan, M.; Jiang, X. Norovirus Capsid Protein-Derived Nanoparticles and Polymers as Versatile Platforms for Antigen Presentation and Vaccine Development. Pharmaceutics 2019, 11, 472. [Google Scholar] [CrossRef]
Figure 1. Plasmid construction used in this study. Dark blue is the AOX1 promoter, orange is the alpha factor signal sequence, red is the pro-region alpha factor, light blue is the Ost1 signal sequence, red is NoV P, and yellow is Hac1-cDNA.
Fermentation 09 00498 g001
Figure 2. NoV P protein production from flask cultures. (A) Detection of cell density (OD600) at different induction times. After culture in BMGY, cells were exchanged into BMMY and induced with 1% methanol. Error bars represent the standard deviation of three replicates. An independent samples t-test was used to determine significance. (B) Detection of AOX activity at different induction times. Cells were cultured in BMGY and induced in BMMY containing 1% methanol. The error bars represent the standard deviation of three replicates. An independent samples t-test was used to determine significance. Time course of NoV P protein expression for (C) SDS–PAGE and (D) Western blot analysis. Aliquots were taken from the culture medium in a flask, supernatants and cells were separated by centrifugation, and each sample of 18 μL supernatant was separated on 12% SDS–PAGE gels. The lower gels were stained with Coomassie blue and immunoblotted with anti-NoV antibodies. (E) Concentrations for flask expression of NoV P protein. The P protein concentration was determined for each aliquot by indirect ELISA. (F) HAC1 mRNA was extracted from cells cultured in preinduction and methanol induction media for 3 h. mRNA levels for each sample were normalized to 18S rRNA. The relative expression level for each gene was normalized to unmodified cells (αp). Error bars represent the standard deviation of three replicates. An independent samples t-test was used to determine significance. *, p < 0.05; ***, p < 0.005. “αp” represents unmodified cells, “Op” represents modified signal peptide cells, and “αph” and “Oph” represent HAC1 reprogrammed cells. Each point represents the mean ± SD (n = 3).
Fermentation 09 00498 g002
Figure 3. NoV P protein production from fermenter cultures. The P. pastoris Oph strain was selected for fermentation production. (A) Time course of fermentation parameters and feeding for large-scale expression of NoV P transformants. Dissolved oxygen (red line), pH (black line), temperature (pink line), feed amount (blue line), and base (green line) were plotted against fermentation time as fermentation parameters. (B) Time course of large-scale expression of NoV P protein. Aliquots were taken from the fermentation medium, supernatants were separated by centrifugation, and 18 μL of each supernatant sample was loaded into 12% SDS–PAGE gels. The lower duplicate gels were stained with Coomassie blue and immunoblotted with anti-NoV antibody. (C) Concentrations for large-scale expression of NoV P protein. The P protein concentration of each aliquot was determined by indirect ELISA. Each point represents the mean ± SD (n = 3). (D) Identification of NoV P protein by LC-MS/MS. The major band at 35 kDa (red arrow in (B)) was identified by LC-MS/MS. The results show 73% coverage of the NoV P peptide sequence (bold red letters). Fermentation for 44, 68, 92, and 116 h represent methanol induction for 24, 48, 72, and 96 h.
Fermentation 09 00498 g003
Figure 4. Purification of NoV P protein from fermenter cultures using anion-exchange chromatography. (A) Chromatogram and aliquot of NoV P purification. Stepwise elution profile of NoV P in a fermenter culture with an elution salt concentration of 0.1 M NaCl using anion exchange. The black line represents the absorbance profile at 280 nm, and the blue line represents the percentage of NaCl in the eluate. The arrow indicates the elution peaks of NoV P. These numbers on SDS–PAGE correspond to the aliquot number during the stepwise elution of 0.1 M NaCl. (B) The corresponding Coomassie blue-stained SDS–PAGE and Western blot using an anti-NoV antibody. Molecular weights are indicated by corresponding values in the gel, and arrows indicate NoV P protein.
Fermentation 09 00498 g004
Figure 5. Characterization of purified NoV P complexes and verification by TEM. (A) Purified NoV P subjected to size-exclusion chromatography using a Superose 6 Increase column. The black dashed line represents the standard protein used to determine each eluted fraction’s molecular weight. The blue line represents the purified NoV P size-exclusion chromatography profile pattern. The arrow indicates most of the NoV P protein. (B) Assay for dynamic light scattering. The particle size distribution of ion-exchange-purified NoV P was measured by DLS. (C) NoV P visualization by transmission electron microscopy. The morphology of ion-exchange-purified NoV P was observed by TEM. The scale bar is 20 nm.
Fermentation 09 00498 g005
Figure 6. HBGA saliva-binding assay. Plates were coated with type B saliva (blue solid line 1:200, blue dashed line 1:1000) and incubated with different concentrations of NoV P complex protein after NoV P purification. Anti-NoV serum was used for NoV P detection. Each point represents the mean ± SD (n = 3).
Fermentation 09 00498 g006
Table 1. Primers used for plasmid construction and sequencing.
NameSequence (5′ to 3′)
F α-factorCGTGTCTTCTGCTGCTCCAGTCAACACTACAACAG
R EcoRI α-factorGAATTCAGCTTCAGCC
F BstBI Ost1TTCGAAACGATGAGGCAGGTTTGGTTCTCTTGGATTGTGGGATTG
R Ost1TCTCTTGGATTGTGGGATTGTTCCTATGTTTTTTCAACGTGTCTTCTGCTGCTCCAG
F EcoRI CNGRC PGAATTCATGTGTAATGGTCGTTGTTCAAGAACTAAAC
R XbaI ORF2 stopTCTAGATTATAAAGCACGTCTACGCC
F EcoRI HAC1GAATTCATGCCCGTAGATTCTTCTCATAAGA
R XhoI HAC1CTCGAGCTATTCCTGGAAGAATACAAAGTCATTTAAAT
Table 2. Primers used for real-time PCR.
NameSequence (5′ to 3′)
18s rRNA qFGAGGATTGACAGGATGAGAGC
18s rRNA qRCAAGGTCTCGTTCGTTATCGC
HAC1 qFGACACCGACTACATTACTACAGCTCCA
HAC1 qRAGCGGTAAATGGTGCTGCTGG
Table 3. Purity and recovery of NoV P protein in fermenter cultures.
AdsorbentP Protein (μg/mL)Total Protein (μg/mL)Purity (%)P Recovery (%)
Supernatant345.2 ± 35.1520.6 ± 25.666.1 ± 3.4
DEAE Sepharose FF
Stepwise elution 10%
228.9 ± 3.0241.8 ± 13.794.8 ± 4.166.9 ± 5.9
Each point represents the mean ± SD (n = 3).
Disclaimer/Publisher’s Note: The statements, opinions and data contained in all publications are solely those of the individual author(s) and contributor(s) and not of MDPI and/or the editor(s). MDPI and/or the editor(s) disclaim responsibility for any injury to people or property resulting from any ideas, methods, instructions or products referred to in the content.

