Abstract
The classification of color is important in the management and evaluation of red wine color. Nevertheless, current reports have not given a sound solution. A novel scheme for the quantitative classification of red wine color from the perspective of micro and macro levels was proposed in this work. The overall color performance of 119 representative red wine samples was visualized and classified into 125 micro-classifications according to the partition of the chromaticity and lightness of the wine color. Considering the evolution of red wine color, quantitative macro-classification of the color of the wine samples was explored, and six macro-classifications were obtained. These few classifications determine the extent of aging and aging potential of colors between different red wines well. The performance of this approach was further verified by another set of 56 red wine samples. This efficient and easy-to-implement approach is expected to be helpful in the digital and visual color management, control, evaluation, comparison, and prediction of red wines.
1. Introduction
Color is a crucial, direct, and intuitive sensory attribute of food, and it correlates well with some physicochemical properties and quality attributes [1]. Color can indicate the quality of food, the expected aroma and taste at some extent, and even influence the acceptance and preference of food [2]. Similarly, wine color is an important aspect of wine quality, roughly referring to information including vintage, variety, region, and even possible defects during the production, aging, and storage periods [3]. Wine tasting generally follows the typical order of viewing, smelling, and tasting to determine various overall aspects and levels of a wine product in detail. The systematic wine sensory analysis procedures generally start with an evaluation of the color and other visual characteristics, such as transparency, clarity, and gloss [4]. Therefore, it is obvious that wine color can provide the most direct and intuitive first sensory impression and can especially influence preliminary and initial estimates about the style and quality of the wine product [5]. Moreover, wine color strongly points to wine type, which is inseparably associated with the related aroma descriptors. For instance, red wine is usually described as having aromas of black currant, blueberry, and other ripe black fruits; rose wine is associated with the aroma of strawberry and rose flower; and white wine presents notes of honey, white flower, peach, pear, and other white fruits. Even under certain experimental conditions, stained white wines were mistaken for red wines and were associated with odor descriptors describing the type of red wine [6]. As a result, wine color can establish expectations and even cue descriptions of wine aroma, flavor, and overall quality for the tasters and affect their preference and acceptability [7,8]. In other words, a negative first judgement based on the visual perception of the wine product is difficult to counteract with subsequent positive aromas and flavors [9]. Thus, a systematic and scientific evaluation of wine color is crucial, particularly considering the significant role and profound influence of visual perception on the entire perceived quality of the wine product [8].
To assess wine color, the sensory evaluation method carried out by professional judges is often used, which has high requirements for the taster and is affected by even the observation conditions [10]. The high requirements for tasters’ professionalism and the standardization of observation conditions limit the quantitative standardization of wine color via sensory evaluation. Even under strict conditions, the subjective differences and uncertainties in tasters’ qualitative evaluations are still difficult to ignore [11]. What is more, in different cultural backgrounds and language systems, there are some communication barriers and deviations in the understandings of the subjective descriptions of red wine color. On the contrary, instruments are immune to subjective preferences and other sensory attributes that may affect the results, enabling a quick, objective, and accurate description of the wine color [12]. The wine color can be described and measured using visual and instrumental procedures [13]. Correspondingly, the sensory evaluation method of wine color is realized depending on the professional tasters’ visual perception, and it is worth exploring the creation of a digitized and quantified wine color classification and evaluation method based on instrumental color measurement.
As a reliable indicator of food quality, color measurement of food is much simpler and faster, and color classification and grading methods are being widely explored in order to provide criteria or references for assessing food quality or for food classification and grading. Moreover, food color classification based on instrumental color measurement has been widely studied. For instance, color features based on the RGB and HSI color spaces and texture were considered together to classify raisins [14]. Combined with texture features, different types of food grains were identified and classified based on different color models such as Lab, HSV, HSI, and YcbCr [15]. According to color, the automatic classification of commercial potato chips by a computer vision system in L*, a*, and b* units was studied [16]. The color classification of “Manila” mangoes at three different ripening stages was realized based on the CIELAB and HSB color spaces [17]. Furthermore, the quality of various food was classified and evaluated by computer vision technology based on color images [18]. Although different color spaces are involved in the above-mentioned research, the most commonly used in the color measurement of foods is the L*, a*, and b* color space because of its uniformity and proximity to the human perception of color [19]. Undoubtedly, the CIELAB color space is also widely used in wine color measurement and color characterization, and its use has been recommended by the International Vine and Wine Organization (OIV) [20]. Meanwhile, the CIELAB color space demonstrates good results in food classification based on color. However, the classification of wine color based on the CIELAB color space is rare, perhaps because the translucent liquid texture of wine distinguishes it from other foods, for which surface color classification is convenient. Although one study has explored the color classification of translucent solid resins [21], whether this can be applied to translucent liquid wines is unknown, and the scheme is too complex.
At present, most research focuses on the evaluation and gradation of the overall quality of wine based on sensory evaluations and/or various wine compositions, the scoring scheme established by wine tasting experts [22], or scientific research involving a variety of physical and chemical indicators of wine and data analysis methods [23,24]. Little attention has been paid to the classification of wine color independently [25,26], and reports seldom concern the evaluation of wine color’s evolution. Needless to say, it is very meaningful and worth exploring to classify and evaluate red wine color independently as an important aspect and indicator of the overall quality of red wine. Such a classification can not only compensate for the gap in existing research but can also provide a new reference for evaluating the color quality of red wine. Therefore, the purpose of this work is to explore the establishment of an instrumental measurement-based red wine color classification scheme to evaluate and compare the various colors of different red wines. To this end, on the basis of our previous work [27], the color of 119 commercial dry red wines was determined, and an objective and specific classification method of red wine color from the perspective of the micro and macro levels was established. Another 56 dry red wine samples were also introduced to verify and illustrate the effectiveness and applicability of the proposed method.
2. Materials and Methods
2.1. Wine Samples
One hundred and nineteen commercial dry red wine samples were collected from different representative wineries with relatively large yields from various origins, including Yinchuan (YC), Qingtongxia (QTX), Zhongwei (ZW), and Hongsibu (HSB) in the eastern foot of Helan Mountain, Ningxia, China, which is one of the most important and representative wine-producing regions in China. The vintages of the wine samples range from 2013 (13) to 2018 (18), with the age of wine ranging from 6 y to 1 y. Most of the samples are monovarietal wines fermented from a single grape variety such as Cabernet Sauvignon (CS), Merlot (M), Cabernet Gernischt (CG), or Marselan (MS). A few of them are multivarietal wines co-fermented from two or three grape varieties, including CS, M, CG, and Cabernet Franc (CF). The label of the wine samples in this work are based on vintage (abbreviation)–variety (abbreviation)–origin (abbreviation). More details are listed in Table S1 and Figure S1. Enological parameters are listed in Table S5.
Fifty-six commercial dry red wines from different wineries of the Gansu (33) and Xinjiang (23) regions in China were used to verify the applicability of the classification method proposed in this study. Their vintages range from 2013 (13) to 2018 (18), and the varieties are mainly Cabernet Sauvignon and Merlot, but they also include a few numbers of Pinot Noir, Syrah, Cabernet Gernischt, and blending. The naming rules of red wine samples are in the order of the first letter of the region (G or X)–vintage (abbreviation)–serial number (1, 2, 3, etc.). Enological parameters are listed in Table S6.
2.2. Measurement of CIELAB Color Parameters
Each wine sample was filtered using 0.45 μm polyether sulfone membranes (Shanyutech, Co., Ltd., Tianjin, China) before measurement. The visible absorbance spectrum of each sample was scanned and recorded from 400 nm to 780 nm with an interval of 1 nm using a UV-Vis spectrophotometer Agilent Cary 60 (Agilent Technologies Inc., PaloAlto, CA, USA) with a 1 mm path-length quartz cuvette (i-Quip®, Aladdin Biochemical Technology Co., Ltd., Shanghai, China). Deionized water was used as the blank reference. The analysis for each sample was performed in triplicate. The CIELAB color parameters (L*, a*, b*, , and ) of each wine sample were calculated using absorbance values at four wavelengths of 450 nm, 520 nm, 570 nm, and 630 nm according to the simplified CIELAB method [28].
2.3. Visual Representation
The visual representation of red wine color is realized based on the three-dimensional CIELAB color space, which includes chromaticity distribution plane, lightness distribution plane, and feature color [27].
2.4. Statistical Analysis
Excel 2016 (Microsoft, Redmond, Washington, DC, USA) was used for data processing. SPSS Statistics 20 (IBM, New York, NY, USA) was used for statistical analysis. Origin 2018 (Origin Lab, Northampton, MA, USA) was used for plotting.
3. Results and Discussion
3.1. Visual Representation of the Color of Wine Samples
The above-mentioned CIELAB-based visual representation method was used to visualize the color of 119 dry red wine samples [27]. The chromaticity distribution and lightness distribution of the wine samples were illustrated in Figure 1. It can be seen that the a* values of the wine samples are located in the interval of 15~45. The b* values are distributed in the interval of 5~25. The L* values lie in the interval of 40~90. Moreover, the frequency distribution of L*, a*, and b* was analyzed and is shown in Figure S2. The parameter a* mainly assembles between 20 and 40. The parameter b* mainly aggregates between 10 and 20. The parameter L* mainly gathers between 60 and 80.
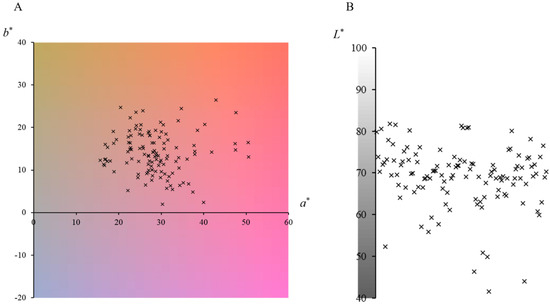
Figure 1.
Overall chromaticity (A) and lightness (B) distributions of 119 dry red wine samples. Note: The chromaticity plane in the figure is the two-dimensional plane constructed by a* and b* in the CIELAB color space when L* = 70 (L* = 70, a* = 0~60, b* = −20~40). The lightness plane in the figure is the two-dimensional plane extending from a one-dimensional lightness axis when a* = b* = 0 (L* = 40~100, a* = 0, b* = 0).
Considering the central tendency of the parameters a* and b*, a qualitative description of the chromaticity characteristic of the 119 wine samples can be given in the hue of ruby red, garnet, and brick red with a medium saturation. Similarly, a qualitative description of the lightness perception of the 119 wine samples is as follows: very few of the samples are bright, a few of the samples are dark, and most of the samples are slightly bright. Thus, the overall color performance of the wine samples is mainly ruby red, garnet, and brick red, with medium or duller saturation, and slightly bright, that is, medium or pale ruby red, garnet, and brick red.
Although the chromaticity and lightness distributions of the wine samples present a central tendency, each wine sample has unique chromaticity and lightness characteristics. It can be seen from Figure 1 that the chromaticity or lightness of different wine samples has an obvious feature of a discrete distribution, implying a high degree of color (chromaticity or lightness) discrimination between each other, which can be further used for color classification. This also confirms from the side that red wine presents a variety of colors due to its complex coloring mechanism.
3.2. Micro-Classification of the Color of Wine Samples Based on the CIELAB Parameters
In the CIELAB color space, the two-dimensional chromaticity distribution plane constructed by the parameters a* and b* represents the chromaticity information of the color, while the lightness distribution plane constructed by the parameter L* denotes the lightness information of the color [27]. The chromaticity information of wine is more commonly described by the chromaticity indices of hue and chroma . As a consequence, the two key attributes of chromaticity ( and ) and lightness (L*) were classified independently in this work.
3.2.1. Micro-Level Sub-Classification of Chromaticity
In view of the centralization and dispersion feature of the chromaticity shown in Figure 1 and Figure S2, the hue and chroma were divided into several specific sub-classifications. Considering the minimum value of 3.43 and the maximum value of 41.35 of the hue shown in Table S2, the hue was classified into five sub-classifications ranging from 0 to 50 with in intervals of 10. In a similar way, according to the minimum chroma value of 19.91 and the maximum chroma value of 53.05 shown in Table S2, the chroma was classified into five sub-classifications ranging from 10 to 60 in intervals of 10. Consequently, both the hue and chroma were divided into five sub-classifications, as shown in Table 1.

Table 1.
The sub-classification of hue , chroma , and lightness L* and corresponding score table.
In the CIELAB color space, the parameters a* and b* construct a two-dimensional plane when L* = 70, called the chromaticity distribution plane in this work [27]. On this plane, the hue is a degree rotated counterclockwise starting from 0° in the positive direction of the a* coordinate axis. The chroma can be regarded as the distance extending from the origin (a* = 0, b* = 0, L* = 70) to the wine sample point (a*, b*, L* = 70), that is, a straight line passing through the origin. Together, these degrees and lines divide the chromatic plane into numerous sectors. Each sector represents a certain hue value range and chroma value range, which is called a chromaticity sub-classification determined by the combination of hue sub-classification and chroma sub-classification, as shown for h2C5 in Figure 2. The distribution of wine samples on the chromaticity plane may fall into different sectors due to their values of hue and chroma. Wine samples in the same sector, i.e., wine samples in the same chromaticity sub-classification, can be considered to have relatively similar chromaticity information in terms of visual perception.
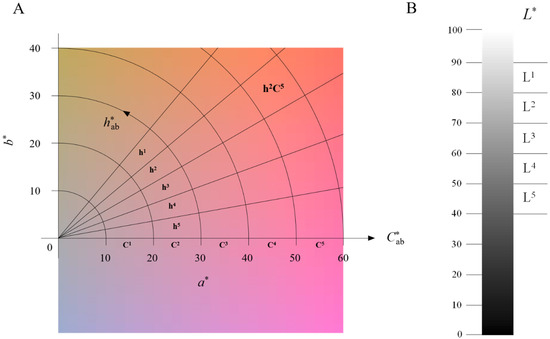
Figure 2.
Schematic diagram of chromaticity (A) and lightness (B) classification. Note: The chromaticity plane in the figure is the two-dimensional plane constructed by a* and b* in the CIELAB color space when L* = 70 (L* = 70, a* = 0~60, b* = −20~40). The lightness plane in the figure is the two-dimensional plane extending from a one-dimensional lightness axis when a* = b* = 0 (L* = 40~100, a* = 0, b* = 0).
3.2.2. Micro-Level Sub-Classification of Lightness
On the basis of the value range of lightness L* of the 119 dry red wine samples (Figure S2), the lightness L* was divided into specific sub-classifications. According to the minimum value of 41.59 and the maximum value of 81.80 of the lightness shown in Table S2, the lightness was divided into five sub-classifications ranging from 40 to 90 in intervals of 10, as shown in Table 1.
In the CIELAB color space, the one-dimensional coordinate axis of L* represents the lightness information of the wine samples. A lightness distribution plane was established according to L* values and the population of wine samples [27]. Due to the sub-classification of L*, this plane is split into sectors, as shown in Figure 2. Wine samples at the same lightness sector can be considered to have relatively similar lightness information in terms of visual perception.
3.2.3. Micro-Classification of Wine Color
According to the sub-classification of chromaticity and lightness of the 119 dry red wine samples, the color of the wine samples can be divided into 125 micro-classifications, shown in Table S3. Compared to the numerous CIELAB color parameters that vary widely between wine samples, the micro-classification of color provides a more compact classification of relatively similar wine colors and a more convenient and intuitive way to compare and distinguish the degree of color difference between wine samples. Different wine color classifications are easier to associate with the macro-level chromaticity and lightness information compared with the simple CIELAB color parameters. In other words, 125 micro-classifications of red wine color could be regarded as a series of 125 digital descriptors of red wine color, which is more objective, explicit, and convenient compared to traditional and regular sensory descriptors such as ruby red, vivid, and bright, etc. Moreover, this digital quantitative method of wine color classification is able to effectively circumvent the defects in the tasters’ sensory description method, including ambiguous naming, lack of international uniform description, and bias in understanding, etc. [11]. This wine color classification method is expected to be more direct, objective, specific, and consistent when describing and classifying wine color.
Finally, our study seems to provide a more facile and operational approach to color classification than existing studies building mathematical models to classify CIELAB and Glory color parameters [26]. In a nutshell, the quantitative micro-classification method of wine color can more conveniently describe, transfer, compare, distinguish, and even reproduce the color characteristics of wine samples by dividing the color of wine samples into micro-level color classifications such as h5C4L3, h3C3L2, and h2C2L3.
However, the method also has some drawbacks. For example, the large number of micro-classifications makes it is difficult to evaluate the color of different red wines simply and directly, and it cannot reflect the macro-level color evolution and changes in red wine from a sensory point of view. This is because, in essence, the macro-level color of red wine is not static, but rather dynamic, changing with time and storage conditions [12]. Moreover, the evolution of food color is common, such as during ripening, drying, or spoilage. The color evolution could help us to obtain information on the maturity, shelf life, quality, and other aspects of a food product [29]. From this point of view, food color classification based on color evolution is worth exploring, just as the color classification of mango [17] and tomato [30] at different ripening stages based on CIELAB color space provide practical guidance for production and harvesting. Specific to wine, storage and aging are important phases of the whole life cycle of wine. During this time, the wine undergoes maturation, stability, and even degradation. Correspondingly, its color evolution during storage and aging could reveal and convey informative messages. Therefore, further color classification based on the evolution of red wine color that considers the variability in and diversity of the macro-level color of red wine is necessary. Based on the micro-level color classification, we want to establish a more simplified and direct quantitative classification method to characterize the color evolution of red wines, as well as to evaluate the macro-level color of different red wines.
3.3. Macro-Classification of the Color of Wine Samples Based on the Micro-Classification
3.3.1. Macro-Classification Method
With the drawbacks of the micro-classification method in mind, it is necessary to further classify the above-mentioned micro-level color classification according to the evolution of red wine color during natural aging. In this way, A smaller number of macro-level color classifications are expected be obtained. In order to achieve this goal, the evolution of the red wine color should first be considered as the standard of the new macro-level quantitative classification method.
For red wines, it has become a relatively basic consensus that the yellowing and browning caused by aging make the color gradually lose its attractive characteristics such as its purplish red and vividness and can even make it difficult to maintain an acceptable color [31,32]. It is conceivable and understandable that, according to the instrumental measurement and visual perception, aged red wines show relatively yellower, more gloomy, paler, and brighter macro-level colors than young wines. This general trend can help the taster identify the vintage of a red wine, especially when longitudinally monitoring of the color of the same wine at different times, as the trend is very obvious. On the basis of this general understanding, the gradual decline in and loss of macro-level color perceptions and characteristics, such as the high intensity of the purplish red hue, the vivid color (high color saturation), and the thick and deep appearance (dark lightness), were designated as the standard of the new macro-level quantitative classification method to compare and evaluate the red wine color; that is, the method measures the general evolution of dry red wine color over time.
Obviously, this evolution is correlated with the quantitative color parameters, for example, a smaller hue value, a larger chroma value, and a smaller lightness value imply the color of a relatively younger red wine. Thus, it is feasible to quantify the macro-classification of different wine colors by assigning scores to the chromaticity and lightness sub-classifications, as shown in Table 1. The color of red wine is quantitatively classified by the total score (the sum of the hue, chroma, and lightness scores). A total of six macro-level color classifications were obtained, as shown in Table 2, of which a higher score denotes that the red wine demonstrates a relatively younger wine color.
Table 2.
The division of macro-level color classification.
3.3.2. Macro-Classification of Red Wine Color
Based on the macro-classification method of red wine color, the colors of the 119 wine samples were quantitatively classified from the macro-level perspective, as shown in Table S3. The total scores of the colors of the wine samples range from 8 to 28. Correspondingly, the macro-level color classifications are between 6 and 1 (Table S3). Descriptive statistics of these classifications are plotted in Figure 3, including the quantity of wine samples and the distribution trend of each macro-level color classification. Apparently, most of the wine samples are in classifications 3, 4, and 5. A few wine samples are in classification 2. Only five wine samples are in classification 1, and two wine samples are in classification 6. The calculated skewness coefficient is 0.598, and the kurtosis coefficient is −1.837, suggesting a positive skewed distribution, concentrated on the moderate classification and the asymmetric tail extended to the high classification. This kind of distribution profile implies that the overall color of the 119 wine samples is moderately young.
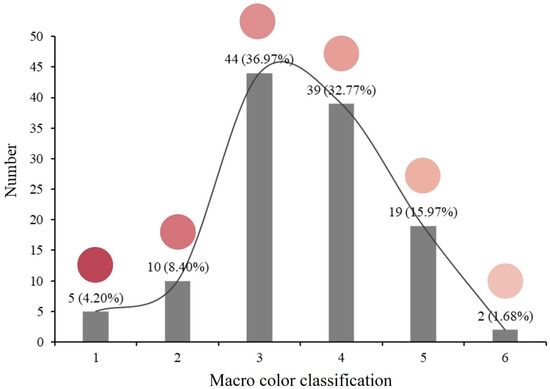
Figure 3.
Distribution, number of 119 wine samples, and averaged feature color of each macro-level color classification. Note: Averaged feature color for each macro-level color classification refers to the average of all wine samples’ feature colors in the classification.
Moreover, a circular spot denoting the averaged feature color for each classification was rendered and inserted in Figure 3, as well as presented in Figure 4A. The feature color is a reproduction of the real wine color at a thickness of 1 mm of the wine solution against a white background. It is contributed to by the color parameters of a*, b*, and L*. It is evident that along with the increase in the classification number, the dominant attribute of the color (purplish red hue, vividness, and dark lightness) of the red wine samples is attenuated, and the defective attributes (tawny or tile red, dullness, and bright lightness) are enhanced, which is a prominent trend of red wine color during aging.
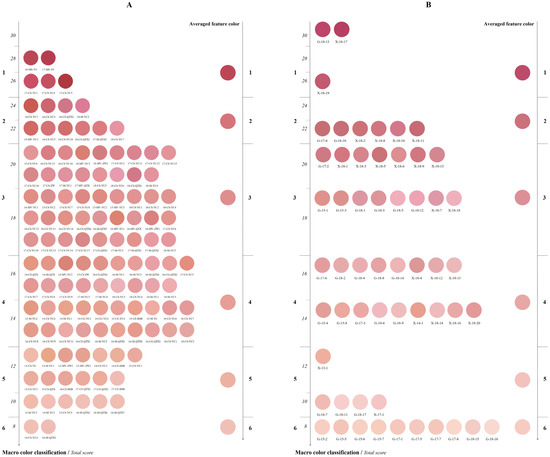
Figure 4.
Feature color and averaged feature color of 119 (A) and 56 (B) wine samples of each macro-level color classification. Note: (1)Wine samples with the same total score in each macro-level color classification are arranged in the order of wine sample number. (2)Averaged feature color for each macro-level color classification refers to the average of all wine samples’ feature colors in the classification.
The feature color spot is further applied to reproduce the color of each of the wine samples and was arranged according to the classification number, as demonstrated in Figure 4A. The color performance of wine samples in classification 1 is generally vivid, rich, deep, and strong in a purplish red or red hue. The classification 2 wine samples have a strong red hue with a medium saturation and dark lightness. The classification 3 wine samples show a slightly bright red with a little yellow hue and medium saturation. A slightly strong yellow hue intermingled with obvious light purple and red hues is characteristic of the classification 4 wine samples. In the classification 5 wine samples, purplish red and red hues have been replaced by a yellow hue as the dominant characteristic, with low saturation, grey perception, and brighter lightness. Intensely bright tile red with dull lightness is the leading visual perception of the classification 6 wine samples.
Through the intuitive presentation of the feature color of the wine samples in Figure 4A, it is obvious that as the classification number increases, the wine color presents distinct evolution featuring a decline in the purple and red hues, an enhancement of the yellow hue, and a decrease in the color saturation. As a result, the vivid and rich colors become duller and brighter; the deep, thick, and heavy perception and feeling of the wine body is gradually lost and becomes pale, clear, and bright.
The 119 wine samples were further classified by vintage, and the macro-level color classifications of the wine samples in each vintage were statistically analyzed in Table 3. It is not difficult to find that the classifications of aged wines are larger. On the contrary, younger wines have smaller classifications. For example, the highest classification of the vintage 2013 wine samples is 4, equal to the lowest classification of the vintage 2018 wine samples. An analysis of the average classification of each vintage shows that the color classification increases along with the wine’s age. A Pearson correlation analysis determined that the correlation coefficient between the average classification value and the wine age is 0.946 (p = 0.004), which is in accordance with general knowledge of the evolution of wine color and attests to the reasonability of the classification method of the red wine color’s evolution [33].
Table 3.
Descriptive statistics of macro-level color classifications of wine samples in each vintage.
During wine aging, browning is the most pronounced color change trend and results in a decline in color quality. The material basis of browning is the anthocyanins and their derivatives, the main coloring substances in red wine. Analyses of hundreds of commercial wines found that different types of anthocyanins have different evolution and distribution patterns during aging, contributing to the formation of different color qualities [34,35,36]. During aging, the color evolution of red wine depends on the initial composition and storage conditions, e.g., temperature, light, type and time of closure, etc. [37,38]. In this study, wine samples from different wineries have different initial compositions, which explains why the color performance and the color classification are uneven despite being from the same vintage of wines. However, in general, the older the wine, the more significant the browning is. In addition, it is worth mentioning that the highest classification of the 2017 wine samples is classification 1, and the average classification is the highest. We can infer that their overall color includes the youngest color attributes.
On the basis of above-mentioned analysis and discussion, we can responsibly say that the macro-classification method can effectively classify and evaluate the dynamic evolution of the macro-level color of red wines. This means that we have established a more convenient and simple quantitative method for characterizing the aging rate of specific red wine colors and for comparing and evaluating the relative aging characteristics and potentials of different red wine colors. For instance, regarding a specific red wine, different classifications at different times during aging and storage or under different aging and storage conditions could reveal how much the red wine color has aged from a quantitative perspective in order to evaluate the aging time and conditions. Moreover, for the comparison of different red wine colors, the method shows more interesting applications in the following four cases:
- (1)
- Red wines of the same vintage: As shown in Table 3, although from the same vintage, red wines are in different classifications, suggesting that red wines in lower classifications may have better initial color properties, suitable aging and storage conditions, and relatively more stable potential of color aging.
- (2)
- Red wines of the same classification: As shown in Figure 4, there are many red wines with different vintages in the same classification. Aged red wines present relatively equal color properties with younger red wines, which means these younger red wines exhibited relatively faster rates of color decay and aging. Furthermore, we can trace and analyze the causes of this situation, such as the variety, origin, and fermentation techniques used that influence the initial phenolic composition and/or inappropriate aging and storage conditions and management.
- (3)
- Several specific red wines: When monitoring changes in the macro-level color classifications of several red wines during same aging and storage conditions, we can compare and evaluate their color aging degree and color aging potential. Furthermore, we can trace and analyze the causes of their macro-level color classification changes, such as the variety, origin, and fermentation techniques used that influence the initial phenolic composition.
- (4)
- Color aging rate and color prediction: Based on long-term annual change data for a large number of macro-level color classifications of red wines, we expect to obtain average macro-level color classification change rates for different single-variety red wines, such as the index . At that time, we can use the absolute terms , , and as standards and indices to easily assess the degree, potential, and rate of color aging for specific red wines and further analyze the relationship between them and the complex factors that affect the color of red wine, which includes variety, origin, vintage, various fermentation techniques, and even storage and aging conditions. We can even predict the color evolution of red wines, according to the ΔX, , and the average color evolution. Admittedly, the realization of this application also requires a large number of red wine samples and dynamic color data.
In summary, macro-level color classification shows a clear classification effect and has great application potential for evaluating the color evolution of red wines, especially those related to aging. During wine aging, oxidation is the crucial limiting factor, and premature oxidation is a possible problem and potential risk that can occur during wine aging, causing cloudiness, yellowing and browning, and loss of positive aromas. Therefore, aging capacity (potential) is an essential factor in wine quality [39]. Traditionally, aging potential (aging capacity) is a concept and positive sensory definition used by wine tasting experts to evaluate a wine’s ability to retain its quality and typicity during aging. Therefore, relying on experts, some studies have identified sensory criteria used to define the aging potential concept in several wine models (red Burgundy wines and red Bordeaux wines) [40]. However, the subjectivity of sensory criteria based on the tasters’ assessment of aging potential cannot be ignored. Rapid or slow oxidation processes during aging bring about corresponding color changes and evolutions. Undoubtedly, as a direct and easily measurable feature, color offers the possibility to assess aging potential, which could indicate and predict the risks of premature oxidation and excessive oxidation to some extent. From this perspective, the macro-level color classification of red wine color proposed in this study provides a feasible, effective, and easily implemented method for characterizing the degree of aging, aging characteristics, and aging potential, which could provide practical instructions for wine-making and storage.
3.4. Applicability Verification
Using the micro- and macro-classification methods proposed in this study, 56 dry red wine samples were classified to verify the applicability of the method (Table S4). The feature colors of the wine samples in each macro-level color classification and the averaged feature color for each macro-level color classification were both represented (Figure 4B). The classification results of this method on 56 red wine samples is self-evident, which is consistent with the classification results on the aforementioned 119 red wine samples. The relatively younger color properties (purplish red hue, high saturation, and dark lightness) of the red wines are lost, and their younger color attributes correspondingly decline as the macro-level color classification number increases. The averaged feature color is the epitome of all the wine samples’ feature colors within each classification, showing significant distinction and variation between classifications. As the classification number increases, the purplish red hue is gradually replaced by an orange-red, brick red, or even yellow hue; and the vivid color becomes progressively duller; the deep, thick, and heavy perception and feeling of the wine body is gradually lost and becomes pale, clear, and bright. This trend indicates a deterioration of the younger red wines’ color properties and color aging. In addition, it is worth mentioning that among the 56 red wine samples, there are two full score wine samples (Total score = 30) in classification 1, which did not appear in the set of 119 red wine samples (Figure 4).
Although the existing micro- and macro-classification system of red wine color was established based on the 119 dry red wine samples in this study, it still had a clear and consistent classification effect for other dry red wines than these 119 models. It is safe to say that the system has good applicability. In addition, with the expansion of the red wine sample size and continuing the quantitative classification procedures, the scheme can be further improved by creating new micro- and macro-level color classifications to include new red wine samples, so its flexibility is evident. It is undeniable that the division of dry red wine samples at the boundary between two adjacent macro-classifications is not distinct enough (Figure 4), but this is the proof that the color evolution of red wines is a gradual and slow process, rather than a mutation. With the expansion of amount and range of red wine samples and more in-depth understanding of the contributing degree of red wine color attributes, this classification method will become more perfect.
Color, flavor, and texture are the three primary quality attributes that determine food acceptance. Color may have a much greater impact on our judgment than we thought. For example, the color of wine even synergistically affects the sense of smell [6]. In fact, a high positive correlation has been obtained between color and overall wine quality. The macroscopical color features of a wine are an external expression of the complicated internal factors, e.g., composition, copigmentation effect [41,42], matrix effect [43], etc. Therefore, monitoring the evolution of wine color during the winemaking process and assessing the color aging potential of commercial red wines will provide informative and valuable information for winemakers, researchers, and consumers [44]. The quantitative classification system of red wine color makes it a convenient possibility to achieve the above purpose. The method could be widely used in long-term color management during winemaking, aging, and storage and for evaluating and comparing the color of different wines. Finally, it is worth noting that most the red wine samples used for classification and verification in this study were Cabernet Sauvignon and Merlot varieties. Caution should be exercised when using this classification method to quantitatively evaluate the color of other mono-varietal wines, such as Pinot noir, which usually has a lighter color, or Marselan, which usually has a darker color.
4. Conclusions
On the basis of 119 representative red wine samples, we proposed a quantitative wine color classification method at a micro-perspective and a macro-perspective via the visualization of the wine color and the decomposition of the chromaticity and lightness components of the wine color. Four conclusions were drawn, as follows:
- (1)
- To a certain extent, the overall color characteristics of 119 dry red wines can be roughly summarized as follows: mainly ruby red, garnet, and brick red with medium saturation or lower and slightly bright. Even if there is a tendency for a concentrated distribution of wine colors, the color of each wine sample still shows uniqueness, and there is a high enough degree of discrimination between wine samples to be used as the basis for wine color classification.
- (2)
- The lightness L* (lightness), hue , and chroma (chromaticity) are divided into five sub-classifications each, and 125 micro-level color classifications such as h3C5L4, h2C2L1, and h1C3L2 are obtained by combining the three, which is convenient for describing, comparing, distinguishing, and associating the color characteristics of red wine.
- (3)
- On the basis of the micro-level wine color classification, a red wine color scoring and classification standard based on the color evolution of red wines over time is introduced. The micro-level color classifications are divided into six macro-level color classifications, which provides possible solutions for red wine color control, comparison, and evaluation.
- (4)
- In order to further verify and illustrate the applicability and flexibility of this system, 56 extra representative red wine samples were quantitatively classified. As expected, although the scheme is based on 119 wine samples, it has a consistently outstanding classification effect on wine samples beyond these 119 wine samples. It can be seen that the scheme has a high degree of practicability and flexibility.
In conclusion, the quantitative scheme proposed by the study, including the micro- and macro-classification of red wine color, provides new insights into viewing sensory-based indicators of red wine color from an objective and digital perspective.
Therefore, the quantitative micro-classification of red wine color establishes a series of innovative digital descriptors to represent, distinguish, compare, and convey wine color characteristics. In addition, the quantitative macro-classification of red wine color provides a novel objective standard to evaluate the color evolution and aging (aging degree, aging characteristics, and aging potential) of red wines and to monitor, track, evaluate, compare, and predict the color of a red wine during its whole life cycle.
Supplementary Materials
The following supporting information can be downloaded at: https://www.mdpi.com/article/10.3390/fermentation9060519/s1, Figure S1: Histogram of the Vintage(A), Origin(B) and Variety(C) distribution of the wine samples; Figure S2: Frequency distribution of CIELAB color parameters for 119 red wine samples; Table S1: Information of the 119 dry red wine samples; Table S2: Descriptive statistics of hue , chroma and lightness L* of 119 dry red wine samples; Table S3: Micro and macro color classification of 119 dry red wine samples; Table S4: Micro and macro color classification of 56 dry red wine samples; Table S5: Enological parameters of 119 dry red wine samples; Table S6: Enological parameters of 56 dry red wine samples.
Author Contributions
Conceptualization, S.F. and Y.L.; methodology, S.F.; formal analysis, S.F. and Y.Z.; data curation, S.F. and Y.Z.; writing—original draft preparation, S.F.; writing—review and editing, Y.L.; supervision, Y.L. All authors have read and agreed to the published version of the manuscript.
Funding
This work has been supported by the Regional Collaborative Innovation Project in the Xinjiang Autonomous Region of China (2022E02011), the National Key R&D Program of China (2019YFD1002500), and the Key Project of Research and Development Plan in the Ningxia Hui Autonomous Region of China (2018BBF02001).
Institutional Review Board Statement
Not applicable.
Informed Consent Statement
Not applicable.
Data Availability Statement
The data that support the findings of this study are available from the corresponding author, upon reasonable request.
Acknowledgments
We thank the Hefei advanced computing center for data calculations and analysis.
Conflicts of Interest
The authors declare no conflict of interest.
References
- Ku, K.H.; Kim, H.J.; Jeong, M.C. Relationship between quality characteristics and skin color of ‘Fuji’ Apples (Malus domestica Borkh.). J. Food Meas. Charact. 2019, 13, 1935–1946. [Google Scholar] [CrossRef]
- Pathare, P.B.; Opara, U.L.; Al-Said, A.J. Colour measurement and analysis in fresh and processed foods: A review. Food Bioprocess. Technol. 2013, 6, 36–60. [Google Scholar] [CrossRef]
- Caridi, A.; Romeo, R.; De, B.A.; Masaneo, C.; Poiana, M. Long-term effects of different starter yeasts on colour and natural antioxidant power of red wines. Eur. Food Res. Technol. 2021, 247, 2391–2398. [Google Scholar] [CrossRef]
- Jackson, R.S. Wine Tasting: A Professional Handbook, 2nd ed.; Academic Press: Salt Lake City, UT, USA, 2009. [Google Scholar]
- Parpinello, G.P.; Versari, A.; Chinnici, F.; Galassi, S. A Relationship among sensory descriptors, consumer preference and color parameters of Italian Novello red wines. Food Res. Int. 2009, 42, 1389–1395. [Google Scholar] [CrossRef]
- Morrot, G.; Brochet, F.; Dubourdieu, D. The color of odors. Brain Lang. 2001, 79, 309–320. [Google Scholar] [CrossRef] [PubMed]
- Parr, W.V.; White, G.; Heatherbell, D.A. The nose knows: Influence of color on perception of wine aroma. J. Wine Res. 2003, 14, 79–101. [Google Scholar] [CrossRef]
- Spence, C. On the psychological impact of food colour. Flavour 2015, 4, 21. [Google Scholar] [CrossRef]
- Fairchild, M.D. Visual and photographic assessment of wine color. Color Res. Appl. 2022, 48, 21–31. [Google Scholar] [CrossRef]
- Fairchild, M.D. The colors of wine. Int. J. Wine Res. 2018, 10, 13–31. [Google Scholar] [CrossRef]
- Hernández, B.; Sáenz, C.; Hoz, J.; Alberdi, C.; Alfonso, S.; Dieiro, J.M. Assessing the color of red wine like a taster’s eye. Color Res. Appl. 2009, 34, 153–162. [Google Scholar] [CrossRef]
- Martin, M.L.G.M.; Ji, W.; Luo, R.; Hutchings, J.; Heredia, F.J. Measuring colour appearance of red wines. Food Qual. Prefer. 2007, 18, 862–871. [Google Scholar] [CrossRef]
- Martínez, J.A.; Melgosa, M.; Pérez, M.M.; Hita, E.; Negueruela, A.I. Note. Visual and instrumental color evaluation in red wines. Food Sci. Technol. Int. 2001, 7, 439–444. [Google Scholar] [CrossRef]
- Yu, X.; Liu, K.; Wu, D.; He, Y. Raisin quality classification using least squares support vector machine (lssvm) based on combined color and texture features. Food Bioprocess. Technol. 2012, 5, 1552–1563. [Google Scholar] [CrossRef]
- Patil, N.K.; Malemath, V.S.; Yadahalli, R.M. Color and texture based identification and classification of food grains using different color models and haralick features. Int. J. Comput. Sci. Eng. 2011, 3, 3669. [Google Scholar]
- Pedreschi, F.; Mery, D.; Bunger, A.; YaEz, V. Computer vision classification of potato chips by color. J. Food Process Eng. 2011, 34, 1714–1728. [Google Scholar] [CrossRef]
- Vélez-Rivera, N.; Blasco, J.; Chanona-Pérez, J.; Calderón-Domínguez, G.; de Jesús Perea-Flores, M.; Arzate-Vázquez, I. Computer vision system applied to classification of “manila” mangoes during ripening process. Food Bioprocess. Technol. 2014, 7, 1183–1194. [Google Scholar] [CrossRef]
- Mery, D.; Pedreschi, F.; Soto, A. Automated Design of a Computer Vision System for Visual Food Quality Evaluation. Food Bioprocess. Technol. 2013, 6, 2093–2108. [Google Scholar] [CrossRef]
- León, K.; Mery, D.; Pedreschi, F.; Leon, J. Color measurements in L*a*b* units from RGB digital images. Food Res. Int. 2006, 106, 1084–1091. [Google Scholar] [CrossRef]
- OIV. Compte Rendu des Travaux, 34 Session de la OIV, March 1994, Paris. Off. J. Eur. Commun. 1994, 34, 3-X-90:167. [Google Scholar]
- Pavlidis, G. Colour sorting of translucent samples. J. Adv. Comput. Sci. Technol. 2015, 4, 265–272. [Google Scholar] [CrossRef]
- Snipes, M.; Taylor, D.C. Model selection and Akaike Information Criteria: An example from wine ratings and prices. Wine Econ. Policy 2014, 3, 3–9. [Google Scholar] [CrossRef]
- Agrawal, G.; Kang, D.K. Wine Quality Classification with Multilayer Perceptron. Int. J. Internet Broadcast. Commun. 2018, 10, 25–30. Available online: https://www.earticle.net/Article/A332199 (accessed on 4 February 2023).
- Petropoulos, S.; Karavas, C.S.; Balafoutis, A.T.; Paraskevopoulos, I.; Kallithraka, S.; Kotseridis, Y. Fuzzy logic tool for wine quality classification. Comput. Electron. Agric. 2017, 142, 552–562. [Google Scholar] [CrossRef]
- Boisier, B.; Mansouri, A.; Gouton, P. Wine color characterization and classification for nuances reproduction. Fifth Int. Conf. Signal Image Technol. Internet Based Syst. 2009, 25, 93–98. [Google Scholar] [CrossRef]
- Li, S.Y.; Zhu, B.Q.; Li, L.J.; Duan, C.Q. Extensive and objective wine color classification with chromatic database and mathematical models. Int. J. Food Prop. 2017, 2 (Suppl. 3), S2647–S2659. [Google Scholar] [CrossRef]
- Fan, S.Y.; Liu, C.Y.; Li, Y.K.; Zhang, Y. Visual Representation of Red Wine Color: Methodology, Comparison and Applications. Foods 2023, 12, 924. [Google Scholar] [CrossRef]
- Pérez-Caballero, V.; Ayala, F.; Federico Echávarri, J.; Negueruela, A.I. Proposal for a New Standard OIV Method for Determination of Chromatic Characteristics of Wine. Am. J. Enol. Vitic. 2003, 54, 59–62. [Google Scholar] [CrossRef]
- Gupta, A.K.; Medhi, M.; Chakraborty, S.; Yumnam, M.; Mishra, P. Development of rapid and non-destructive technique for the determination of maturity indices of pomelo fruit (Citrus grandis). J. Food Meas. Charact. 2021, 15, 1463–1474. [Google Scholar] [CrossRef]
- Garcia, M.B.; Ambat, S.; Adao, R.T. Tomayto, Tomahto: A Machine Learning Approach for Tomato Ripening Stage Identification Using Pixel-Based Color Image Classification. In Proceedings of the 2019 IEEE 11th International Conference on Humanoid, Nanotechnology, Information Technology, Communication and Control, Environment, and Management (HNICEM), Laoag, Philippines, 29 November–1 December 2020. [Google Scholar] [CrossRef]
- Ellis, L.P.; Kok, C. Colour Changes in Blanc de Noir Wines during Ageing at Different Temperatures and its Colour Preference Limits. South Afr. J. Enol. Vitic. 2017, 8, 16–22. [Google Scholar] [CrossRef]
- Kanavouras, A.; Coutelieris, F.; Karanika, E.; Kotseridis, Y.; Kallithraka, S. Colour change of bottled white wines as a quality indicator. Oeno One 2020, 54, 543–551. [Google Scholar] [CrossRef]
- Lvarez, J.E.; Barral, M.; Corral, M.F.; Lage, M.; Simal-Gandara, J. Bottle aging and storage of wines: A review. Molecules 2021, 26, 713. [Google Scholar] [CrossRef]
- Cliff, M.A.; King, M.C.; Schlosser, J. Anthocyanin, phenolic composition, colour measurement and sensory analysis of BC commercial red wines. Food Res. Int. 2007, 40, 92–100. [Google Scholar] [CrossRef]
- Zhang, X.K.; Lan, Y.B.; Huang, Y.; Zhao, X.; Duan, C.Q. Targeted metabolomics of anthocyanin derivatives during prolonged wine aging: Evolution, color contribution and aging prediction. Food Chem. 2020, 339, 127795. [Google Scholar] [CrossRef] [PubMed]
- Laitila, J.E.; Salminen, J.P. Relevance of the Concentrations and Sizes of Oligomeric Red Wine Pigments to the Color Intensity of Commercial Red Wines. J. Sci. Food Agr. 2020, 68, 3576–3584. [Google Scholar] [CrossRef]
- Avizcuri, J.M.; Sáenz-Navajas, M.P.; Echávarri, J.F.; Ferreira, V.; Fernández-Zurbano, P. Evaluation of the Impact of Initial Red Wine Composition on Changes in Color and Anthocyanin Content during Bottle Storage. Food Chem. 2016, 213, 123–134. [Google Scholar] [CrossRef]
- Estebana, M.D.; Ubeda, C.; Heredia, F.J.; Catania, A.A.; Assof, M.V.; Fanzone, M.L.; Jofre, V.P. Impact of closure type and storage temperature on chemical and sensory composition of malbec wines (mendoza, argentina) during aging in bottle. Food Res. Int. 2019, 125, 108553. [Google Scholar] [CrossRef] [PubMed]
- Waterhouse, A.L.; Miao, Y. Can Chemical Analysis Predict Wine Aging Capacity? Foods 2021, 10, 654. [Google Scholar] [CrossRef]
- Menn, N.L.; Marchal, R.; Sills, H.C.; Tempere, S.; Casenave, P.; Marchand, S.; de Revel, G.; Marchand, S. Development of a new sensory analysis methodology for predicting wine aging potential. application to champagne reserve wines. Food Qual. Prefer. 2021, 94, 104316. [Google Scholar] [CrossRef]
- Li, Y.K.; Prejanò, M.; Toscano, M.; Russo, N. Oenin and quercetin copigmentation: Highlights from density functional theory. Front. Chem. 2018, 6, 245. [Google Scholar] [CrossRef]
- Li, Y.K.; Prejanò, M.; Toscano, M.; Russo, N. Oenin/syringic acid copigmentation: Insights from a theoretical study. Front. Chem. 2019, 7, 579. [Google Scholar] [CrossRef]
- Wang, X.J.; Li, Y.K.; Song, H.C.; Tao, Y.S.; Russo, N. Phenolic matrix effect on aroma formation of terpenes during simulated wine fermentation–Part I: Phenolic acids. Food Chem. 2021, 341, 128288. [Google Scholar] [CrossRef] [PubMed]
- Terradesa, S.; Wagnera, S.; Ros-Lisb, J.V.; Ibáñezd, J.; Andrés, A. Optical system for automatic color monitoring in heterogeneous media during vinification processes. Sens. Actuat. B-Chem. 2019, 285, 513–518. [Google Scholar] [CrossRef]


Disclaimer/Publisher’s Note: The statements, opinions and data contained in all publications are solely those of the individual author(s) and contributor(s) and not of MDPI and/or the editor(s). MDPI and/or the editor(s) disclaim responsibility for any injury to people or property resulting from any ideas, methods, instructions or products referred to in the content. |
© 2023 by the authors. Licensee MDPI, Basel, Switzerland. This article is an open access article distributed under the terms and conditions of the Creative Commons Attribution (CC BY) license (https://creativecommons.org/licenses/by/4.0/).