Article

Calcium Propionate Supplementation Mitigated Adverse Effects of Incubation Temperature Shift on In Vitro Fermentation by Modulating Microbial Composition

1
College of Animal Science and Technology, China Agricultural University, Beijing 100193, China
2
State Key Laboratory of Animal Nutrition, Beijing 100193, China
3
Institute of Animal Huabandry, Hei Longjiang Academy of Agricultural Sciences, Harbin 150086, China
*
Author to whom correspondence should be addressed.
Fermentation 2023, 9(6), 544; https://doi.org/10.3390/fermentation9060544
Submission received: 1 May 2023 / Revised: 30 May 2023 / Accepted: 1 June 2023 / Published: 6 June 2023
(This article belongs to the Special Issue In Vitro Fermentation, 3rd Edition)

Abstract

:
The ingestion of cold water in winter results in fluctuating decreases in rumen temperature, impacting rumen fermentation function and methane production. This study aimed to investigate the impact of calcium propionate (CaP) on rumen fermentation characteristics, methane production, and microbial microbiome under different in vitro incubation temperatures. A 2 × 2 factorial experiment was conducted over 72 h, with or without 2.5% CaP (dry matter [DM] basis) in substrate under a constant incubation temperature (39 °C, CIT) or shifting incubation temperatures (12 cycles in total, with each cycle consisting of 4 h of incubation at 39 °C followed by immediate transfer to 30 °C for 2 h, ITS). The results showed that ITS inhibited the gas production, methane production, and methane concentration at 12 and 72 h (p < 0.05), and reduced the concentration of ammonium nitrogen (−14.25%), propionate (−16.14%), butyrate (−12.67%), and total volatile fatty acid (−8.50%) at 72 h more than the CIT groups (p < 0.05). The addition of 2.5% CaP significantly increased the gas production at 72 h (+4.84%), asymptotic gas production (+5.08%, per 0.2 g DM substrate), concentration of propionate (+18.05%), and valerate (+9.45%) (p < 0.05) compared to CaP-free groups, while it had no observable effect on the production or concentration of methane. Furthermore, the addition of 2.5% CaP yielded a significant increase in the relative abundance of Bacteroides (p < 0.05). Under the ITS condition, the relative abundance of Methanomicrobiales decreased and was positively correlated with methane production at 72 h (r = 0.47, p < 0.05). Additionally, CaP decreased the abundance of Prevotella_UCG_003 (p < 0.05), which was negatively correlated with the asymptotic gas production (r = 0.45, p < 0.05). Overall, our study suggests that the addition of 2.5% CaP can alleviate the adverse effects of ITS on in vitro fermentation parameters by regulating microbial composition and sustaining a reduction in methane production.

1. Introduction

Methane (CH4) is a particularly powerful greenhouse gas (GHG), which has 34 times the radiative forcing potential of CO2 over the course of a century [1,2,3]. Globally, CH4 emissions from the gastrointestinal tract of ruminants account for 30% of global anthropogenic CH4 emissions [4], which also accounts for 2% to 12% of gross energy intake in ruminants [5]. The main source of CH4 synthesis in rumen is microbial fermentation, and certain environmental conditions, such as temperature, pH, osmotic pressure, and redox potential, are necessary for the microbiome to thrive [6,7]. Among them, temperature was a key factor affecting microbial activity. Barnett et al. [8] observed an 8% reduction in methane yield in sheep exposed to low ambient temperatures (9 °C) compared to 26 °C. Duarte et al. [9] demonstrated that a 4 °C reduction in in vitro incubation temperature significantly decreased CH4, volatile fatty acids (VFA), and ammonium nitrogen (NH3-N) production. These studies indicate that reducing ambient or rumen temperature can inhibit CH4 production; however, it also has negative effects on rumen fermentation, which can further impact ruminant performance [10].
Cold water intake is a primary factor that leads to lower rumen temperature [11]. Peterson et al. [12] observed a decrease in rumen temperature to 31.6 °C following the ingestion of water at 8.2 ± 0.4 °C, which subsequently returned to normal levels within approximately 2 h. In regions characterized by temperate and cold temperate climates, such as Korea and Siberia [13,14], the intake of ambient water can have adverse effects on rumen temperature, consequently impacting animal performance. Guo et al. [15] reported that, in cold environments, a significant portion of propionate may enter the gluconeogenesis pathway in sheep, which can be attributed to the elevated energy requirements of ruminants under cold conditions, and the propionate serves as a key precursor in gluconeogenesis and plays a vital role in providing energy to ruminants [16].
In this study, we assume the increased energy expenditure required for restoring rumen temperature after cold water intake in winter and the propionate is crucial in this process. Therefore, we simulated the impact of drinking cold water on rumen temperature by periodically reducing the in vitro incubation temperature to 30 °C and hypothesized that the addition of calcium propionate (CaP) to the substrate would alleviate the resulting inhibition of rumen fermentation. Therefore, the objectives of this study were to investigate the effects of CaP addition and in vitro incubation temperature shift on rumen fermentation parameters, CH4 production, and microbial communities.

2. Materials and Methods

This experiment was carried out at the Beef Cattle Research Station of China Agricultural University in Beijing. Animal care and research procedures were approved by the Animal Welfare and Ethics Committee of China Agricultural University (permit number: AW71012202-1-1). Experiments were carried out following the “Regulations on the Administration of Experimental Animals” (National Science and Technology Commission of China, 1988).

2.1. Experimental Design and Diets

This experiment followed a 2 × 2 factorial design with a total of 4 treatments. The treatments consisted of substrates with or without 2.5% CaP (99.26% purity, Dongxin company, Shandong, China; DM basis) incubated at either a constant temperature (CT) of 39 °C or an incubation temperature shift (ITS) pattern. The ITS mode included 12 incubation temperature cycles, with each cycle consisting of maintaining a temperature of 39 °C for 4 h followed by 30 °C for 2 h, resulting in a total incubation time of 72 h. The experiment utilized a total of 48 incubation tubes, with each treatment having 12 replicates. Each replicate was assigned to one incubation tube. The supplement dose of CaP was derived from the previous work of Liu et al. [17]. The basal fermentation substrate’s composition and nutrient levels are shown in Table 1. The substrate was air-dried, crushed through a 1 mm sieve, and set aside.

2.2. Experiment Procedure and Sampling

Fresh rumen fluid was collected from three Angus cattle (460 ± 48 kg) fitted with permanent ruminal fistulas before morning feeding. The rumen liquid was squeezed and filtered through four layers of cheesecloth into vacuum bottles. The samples were immediately shipped to the laboratory of the Beef Cattle Research Center of China Agricultural University. In vitro incubation was performed according to the procedure outlined by Menke et al. [18]. The inoculum for in vitro fermentation was prepared by mixing rumen fluid with artificial saliva at a ratio of 1:2 (v/v) under continuous CO2 flux. A rumen incubation syringe (D-89173, Haberle Labortechnik, Lonsee, Germany) was prepared, and 220 mg (accurate to 0.0001 g) of the substrate (the ratio of concentrate to crude is 50:50) was weighed into an incubation tube. CaP was added at 0 (CaP-free groups) or 25 mg/kg (CaP groups) to 12 incubation syringes, respectively, with CT and ITS groups each assigned to 6 of them. A total of 30 mL of in vitro fermentation inoculum was injected into each syringe using a varispenser (Eppendorf AG, Hamburg, Germany). Three water bath automatic shaking incubators (Jie Cheng Experimental Apparatus, Shanghai, China) were prepared in advance, and the water bath temperatures were kept at 39 °C, 39 °C, and 30 °C, respectively. The CT groups were incubated in one of the 39 °C water bath shakers for 72 h. The ITS groups were incubated in another 39 °C water bath automatic shaker for 4 h and then immediately transferred to a 30 °C water bath automatic shaker for 2 h, with a total of 12 cycles of incubation that lasted for 72 h.
Cumulative gas production (GP) was manually recorded at time points of 0, 2, 4, 6, 8, 10, 12, 18, 24, 30, 36, 42, 48, 60, and 72 h during the incubation period. At the end of 12 and 72 h of incubation, 6 tubes from each treatment were placed in ice water, and pH was measured immediately using a rapid pH meter (teso205, testoAG, Baden-Württemberg, Germany), and triplicate gas samples were collected from each syringe to determine CH4 and CO2 production via Gas Chromatography (TP-2060F, Beijing Beifen Tianpu Analytical Instrument Co., Ltd., Beijing, China). After 72 h of fermentation, the fermentation liquid was sampled in each syringe, then centrifuged at 8000× g for 15 min at 4 °C, and the supernatants were obtained to determine VFA, NH3-N, and microbial composition.

2.3. Chemical Analysis

2.3.1. Gas Production

The dynamic gas production parameters of the samples were calculated according to the formula proposed by Ørskov and McDonald et al. [19]:
Y = b × (1 − ect)
where Y represents the gas production (mL) of 0.2 g DM substrate at time t; b represents the asymptotic gas production (mL) of 0.2 g DM substrate; c represents the rate of gas production per hour.

2.3.2. Fermentation Parameters

NH3-N concentration was determined by using the method outlined by Broderick et al. [20]. The concentration of VFA was determined by using gas chromatography (GC3420, Beijing Analytical Instrument Factory, Beijing, China) with the following instrument conditions: flame ionization detector (FID), PEG-20M + H3PO4 glass packed column (2 m × 6 mm × 2 mm), column temperature 145 °C, the detector temperature was 200 °C, the injector temperature was 200 °C, the carrier gas was nitrogen, the flow rate was 30 mL/min, and the injection volume was 0.6 μL.

2.3.3. DNA Extraction and Illumina Sequencing of Archaeal and Bacterial 16S rRNA Genes

A 16S rRNA gene sequence library using a two-step PCR protocol was generated according to the manufacturer’s instructions. In total, 16S of fermentation liquid samples (n = 6) of each treatment after 72 h of fermentation using PCR universal bacterial and archaeal primers 515-F (5′-GTGCCAGCMGCCGCGGTAA-3′) and 806-R (5′-GGACTACVSGGGTATCTAAT-3′) rRNA targets the V3-V4 region. PCR was performed using the KAPA HiFiHotstart PCR kit with high-fidelity enzymes. PCR products were then extracted from 2% agarose gels and purified using the AxyPrep DNA Gel Extraction Kit (Axygen Biosciences, Union City, CA, USA) and QuantiFluor-st (Promega, Madison, WI, USA). The resulting purified PCR products were then pooled and subjected to paired-end sequencing (2 × 250 bp) on the Illumina MiSeq platform according to standard protocols. QIIME (version 1.17) was used for demultiplexing and quality filtering of raw fastq files. Regarding overlap, only sequences overlapping more than 10 bp were assembled. UPARSE was used to classify operational taxonomic units (OTUs) with a similarity of 97%. Then, we used UCHIME to identify and remove chimeric sequences. Based on taxonomic analysis [21], the RDP classifier using the RDP OTU database (https://rdp.cme.msu.edu/ accessed on 5 April 2023) had a confidence level of 80%, and the relative abundance of bacteria was expressed as percentage [22,23]. A representative sequence was selected from each OTU based on its abundance. Rarefaction curve and alpha diversity indices were developed using these OTUs, including abundance-based coverage estimator (ACE), Chao 1, Shannon, and Simpson estimators. To identify changes in the microbial population structure, the jackknifed beta diversity was visualized through Principal Component Analysis (PCA) using the UnscramblerX program (CAMO Software Inc. in Woodbridge, NJ, USA).

2.4. Statistical Analysis

All data except microorganisms were analyzed as a 2 × 2 factorial design using the GLM program of SAS 9.4 (SAS Institute Inc., Cary, NC, USA). The fixed effects included incubation temperature, CaP, and their interaction. The least squares mean of all treatments were exported and compared using SAS’s PDIFF (Tukey-adjusted) and STDERR options. Linear discriminant analysis of effect size (LEfSe) was performed using the Kruskal–Wallis rank sum test to analyze differences in the bacterial and archaeal microbiota abundance of fermentation liquid. Linear discriminant analysis (LDA) scores (threshold ≥ 3) were used to indicate effect size. Correlation analysis between fermentation parameters and the relative abundance of bacterial genus-level composition and gas composition and archaeal-level composition was carried out by using the Spearman method. Results were expressed as least squares mean ± standard error of the mean (SEM). p ≤ 0.05 was used as the criterion for statistical significance, and 0.05 < p ≤ 0.10 was used as a significant trend.

3. Results

3.1. Fermentation Parameters

The concentrations of NH3-N, propionate, butyrate, isobutyrate, valerate, isovalerate, and total volatile fatty acid salts were significantly reduced (p < 0.05) by ITS (Table 2). The addition of CaP resulted in a significant decrease in the acetate to propionate ratio (p = 0.01) and showed a tendency to increase the concentration of total VFA (p = 0.05) compared to the CaP-free group. Compared to the constant temperature of 39 °C, the ratio of acetate to propionate in the fermentation liquid significantly increased due to ITS (p = 0.02). Moreover, the concentrations of NH3-N, butyrate, isobutyrate, valerate, and isovalerate were significantly affected by the interactive effects of incubation temperature and CaP (p < 0.05).

3.2. Gas Production

3.2.1. Cumulative Gas Production

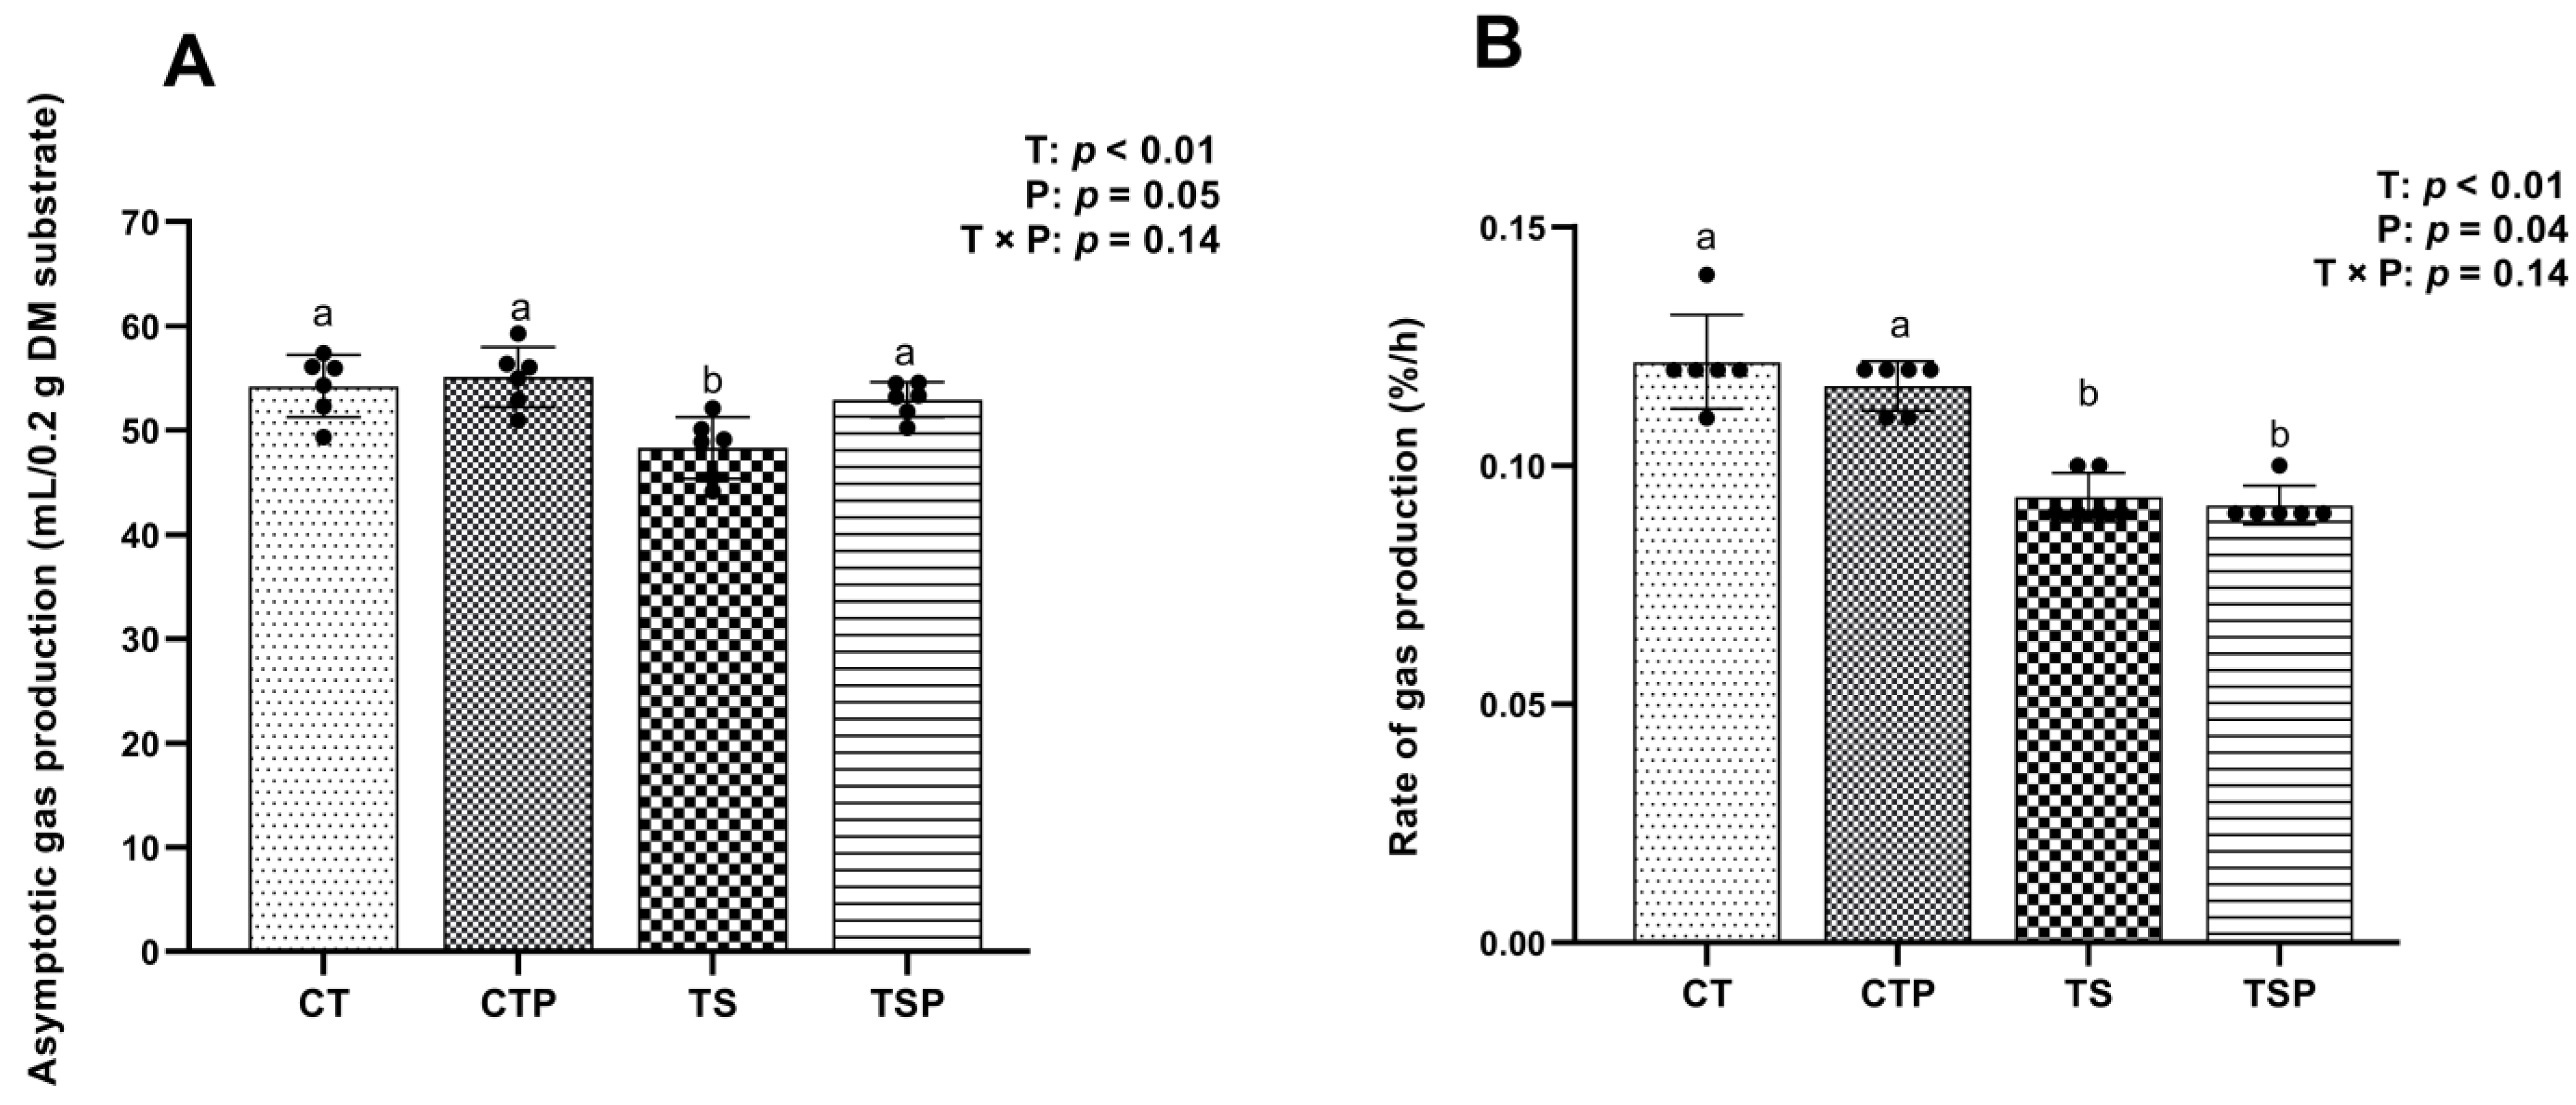
ITS significantly decreased (p < 0.05) the cumulative gas production of 0.2 g DM substrate at incubation times of 12, 24, 48, and 72 h (Figure 1) and also had more of an impact on the asymptotic gas production per 0.2 g DM substrate and the rate of gas production per hour (Figure 2) compared to CT treatments. The addition of CaP significantly increased gas production at 72 h (p = 0.04), the asymptotic gas production per 0.2 g DM substrate (p = 0.04), and the rate of gas production per hour (p = 0.04) compared to the CaP-free groups.

3.2.2. CH4 and CO2 Production

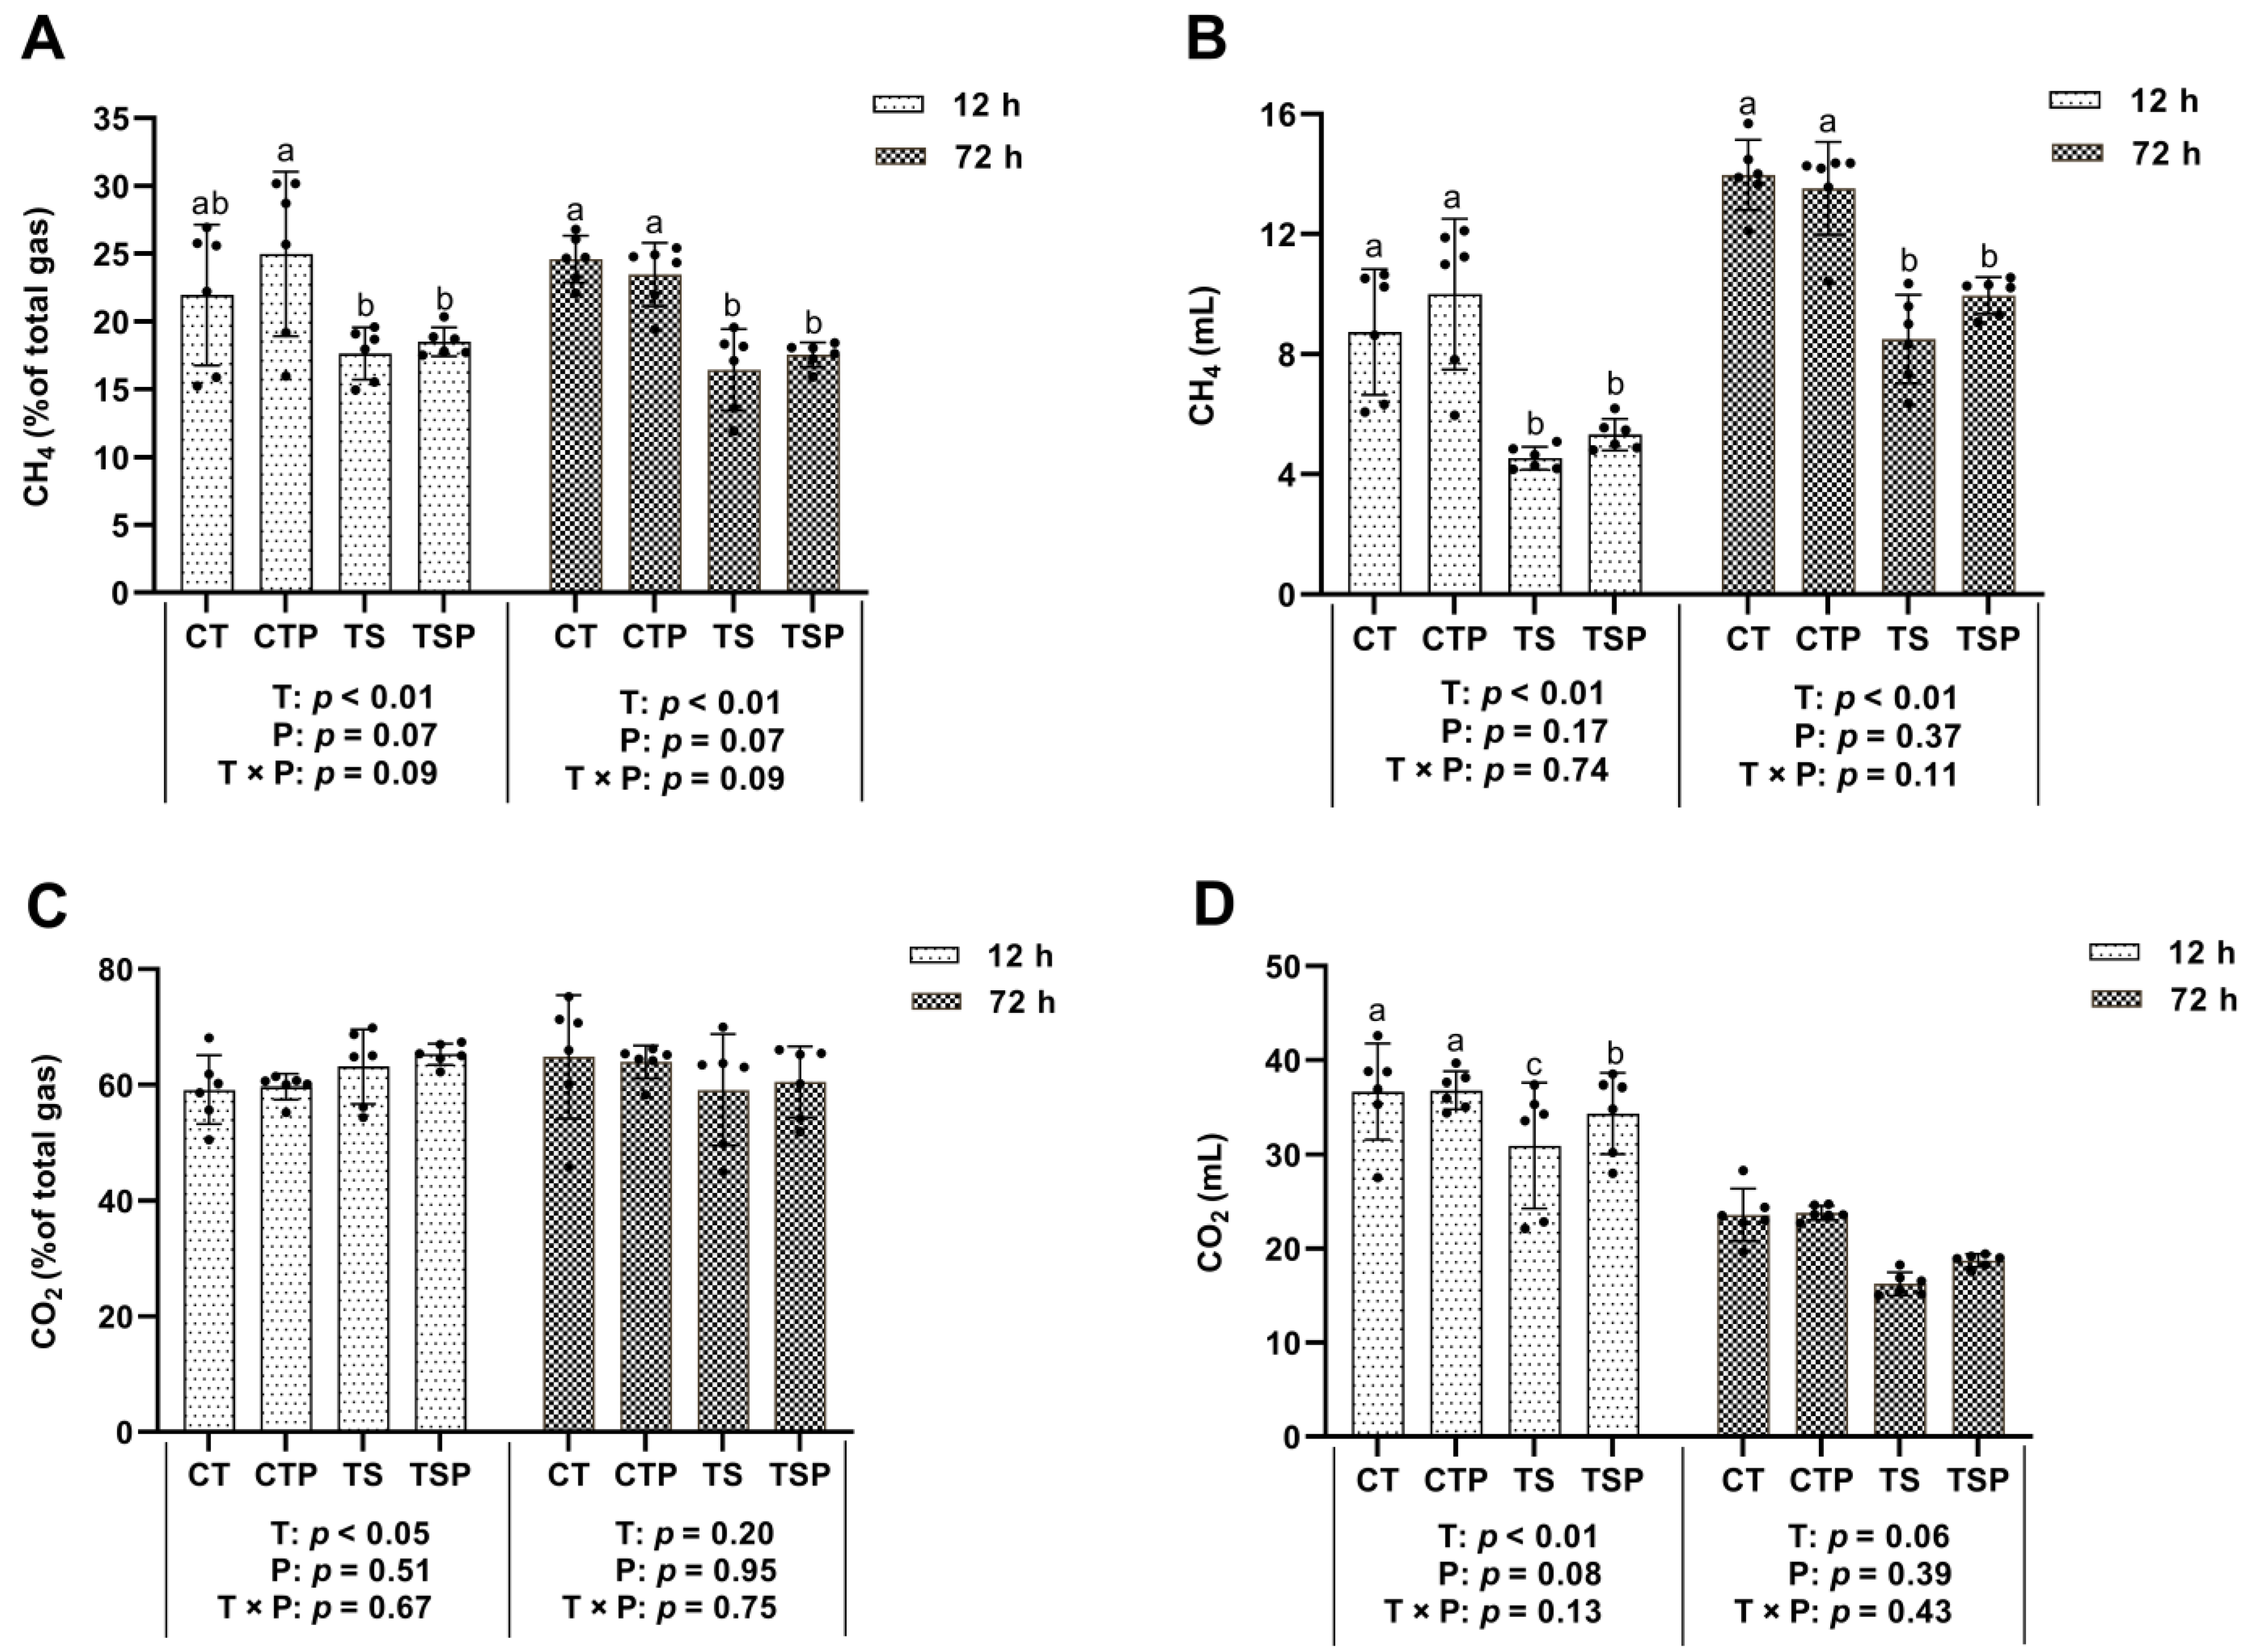
ITS significantly reduced (p < 0.01) the CH4 concentration and production at 12 h and 72 h, and significantly reduced the CO2 concentration in the total gas at 12 h (p < 0.05) compared with the constant temperature of 39 °C (Figure 3). However, the concentration (p = 0.07) and yield (p = 0.37) of CH4 and the concentration (p = 0.95) and yield (p = 0.39) of CO2 at 72 h were not affected by the addition of CaP.

3.3. Bacterial and Archaeal Diversity Analysis

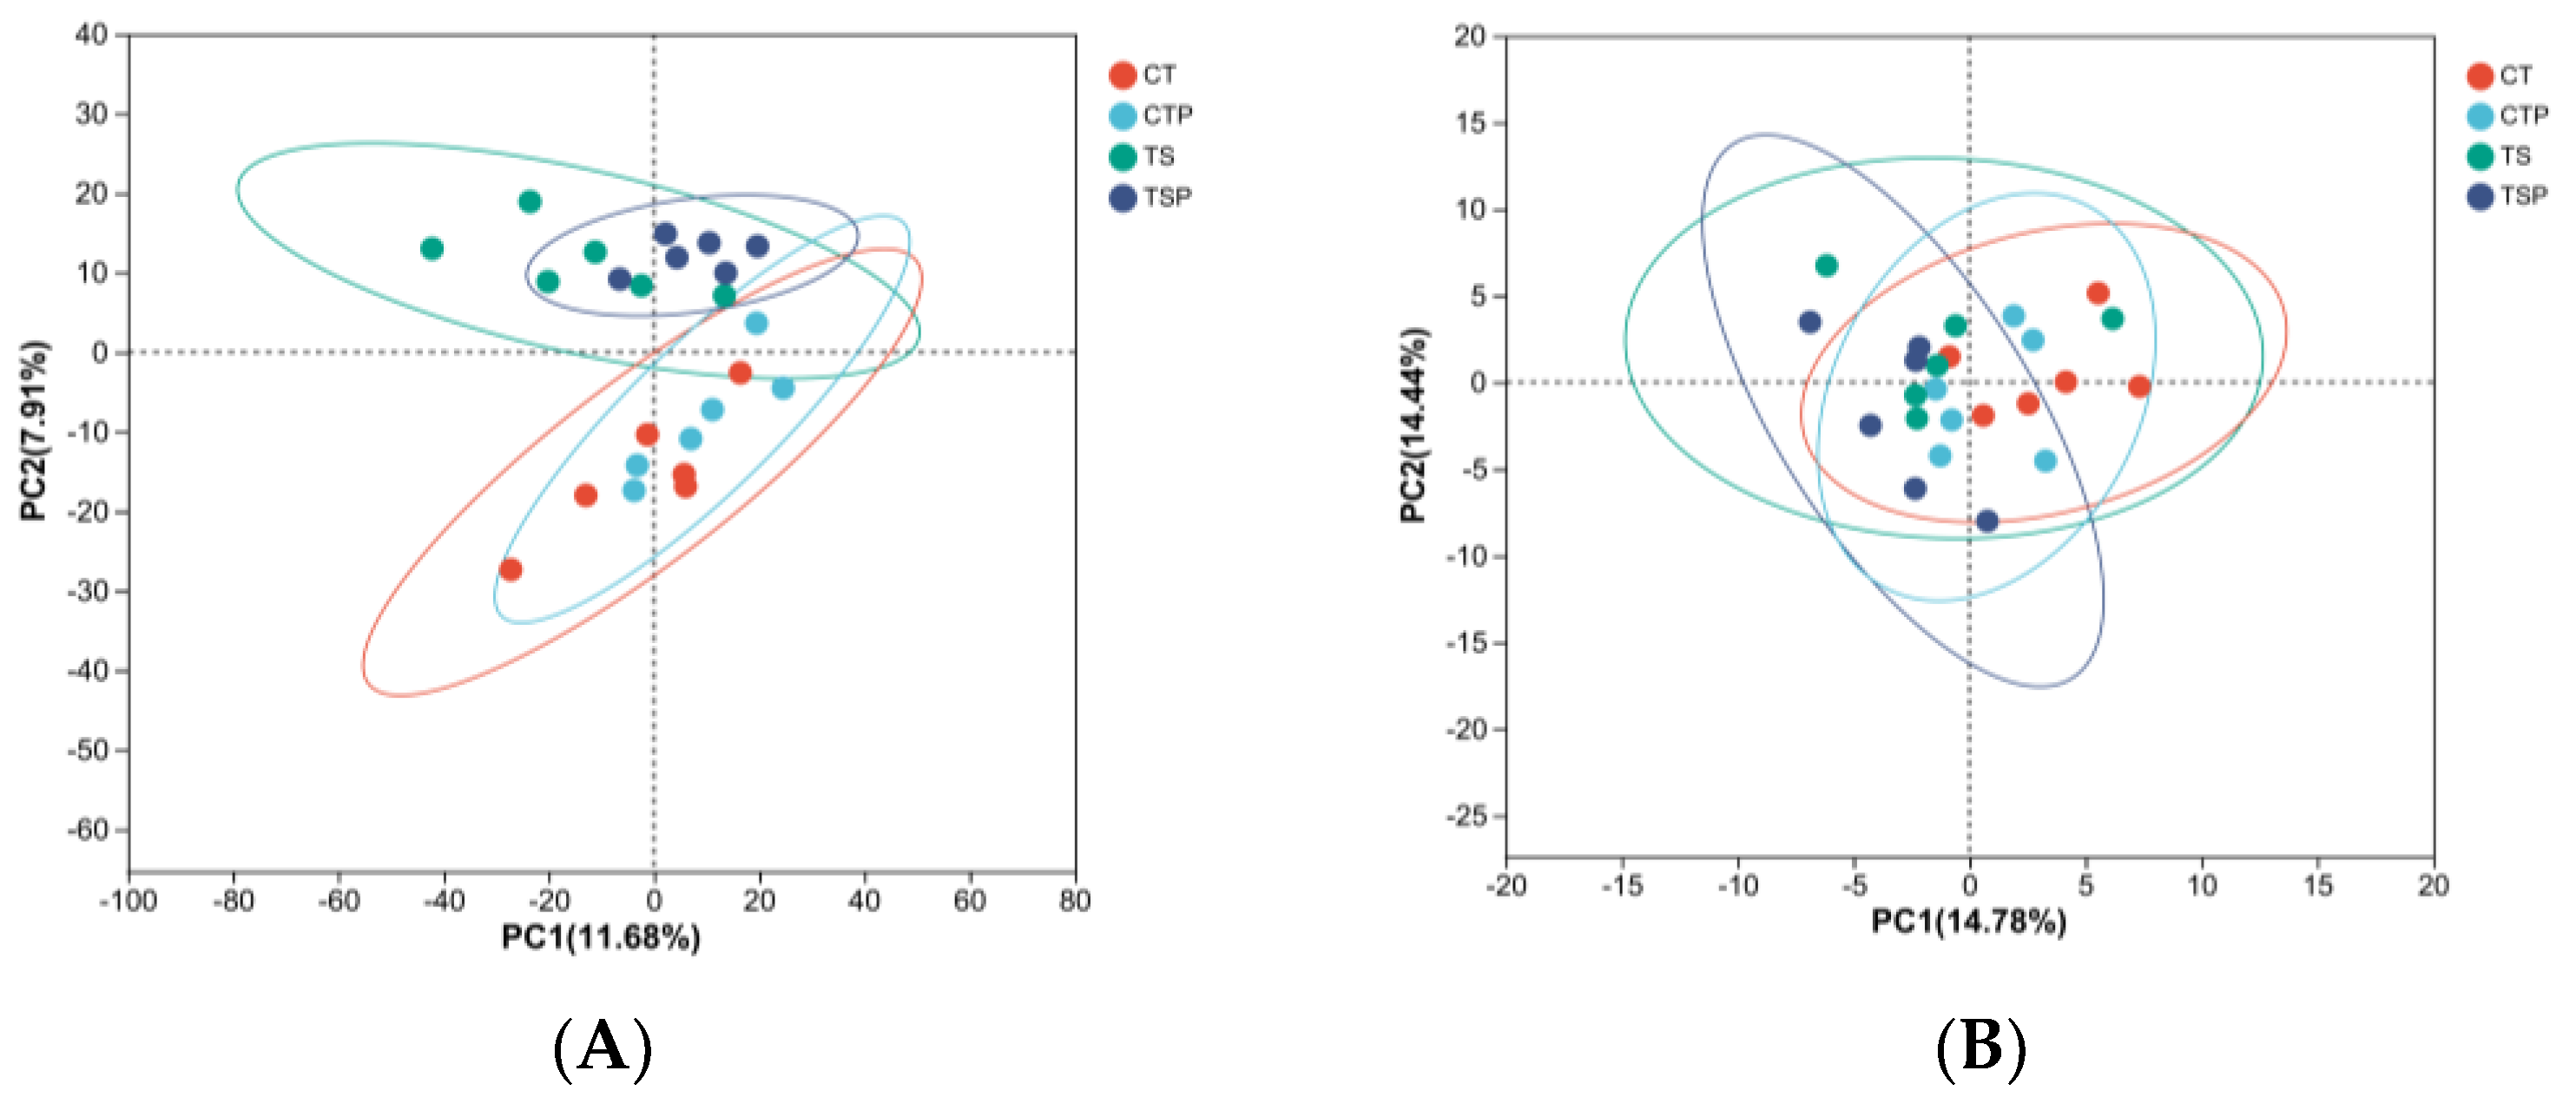
ITS or CaP significantly reduced the Sobs index of the archaea after 72 h of fermentation (p < 0.01) compared with the constant temperature of 39 °C or the CaP free group (Table 3). The PCA analysis of the fermentation liquid flora showed that the ITS led to a significant separation of the bacterial principal components of the samples, while no significant distinction was found between the archaeal principal components (Figure 4A,B).

3.4. Microflora Composition of Bacteria and Archaea

ITS decreased (p < 0.05) the relative abundance of Firmicutes phylum, Bacillus, Ruminococcaceae, Methanomicrobiales, and Archaea genus while increasing (p < 0.05) the relative abundance of Bacteroidota phylum and F082 genus (Table 4). The addition of CaP significantly increased (p < 0.05) the relative abundance of Firmicutes and Actinobacteriota phylum and the Ruminococcus genus, but significantly decreased (p < 0.05) the relative abundance of Prevotella, Prevotellaceae_UCG-003, Prevotellaceae_UCG-004, and the Archaea genus. ITS and CaP had a tendency to significantly affect the relative abundance of the Prevotellaceae_UCG-001 genus (p = 0.05).

3.5. Spearman Correlation Analysis of the Top 50 Bacteria or Top 12 Archaea Genus with Gas Production, Fermentation Parameters, and CH4 Production

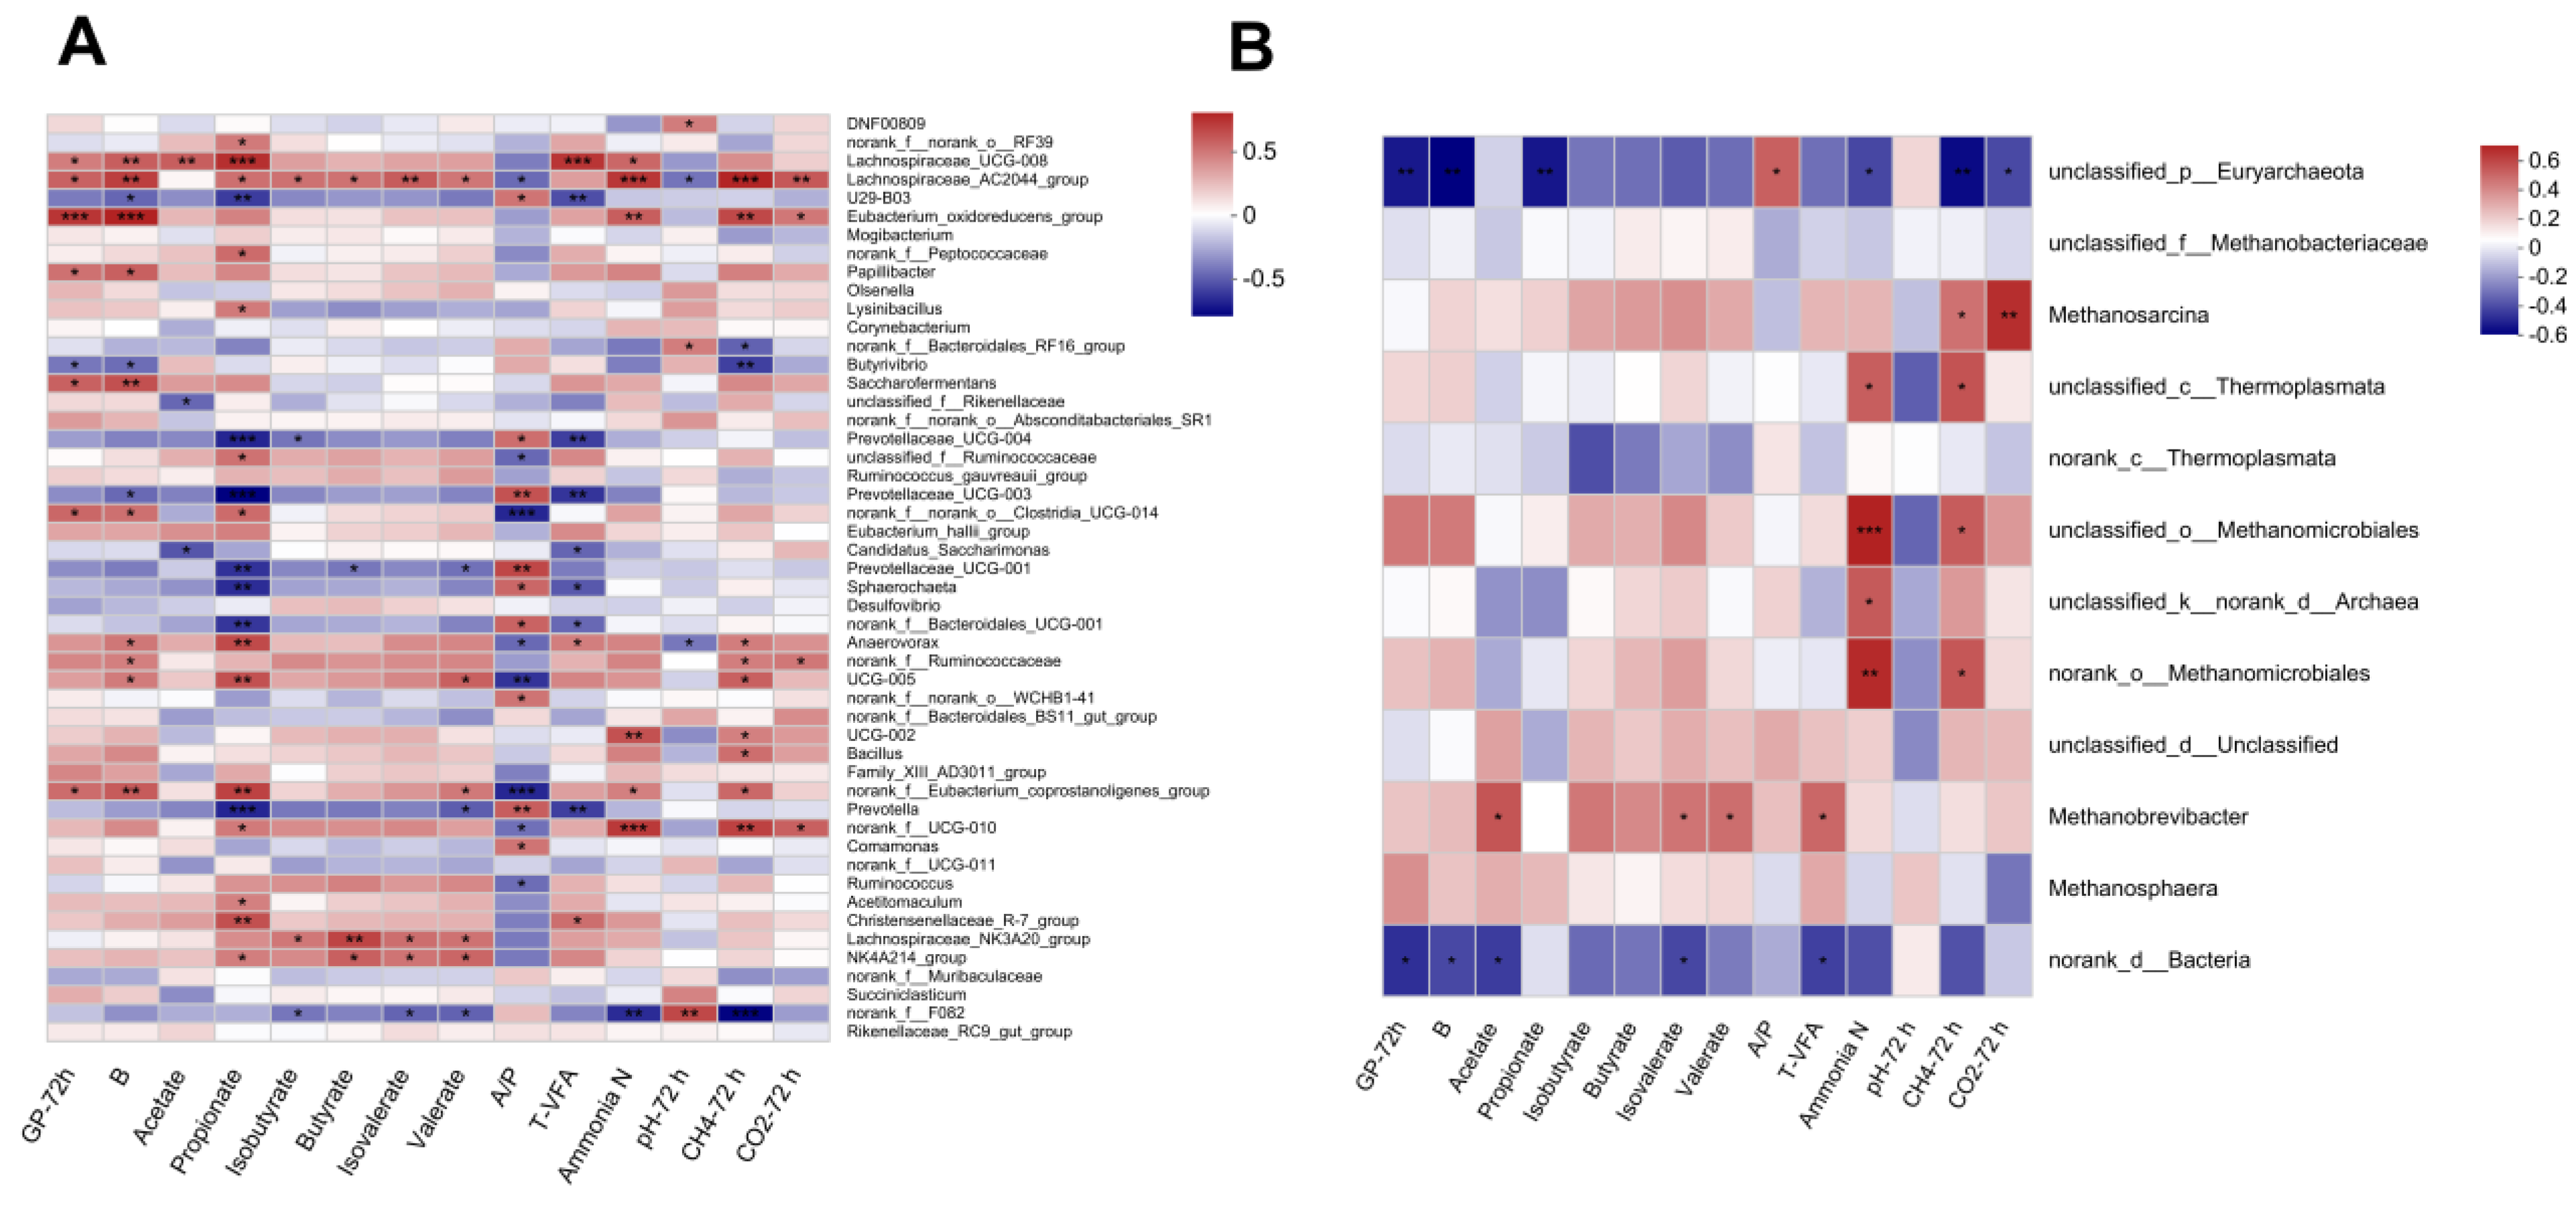
According to Spearman correlation analysis (Figure 5), the total gas production at 72 h (GP-72 h), the asymptotic gas production per 0.2 g DM substrate (B), acetate, propionate, and total VFA were significantly positively related to Lachnospiraceae_UCG-008 (r > 0.41, p < 0.05). Prevotella was significantly positively correlated with propionate and pH at 72 h (pH-72 h) (r > 0.42, p < 0.05) and significantly negatively correlated with valerate, the ratio of acetate to propionate, and total VFA (r < −0.48, p < 0.05). Ruminococcus was significantly negatively correlated with propionate and pH-72 h (r < −0.43, p < 0.05). Additionally, butyrate, valerate, and isovalerate were all significantly positively correlated with Lachnospiraceae_NK3A20 and NK4A214 (r > 0.44, p < 0.05). NH3-N was significantly positively correlated with UCG-010 (r = 0.64, p < 0.01) and significantly negatively correlated with F082 (r = −0.62, p < 0.01). In terms of greenhouse gas emissions (Figure 5B), the total production of CH4 after 72 h (CH4-72 h) was significantly positively correlated with Methanosarcina, Thermoplasmata, Methanomicrobiales, Archaea, and Methanomicrobiales (r > 0.45, p < 0.05), while being significantly negatively correlated with Methanomicrobiales (r = −0.46, p < 0.05). In addition, the total CO2 production after 72 h (CO2-72 h) was highly significantly positively correlated with Methanosarcina (r = 0.64, p < 0.01).

4. Discussion

In vitro gas production is a crucial indicator used for assessing the rumen fermentation status in ruminants, which can effectively reflect the fermentative activities of the rumen microorganisms and the extent of diet degradation [24,25]. Our research revealed that gas production significantly decreased due to ITS, suggesting that the reduction in culture temperature may lead to the inhibition of microbial activity and digestive enzyme function in the fermentation liquid, thereby reducing the digestibility of in vitro fermentation [6,9,26]. Consistent with our findings, Petersen et al. [12] found that, compared with the constant temperature of 39 °C, a 4 °C decrease in incubation temperature causes a significant decrease in gas production at 48 h of in vitro fermentation, and the disappearance rate of NDF was reduced by more than 15%. Furthermore, our study revealed a significant decrease in VFA production when the culture temperature was changed. VFAs are important indicators of feed degradation, and the reduction in VFA production suggests a substantial impact on the fermentative breakdown of nutrients in the substrate. This effect may be attributed to the optimal adhesion of rumen microorganisms to fibrous substrates at approximately 38 °C [27]. The decline in VFA production observed at lower temperatures might be attributed to the decrease in microbial adhesion caused by the low temperature conditions. However, Cunningham et al. [28] reported that no discernible impact on digestion was found when cows drank cold water (1.1 °C) compared to warm water (39.4 °C). Brod et al. [29] reported that water temperature (0, 10, 20, or, 30 °C) had no effect on the digestibility of rumen crude fiber and crude protein (CP) in sheep; however, the lowest digestion coefficients were observed for the 0 °C treatment. The disparity between the in vivo and in vitro tests may be due to the fact that the rumen temperature recovery was faster in vivo than in vitro, and the duration of the low temperature was not long enough to cause a decrease in the digestibility of nutrients.
Interestingly, we found that the addition of 2.5% CaP increased gas production and VFA production, indicating that the addition of CaP could alleviate the severity of the decrease in fermentation caused by ITS. The higher concentrations of propionate and total VFA in the CaP supplemented groups might be due to exogenous CaP addition rather than just an increase in rumen fermentation yield, whereas the increase in gas production and valerate concentration might be related to the improvement of rumen fermentation function and feed digestibility by adding CaP. Liu et al. [17] found that, with the dietary addition of CaP, the total digestive tract digestibility of organic matter (OM), neutral detergent fiber (NDF), and CP of beef cattle increased linearly or quadratically. They concluded that CaP stimulated microorganisms or digestive enzymes in a dose-dependent manner. This aligns with a study by Sheperd and Combs [30], who reported that, compared with control cows, the digestibility of DM, OM, NDF, acid detergent fiber (ADF) increased by 8.3%, 8.0%, 19.4%, and 20.4%, respectively, in cows undergoing propionate infusion. In addition, our study found that the addition of CaP to the substrate significantly increased the abundance of Ruminococcus in rumen fluid, which was consistent with a study by Zhang et al. [31], who found that supplementing dairy cows with different doses of CaP (0, 200, 350, and 500 g CaP for each cow per day) linearly increased the rectal microbiome of Ruminococcus abundance. Members of the Ruminococcus family have been found to contribute to fiber metabolism [32]. Therefore, the addition of CaP might improve fiber digestibility by increasing the relative abundance of Ruminococcus, thereby increasing gas and VFA production and alleviating the inhibition of the in vitro fermentation caused by ITS.
Methanogenic archaea in the rumen play a key role in CH4 production by converting hydrogen and carbon dioxide into CH4 [32]. We observed a significant positive correlation between CH4 production and the abundance of specific archaeal genera, namely Methanomicrobiales, Methanomicrobiales, and Methanosarcina, after 72 h of fermentation. Interestingly, the ITS condition resulted in a notable reduction in the abundance of Methanomicrobiales and Archaea in the fermentation liquid. This suggested that the decrease in CH4 production could be attributed to the lower abundance or activity of CH4-producing archaea in the rumen, potentially due to the impact of ITS. In alignment with our findings, Duarte et al. [9] reported that reducing the fermentation temperature from 39 °C to 35 °C caused a 43% reduction in CH4 production and significantly reduced the diversity and richness of archaea and bacteria in the in vitro fermentation liquid. However, Antanaitis et al. [33] reached a different conclusion. They found that the CH4 production of dairy cows did not significantly correlate with rumen temperature, though it did show a positively correlation with rumen pH. Likewise, Bhatta et al. [34] also showed that a slight increase in temperature (39 °C vs. 41 °C) did not have any statistical differences regarding CH4 production by in vitro fermentation. Many publications have investigated the effect of rumen temperature on CH4 production, and findings have indicated that the variation magnitude of incubation temperature and the duration at different temperatures may be key factors influencing the different results for CH4 production. Periodic drops in the incubation temperature of 9 °C every 4 h for 2 h under our experimental conditions had an inhibitory effect on the relative abundance of CH4-producing archaea and significantly decreased CH4 production.
Bacteria and archaea were the main microorganisms in the rumen, playing a significant role in the degradation of plant carbohydrates into VFAs [35] and the generation of CH4 [36], respectively. In our study, we observed that ITS had a significant impact on rumen archaea α-diversity and the distinct differentiation of the bacterial principal components, indicating that incubation temperature had a more pronounced effect on the structure and diversity of microbial colonies. Similar results were found by Duarte et al. [9], who reported that in vitro incubation at 35 °C for 7 days decreased the diversity and richness of bacteria and archaea in fermentation liquid. In our study, ITS or adding 2.5% CaP led to a decrease in the relative abundance of Firmicutes and an increase in the relative abundance of Bacteroidetes in fermentation liquid. For herbivores, Firmicutes were involved in the degradation of cellulose, which was crucial for the nutritional and energy intake of herbivores [37]. In addition, most members of the Firmicutes phylum were regarded as beneficial gut bacteria that positively regulate gut health homeostasis, disease resistance, and growth performance [38,39]. Moreover, the addition of CaP increased the proportion of concentrate in the substrate, which may also justify the increase in the proportion of Firmicutes and the decrease in the proportion of Bacteroidetes [40,41]. Surprisingly, the addition of CaP to the substrate significantly decreased the relative abundance of the genera Prevotella, Prevotellaceae_UCG-003, and Prevotellaceae_UCG-004 in the fermentation liquid. This resulted contrasted with our in vivo tests, which found no significant effect on the relative abundance of Prevotella in both fattening bulls and lactating cows [42,43]. This discrepancy might be related to the essential difference between in vivo and in vitro tests. Prevotella mainly degrade non-structural carbohydrates and promote propionate production through gluconeogenesis [44,45], while the addition of exogenous CaP increases the concentration of propionate in fermentation liquid. Previous studies have indicated that the dietary addition of 100 g/d calcium propionate did not significantly increase the concentration of propionate in the rumen, possibly due to its reduction in dry matter intake and consequent decrease in fermentative propionate production [46]. Furthermore, elevated propionate concentrations have been shown to enhance the absorption capacity of VFA in the rumen [47]. The decrease in endogenous propionate production and the accelerated absorption can counterbalance the supplementation of exogenous propionate, thereby maintaining a relatively constant concentration of propionate in the rumen. However, in vitro fermentation does not involve changes in VFA absorption or dry matter intake, the excessive accumulation of propionate in the fermentation broth may potentially suppress the relative abundance of fermentative propionate-producing bacteria, such as the Prevotella genus [43].

5. Conclusions

In summary, our study found that the shift in incubation temperature (39 °C for 4 h followed by 30 °C for 2 h, periodically) negatively affected various in vitro fermentation parameters. However, the addition of 2.5% CaP showed promise in mitigating these effects by increasing gas production, propionate, and total volatile fatty acid concentrations. Moreover, CaP supplementation positively influenced microbial composition. These findings suggest the potential of CaP supplementation as a strategy to alleviate the adverse effects of cold water intake on rumen fermentation and microbial balance in beef cattle. Further investigation is needed to explore the practical application of CaP supplementation in in vivo experiments, particularly in assessing its impact on rumen metabolism and microbial composition under cold conditions.

Author Contributions

Conceptualization, T.H. and Z.C.; methodology, X.W. and S.L.; investigation, X.W., J.L. and T.H.; data curation, T.H. and X.W.; writing—original draft preparation, T.H. and S.L.; writing—review and editing, T.H., Z.W. and Y.G.; project administration, F.S.; funding acquisition, Z.C. All authors have read and agreed to the published version of the manuscript.

Funding

This study was financially supported by the National Key R&D Program of China (2021YFD1600203), the China Agricultural Research System (CARS-37), and the 2115 Talent Project of China Agricultural University (2115).

Institutional Review Board Statement

All experimental procedures were approved by the Ethics Committee of the College of Animal Science and Technology at China Agriculture University (Beijing, China).

Informed Consent Statement

Not applicable.

Data Availability Statement

The data that support the findings of this study are available from the corresponding authors upon reasonable request.

Acknowledgments

The authors would like to thank the crew of the Beef Cattle Research Station of China Agricultural University in Beijing for their help in animal management.

Conflicts of Interest

The authors declare that the research was conducted in the absence of any commercial or financial relationships that could be construed as a potential conflict of interest.

References

  1. Intergovernmental Panel on Climate Change. Summary for Policymakers. In Climate Change 2013—The Physical Science Basis: Working Group I Contribution to the Fifth Assessment Report of the Intergovernmental Panel on Climate Change; Cambridge University Press: Cambridge, UK, 2014; pp. 1–30. [Google Scholar] [CrossRef]
  2. Bridgham, S.D.; Cadillo-Quiroz, H.; Keller, J.K.; Zhuang, Q. Methane emissions from wetlands: Biogeochemical, microbial, and modeling perspectives from local to global scales. Glob. Chang. Biol. 2013, 19, 1325–1346. [Google Scholar] [CrossRef] [PubMed]
  3. Chen, H.; Xu, X.; Fang, C.; Li, B.; Nie, M. Differences in the temperature dependence of wetland CO2 and CH4 emissions vary with water table depth. Nat. Clim. Chang. 2021, 11, 766–771. [Google Scholar] [CrossRef]
  4. Beauchemin, K.A.; Ungerfeld, E.M.; Abdalla, A.L.; Alvarez, C.; Arndt, C.; Becquet, P.; Benchaar, C.; Berndt, A.; Mauricio, R.M.; McAllister, T.A.; et al. Invited review: Current enteric methane mitigation options. J. Dairy Sci. 2022, 105, 9297–9326. [Google Scholar] [CrossRef] [PubMed]
  5. Johnson, K.A.; Johnson, D.E. Methane emissions from cattle. J. Anim. Sci. 1995, 73, 2483–2492. [Google Scholar] [CrossRef]
  6. Linville, K.; Casper, D.P.; Osorio, J.S. In vitro analysis of rumen microbial fermentation at different temperatures. J. Anim. Sci. 2017, 95, 182–183. [Google Scholar] [CrossRef]
  7. Ramos, S.C.; Jeong, C.D.; Mamuad, L.L.; Kim, S.H.; Kang, S.H.; Kim, E.T.; Cho, Y.I.; Lee, S.S.; Lee, S.S. Diet transition from high-forage to high-concentrate alters rumen bacterial community composition, epithelial transcriptomes and ruminal fermentation parameters in dairy cows. Animals 2021, 11, 838. [Google Scholar] [CrossRef]
  8. Barnett, M.C.; McFarlane, J.R.; Hegarty, R.S. Low ambient temperature elevates plasma triiodothyronine concentrations while reducing digesta mean retention time and methane yield in sheep. J. Anim. Physiol. Anim. Nutr. 2015, 99, 483–491. [Google Scholar] [CrossRef]
  9. Duarte, A.C.; Holman, D.B.; Alexander, T.W.; Kiri, K.; Breves, G.; Chaves, A.V. Incubation temperature, but not pequi oil supplementation, affects methane production, and the ruminal microbiota in a rumen simulation technique (Rusitec) System. Front. Microbiol. 2017, 8, 1076. [Google Scholar] [CrossRef] [Green Version]
  10. Grossi, S.; Rossi, L.; Dell’Anno, M.; Biffani, S.; Sgoifo Rossi, C.A. Effects of heated drinking water on the growth performance and rumen functionality of fattening charolaise beef cattle in winter. Animals 2021, 11, 2218. [Google Scholar] [CrossRef]
  11. Cantor, M.C.; Costa, J.H.; Bewley, J.M. Impact of observed and controlled water intake on reticulorumen temperature in lactating dairy cattle. Animals 2018, 8, 194. [Google Scholar] [CrossRef] [Green Version]
  12. Petersen, M.K.; Muscha, J.M.; Mulliniks, J.T.; Roberts, A.J. Water temperature impacts water consumption by range cattle in winter. J. Anim. Sci. 2016, 94, 4297–4306. [Google Scholar] [CrossRef] [Green Version]
  13. Kang, H.J.; Piao, M.Y.; Park, S.J.; Na, S.W.; Kim, H.J.; Baik, M. Effects of ambient temperature and rumen-protected fat supplementation on growth performance, rumen fermentation and blood parameters during cold season in Korean cattle steers. Asian-Australas. J. Anim. Sci. 2019, 32, 657–664. [Google Scholar] [CrossRef] [PubMed] [Green Version]
  14. Igoshin, A.; Yudin, N.; Aitnazarov, R.; Yurchenko, A.A.; Larkin, D.M. Whole-genome resequencing points to candidate DNA loci affecting body temperature under cold dtress in Siberian cattle populations. Life 2021, 11, 959. [Google Scholar] [CrossRef] [PubMed]
  15. Guo, H.; Zhou, G.; Tian, G.; Liu, Y.; Dong, N.; Li, L.; Zhang, S.; Chai, H.; Chen, Y.; Yang, Y. Changes in rumen microbiota affect metabolites, immune responses and antioxidant enzyme activities of sheep under cold stimulation. Animals 2021, 11, 712. [Google Scholar] [CrossRef] [PubMed]
  16. Nakamura, S.; Haga, S.S.; Kimura, K.J.; Matsuyama, S.C. Propionate and butyrate induce gene expression of monocarboxylate transporter 4 and cluster of differentiation 147 in cultured rumen epithelial cells derived from preweaning dairy calves. J. Anim. Sci. 2018, 96, 4902–4911. [Google Scholar] [CrossRef]
  17. Liu, Q.; Wang, C.; Guo, G.; Yang, W.Z.; Dong, K.H.; Huang, Y.X.; Yang, X.M.; He, D.C. Effects of calcium propionate on rumen fermentation, urinary excretion of purine derivatives and feed digestibility in steers. J. Agric. Sci. 2009, 147, 201–209. [Google Scholar] [CrossRef]
  18. Menke, K.H.; Raab, L.; Salewski, A.; Steingass, H.; Fritz, D.; Schneider, W. The estimation of the digestibility and metabolizable energy content of ruminant feedingstuffs from the gas production when they are incubated with rumen liquor in vitro. J. Agric. Sci. 1979, 93, 217–222. [Google Scholar] [CrossRef] [Green Version]
  19. Ørskov, E.R.; McDonald, I. The estimation of protein degradability in the rumen from incubation measurements weighted according to rate of passage. J. Agric. Sci. 1979, 92, 499–503. [Google Scholar] [CrossRef] [Green Version]
  20. Broderick, G.A.; Kang, J.H. Automated simultaneous determination of ammonia and total amino acids in ruminal fluid and in vitro media. J. Dairy Sci. 1980, 63, 64–75. [Google Scholar] [CrossRef]
  21. Cole, J.R.; Wang, Q.; Fish, J.A.; Chai, B.; McGarrell, D.M.; Sun, Y.; Brown, C.T.; Porras-Alfaro, A.; Kuske, C.R.; Tiedje, J.M. Ribosomal Database Project: Data and tools for high throughput rRNA analysis. Nucleic Acids Res. 2014, 42, D633–D642. [Google Scholar] [CrossRef] [Green Version]
  22. Mahnert, A.; Moissl-Eichinger, C.; Berg, G. Microbiome interplay: Plants alter microbial abundance and diversity within the built environment. Front. Microbiol. 2015, 6, 887. [Google Scholar] [CrossRef] [PubMed]
  23. Jin, D.; Zhao, S.; Wang, P.; Zheng, N.; Bu, D.; Beckers, Y.; Wang, J. Insights into abundant rumen ureolytic bacterial community using rumen simulation system. Front. Microbiol. 2016, 7, 1006. [Google Scholar] [CrossRef] [PubMed] [Green Version]
  24. Tagliapietra, F.; Cattani, M.; Bailoni, L.; Schiavon, S. In vitro rumen fermentation: Effect of headspace pressure on the gas production kinetics of corn meal and meadow hay. Anim. Feed Sci. Technol. 2010, 158, 197–201. [Google Scholar] [CrossRef]
  25. Cattani, M.; Tagliapietra, F.; Maccarana, L.; Hansen, H.H.; Bailoni, L.; Schiavon, S. Technical note: In vitro total gas and methane production measurements from closed or vented rumen batch culture systems. J. Dairy Sci. 2014, 97, 1736–1741. [Google Scholar] [CrossRef] [Green Version]
  26. Wahrmund, J.L.; Ronchesel, J.R.; Krehbiel, C.R.; Goad, C.L.; Trost, S.M.; Richards, C.J. Ruminal acidosis challenge impact on ruminal temperature in feedlot cattle. J. Anim. Sci. 2012, 90, 2794–2801. [Google Scholar] [CrossRef] [PubMed]
  27. Roger, V.; Fonty, G.; Komisarczuk-Bony, S.; Gouet, P. Effects of physicochemical factors on the adhesion to cellulose avicel of the ruminal bacteria Ruminococcus flavefaciens and Fibrobacter succinogenes subsp. succinogenes. Appl. Environ. Microbiol. 1990, 56, 3081–3087. [Google Scholar] [CrossRef] [Green Version]
  28. Cunningham, M.D.; Martz, F.A.; Merilan, C.P. Effect of drinking-water temperature upon ruminant digestion, intraruminal temperature, and water consumption of nonlactating dairy cows. J. Dairy Sci. 1964, 47, 382–385. [Google Scholar] [CrossRef]
  29. Brod, D.L.; Bolsen, K.K.; Brent, B.E. Effect of water temperature in rumen temperature, digestion and rumen fermentation in sheep. J. Anim. Sci. 1982, 54, 179–182. [Google Scholar] [CrossRef] [Green Version]
  30. Sheperd, A.C.; Combs, D.K. Long-term effects of acetate and propionate on voluntary feed intake by midlactation Cows. J. Dairy Sci. 1998, 81, 2240–2250. [Google Scholar] [CrossRef]
  31. Zhang, F.; Zhao, Y.; Wang, Y.; Wang, H.; Nan, X.; Guo, Y.; Xiong, B. Dietary supplementation with calcium propionate could beneficially alter rectal microbial composition of early lactation dairy cows. Front. Vet. Sci. 2022, 9, 1–13. [Google Scholar] [CrossRef]
  32. Patra, A.K.; Yu, Z. Essential oils affect populations of some rumen bacteria in vitro as revealed by microarray (RumenBactArray) analysis. Front. Microbiol. 2015, 6, 297. [Google Scholar] [CrossRef] [PubMed] [Green Version]
  33. Antanaitis, R.; Anskienė, L.; Rapaliutė, E.; Bilskis, R.; Džermeikaitė, K.; Bačėninaitė, D.; Juškienė, V.; Juška, R.; Meškinytė, E. Relationship between reticulorumen parameters measured in real time and methane emission and heat stress risk in dairy cows. Animals 2022, 12, 3257. [Google Scholar] [CrossRef] [PubMed]
  34. Bhatta, R.; Tajima, K.; Kurihara, M. Influence of temperature and pH on germentation pattern and methane production in the rumen simulating fermenter (RUSITEC). Asian-Australas. J. Anim. Sci. 2006, 19, 376–380. [Google Scholar] [CrossRef]
  35. Wang, M.; Wang, R.; Xie, T.Y.; Janssen, P.H.; Sun, X.Z.; Beauchemin, K.A.; Tan, Z.L.; Gao, M. Shifts in rumen fermentation and microbiota are associated with dissolved ruminal hydrogen concentrations in lactating dairy cows fed different types of carbohydrates. J. Nutr. 2016, 146, 1714–1721. [Google Scholar] [CrossRef] [PubMed] [Green Version]
  36. Hook, S.E.; Wright, A.-D.G.; McBride, B.W. Methanogens: Methane producers of the rumen and mitigation strategies. Archaea 2010, 2010, 945785. [Google Scholar] [CrossRef] [Green Version]
  37. Sun, B.; Wang, X.; Bernstein, S.; Huffman, M.A.; Xia, D.-P.; Gu, Z.; Chen, R.; Sheeran, L.K.; Wagner, R.S.; Li, J. Marked variation between winter and spring gut microbiota in free-ranging Tibetan Macaques (Macaca thibetana). Sci. Rep. 2016, 6, 26035. [Google Scholar] [CrossRef] [Green Version]
  38. Li, A.; Wang, Y.; Li, Z.; Qamar, H.; Mehmood, K.; Zhang, L.; Liu, J.; Zhang, H.; Li, J. Probiotics isolated from yaks improves the growth performance, antioxidant activity, and cytokines related to immunity and inflammation in mice. Microb. Cell Fact. 2019, 18, 112. [Google Scholar] [CrossRef] [Green Version]
  39. Garneau, J.E.; Tremblay, D.M.; Moineau, S. Characterization of 1706, a virulent phage from Lactococcus lactis with similarities to prophages from other Firmicutes. Virology 2008, 373, 298–309. [Google Scholar] [CrossRef] [Green Version]
  40. Mao, S.Y.; Zhang, R.Y.; Wang, D.S.; Zhu, W.Y. Impact of subacute ruminal acidosis (SARA) adaptation on rumen microbiota in dairy cattle using pyrosequencing. Anaerobe 2013, 24, 12–19. [Google Scholar] [CrossRef]
  41. Wetzels, S.U.; Mann, E.; Metzler-Zebeli, B.U.; Wagner, M.; Klevenhusen, F.; Zebeli, Q.; Schmitz-Esser, S. Pyrosequencing reveals shifts in the bacterial epimural community relative to dietary concentrate amount in goats. J. Dairy Sci. 2015, 98, 5572–5587. [Google Scholar] [CrossRef] [Green Version]
  42. Yao, Q.; Li, Y.; Meng, Q.; Zhou, Z. The effect of calcium propionate on the ruminal bacterial community composition in finishing bulls. Asian-Australas. J. Anim. Sci. 2016, 30, 495–504. [Google Scholar] [CrossRef] [PubMed] [Green Version]
  43. Zhang, F.; Wang, Y.; Wang, H.; Nan, X.; Guo, Y.; Xiong, B. Calcium propionate supplementation has minor effects on major ruminal bacterial community composition of early lactation dairy cows. Front. Microbiol. 2022, 13, 847488. [Google Scholar] [CrossRef] [PubMed]
  44. McCann, J.C.; Wiley, L.M.; Forbes, T.D.; Rouquette, F.M.; Tedeschi, L.O. Relationship between the rumen microbiome and residual feed intake-efficiency of brahman bulls stocked on bermudagrass pastures. PLoS ONE 2014, 9, e91864. [Google Scholar] [CrossRef] [PubMed] [Green Version]
  45. Lyu, J.Y.; Yang, Z.T.; Wang, E.D.; Liu, G.K.; Wang, Y.J.; Wang, W.; Li, S.L. Possibility of using by-products with high NDF content to alter the fecal short chain fatty acid profiles, bacterial community, and digestibility of lactating dairy cows. Microorganisms 2022, 10, 1731. [Google Scholar] [CrossRef]
  46. Rathert-Williams, A.R.; McConnell, H.L.; Salisbury, C.M.; Lindholm-Perry, A.K.; Lalman, D.L.; Pezeshki, A.; Foote, A.P. Effects of adding ruminal propionate on dry matter intake and glucose metabolism in steers fed a finishing ration. J. Anim. Sci. 2023, 101, skad072. [Google Scholar] [CrossRef]
  47. Dieho, K.; van Baal, J.; Kruijt, L.; Bannink, A.; Schonewille, J.T.; Carreño, D.; Hendriks, W.H.; Dijkstra, J. Effect of supplemental concentrate during the dry period or early lactation on rumen epithelium gene and protein expression in dairy cattle during the transition period. J. Dairy Sci. 2017, 100, 7227–7245. [Google Scholar] [CrossRef] [PubMed] [Green Version]
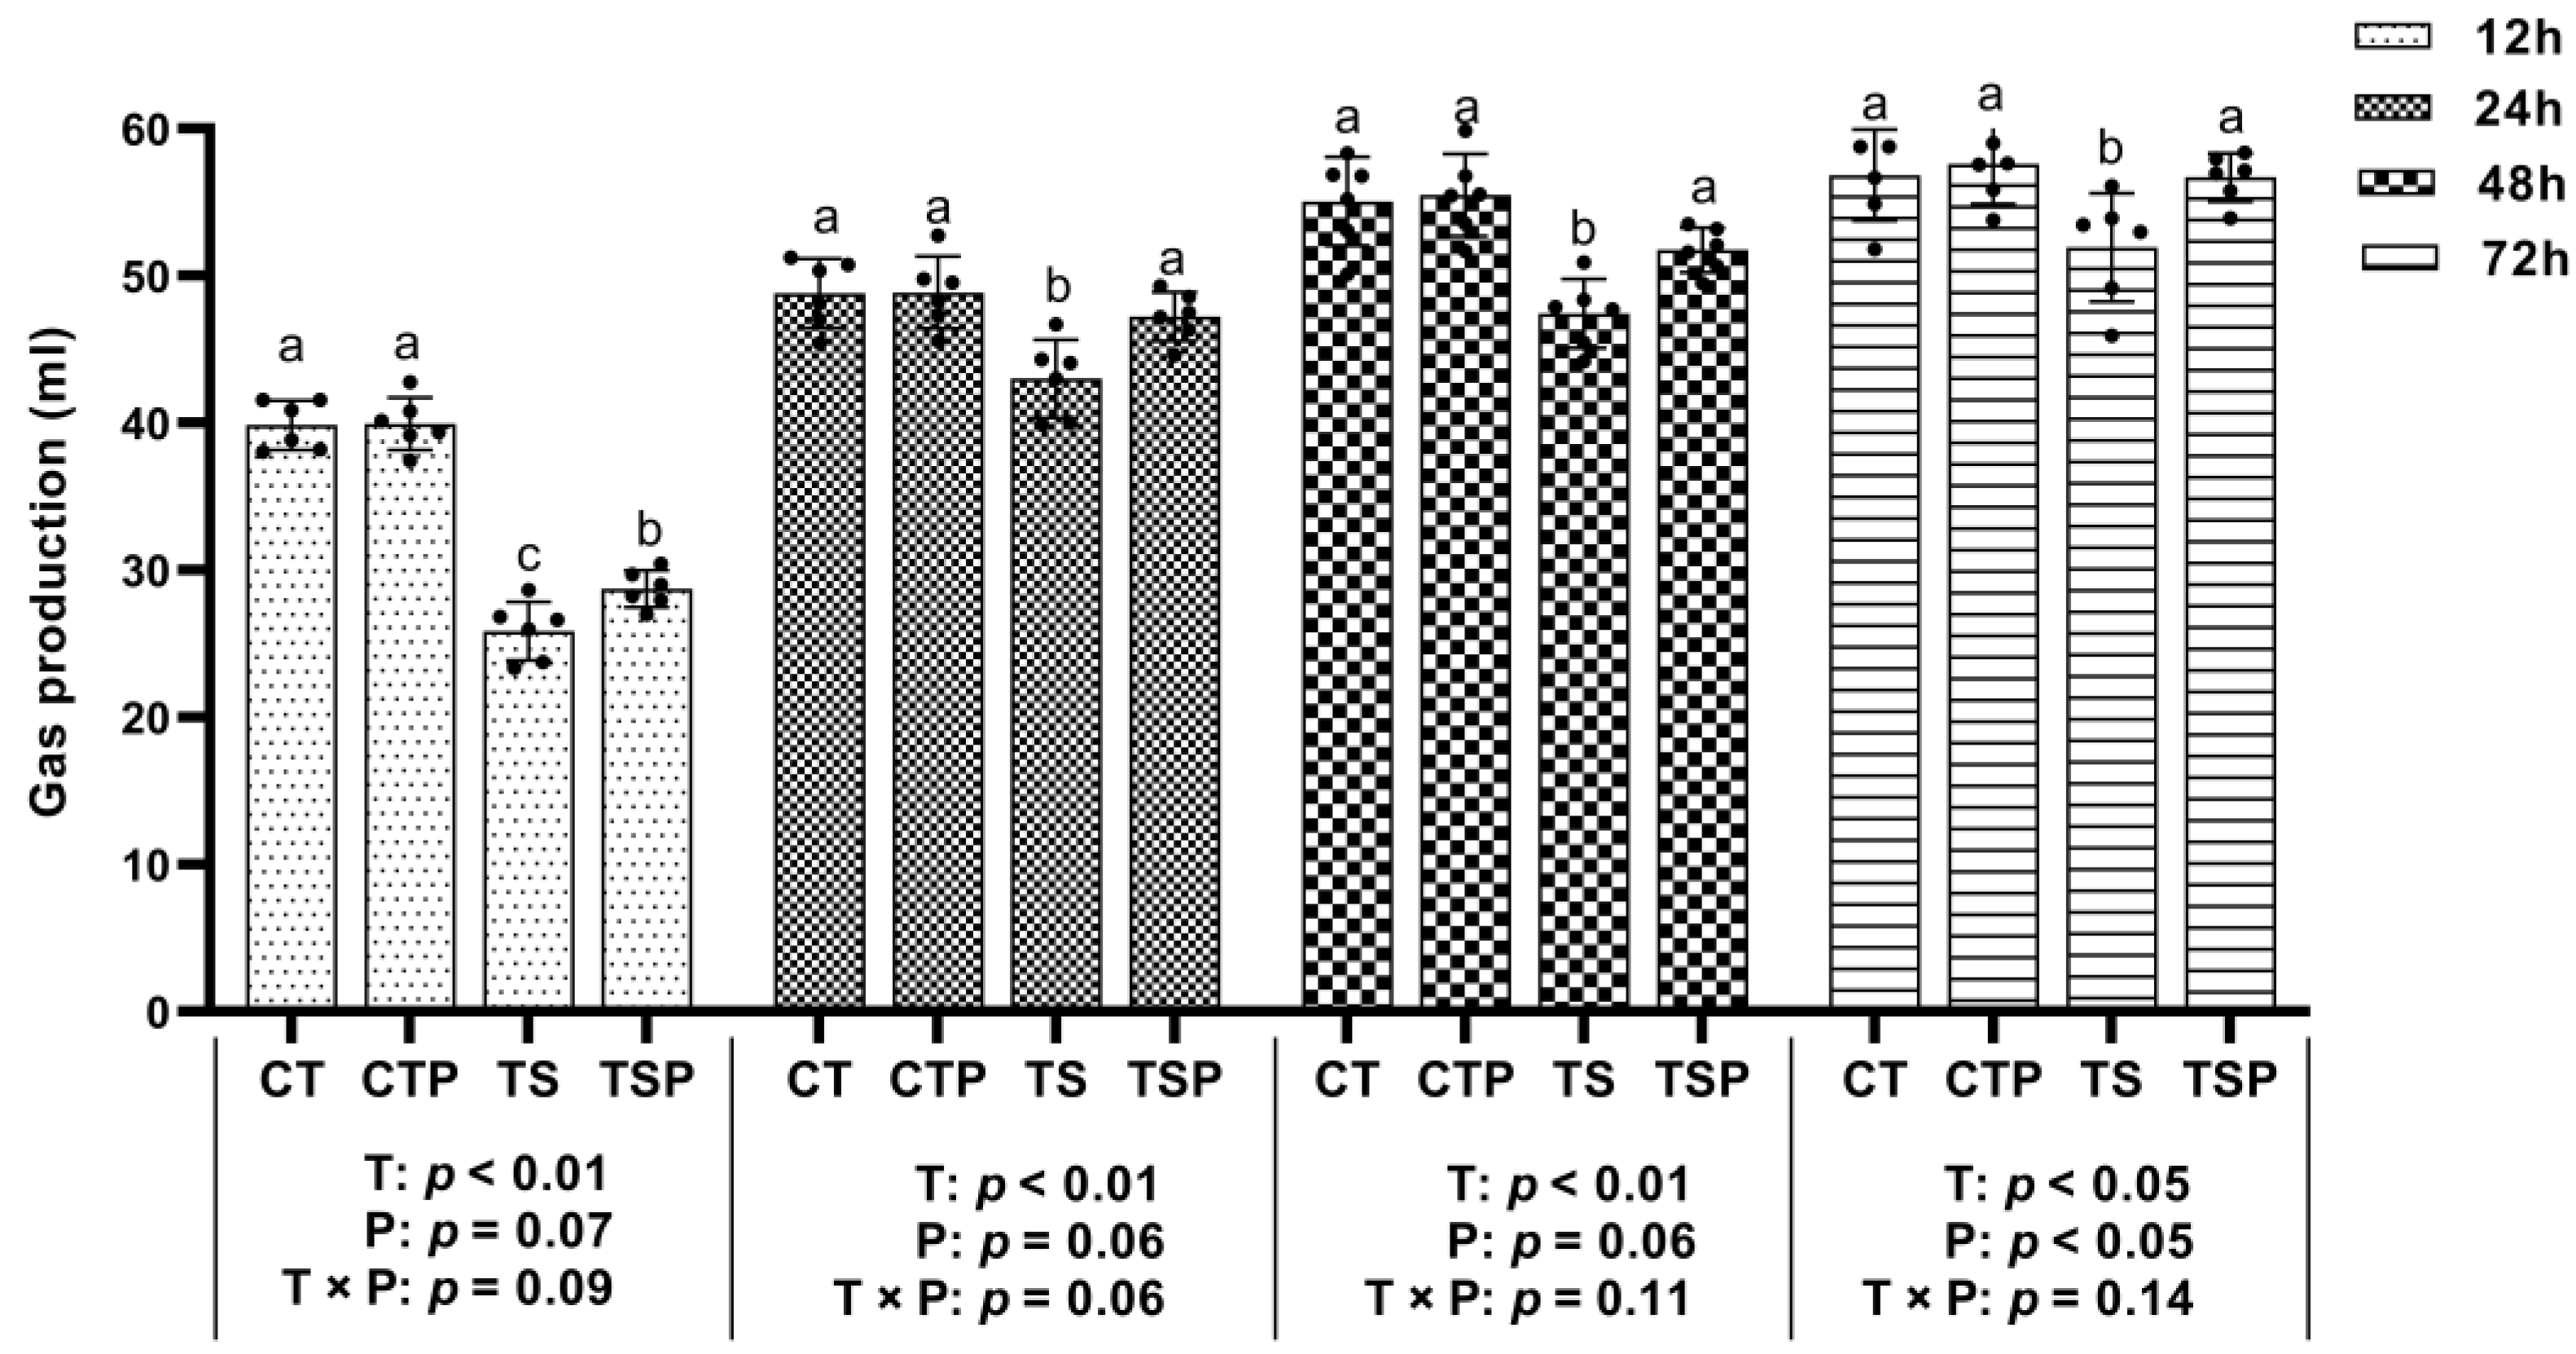
Figure 1. Effects of incubation temperature and calcium propionate (CaP) supplementation on gas production in vitro fermentation of 0.2 g DM substrate at different timestamps. CT: incubated at 39 °C constant temperature; CTP: incubated at 39 °C constant temperature and addition of 2.5% CaP in substrate; TS: incubation temperature shift periodically; TSP: incubation temperature shift periodically and addition of 2.5% CaP in substrate; T: incubation temperature factor; P: CaP factor; T × P: interaction between incubation temperature and CaP factors; a,b,c: Different superscripts mean significant differences in the indicators among groups (p < 0.05).
Fermentation 09 00544 g001
Figure 2. Effects of incubation temperature and calcium propionate supplementation on the asymptotic gas production per 0.2 g DM substrate (A) and the rate of gas production per hour (B) in vitro fermentation. CT: incubated at 39 °C constant temperature; CTP: incubated at 39 °C constant temperature and addition of 2.5% CaP in substrate; TS: incubation temperature shift periodically; TSP: incubation temperature shift periodically and addition of 2.5% CaP in substrate; T: incubation temperature factor; P: CaP factor; T × P: interaction between incubation temperature and CaP factors; a,b: Different superscripts mean significant differences in the indicators among groups (p < 0.05).
Fermentation 09 00544 g002
Figure 3. Effects of incubation temperature and calcium propionate supplementation on CH4 concentration (A), yield (B) and CO2 concentration (C) and yield (D) in vitro fermentation. CT: incubated at 39 °C constant temperature; CTP: incubated at 39 °C constant temperature and addition of 2.5% CaP in substrate; TS: incubation temperature shift periodically; TSP: incubation temperature shift periodically and addition of 2.5% CaP in substrate; T: incubation temperature factor; P: CaP factor; T × P: interaction between incubation temperature and CaP factors; a,b,c: Different superscripts means significant differences in the indicators among groups (p < 0.05).
Fermentation 09 00544 g003
Figure 4. Principal component analysis (PCA) at the OTU level of fermentation liquid bacterial (A) or archaeal (B). Different ellipses indicate different treatments. CT: incubated at 39 °C constant temperature; CTP: incubated at 39 °C constant temperature and addition of 2.5% CaP in substrate; TS: incubation temperature shift periodically; TSP: incubation temperature shift periodically and addition of 2.5% CaP in substrate.
Fermentation 09 00544 g004
Figure 5. Spearman correlation analyses between the relatively abundant bacterial (A) or archaeal (B) genera and ruminal fermentation parameters. The X-axis and Y-axis are environmental factors and species, respectively, and the correlations for the R values and P values are obtained via calculation. R values are displayed in different colors in the figure, and the legend on the right is the color interval of different R values; * p ≤ 0.05, **; p ≤ 0.01, *** p ≤ 0.001. GP-72 h: gas production at 72 h of fermentation; B: asymptotic gas production per 0.2 g DM substrate; A/P: ratio of acetate to propionate concentration; T-VFA: total volatile fatty acids; NH3-N: ammonium nitrogen; pH-72 h: pH value at 72 h of fermentation; CH4-72 h: CH4 production at 72 h of fermentation; CO2-72 h: CO2 production at 72 h of fermentation.
Fermentation 09 00544 g005
Table 1. Composition and nutrient levels of the basal fermentation substrate (%, DM basis).
Ingredient CompositionContent
Corn28.15
Soybean meal8.64
Jujube powder7.64
Corn silage32.96
Corn stalk17.04
Salt1.13
Premix 12.22
Calcium hydrogen phosphate1.10
Sodium bicarbonate1.12
Nutrient composition
DM48.62
EE2.95
Lignin4.16
CP12.05
NDF42.98
ADF23.46
Ca0.53
P0.33
DM: dry matter; EE: ether extract; CP: crude protein; NDF: neutral detergent fiber; ADF: acid detergent fiber; Ca: calcium; P: phosphorus. Premix 1: Fe 12 g/kg, Mn 1 g/kg, Cu 1 g/kg, Zn 11 g/kg, I 30 mg/kg, Se 30 mg/kg, Co 20 mg/kg, Vitamin A 450,000 IU/kg, Vitamin D3 60,000 IU/kg, Vitamin E 2000 mg/kg.
Table 2. Effects of incubation temperature and calcium propionate supplementation on fermentation parameters in vitro.
ItemsCTCTPTSTSPSEMp-Value
TPT × P
pH6.62 b6.68 b6.69 b6.81 a0.030.060.080.13
NH3-N (mmol/L)62.78 a59.16 b51.23 c53.33 c1.08<0.010.490.02
Acetate (mmol/L)74.8376.7370.8574.283.430.360.450.83
Propionate (mmol/L)23.71 a26.55 a17.91 b24.24 a0.98<0.01<0.010.10
Acetate:propionate3.15 ab2.90 b4.04 a3.11 b0.220.020.010.15
Isobutyrate (mmol/L)1.84 a1.68 bc1.56 c1.73 ab0.040.010.90<0.01
Butyrate (mmol/L)15.43 a14.09 a11.43 b14.35 a0.630.010.23<0.01
Iso-valerate (mmol/L)4.69 a4.29 a3.66 b4.27 a0.16<0.010.52<0.01
Valerate (mmol/L)1.97 a1.91 a1.48 b1.90 a0.08<0.010.040.01
Total volatile fatty acid (mmol/L)122 a125 a106 b120 a3.970.020.050.18
CT: incubated at 39 °C constant temperature; CTP: incubated at 39 °C constant temperature and addition of 2.5% CaP in substrate; TS: incubation temperature shift periodically; TSP: incubation temperature shift periodically and addition of 2.5% CaP in substrate; T: incubation temperature factor; P: CaP factor; T × P: interaction between incubation temperature and CaP factors; a,b,c: Different superscripts mean significant differences in the indicators among groups (p < 0.05).
Table 3. Effects of incubation temperature and calcium propionate supplementation on bacteria (A) and archaea (B) α-diversity in vitro.
ItemsCTCTPTSTSPSEMp-Value
TPT × P
Bacterial
Sobs147414861509144432.810.440.910.26
Shannon5.745.715.865.740.050.150.150.36
Simpson0.0130.0110.0100.0100.000.740.320.72
Ace186918491887182134.400.240.890.52
Chao186218341892182035.920.180.940.55
Archaeal
Sobs75.17 a71.17 bc72.00 b68.83 c0.82<0.01<0.010.62
Shannon2.2252.1992.2722.1820.050.290.790.56
Simpson0.2410.2430.2120.2370.020.430.300.49
Ace79.2176.2078.3080.852.070.910.380.20
Chao79.7775.0977.1579.582.350.640.700.15
CT: incubated at 39 °C constant temperature; CTP: incubated at 39 °C constant temperature and addition of 2.5% CaP in substrate; TS: incubation temperature shift periodically; TSP: incubation temperature shift periodically and addition of 2.5% CaP in substrate; T: incubation temperature factor; P: CaP factor; T × P: interaction between incubation temperature and CaP factors; a,b,c: Different superscripts mean significant differences in the indicators among groups (p < 0.05).
Table 4. Effects of incubation temperature and calcium propionate supplementation on microbial relative abundance.
ItemsCTCTPTSTSPSEMp-Value
TPT × P
Phylum level of Bacteria
Firmicutes54.58 a59.72 a45.91 b54.13 a1.789<0.01<0.010.40
Bacteroidota34.82 b33.12 b42.26 a37.94 ab1.548<0.010.070.41
Proteobacteria4.191.305.331.361.6480.720.060.75
Actinobacteriota1.22 b1.58 b1.39 b2.21 a0.2110.080.010.29
Genus level of Bacteria
Rikenellaceae_RC915.2114.4214.8716.821.1060.370.610.24
F0827.77 b7.54 b11.34 a10.77 a0.554<0.010.490.77
Succiniclasticum5.027.044.957.741.5290.840.140.80
Muribaculaceae4.165.774.994.901.1740.990.530.48
NK4A2144.904.944.385.240.3010.730.160.20
Lachnospiraceae_NK3A205.204.634.144.940.3930.350.770.10
Christensenellaceae_R-74.525.153.884.430.4820.180.240.93
Prevotella1.74 b1.08 b3.33 a1.18 b0.4580.09<0.010.13
Bacillus2.293.040.410.150.9690.030.800.61
Bacteroidales_BS111.080.811.030.870.0850.970.030.51
Ruminococcaceae0.80 a0.95 a0.65 b0.66 b0.0760.010.310.36
Prevotellaceae_UCG-0010.59 ab0.52 ab1.03 a0.34 b0.1440.370.020.05
Ruminococcus0.47 b0.52 ab0.48 b0.74 a0.0650.110.040.13
Prevotellaceae_UCG-0030.53 ab0.30 b1.04 a0.37 b0.1760.120.020.23
Prevotellaceae_UCG-0040.540.370.780.390.1110.260.020.33
Butyrivibrio0.340.490.410.500.0910.690.200.77
Lachnospiraceae_UCG-0080.320.490.230.290.070.060.130.47
Phylum level of Archaea
norank_d_Bacteria91.6192.3392.8692.370.4450.170.800.91
Euryarchaeota6.616.215.686.580.4160.510.570.14
unclassified_d_Unclassified1.111.011.010.840.1010.200.230.73
Genus level of Archaea
Bacteria91.6192.3392.8692.370.4450.170.800.20
Methanosphaera3.883.923.765.010.330.160.070.09
Methanobrevibacter1.631.561.591.400.2060.640.530.77
Methanomicrobiales0.81 a0.53 ab0.31 b0.16 b0.108<0.010.060.58
Archaea0.63 a0.41 ab0.41 ab0.19 b0.0950.040.040.99
CT: incubated at 39 °C constant temperature; CTP: incubated at 39 °C constant temperature and addition of 2.5% CaP in substrate; TS: incubation temperature shift periodically; TSP: incubation temperature shift periodically and addition of 2.5% CaP in substrate; T: incubation temperature factor; P: CaP factor; T × P: interaction between incubation temperature and CaP factors; a,b: Different superscripts means significant differences in the indicators among groups (p < 0.05).
Disclaimer/Publisher’s Note: The statements, opinions and data contained in all publications are solely those of the individual author(s) and contributor(s) and not of MDPI and/or the editor(s). MDPI and/or the editor(s) disclaim responsibility for any injury to people or property resulting from any ideas, methods, instructions or products referred to in the content.