Abstract
As one of the most widely used acidic condiments in the world, vinegars have demonstrated physiological functions. Due to their polyphenol content, blueberries (Vaccinium myrtillus L.) are a valuable source of natural flavours and antioxidants for vinegar production. Ultrasound treatment is recognized as an effective technique for improving the extraction yield of bioactive compounds from various plant materials. The aim of this research was to investigate the antioxidant properties of experimental vinegar variants obtained by an innovative manufacturing recipe using an alcoholic substrate containing blueberry juice for a rapid initiation of acetic fermentation. The substrate was subjected to ultrasound treatment at a frequency of 20 kHz and an amplitude (A) of 40%, 60%, and 80% for 3, 4, and 5 min. Under these conditions, total polyphenol content (TPC), total anthocyanins content (TAC), antioxidant activity based on ABTS and DPPH assays, as well as the sensory attributes in blueberry-vinegar formulations, were evaluated. The level of TPC and TAC and the antioxidant activity of the developed vinegar variants were optimized using response surface methodology (RSM). The obtained results revealed that ultrasound treatment resulted in increased TPC and TAC and improved antioxidant properties and sensory characteristics of blueberry vinegar. Our data revealed that the optimum values of the ultrasound treatment parameters were amplitude A: 78.50% and time t: 3.96 min. The following predicted values were determined for the main parameters: TPC: 628.01 mg GAE/L, TAC: 22.79 mg C3G/L, ABTS: 391.7 μmol/100 mL, and DPPH: 229.17 μmol/100 mL. The results of this study recommend the integration of both the use of an alcoholic substrate containing blueberry juice and the application of ultrasound treatment in vinegar production as innovative technological interventions with practical applicability for a rapid initiation of acetic fermentation and for improving the antioxidant properties of blueberry vinegar. In addition, RSM can be considered a valuable tool to optimize the ultrasound treatment’s effect on the antioxidant properties of the vinegar formulations.
1. Introduction
Vinegar is used as a fermented flavouring ingredient and as a special culinary constituent preservative, and also to give flavour to many food products such as salad dressings, mayonnaise, mustard, ketchup, and other food [1]. Due to its vitamins, phenolic compounds, and organic acids in its constitution, vinegar has multiple positive effects on health, especially for appetite stimulation, blood-sugar control, blood-pressure regulation, digestive, antimicrobial, body-weight management, antidiabetic, and lipid metabolism regulation [2,3,4,5].
Fruits such as grapes, apples, bananas, lemons, strawberries, rice, orange, pineapple, mulberry, blueberry, blackberry, or vegetables can be used as raw material for vinegar production all around the world [6]. Vinegars are named according to their raw material origin and uptake the properties of the corresponding raw material [7]. Berry vinegar contains numerous bioactive compounds, including phenolic components. The synergic effect of the acetic acid and these bioactive compounds could give to this product its ability to reduce the availability of carbohydrates, which is good for people with diabetes [8]. Vinegars obtained from fruit juices conserve just a fraction of these health-connected compounds [9].
According to the ‘Global Vinegar Market Report and Forecast 2021–2026’, the global vinegar market reached USD 1.32 billion in 2020. Meanwhile, the global vinegar market it is expected to grow at a Compound Annual Grow Rate (CAGR) of 1.6% between 2021 and 2026. It is expected to grow in the forecast period of 2021–2026 at a CAGR of 1.6% to attain USD 1.43 billion in 2026 [10]. The global vinegar market is led by the rising consumption of food globally. Europe is the largest vinegar market, representing nearly half of the global market. Within Europe, Italy is the leading market for vinegar as well as its major exporter [10,11].
The production of fruit vinegars as a way of making use of fruit byproducts is widely employed by the food industry since it allows them to exploit surplus and low-quality fruits without compromising the quality of the final product. The acetic nature of fruit vinegars and the high sensory impact that this acid produces on the sensorial properties of the product allow almost any type of fruit to be used for its elaboration. Every year, large amounts of fruits are produced and wasted since the excess cannot be consumed or because the fruits are considered of a second- or third-quality category [11].
In line with the Food and Agriculture Organization of the United Nations (FAO) [11], 21.6% of the fruit produced in the world is wasted, starting from the postharvest stage until its distribution. Very often, fruit is rejected simply because of its “imperfect” appearance or inadequate size, even if the fruit is edible. These actions lead to both ecological and economic problems [12]. Considering the functional properties and the perishability of these fruits, the use of such raw material in the production of high-value-added products such as vinegars could be a valuable strategy [13]. Usually, this vinegar is produced from raw materials containing sugar via sequential ethanol and acetic acid fermentations [14,15].
In the last few years, in food production, ultrasonic processing was considered a beneficial method for improving the nutritional properties of products regarding the enhancement of their biologically active compounds level, mostly the phenolic compounds [16]. It was outlined that the use of ultrasonic extraction for vegetable extracts could raise sucrose content, acidity content, phenolic compounds level, and pigmentation of liquid foods [17]. Data reported by other researchers [16,18] demonstrated the increase of the antioxidant potential of different liquid food products, such as tomato juice or cider, after the use of the ultrasound treatment. Currently, the reports of ultrasound treatment effects on the antioxidant potential of vinegars obtained from berry juices are limited, despite its potential.
Response surface methodology (RSM) can reduce workloads and the time consumption of the research work [3,19]. Therefore, RSM was used in this study, being successful in “predicting the model of various process factors in a convenient manner such as food science and engineering, chemical engineering and technology, and environment fields, etc.” [19,20,21].
In this study, an alcoholic substrate containing blueberry juice treated with ultrasound was used to obtain blueberry vinegar. Under these conditions, the intention was to rapidly initiate acetic fermentation. The degree of innovation of this study refers to a new recipe used for obtaining blueberry vinegar and identifying a treatment formula for this product in order to improve the polyphenols and anthocyanins content and the antioxidant properties. Consequently, the goal of this study was to optimize (using RSM) the extraction of polyphenols and anthocyanins, and the antioxidant activity of some vinegar variants obtained from an alcoholic substrate containing blueberry juices treated by ultrasound. Optimization is used in food processes, especially to minimize losses of bioactive ingredients, with RSM being preferred for this purpose. Thus, we aimed to apply the ultrasound treatment for the first time in blueberry-vinegar production by a new method and to optimize the bioactive components (TPC, TAC, DPPH, and ABTS) using RSM.
2. Results and Discussion
The effects of high-power ultrasonic treatment were explored in terms of the content of bioactive compounds such as TPC and TAC, as well as antioxidant activity measured by ABTS and DDPH assays. All the above parameters were studied on blueberry fruits, blueberry juice, juice diluted with water, and blueberry vinegar (B), as well as on the samples subjected to ultrasound treatment at 40, 60, and 80% amplitude for 3, 4, and 5 min, as follows: B403 (A = 40%; t = 3 min), B404 (A = 40%; t = 4 min), B405 (A = 40%; t = 5 min), B603 (A = 60%; t = 3 min), B604 (A = 60%; t = 4 min), B605 (A = 60%; t = 5 min), B803 (A = 80%; t = 3 min), B804 (A = 80%; t = 4 min), and B805 (A = 80%; t = 5 min).
2.1. Analysis of the Raw Material (Blueberry) and Blueberry Juices Obtained
The titratable acidity (TA), pH, and total soluble solids (TSS), expressed in °Brix, of fruit raw material, blueberry juice, and blueberry juice diluted with water are presented in Table 1.

Table 1.
Titratable acidity, pH and total soluble solids of blueberry fruits, blueberry juice, and blueberry juice diluted with water.
According to Saftner et al. [22], for consumption, the blueberries should have TSS values above 10%, total titratable acidity values between 0.3% and 1.3%, pH values from 2.25 to 4.25, and a TSS/TA ratio between 10 and 33. In our case, the titratable acidity varied around the value of 1.29% with a pH of 3.02, which is acceptable for fresh consumption. However, in relation to acidity and TSS/TA ratio, the value is less than 10% and, hence, their destination for the production of vinegars could be of interest for being explored. The results for pH (3.02) and titratable acidity (1.29%) indicated the fruits were quite acidic. Similar values for titratable acidity (1.58%) were reported for blueberries cultivated in Turkey [23]. Likewise, mature blueberries cultivated in Nova Scotia (Canada) were much less acidic than the blueberries used in this work [24]. High values of blueberry acidity were also reported by de Souza et al. [25] and by da Silva Fonseca et al. [13] for blueberries grown in Brazil (2.56% and 2.04%).
The results for total soluble solids content (12.28 °Brix) were similar to that reported by da Silva Fonseca et al. [13] for Brazilian blueberries and by Almenar et al. [26] who found a value of 12.67 °Brix for high bush blueberries (V. corymbosum L.).
Total phenolic content (TPC), total anthocyanin content (TAC), and antioxidant potential, expressed as ABTS and DPPH assay of the berry fruits raw material are presented in Table 2.
Table 2.
Total phenolic content, total anthocyanin content, and antioxidant potential of berry fruits.
Table 3 contains data on the total phenolic content (TPC), total anthocyanin content (TAC), and antioxidant potential of the blueberry juices used in the vinegar manufacturing process.
Table 3.
Total phenolic content, total anthocyanin content, and antioxidant potential of blueberry juices used in the vinegar manufacturing process.
Similar amounts of the total phenolic compounds of the blueberry used in the present study (642.37 mg GAE/100 g) were reported by Bunea et al. [27] for the Bluecrop variety (652.27 mg GAE/100 g) and by da Silva Fonseca et al. [13] when using ethanol as an extraction solvent (697.49 mg GAE/100 g).
The results regarding the total anthocyanins tested in our study for the blueberry (80.28 mg/100 g) were similar to those found by Jacques et al. [28] ranging from 72 to 128 mg/100 g and with those obtained by da Silva Fonseca et al. [13] (88.29 mg/100 g). In the case of the anthocyanins content, the results were much less than those obtained by Bunea et al. [27] for the Romanian blueberry V. corymbosum L. (100.58–163.40 mg/100 g). The content of anthocyanins depends on many factors (growing area, climatic conditions, harvest time, positioning conditions, etc.). These factors may have contributed to the observed differences in anthocyanin content.
Regarding the antioxidant activity of the blueberry tested in this study using an ABTS assay (38.36 μmol TE/g), higher values were found compared to the values reported by Bunea et al. [27] for several blueberry varieties, ranging from 24.33 to 36.46 TE mmol/g.
2.2. Vinegars Variants Obtained (Acidity, TSS)
The average values of vinegar acidity obtained in this study are presented in Figure 1 and varied between 3.597 and 4.307% after 50 days of fermentation. Generally, the acidity values were similar to the data presented by da Silva Fonseca et al. for blueberry vinegars [13]. The maximum value of acetic acid content (4.307%) was obtained for variant B804 (Figure 1).
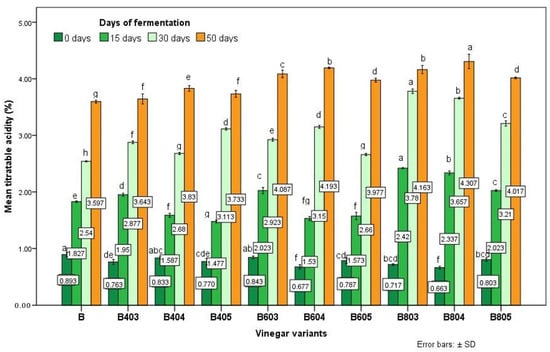
Figure 1.
The average value of acidity (acetic acid %) of the blueberry variants obtained using substrates ultrasounds treated (graph of acetic acid formation in different stages of acetic fermentation). Data were expressed as the average values of 3 determinations ± standard deviation. Values with different letters differ significantly by ANOVA and Duncan’s test (p < 0.05).
According to Tarhon M.C and to Romanian legislation, fruit vinegars must have a minimum acidity of 3.5 g/100 mL acetic acid and can present a maximum residual ethanol content of 1 g/L [29].
The vinegars obtained in this study are in accordance with legislation (Figure 1). The legislation does not establish the maximum value for the acetic acid content of the vinegar, but a vinegar with an acidity exceeding 5.5% can be rejected by consumers [13].
2.3. Total Phenolic Content and Total Antocyanins Content of Blueberry Vvinegars
The average values of total polyphenol content, total anthocyanins content, and antioxidant potential, expressed as ABTS and DPPH assay, of blueberry vinegars obtained using the process described in the chapter material and methods are presented in Table 4.
Table 4.
Average values of the total soluble solids, total polyphenol content, total anthocyanins content, and antioxidant potential of blueberry vinegars.
To understand the influence of ultrasound treatments on the biologically active compounds of blueberry vinegars and to improve the levels of these valuable substances, the response surface methodology (RSM) was used. All polynomial mathematical equations concerning the indicators of the vinegars obtained in this study are given as the results of RSM. Therefore, with the aim to optimize the process for increasing the level of TPC and TAC, the following polynomial model was used:
where X1 indicates the ultrasound amplitude and X2 refers to the time of the treatment.
TPC (mg GAE/L) = 601.81 + 57.73 × X1 + 30.90 × X2 − 28.46 × X12 − 55.83 × X22 + 1.57 × X1 × X2
TAC (mg C3G/L) = 21.08 + 2.55 × X1 − 0.6538 × X2 − 0.7289 × X12 − 1.90 × X22 − 0.1972 × X1 × X2
These models indicate the effect of amplitude and time on the TPC and TAC values in berry vinegar as a result of RSM, using the experimental design presented in Table 5. The TPC values were the highest (643.2 mg GAE/L) for the ultrasound-treated samples using an amplitude of 80% for 4 min. The lowest TPC value was found in the samples treated with an amplitude of 40% for 3 min (441.4 mg GAE/L). Regarding the TAC of the samples, the lowest value was reported at 3 min and with 40% amplitude in sample application 3 (B403) (15.31 mg C3GE/L). The highest TAC value was identified in the variant treated with 80% amplitude for 4 min (23.29 mg C3GE/L) (Table 5).
Table 5.
The measured responses in the experimental design (RSM).
The results regarding the analysis of variance (ANOVA) for the responses in the case of TPC (mg GAE/L) and TAC (mg C3G/L) of the berry vinegar samples at different levels of amplitude and time are presented in Table 6.
Table 6.
Analysis of variance (ANOVA) for the responses regarding vinegars TPC and TAC.
For complying with the level, there was found a quadratic model (R2 = 0.9614 for TPC, respectively, R2 = 0.9889 for TAC). The effect of the amplitude on the TPC and TAC of the samples was statistically significant at p < 0.001.
The change of the TPC and TAC values, depending on the US time and amplitude is presented in Figure 2.
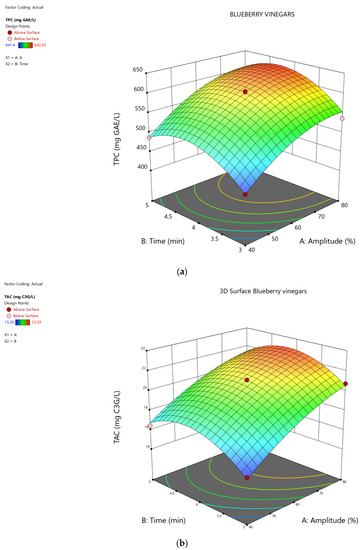
Figure 2.
Response surface showing the effect of time (min) and amplitude (A%) of the ultrasound treatments on bioactive compounds of the blueberry vinegars: (a) TPC (mg GAE/L); (b) TAC (mg C3G/L).
In the optimization model, TPC was determined to be 628.02 mg GAE/L and TAC was found to be 22.79 mg C3G/L, after 3.96 min and 78.50% amplitude treatment (Figure 2), an increase of 45.6% was found for TPC, compared with the untreated control, and, respectively, an increase of 69.3% was identified for the TAC amount value.
Similar results regarding the positive effects of ultrasonic treatments on vinegars TPC were reported by Yikmiș et al. for apple [3] and tomato vinegars [9], by Lieu et al. [17] for grape juice, by Brezan et al. [16] for apple cider, and by Bhat et al. [30] for lime juice.
2.4. Antioxidant Activity of Berry Vinegars
With the aim of optimizing the process to increase the level of ABTS and DPPH, the following polynomial model was used:
where X1 indicates the ultrasound amplitude and X2 refers to the time of the treatment.
ABTS (μmol TE/100 mL) = 363.69 + 55.23 × X1 + 19.25 × X2 − 26.06 × X12 − 28.64 × X22 + 1.01 × X1 × X2
DPPH (μmol TE/100 mL) = 217.1 + 27.68 × X1 + 9.64 × X2 − 14.55 × X12 − 28.41 × X22 + 7.82 × X1 × X2
Table 7 presents the results of the ANOVA analysis for ABTS (μmol TE/100 mL) and DPPH μmol TE/100 mL) values of the berry-vinegar samples. In this study, a quadratic model was used (R2 = 0.8607 for ABTS and R2 = 0.9189 for DPPH) and the values obtained are within the accepted limits.
Table 7.
Analysis of variance (ANOVA) of responses for antioxidant activity (evaluated by DPPH and ABTS assays) of the vinegar samples.
The change of ABTS and DPPH values, depending on the US variables (amplitude and time) is presented in Figure 3.
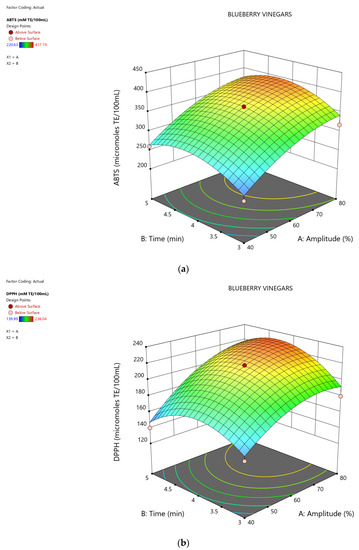
Figure 3.
Response surface showing the effect of time (min) and amplitude (A%) of the ultrasound treatments on the antioxidant potential of the blueberry vinegars: (a) ABTS assay; (b) DPPH assay.
At the end of optimization, ABTS was found to be 363.69 (μmol TE/100 mL) and DPPH respectively 217.102 (μmol TE/100 mL) for 3.96 min treatment at 78.50% amplitude (Figure 4).
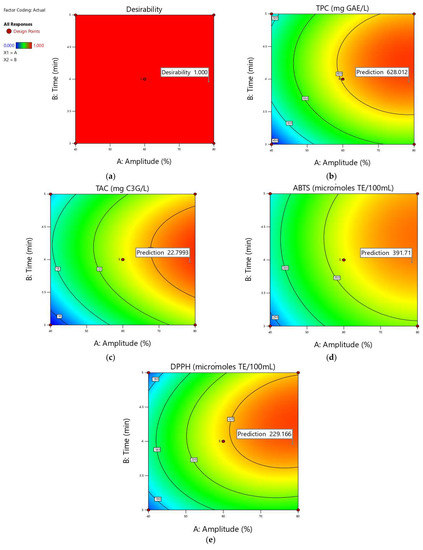
Figure 4.
Contour plots showing the optimum predicted values for all the responses (parameters predicted values for amplitude 78.50% and 3.96 min time period of the US treatment): (a) desirability; (b) predicted value for TPC (612.715; 643.31); (c) predicted value for TAC (22.4769; 23.1216); (d) predicted value for ABTS (366.732; 416.689); (e) predicted value for DPPH (218.104; 240.227).
The lowest DPPH (μmol TE/100 mL) value was determined in the sample treated for 5 min with 40% amplitude, application 13 (139.1 μmol TE/100 mL), while the highest DPPH value was detected in the sample treated with 80% amplitude for 4 min (238.9 μmol TE/100 mL).
The antioxidant activity mentioned in this study is higher than those reported by Arvaniti et al. [31] for commercial and homemade Greek vinegars (from apple cider) and similar to those specified by da Silva Fonseca et al. [13] for the blueberry and honey vinegars obtained using another fermentation process.
As stated by Wang et al. [32], ABTS and DPPH radicals have a different stereo-chemical composition and consequently confer, after interaction with antioxidants, a qualitatively different reaction for radical deactivation. In this context, more than a single assay is needed to provide the amount of information needed to estimate the antioxidant potential.
Figure 4 showed that a satisfactory antioxidant range is likely to be obtained by applying an ultrasound treatment with an amplitude of 78.50% and a period time of 3.96 min and this fact is most likely owing to the high responsiveness of phenolics to these conditions.
2.5. HPLC Analysis of Phenolic Compounds
In this study, four phenolic compounds (ellagic acid, gallic acid, ferulic acid, and chlorogenic acid) were identified in several samples chosen according to the results obtained using the model optimization. The choice of the study of the four hydroxycinnamic acids was made taking into account data from the literature that reported hydroxycinnamic acids (gallic acid and caffeic acid) as the main phenolic compounds in most types of fruit vinegars [33]. Chou et al. [34] highlighted that the number of flavonoids in vinegars is less. The authors reported that only one flavonoid compound (catechin) was detected when 21 flavonoid standards were analyzed. In persimmon vinegar, hydroxycinnamic acids were reported as major compounds [35], while in pomegranate vinegar, the protocatechuic acid (28.88 ± 0.02 mg/L), followed by gallic acid, were the most abundant phenolic compounds detected [36].
The level of these antioxidants in the vinegars obtained using the US treated substrates A 80% and 60% for 4 and 5 min and the untreated substrate are presented in Table 8.
Table 8.
Phenolic compounds in the vinegar samples identified by HPLC.
It can be observed that the level of all phenolics compounds identified by HPLC analysis was the highest in the vinegar sample B804 (ID Table 5). This vinegar sample was obtained using an amplitude of 80% for 4 min and the values of the treatment parameters were very close to those recorded after applying the optimization model (A 78.5%, 3.96 min).
2.6. Sensory Analysis
The results of sensory analysis of blueberry-vinegar samples, based on odour and taste profiles (general impression, pungent sensation, aromatic intensity, taste, and ethyl acetate odour) are presented in Figure 5. Among the judges, there were six experts (three female and three male panellists). The score of the attribute “ethyl acetate odor” is only the score of intensity.
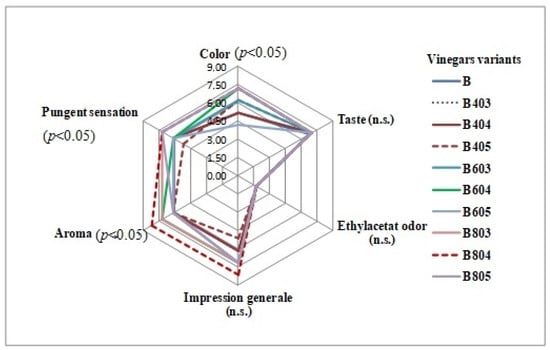
Figure 5.
Results of sensory analysis for blueberry vinegars. ID of the samples were presented in Table 5. There were significant differences between samples at p < 0.05 and n.s., no statistical difference.
Sensory analysis of the vinegar variants evaluated revealed no abnormal odours. It was observed that there was no statistically significant difference between all samples in the case of the vinegars taste. The intensely sour taste of vinegar led to similar results, with the scores given by the tasters being close (there were no significant differences in taste).
The B804 (ID Table 5) sample was the most preferred sample regarding the evaluation of colour (8.27), aromatic intensity (8.18), pungent sensation (7.07), and general evaluation of impression (8.18) (p < 0.05).
The evaluation of the panellists highlights that the samples obtained using ultrasound-treated substrates were generally more liked compared with the sample control (B). Similar data were reported by Yikmuș et al. [4] for US-treated juice vinegars, products generally admired by the panellists. Other researchers reported also an improvement in the sensory evaluations because of the ultrasound treatments used in the processing of various fruit juices [37].
3. Materials and Methods
3.1. Materials, Reagents
Folin–Ciocalteu reagent, was acquired from Sigma-Aldrich (St. Louis, MI, USA). DPPH (cat. no. D9132, purity 97%) and ABTS (cat. no. A1888, purity 98.6%) were acquired from Sigma-Aldrich (St. Louis, MO, USA). Cyanidin 3 glycoside and gallic acid were acquired from Karl Roth GmbH (Karlsruhe, Germany). Hydrochloric acid, sodium acetate, sodium carbonate, and sodium hydroxide were acquired from POCH BBASIC (Glivice, Poland). Trolox were acquired from Sigma-Aldrich (St. Louis, MO, USA).
Wild blueberry fruits (Vaccinium myrtillus L., Wild), sold at a local fruit market, were used as raw materials. The berries were harvested in August from a hilly area situated in Northeast Romania 45°43′18″ N 26°20′15″ E (Comandau, Covasna County, Romania).
3.2. Production of Berry-Vinegar Variants
Fresh blueberries were sorted, mechanically crushed (with a beater), and the berry juice was obtained under laboratory conditions using a Bosch MES3500 (700 W) centrifugal juice extractor (Bosch GmbH, Stuttgart, Germany) following a procedure typically applied at home scale.
The clear blueberry juice obtained was used for the production of vinegar according to the technological flow chart shown in Figure 6 but the method used was not the traditional one. We have tried a new method, our intention being the faster initiation of acetic fermentation, the use of treatments leading to the accentuation of the functional valences of the finished product, and the identification of the optimal parameters of these treatments in order to obtain vinegar with improved antioxidant properties.
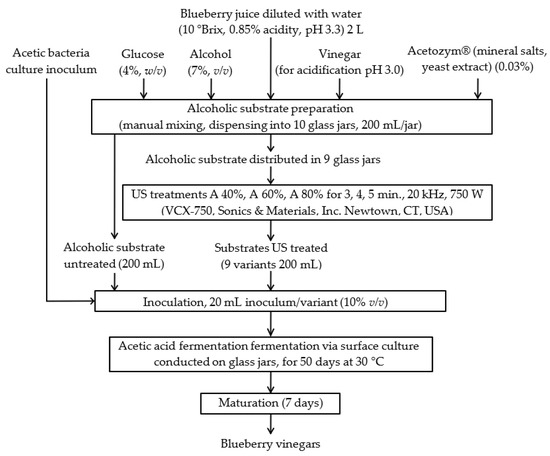
Figure 6.
The method used for obtaining blueberry vinegar (US = ultrasound).
First, the berry juices were diluted with water in order to obtain substrates having total soluble substances of 10 °Brix. After that, these substrates were mixed with ethanol (7%, v/v), glucose (4%, w/v), and apple vinegar (10%, v/v) for acidification. A commercial mineral-salts blend (0.03%, w/v; Acetozym® (Heinrich Frings GmbH & Co. KG, Rheinbach, Germany ) was used to supplement the substrates. After the ultrasound treatments, this substrate having enough alcohol for the acetic fermentation was inoculated (in ratio 10%, v/v) with a culture of acetic bacteria prepared according to da Cunha et al. [1] and da Silva Fonseca [13]. A volume of 200 mL ultrasound-treated substrate was transferred to a 0.5 L capacity glass jar and inoculated with 20 mL acetic bacteria culture inoculum. The acetic bacteria culture and the inoculum were prepared according to da Cunha et al. [1]. The acetic acid bacteria were isolated from red grape (Vitis vinifera L.) vinegar produced in the faculty laboratory, by cultivating nonpasteurized vinegar in a GY medium (100 g/L glucose, 10 g/L yeast extract, and 100 mg/L natamycin). For obtaining the inoculum, in 500 mL Erlenmeyer flasks there were mixed the acetic bacteria culture (25 mL) with blueberry wine (150 mL), the dilution of the bacterial culture being 1:7. The flasks were incubated at 30 °C for 24 h in an orbital shaker rotating at 120 rpm for growth and cell adaptation and then added to the alcoholic substrates.
The fermentation temperature was set at 30 °C. During the process were determined the acidity (% acetic acid) and the pH values. The fermentation process was stopped when the acetic acid content was stable for a period of 7 days and until the alcohol content was between 0.5% and 1%. The acetic fermentation experiments were completed in 50 days after the inoculation. As a control (B sample), it used the untreated berry vinegar. Vinegar samples were stored at 4 °C.
3.3. Titratable Acidity, pH, and Total Soluble Solids
The pH, titratable acidity (% acetic acid), and total soluble solids values were determined for the substrates (before fermentation) and for the vinegar samples. The pH was measured using a pH meter (Consort C5020T, Consort, Turnhout, Belgium), the acidity (% acetic acid) was determined by titration with a solution of 1N NaOH in the presence of phenolphthalein as an indicator and the total soluble solids content (TSS, °Brix) was analysed using a refractometer (OE Germany/OE Swiss/MASS) at room temperature.
3.4. Ultrasound (US) Treatments
The substrates were ultrasonically treated (VCX-750, Sonics & Materials, Inc., Newtown, CT, USA) using a continuous frequency of 20 kHz, an amplitude A of 40%, 60%, and 80%, and a power of 750 W for periods of 3, 4, and 5 min for samples of 19 mm and 500 mL as a mixture [16].
3.5. Factorial Experimental Design
The berry vinegars’ parameters were analyzed using Minitab Statistical Analysis Software (Minitab18.1.1) and response surface methodology (RSM) was employed in order to optimize the ultrasound treatment’s effect on the antioxidant properties of the products. Table 5 presents the test applications (ID samples) used for optimization.
The response surface method (RSM) was used to understand the effect of ultrasound treatment of blueberry vinegar on bioactive components. Central composite design (CCD) was chosen for RSM. Two factors and 3 levels were determined in the design. There were 13 trial points for RSM optimization. Model adequacy, R2 and corrected R2 coefficients, lack-of-fit tests, and ANOVA results were evaluated. The independent variables were duration (X1) and amplitude (X2). Dependent variables were total phenolic content (TPC), total anthocyanins content (TAC), and total antioxidants (DPPH and ABTS). MINITAB statistical software (Minitab 18.1, Minitab, Inc., State College, PA, USA, 2017) was used for RSM and its graphs were developed with SigmaPlot 12.0 Statistical Analysis Software (Systat Software, Inc., San Jose, CA, USA). A polynomial was used to create model equations.
3.6. Total Phenolic Content (TPC) and Total Monomeric Anthocyanins Content (TAC)
Total phenolic content (TPC) of the samples was analyzed by the Folin–Ciocalteu method [38] using a plate reader spectrophotometer (Tecan, SunRiseTM, software MagellanTM, Männedorf, Switzerland). The TPC was calculated as milligrams of gallic acid equivalents (GAE) per litre (L) and per 100 g dry weight (DW).
Total anthocyanins monomers were determined using the differential pH method and the absorbance was measured by the use of a spectrophotometer DR2800 type (Hach Lange, Loveland, CO, USA) [39]. The results were reported as mg cyanidin 3 glycoside (C3G) per litre of vinegar, respectively, per 100 g DW.
3.7. Antioxidant Activity
The antioxidant activity was determined by two different methods, respectively, ABTS and DPPH assays.
3.7.1. ABTS Assay
The antioxidant potential of vinegar variants in reaction with ABTS (2,2′-azino-bis (3-ethylbenzothiazoline-6-sulphonic acid) radical (ABTS +) was determined by referring to a method related by Re et al. [40]. Trolox standards were applied to generate the calibration curve. Results were reported in μmol Trolox Equivalents per 100 mL of vinegar (μmol TE/100 mL) and per g dry weight (μmol TE/g DW).
3.7.2. DPPH Assay
The 2,2-diphenyl-1-picrylhydrazyl (DPPH) assay was formulated by a method described by Kumaran et al. [41]. Absorbance was analyzed at 517 nm (spectrophotometer DR2800, Hach Lange, Loveland, USA) considering the methanol as a witness sample. The antioxidant activity of the samples against DPPH radicals was expressed as micromoles of Trolox equivalents per 100 mL of vinegar (μmol TE/100 mL) and per g dry weight (μmol TE/g DW) using a calibration curve previously created.
3.8. Polyphenols Profiles by HPLC Analysis
The polyphenolic compounds profile was determined by high-performance liquid chromatography (HPLC) according to the method described by Abdel-Hameed et al. [42]. Separations were performed using an Agilent Technologies 1200 chromatograph equipped with a UV-DAD detector, using a 250 mm × 4 mm Licrocart (Licrospher PR-18 5 μm) column (Merck, Darmstadt, Germany) operated at 30 °C. All recorded data were processed using Agilent Chem Station B.04.03 software (Agilent, Santa Clara, USA). The mobile phase consisted of water/acetic acid (97:3, v/v) (eluent A) and acetonitrile (eluent B) at the flow rate of 1 mL/min. The linear gradient profile was as follows: 97% A (0 min), 97–91% A (5 min), 91–84% A (5–15 min), 84–65% A (15–20.8 min), 65–64.5% A (20.8–36 min), 64.5–50% A (36–37 min), 50% A (37–38 min), 50–97% A (38–39 min), and 97% A (42 min). The injection volume was 20 μL.
3.9. Sensory Analysis
The overall acceptability of the vinegar samples was evaluated by considering odor and taste profiles (general impression, pungent sensation, aromatic intensity, taste, and ethyl acetate odor). Twelve female and ten male panellists participated in the vinegar samples evaluation. Each sample was dosed in glass containers 20 ± 1 g and placed at 4–6 °C until serving. For performing the analysis, a 9–point hedonic scale was used. Scale scores were the following: excellent, 9; very good, 8; good, 7; acceptable, 6; and poor, <6.
3.10. Statistical Analysis
In order to optimize the antioxidant potential of blueberry vinegar, the RSM (Minitab 18.1, Minitab, Inc.) was used. There were obtained three-dimensional graphs (Sigma Plot 12.0 Statistical Analysis Software, Systat Software, Inc.). Samples were prepared in triplicate.
4. Conclusions
This study provides strong evidence for the integration of ultrasound treatment of alcoholic substrate containing blueberry juices as an effective step in vinegar production to increase the extraction of bioactive compounds and, consequently, to enhance the antioxidant properties of the resulting products. The added value of this study consists both in the use of a new recipe to obtain blueberry vinegar, using an alcoholic substrate containing fruit juice and in the optimization, based on the response surface methodology, of the extraction process of antioxidant compounds from blueberry. The obtained data proved that the blueberry vinegars ultrasound-treated and optimized were of superior quality in relation to the polyphenols and anthocyanins content having, at the same time, better antioxidant properties. For the optimum values of all these parameters, the better values found for US amplitude and duration were 78.50% and 3.95 min, respectively. The sensory analysis of blueberry-vinegar variants revealed that the samples obtained using ultrasound-treated substrates were generally more liked compared with the control sample. The vinegar sample obtained following ultrasound treatment at 80% amplitude for 4 min, which showed the highest TPC and TAC levels and the strongest antioxidant properties assessed by the DPPH and ABTS tests, was the most preferred sample in terms of colour, aromatic intensity, pungent sensation, and overall impression. Blueberry vinegars obtained by ultrasound treatment of the raw material are a good source of polyphenolic compounds that contribute to the daily intake of antioxidants. We plan to extend the research for a more indepth analysis of polyphenolic compounds in blueberry-vinegar variants obtained using ultrasound treatments. Our results highlight that the use of an ultrasonically treated alcoholic substrate represents innovative items with practical applicability for a rapid start of acetic fermentation and for improving the antioxidant properties of blueberry vinegar.
Limitations of this study could be due to the experimental design with only three levels of variable design (multivariate). Therefore, future approaches are considered to improve the design in order to meet the optimal condition for obtaining the best blueberry-vinegar variant with a high level of valuable bioactive compounds. In addition, any study on the antioxidant and TPC potential of blueberry vinegars should take into account the structure of the antioxidants, their contribution, raw material, technology, and the ageing process. In light of this approach, we intend to continue research on blueberry vinegars as products with a promising antioxidant potential and multiple benefits for human health.
Author Contributions
Conceptualization, C.P., V.P. and M.-A.P.; methodology, C.P. and V.P.; software, A.M.; validation, F.M., E.A., M.-A.P. and M.I.L.; formal analysis, M.-A.P., C.M.C., O.-C.B., G.R.B. and C.L.B.; investigation, C.P., A.M., M.I.L., M.-A.P., C.M.C., G.R.B. and A.N.; resources, M.I.L. and A.N.; data curation C.P., M.I.L., G.R.B. and C.M.C.; writing—original draft preparation, C.P., V.P., M.-A.P. and C.L.B.; writing—review and editing, C.P., C.L.B., F.M., E.A. and M.-A.P.; visualization, V.P.; supervision, C.P., E.A., M.-A.P. and V.P. All authors have read and agreed to the published version of the manuscript.
Funding
This research received no external funding.
Institutional Review Board Statement
Not applicable.
Informed Consent Statement
Not applicable.
Data Availability Statement
All related data and methods are presented in this paper. Additional inquiries should be addressed to the corresponding authors.
Acknowledgments
The authors acknowledge the technical support provided by the Transilvania University of Brasov, Faculty of Food and Tourism and the Interdisciplinary Research Platform belonging to the University of Life Sciences “King Michael I” from Timisoara. The HPLC analysis was carried out at the Research Centre for Studies of Food Quality and Agricultural Products part of the University of Agronomic Sciences and Veterinary Medicine of Bucharest, where the analyses were performed.
Conflicts of Interest
The authors declare no conflict of interest.
References
- Da Cunha, M.A.A.; De Lima, K.P.; Santos, V.A.Q.; Heinz, O.L.; Schmidt, C.A.P. Blackberry Vinegar Produced by Successive Acetification Cycles: Production, Characterization And Bioactivity Parameters. Braz. Arch. Biol. Technol. 2016, 59, 1–10. [Google Scholar] [CrossRef]
- Chen, H.; Chen, T.; Giudici, P.; Chen, F. Vinegar Functions on Health: Constituents, Sources, and Formation Mechanisms. Compr. Rev. Food Sci. Food Saf. 2016, 15, 1124–1138. [Google Scholar] [CrossRef]
- Yıkmış, S. Optimization of Uruset Apple Vinegar Production Using Response Surface Methodology for the Enhanced Extraction of Bioactive Substances. Foods 2019, 8, 107. [Google Scholar] [CrossRef] [PubMed]
- Yıkmış, S.; Bozgeyik, E.; Şimşek, M.A. Ultrasound processing of verjuice (unripe grape juice) vinegar: Effect on bioactive compounds, sensory properties, microbiological quality and anticarcinogenic activity. J. Food Sci. Technol. 2020, 57, 3445–3456. [Google Scholar] [CrossRef]
- Liu, Q.; Tang, G.-Y.; Zhao, C.-N.; Gan, R.-Y.; Li, H.-B. Antioxidant activities, phenolic profiles, and organic acid contents of fruit vinegars. Antioxidants 2019, 8, 78. [Google Scholar] [CrossRef]
- Solieri, L.; Giudici, P. Vinegars of the World. In Vinegars of the World, 1st ed.; Solieri, P., Giudici, L., Eds.; Springer: Milan, Italy, 2009; pp. 1–16. [Google Scholar]
- Catsberg, C.M.E.; Dommelen, G.J.M.K.-V. Vinegar. In Food Handbook; Springer: Dordrecht, The Netherlands, 1990; pp. 360–362. [Google Scholar]
- Driss, O. The Nutritional and Antioxidant Potential of Artisanal and Industrial Apple Vinegars and Their Ability to Inhibit Key Enzymes Related to Type 2 Diabetes In Vitro. Molecules 2022, 27, 567. [Google Scholar]
- Yıkmış, S.; Aksu, F.; Altunatmaz, S.S.; Çöl, B.G. Ultrasound processing of vinegar: Modelling the impact on bioactives and other quality factors. Foods 2021, 10, 1703. [Google Scholar] [CrossRef] [PubMed]
- Expert Market Research. Available online: https://www.expertmarketresearch.com/reports/vinegar-market (accessed on 9 January 2023).
- The State of Food and Agriculture 2019. Moving Fordward on Food Loss and Waste Reduction. Available online: https://scholar.google.com/scholar_lookup?title=The+State+of+Food+and+Agriculture+2019:+Moving+Fordward+on+Food+Loss+and+Waste+Reduction&author=Food+and+Agriculture+Organization&publication_year=2019 (accessed on 15 January 2023).
- Luzón-Quintana, L.M.; Castro, R.; Durán-Guerrero, E. Biotechnological processes in fruit vinegar production. Foods 2021, 10, 945. [Google Scholar] [CrossRef]
- Da Silva Fonseca, M.; Santos, V.A.Q.; Calegari, G.C.; Dekker, R.F.H.; De Melo Barbosa-Dekker, A.; Da Cunha, M.A.A. Blueberry and honey vinegar: Successive batch production, antioxidant potential and antimicrobial ability. Braz. J. Food Technol. 2018, 21. [Google Scholar] [CrossRef]
- Ho, C.W.; Lazim, A.M.; Fazry, S.; Zaki, U.K.H.H.; Lim, S.J. Varieties, production, composition and health benefits of vinegars. A review. Food Chem. 2017, 221, 1621–1630. [Google Scholar] [CrossRef]
- Trček, J.; Mahnič, A.; Rupnik, M. Diversity of the microbiota involved in wine and organic apple cider submerged vinegar production as revealed by DHPLC analysis and next-generation sequencing. Int. J. Food Microbiol. 2016, 223, 57–62. [Google Scholar] [CrossRef] [PubMed]
- Brezan, B.; Badarau, C.; Woinaroschy, A. Effects of Blueberry and Black Carrot Extracts Addition on Antioxidant Properties and Protein-Precipitating Capacity of Ultrasound-Treated Cider. Processes 2020, 8, 812. [Google Scholar] [CrossRef]
- Lieu, L.N.; Le, V.V.M. Application of ultrasound in grape mash treatment in juice processing. Ultrason. Sonochem. 2010, 17, 273–279. [Google Scholar] [CrossRef] [PubMed]
- Wen, C.; Zhang, J.; Zhang, H.; Dzah, C.S.; Zandile, M.; Duan, Y.; Ma, H.; Luo, X. Advances in ultrasound assisted extraction of bioactive compounds from cash crops. A review. Ultrason. Sonochem. 2018, 48, 538–549. [Google Scholar] [CrossRef]
- Xu, J.; Yang, H.; Zhang, C.; Liu, C. Optimised preparation and characterisation of lotus root starch oxidised with sodium hypochlorite (NaOCl) using response surface methodology. Czech J. Food Sci. 2022, 40, 61–68. [Google Scholar] [CrossRef]
- Xu, F.; Wang, B.; Hong, C.; Telebielaigen, S.; Nsor-Atindana, J.; Duan, Y.; Zhong, F. Optimization of spiral continuous flow-through pulse light sterilization for Escherichia coli in red grape juice by response surface methodology. Food Control 2019, 105, 8–12. [Google Scholar] [CrossRef]
- Zhang, X.; Zuo, Z.; Yu, P.; Li, T.; Guang, M.; Chen, Z.; Wang, L. Rice peptide nanoparticle as a bifunctional food-grade Pickering stabilizer prepared by ultrasonication: Structural characteristics, antioxidant activity, and emulsifying properties. Food Chem. 2021, 343, 128545. [Google Scholar] [CrossRef]
- Saftner, R.; Polashock, J.; Ehlenfeldt, M.; Vinyard, B. Instrumental and sensory quality characteristics of blueberry fruit from twelve cultivars. Postharvest Biol. Technol. 2008, 49, 19–26. [Google Scholar] [CrossRef]
- Colak, N.; Torun, H.; Gruz, J.; Strnad, M.; Subrtova, M.; Inceer, H.; Ayaz, F.A. Comparison of Phenolics and Phenolic Acid Profiles in Conjunction with Oxygen Radical Absorbing Capacity (ORAC) in Berries of Vaccinium arctostaphylos L. and V. myrtillus L. Polish J. Food Nutr. 2016, 66, 85–91. [Google Scholar] [CrossRef]
- Gibson, L.; Rupasinghe, H.P.V.; Forney, C.F.; Eaton, L. Characterization of Changes in Polyphenols, Antioxidant Capacity and Physico-Chemical Parameters during Lowbush Blueberry Fruit Ripening. Antioxidants 2013, 2, 216–229. [Google Scholar] [CrossRef]
- de Souza, V.R.; Pereira, P.A.; da Silva, T.L.; de Oliveira Lima, L.C.; Pio, R.; Queiroz, F. Determination of the bioactive compounds, antioxidant activity and chemical composition of Brazilian blackberry, red raspberry, strawberry, blueberry and sweet cherry fruits. Food Chem. 2014, 156, 362–368. [Google Scholar] [CrossRef] [PubMed]
- Almenar, E.; Samsudin, H.; Auras, R.; Harte, B.; Rubino, M. Postharvest shelf life extension of blueberries using a biodegradable package. Food Chem. 2008, 110, 120–127. [Google Scholar] [CrossRef] [PubMed]
- Bunea, A.; Rugina, O.D.; Pintea, A.M.; Sconţa, Z.; Bunea, C.I.; Socaciu, C. Comparative Polyphenolic Content and Antioxidant Activities of Some Wild and Cultivated Blueberries from Romania. Not. Bot. Horti Agrobot. Cluj-Napoca 2011, 39, 70–76. [Google Scholar] [CrossRef]
- Jacques, A.C.; Pertuzatti, P.B.; Barcia, M.T.; Zambiazi, R. Nota científica: Compostos bioativos em pequenas frutas cultivadas na região sul do Estado do Rio Grande do Sul. Braz. J. Food Technol. 2009, 12, 123–127. [Google Scholar] [CrossRef]
- Tarhon, M.C. Tehnologia Fabricării Oțetului; Fundației Universitare “Dunărea de Jos”: Galați, Romania, 2006. [Google Scholar]
- Bhat, R.; Shuaidda, N.; Min-Tze, L.; Karim, A.A. Sonication improves kasturi lime (Citrus microcarpa) juice quality. Ultrason. Sonochem. 2011, 18, 1295–1300. [Google Scholar] [CrossRef] [PubMed]
- Arvaniti, O.S.; Mitsonis, P.; Siorokos, I.; Dermishaj, E.; Samaras, Y. The physicochemical properties and antioxidant capacities of commercial and Homemade Greek Vinegars. Acta Sci. Pol. Technol. Aliment. 2019, 18, 225–234. [Google Scholar]
- Wang, C.C.; Chu, C.Y.; Chu, K.O.; Choy, K.W.; Khaw, K.S.; Rogers, M.S.; Pang, C.P. Trolox-equivalent antioxidant capacity assay versus oxygen radical absorbance capacity assay in plasma. Clin. Chem. 2004, 50, 952–954. [Google Scholar] [CrossRef]
- Xia, T.; Zhang, B.; Duan, W.; Zhang, J.; Wang, M. Nutrients and bioactive components from vinegar: A fermented and functional food. J. Funct. Foods 2020, 64, 103681. [Google Scholar] [CrossRef]
- Chou, C.H.; Liu, C.W.; Yang, D.J.; Wu, Y.H.; Chen, Y.C. Amino acid, mineral, and polyphenolic profiles of black vinegar, and its lipid lowering and antioxidant effects in vivo. Food Chem. 2015, 168, 63–69. [Google Scholar] [CrossRef]
- Zou, B.; Xiao, G.; Xu, Y.; Wu, J.; Yu, Y.; Fu, M. Persimmon vinegar polyphenols protect against hydrogen peroxide-induced cellular oxidative stress via Nrf2 signalling pathway. Food Chem. 2018, 255, 23–30. [Google Scholar] [CrossRef]
- Kharchoufi, S.; Gomez, J.; Lasanta, C.; Castro, R.; Sainz, F.; Hamdi, M. Benchmarking laboratory-scale pomegranate vinegar against commercial wine vinegars: Antioxidant activity and chemical composition. J. Sci. Food Agric. 2018, 98, 4749–4758. [Google Scholar] [CrossRef] [PubMed]
- Jambrack, A.R.; Šimunek, M.; Petrovic, M.; Bedic, H.; Herceg, Z.; Juretic, H. Aromatic profile and sensory characterisation of ultrasound treated cranberry juice and nectar. Ultrason. Sonochem. 2017, 38, 783–793. [Google Scholar] [CrossRef] [PubMed]
- Singleton, V.L.; Orthofer, R.; Lamuela-Raventos, R.M. Analysis of total phenols and other oxidation substrates and antioxidants by means of Folin-Ciocalteu reagent. Meth. Enzym. 1999, 299, 152–178. [Google Scholar]
- Wang, H.; Guo, X.; Hu, X.; Li, T.; Fu, X.; Liu, R.H. Comparison of phytochemical profiles, antioxidant and cellular antioxidant activities of different varieties of blueberry (Vaccinium spp.). Food Chem. 2017, 217, 773–781. [Google Scholar] [CrossRef] [PubMed]
- Re, R.; Nicoletta, P.; Anna, P.; Ananth, P.; Min, Y.; Catherine, R.-E. Antioxidant activity applying an improved ABTS radical cation decolorization assay. Free Radic. Biol. Med. 1999, 26, 1231–1237. [Google Scholar] [CrossRef] [PubMed]
- Kumaran, A.; Karunakaran, R.J. Antioxidant and free radical scavenging activity of an aqueous extract of Coleus aromaticus. Food Chem. 2006, 97, 109–114. [Google Scholar] [CrossRef]
- Abdel-Hameed, E.-S.S.; Bazaid, S.A.; Salman, M.S. Characterization of the Phytochemical Constituents of Taif Rose and Its Antioxidant and Anticancer Activities. BioMed Res. Int. 2013, 2013, 345465. [Google Scholar] [CrossRef] [PubMed]


Disclaimer/Publisher’s Note: The statements, opinions and data contained in all publications are solely those of the individual author(s) and contributor(s) and not of MDPI and/or the editor(s). MDPI and/or the editor(s) disclaim responsibility for any injury to people or property resulting from any ideas, methods, instructions or products referred to in the content. |
© 2023 by the authors. Licensee MDPI, Basel, Switzerland. This article is an open access article distributed under the terms and conditions of the Creative Commons Attribution (CC BY) license (https://creativecommons.org/licenses/by/4.0/).