Article

Characterization of Bacterial Exopolysaccharides Produced from Different Fruit-Based Solid Media

1
QualiSud, Université de La Réunion, CIRAD, Université Montpellier, Institut Agro Montpellier, Université Avignon, F-97410 Saint-Pierre, France
2
Diabète Athérothrombose Thérapies Réunion Océan Indien (DéTROI), Inserm, UMR 1188, Université de La Réunion, F-97490 Saint Denis, France
3
SPO, Université de Montpellier, Université de La Réunion, INRAE, Institut Agro Montpellier, F-34398 Montpellier, France
*
Author to whom correspondence should be addressed.
Fermentation 2023, 9(7), 657; https://doi.org/10.3390/fermentation9070657
Submission received: 12 June 2023 / Revised: 9 July 2023 / Accepted: 11 July 2023 / Published: 13 July 2023
(This article belongs to the Special Issue Fermentation and Bioactive Metabolites 4.0)

Abstract

:
Bacterial exopolysaccharides (EPSs) share their compositional and structural features with plant dietary fibers. Therefore, analysis of bacterial EPSs produced during fermentation of fruit or vegetables interferes with that of plant fibers. To get rid of this effect, bacteria were grown on a solid medium containing fruit juice or purée and EPSs were recovered in a quantitative dependent manner and were quantified with the phenol-sulfuric acid colorimetric method. The protocol was assayed both on MRS medium and fruit-based media, with three bacterial strains from two species, Leuconostoc pseudomesenteroides 56 and Weissella cibaria 21 and 64. With that method, differences in EPS production levels were shown according to the strain and cultivation conditions, such as sucrose content and pH. Complementary analysis with NMR indicated that glucose and sucrose were partly recovered with EPSs, pointing out the requirement for a further purification step. It also showed that EPSs’ ramified structure differed according to the strain and the fruit used in the medium. This method for EPS recovery is helpful to select strains and to pilot EPS production during lactic fermentation of fruit or vegetable foods.

1. Introduction

Bacterial homopolysaccharides are exopolysaccharides (EPSs) which are extracellularly produced, essentially by lactic acid bacteria from different genera such as Lactobacillus, Streptococcus, Pediococcus, Oenococcus, Leuconostoc and Weissella. Bacterial homopolysaccharides are composed of a single monosaccharide, as linear and ramified chains. Depending on the nature of the monosaccharide, they are named glucans or fructans. They also differ according to the nature of the link, α or β, between monosaccharides [1,2]. They belong to dietary fibers (DFs), together with resistant starch, pectins, cellulose, hemicellulose and gums [3]. Production levels from bacteria are typically of several g/L [4].
Bacterial EPSs present numerous technological and functional properties of interest for food and the human diet. They can improve rheological properties and texture of foods and act as hydrocolloids. In addition to their antioxidant activity, they exert biological effects such as anti-tumor and anti-inflammatory activities [2,5,6]. Moreover, they stimulate the growth of beneficial gut bacteria. For all of these reasons, the production of EPSs in fermented foods or in broth has gained a lot of attention.
The production and process conditions to obtain high yields of EPSs requires to take into account the bacterial strain, both carbon and nitrogen sources, and temperature, in a strain-dependent way [4,5]. Moreover, pH influences production and degradation of EPSs, but also their structure and size. Hence, their industrial production is achieved from cultivation in broth, under the regulation of environmental conditions. They can also be produced directly in foods in which they possibly modulate technological and sensory properties. In all cases, their quantification is required to assess their production level, optimize cultivation conditions and correlate properties to concentrations.
Recovery of EPSs from a culture is achieved by removal of bacterial cells through centrifugation, followed by the removal of undesirable compounds such as proteins, and further purification of EPSs with precipitation, dialysis, filtration or chromatography techniques. For subsequent quantification, the EPS fraction is usually dried into a powder that can be easily quantified by its weight. But, this method remains imprecise because of possible impurities, and thus the method most frequently used is the determination of simple sugar content after complete hydrolysis of EPSs [7]. Another method is based on the use of anthrone, which reacts with the dehydrated form of carbohydrate, leading to a bluish-green complex. The major limitation of the anthrone method is its high detection level and usually it can be accurately used only if the concentration exceeds 10 mg/L [5,8]. Microscopy, either transmission electron microscopy or scanning microscopy, but also liquid chromatography and near-infrared spectroscopy, can be used to quantify EPS, but both require extensive lab work and adapted equipment. Lastly, some studies describe the use of solid media for EPS recovery to perform structural characterization of EPSs [9,10,11] or for visual estimation of EPS production from colony aspects [12].
Previous publications recommend to avoid the presence of carbohydrate polymers in cultivation media because these compounds may hamper proper EPS analysis [8]. The main carbohydrate polymers in fruit and vegetable beverages are DFs, which originate mostly from plants. A consensus definition has been established in 2016: “dietary fiber is composed of carbohydrate polymers, which are neither digested nor absorbed in the human intestine and pass into the large bowel, where they are partially or completely fermented by the colonic microbiota” [6]. Fruit and vegetables are rich in cellulose, hemicellulose and pectins, especially in their skin. In addition, fruit contain fructo-oligosaccharides and xylo-oligosaccharides, gums and mucilage [3]. For instance, mango pulp contains 7–15 g of DF for 100 g, mostly as insoluble DF [13]. DFs are classified according to their solubility in water, as a consequence of the AOAC methods for analysis [6,13]. In the AOAC 991.43 method, the sample is submitted to several hydrolysis steps, performed with α-amylase, protease and amyloglucosidase, then precipitated and filtered to recover two fractions, insoluble and soluble DF. Hence, the main drawback of actual methods for EPS recovery from fruit and vegetable foods is the impossibility to separate EPSs from plant DFs.
From the literature review, determination of bacterial EPSs in fruit and vegetable beverages remains challenging because of interferences with naturally present DFs during the analytical process. We propose here a simple method based on a cultivation step on a fruit-based medium followed by the recovery of EPSs from the colony, which allows the quantitative determination of EPS production and NMR structure. Pineapple, mango and papaya were selected because of their different composition and from previous studies underlining their benefits after lactic acid fermentation [14,15,16,17]. Three bacterial strains, i.e., Leuconostoc pseudomesenteroides 56 and Weissella cibaria 21 and 64 were used because they were isolated from locally produced fruit or vegetables, but also because of their ability to grow and acidify fruit juices [18].

2. Materials and Methods

2.1. Bacterial Strains and Cultivation Conditions

Three lactic acid bacterial (LAB) strains, previously isolated and characterized [18], were used: Leuconostoc pseudomesenteroides 56, Weissella cibaria 21 and Weissella cibaria 64. LAB were reactivated from the frozen culture collections held by the laboratory and cultivated on MRS broth for 48 h. Liquid cultivation was performed in 10 mL tubes filled with 9 mL at 30 °C and orbital agitation (100 rpm).

2.2. Fruit Preparation

Fresh pineapple (Ananas comosus, cv. ‘Queen Victoria’) juice was extracted after peeling of commercially mature fruit. The collected juice exhibited a pH of 3.4, a total soluble solid (TSS) content of 17.7 °Brix and a titratable acidity (TA) of 0.73 mg malic acid equivalent (MAE)/100 g.
Mango (Mangifera indica, cv. ‘Cogshall’) and papaya (Carica papaya, cv. ‘Solo’) purées were prepared by mixing commercially mature fruit after removal of peel, stone or seeds. Mango purée was characterized by a pH of 4.2, a TSS content of 17.5 °Brix and a TA of 0.65 mg MAE/100 g. Papaya purée exhibited a pH of 4.9, a TSS content of 11.3 °Brix and a TA of 0.63 mg MAE/100 g.

2.3. Screening for EPS Production

Solid media were used in plates of diameter 5 cm. Each experiment was performed as triplicates.
EPS production was detected after cultivation from a drop of 100 µL, corresponding to 108 cells/mL, of active culture on MRS agar supplemented with 5% sucrose, after 72 h at 30 °C. If specified, sucrose content was adjusted to 10% or 20%. For all experiments, pH was adjusted to 4.5, 5 or 6 with HCl 1 M prior to autoclaving. A negative control was performed without inoculation to check the absence of contamination.
Alternatively, solid media were prepared by mixing either fresh pineapple juice, or mango or papaya purée diluted with water in a ratio 1:1, with 50 g·L−1 agar. Bacteriological agar (reference 05040, Sigma-Aldrich, Saint-Quentin-Fallavier, France) was used. The initial pH of the media was conferred by the fruit juice, unless specified. To obtain an initial pH value of 4.5, 5 or 6 of the media, sodium hydroxide 2 M was used, prior to sterilization. If specified, sucrose was added to the media prior to sterilization, to obtain a concentration of 5%, 10% or 20%, considering an initial sucrose content of pineapple juice, mango purée and papaya purée of 9.6%, 6.5% and 0%, respectively. If specified, peptone was added to the media prior to sterilization, to obtain a content of 2% or 4%. Sterilized media were stored at 4 °C for less than 72 h before use. Plates were inoculated with 100 µL of active bacterial culture and incubated for 72 h at 30 °C.
The colony was visually scored as (0) non-mucoid, (1) slightly mucoid, (2) mucoid and (3) strongly mucoid.

2.4. Recovery of EPS

Recovery of EPS was performed by washing the plate surface with 5 mL of ultrapure sterile water. Briefly, the plate was poured with 2 mL of water, submitted to manual agitation by manually moving the plate with water in a circular motion for 30 s and the liquid was collected by pipetting, and the same steps were repeated with 3 mL of water. A centrifugation step of 10 min at 5000× g was applied to remove cellular and medium debris. The supernatant was stored at −20 °C until use. This collection procedure was also performed for control plates.

2.5. Phenol-Sulfuric Colorimetric Determination

EPSs were analyzed according to the method of phenol-sulfuric reagent [7]. A volume of 500 µL of sample containing EPSs was mixed with 500 µL of phenol 5% (Sigma-Aldrich, Merck KGaA, Darmstadt, Germany), then with 2.5 mL of 98% sulfuric acid (VWR Chemicals, Radnor, PA, USA). The mixture was heated at 95 °C for 15 min. After cooling, the OD was measured at 490 nm. The concentration was determined with D-glucose (Sigma-Aldrich, Merck KGaA, Darmstadt, Germany) as a standard, in the range 0 g/L to 0.5 g/L. The concentration of EPSs was expressed as mg glucose equivalent per plate.

2.6. Structural Characterization by NMR Spectroscopy

EPSs previously recovered were freeze-dried. Then, 10 mg of sample were solubilized in 1 mL of deuterium oxide D2O (Eurisotop, France). Tetramethylsilane (TMS, Sigma-Aldrich, Germany) was used as reference. Controls were performed using the same recovery method on sterile agar plates.
Spectra were recorded on a 600 MHz Avance III Bruker NMR spectrometer equipped with a 1H/19F, 13C and 15N cryoprobe. All spectra were obtained at 323 K. The 1D 1H spectra were recorded with 256 scans using a sweep width of 10.8 ppm. The carrier was placed at 4.53 ppm for 1H. For sugar identification and structure determination, 1D 13C, 2D COSY, 2D TOCSY, 2D NOESY, 2D 1H–13C HSQC and 2D 1H–13C HMBC were recorded. The carrier was placed at 77.5 ppm for 13C, and the sweep width was 200 ppm for 1D 13C or 100 ppm for 2D 1H–13C.

2.7. Statistical Analysis

Quantitative data were analyzed by ANOVA with the Ryan-Einot-Gabriel-Welsch and Quiot (REGWQ) test, with XLSTAT 2016.1.1 software (Addinsoft, Paris, France).

3. Results

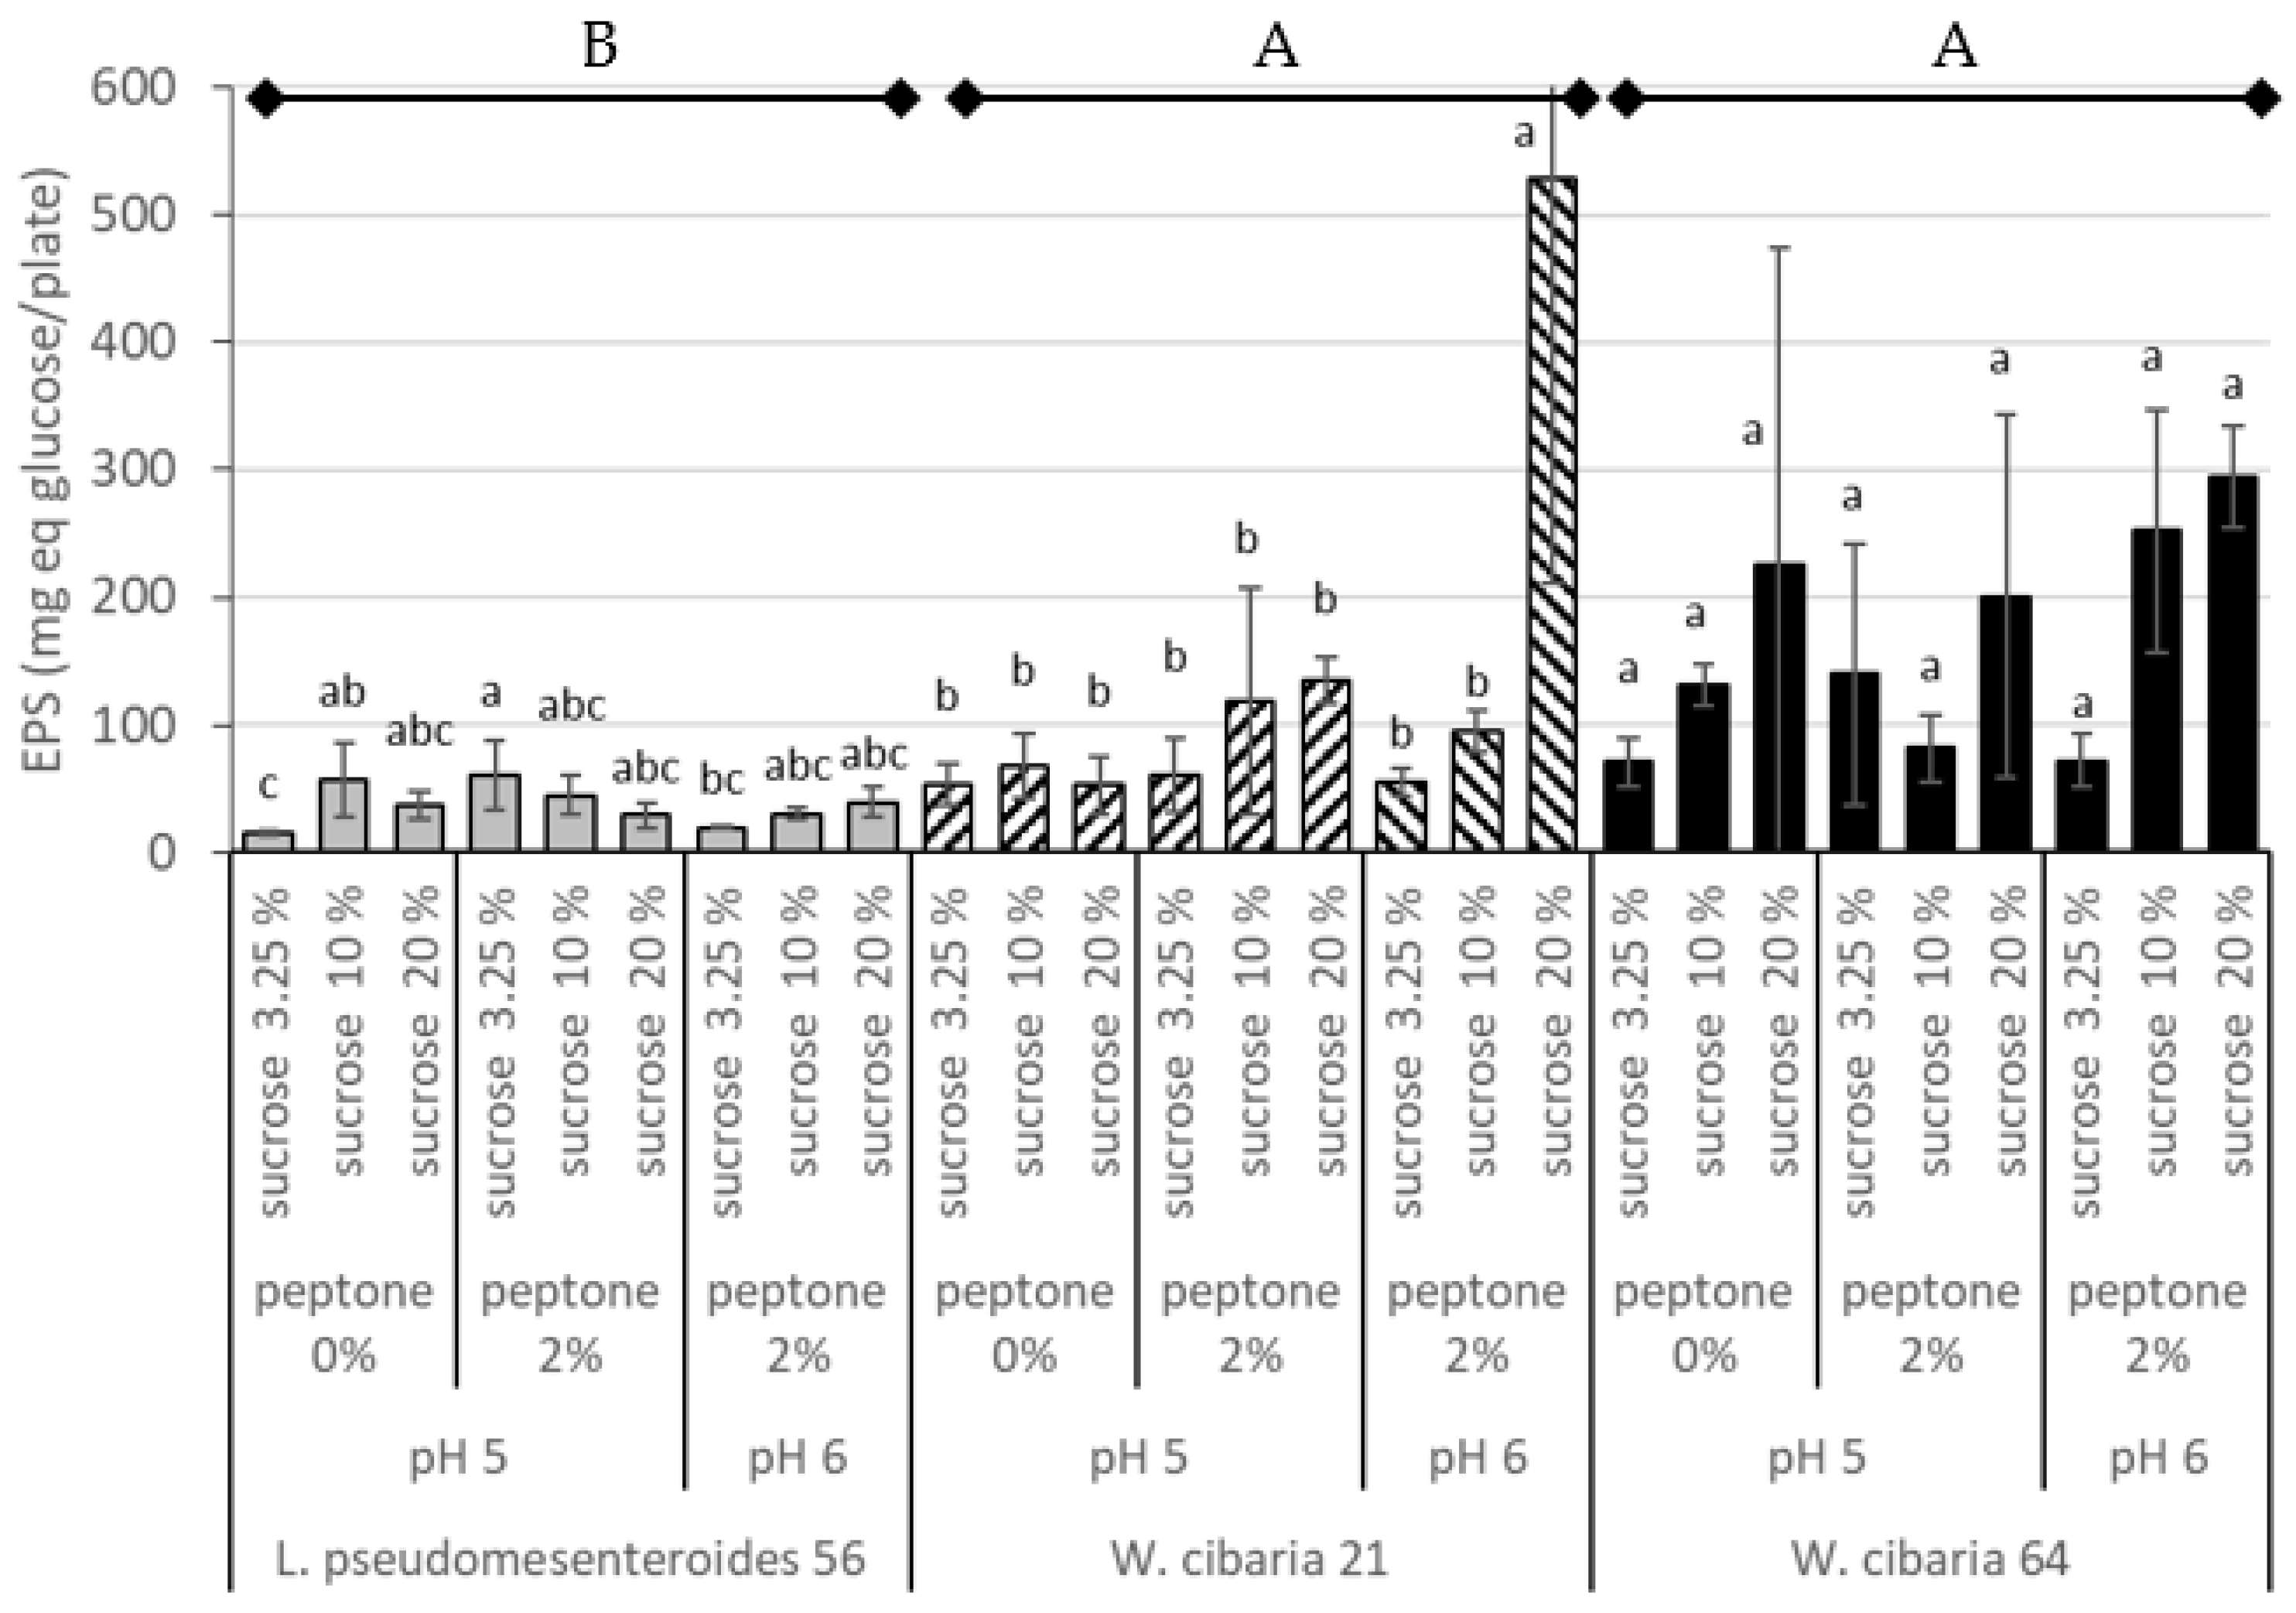
3.1. Determination of EPS Content on MRS Sucrose

EPS production of the three LAB strains was first assessed on MRS medium containing sucrose at three different levels, and with the initial pH value adjusted to 4.5, 5 or 6. A visual scoring of EPS production was applied and EPSs were collected and analyzed with the method described.
Quantitative EPS determination and visual score varied in the same way. The means that EPS levels were 12 mg eq glucose/plate, 42 mg eq. glucose per plate, 68 mg eq. glucose per plate and 289 mg eq. glucose per plate, respectively, for scores 0, 1, 2 and 3. However, the variance of EPS production level increased for visual score classes with higher mucous amounts (Figure 1).
Production levels varied according to the strain, initial pH and sucrose content in the medium (Figure 2). Whatever the strain, the highest production was observed for MRS pH 6 and sucrose 20%, with 823 mg eq. glucose per plate, 586 mg eq. glucose per plate and 331 mg eq. glucose per plate, respectively, for strains 64, 21 and 56. The production was also high, though significantly lower, for MRS pH 6 sucrose 10%. The lowest production levels were observed when a low pH, 4.5 or 5, were combined with moderate sucrose levels, 5% or 10%. For pH values of 5 and 6, and whatever the sucrose level, the strain L. pseudomesenteroides 56 produced EPSs at lower levels than the two other strains. Eventually, EPS production was strain-dependent, with differences between L. mesenteroides 56 and the two W. cibaria strains (p-value < 0.0001). The developed method allowed the differentiation between conditions and strains.
Coefficient of variation was acceptable but presented some discrepancies: it was above 25% for 11 conditions among 27.

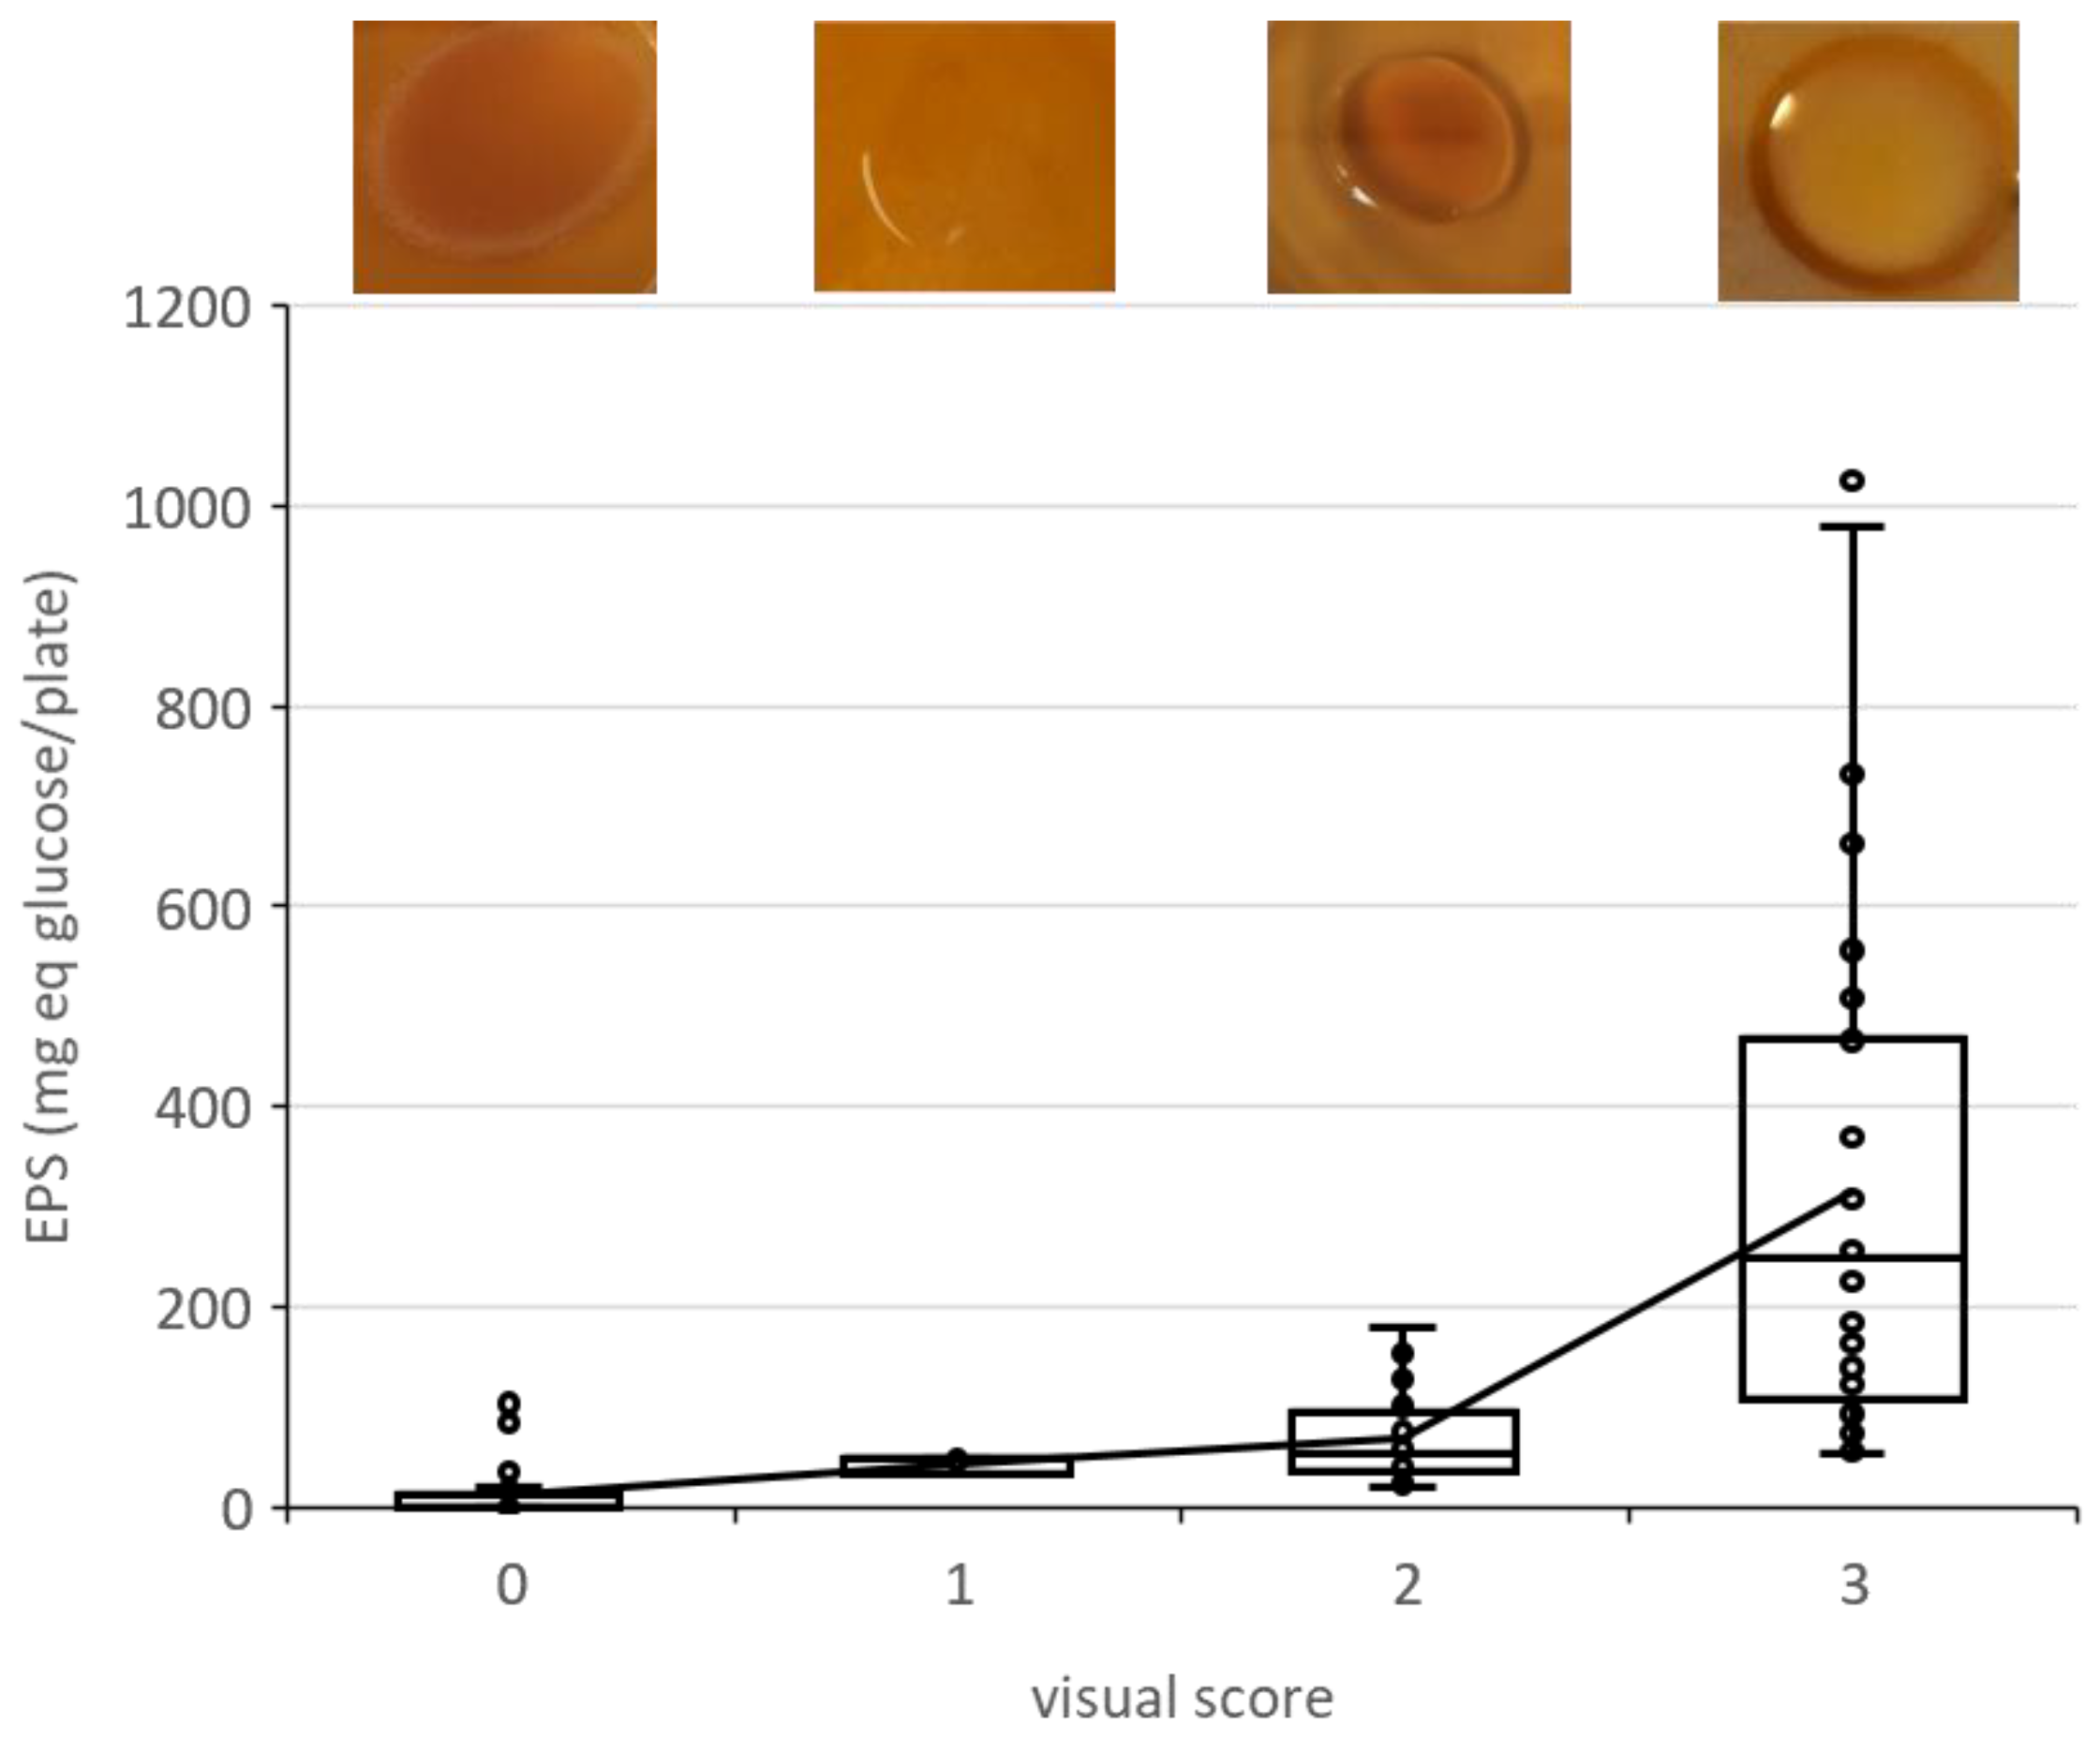
3.2. Visual Assessment of EPS Content on Fruit-Based Media

The first assay was performed on fruit-based agar, with or without pH adjustment to 6, with or without sucrose addition to reach 20% (Table 1).
The three strains behaved similarly regardless of the fruit.
Pineapple exhibited a low pH of 3.4. At that pH, the medium was semi-liquid as expected from agar gel properties, thus EPS production could not be determined. The adjustment of pH to 6 enabled EPS production. Production was further stimulated when sucrose was adjusted to 20%, instead of 9.6% for the fruit.
On the contrary, mango resulted in EPS production for all tested conditions. A slight increase was observed when the pH was adjusted from 4.2 to 6, and sucrose from 3.25% to 20%.
Lastly, papaya medium resulted in a good growth of bacteria but did not favor EPS production. Papaya contains low levels of sucrose, mainly glucose and fructose [19,20]. Hence, EPS production cannot occur directly on fruit medium because of the lack of sugar substrate. Surprisingly, EPS production was not restored by sucrose addition to papaya purée. Papaya pH was close to 5 [14]. Adjustment of the pH to 6, in combination to sucrose 20%, resulted in a weak EPS production. It was previously reported that nitrogen availability could be critical for EPS production and that a correct nitrogen/sugar balance was required [5]. To test the hypothesis of an imbalance between nitrogenous compounds and sugars, peptone 2% was added to the medium, while varying sucrose content up to 20% and at pH 6. Whatever the condition, no EPS production was observed (data not shown). Papaya possibly contains a compound which exerted an inhibitory role for EPS production.
From those results, we decided to apply the quantification method to several conditions of pineapple juice and mango purée, but not papaya purée.

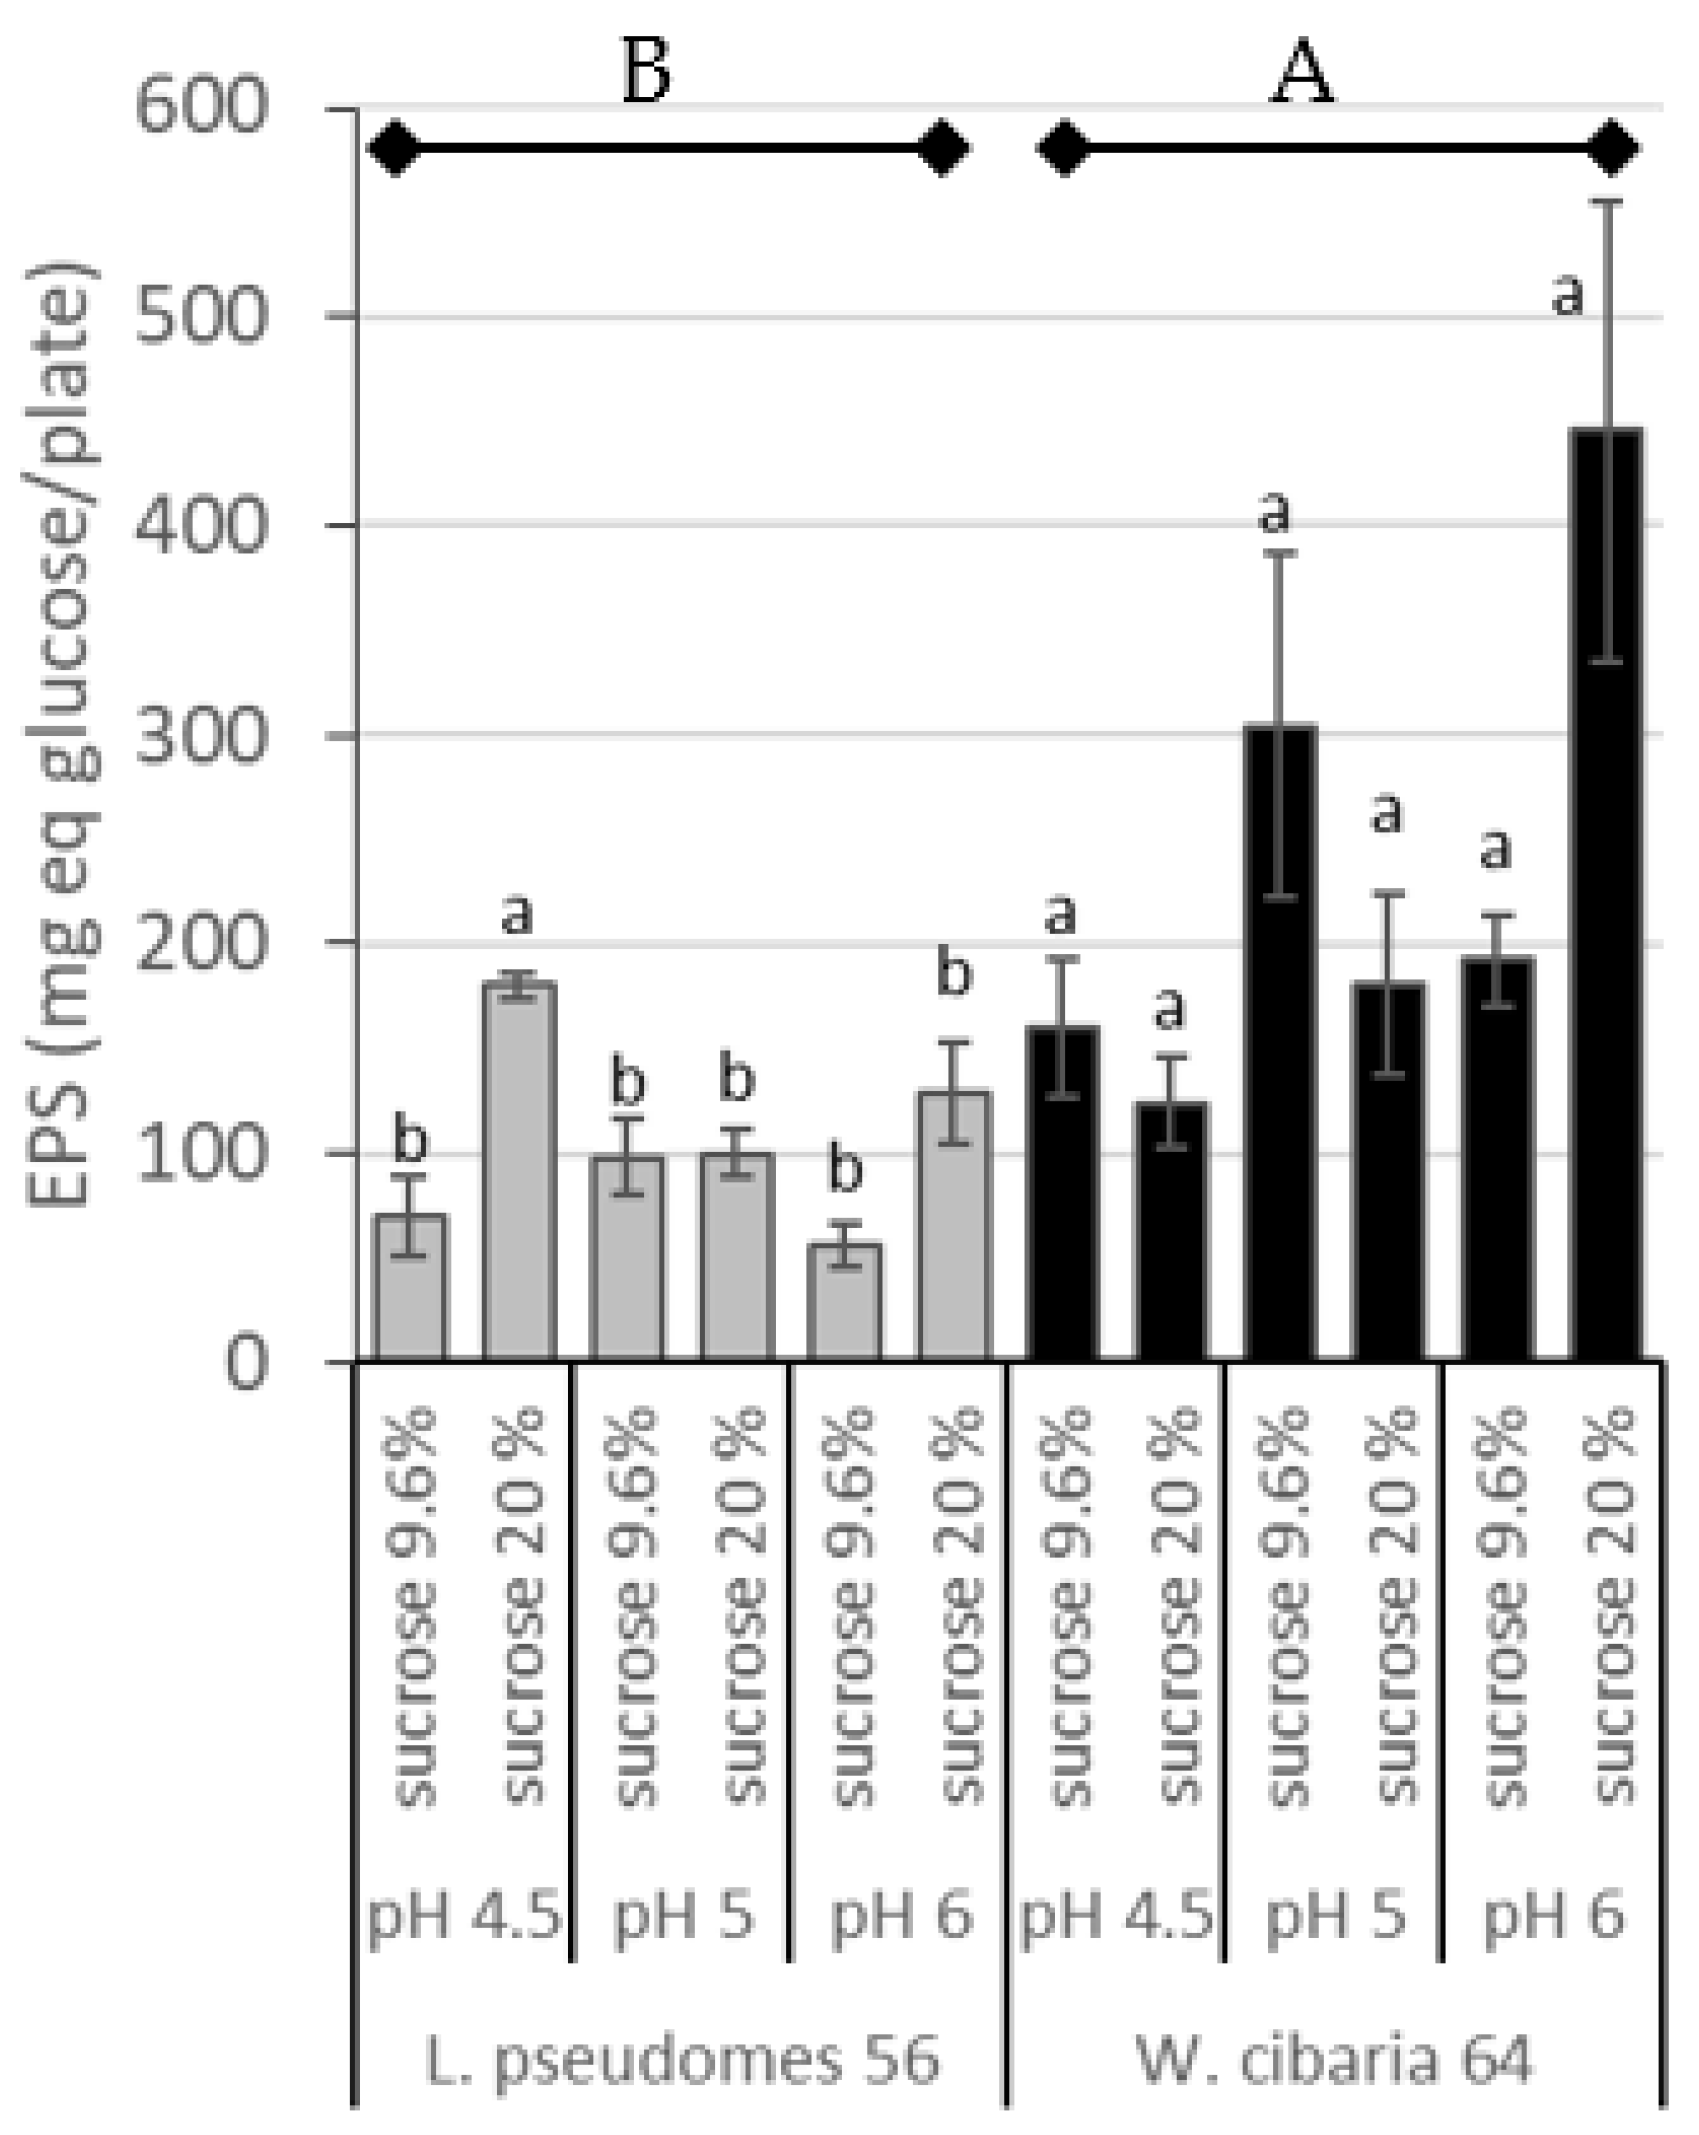
3.3. Determination of EPS Content on Fruit Purée Agar

EPS production was determined by the three bacterial strains on mango purée agar. Two levels of pH were assayed, pH 5 and pH 6, and three levels of sucrose: 3.25% corresponding to that of diluted mango purée, 10% and 20%. Eventually, the addition of peptone 2% was performed for all conditions, and assays at pH 5 were also performed without peptone (Figure 3).
The production level of EPS differed between L. pseudomesenteroides 56 and the two other W. cibaria strains, 21 and 64. Production of EPS by strain 56 remained poor whatever the modification of condition, i.e., pH modification, sucrose addition or peptone addition. The production of EPS by strain 21 was higher than for strain 56, and was significantly increased at pH 6, sucrose 20% and peptone 2%. Production levels on mango peptone 2% sucrose 20% and pH 6 were 527 mg eq. glucose per plate and 295 mg eq. glucose per plate, respectively, for strains 21 and 64. EPS production from strain 64 showed a tendency to increase when sucrose content increased, though not significant. Peptone addition was ineffective. Compared to MRS, the production level of EPS was lower on mango purée. The maximum production level was achieved with W. cibaria at a pH of 6, with 20% sucrose and 2% peptone. Only one third of EPS average values presented a variation coefficient below 25%.
The quantitative method was applied to determine EPS production on pineapple-juice medium at two different sucrose levels, juice level estimated at 9.6% and adjusted to 20%, for three pH values, from 4.5 to 6, for the strains L. pseudomesenteroides 56 and W. cibaria 64 (Figure 4). The visually observed EPS production of W. cibaria 21 was the same as the one obtained from W. cibaria 64 (data not shown) and was not quantified.
The mean production of EPS of the two strains differed significantly (p-value = 0.013). EPS production of W. cibaria 64 was higher than that of strain L. pseudomesenteroides 56, as observed in MRS. EPS production of L. pseudomesenteroides 56 was between 56 and 180 mg eq. glucose per plate. The highest level was obtained at pH 4.5 and sucrose 20%. Though production was systematically higher for sucrose 20% compared to 9.6%, no significant sucrose content effect was detected. The medium pH did not show any effect in the range assayed. EPS production of W. cibaria 64 ranged between 159 and 445 mg eq. glucose per plate, and no effect of pH or sucrose level was detected in the conditions assayed. Comparatively to MRS, the production level was lower on pineapple juice. The inhibitory effect of pineapple acidity on EPS seemed relieved when pH was equal to or above 4.5.
Variation coefficients obtained with the quantitative method were between 3% and 27%, with a majority of values below 20%.

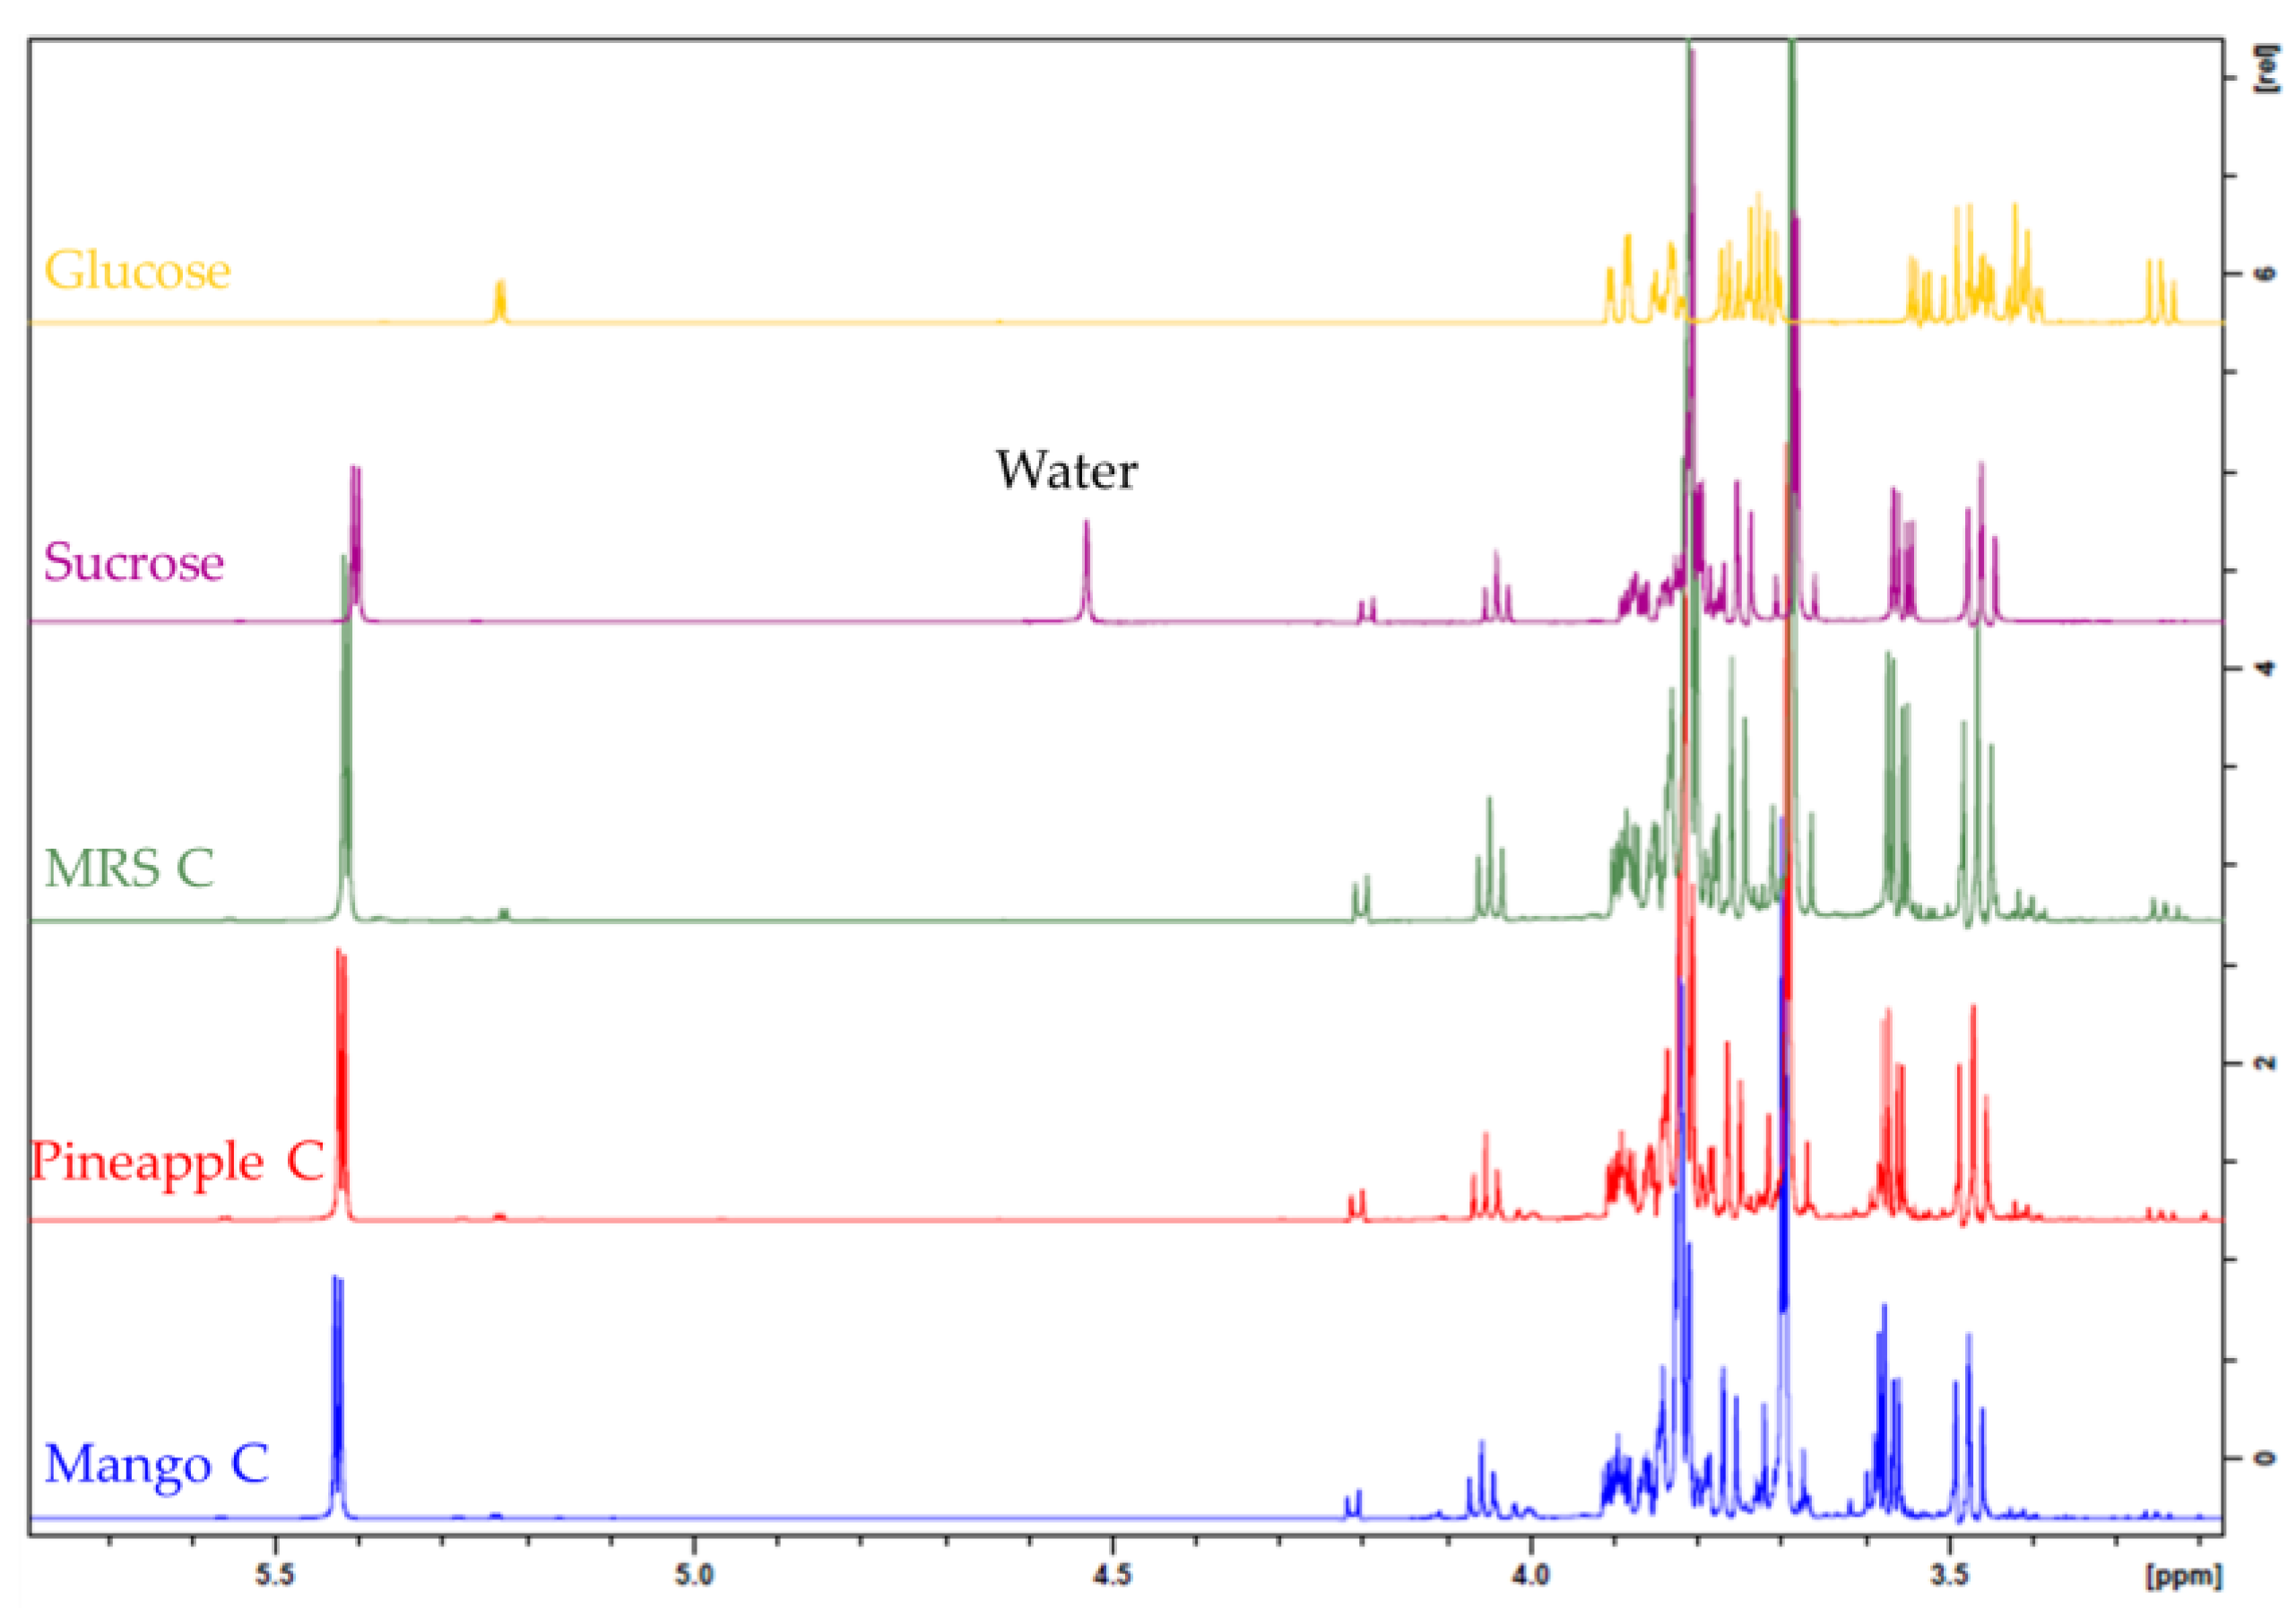
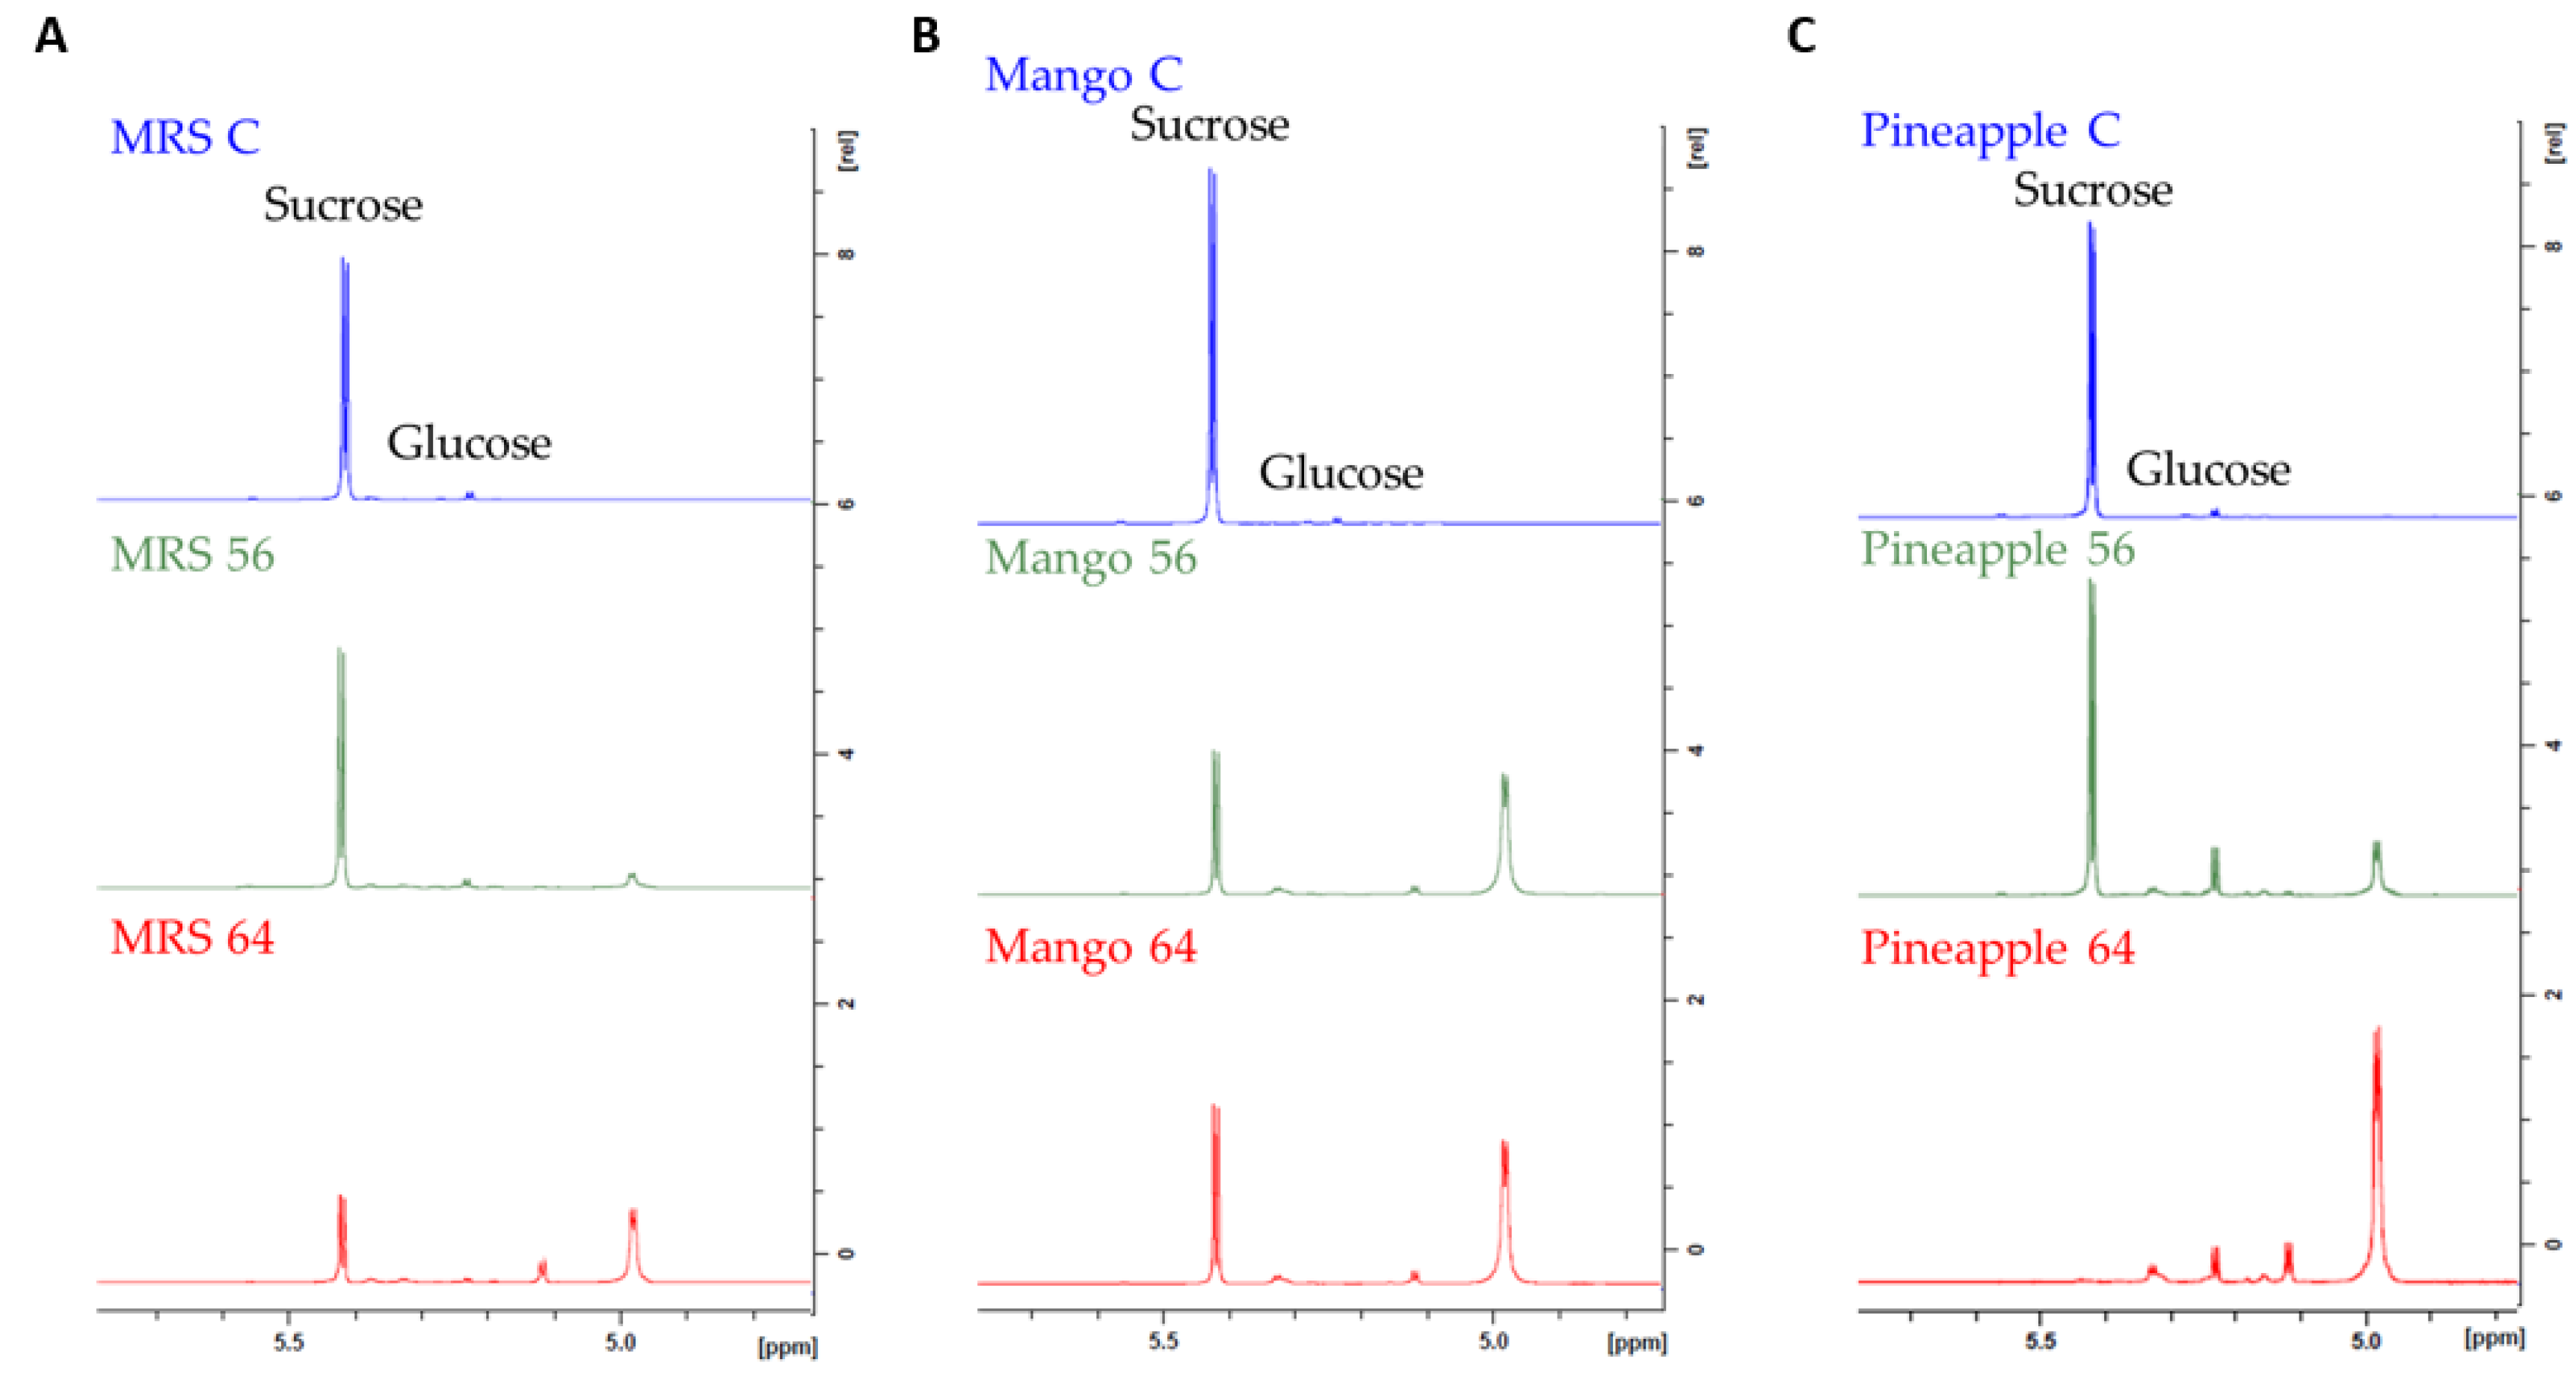
3.4. Structure Determination of EPS by NMR Spectroscopy

Variation coefficients greatly differed according to the medium, i.e., lowest on pineapple-based agar and highest on mango-based medium. We hypothesized a recovery of non-EPS compounds during sample preparation, though a variability of production level by the strain cannot be excluded. Washing the plate surface with water could solubilize mono- and di-saccharides from the cultivation medium.
To answer that question, NMR analysis of liquid collected from MRS (pH 6, sucrose 20%) or fruit-based (pH 6, sucrose 9.6% for pineapple juice and sucrose 3.25% for mango purée) plate washing was performed.
Liquid samples collected from sterile agar plates were compared to sucrose and glucose standards (Figure 5). In all samples, the anomeric proton (H1 of glucose) of sucrose was detected at 4.42 ppm and that of glucose at 5.23 ppm. The signals of the other sucrose protons (between 3.45 and 4.2 ppm) were also present in all samples. Hence, all samples from sterile MRS, pineapple juice and mango purée media contained sucrose plus a low amount of glucose. The obtained profiles were very similar whatever the medium.
The profiles of the liquid collected after cultivation of the bacteria on MRS, mango purée-based and pineapple juice-based media were then analyzed. Regardless of the medium studied, the 1H NMR spectra were modified after culture of LAB compared to sterile media (Figure 6).
As visual quantification was similar for W. cibaria 21 and 64, only the latter was used for characterization by NMR spectroscopy.
In addition to the anomeric proton visible at 4.98 ppm, a peak corresponding to an additional anomeric proton at 5.12 ppm was observed for the strain W. cibaria 64 on MRS. This strain therefore contains two major saccharide units. Moreover, the cultivation of strain W. cibaria 64 induced a significant consumption of sucrose present in the medium. Cultivation of the W. cibaria 64 strain onto pineapple juice medium resulted in the consumption of all sucrose present in the medium. EPS production was higher on pineapple juice medium for this strain, whereas production was higher for the L. pseudomesenteroides 56 strain on mango purée medium.
EPS production depended mainly on the strain compared to the fruit. The decrease in the concentration of sucrose in the medium reflected its consumption by the LAB strains. The consumption of sucrose, as well as the use of the monosaccharide unit for EPS synthesis by the W. cibaria 64 strain, was higher than that of the L. pseudomesenteroides 56 strain.
In order to identify the sequence of saccharide units of the EPSs present, the entire 1H and 13C of the majority saccharide unit, as well as the H1, H2 and C1 of the minority saccharide unit, were assigned using the 2D COSY, TOCSY and 1H–13C HSQC spectra. The results are reported in Table 2.
Comparison of these values with the literature identified the main saccharide unit as corresponding to glucosyl residues connected by α-(1→6) glycosidic linkages while the minor saccharide unit corresponded to glucosyl residues connected by α-(1→3) glycosidic linkages [21,22,23]. These data are in agreement with the structure of EPS produced by L. pseudomesenteroides [16,24,25] and W. cibaria [26,27,28]. Indeed, both a 100% linear α-(1→6) glucan and a main α-(1→6) chain with up to 4% α-(1→3) ramifications are described, depending on the strain and cultivation conditions. The EPS produced is thus a dextran with a main chain of glucosyl residues linked by α-(1→6) bonds and some α-(1→3) ramifications. The proportion of α-(1→6) and α-(1→3) glycosidic linkages were determined by integrating the signal of anomeric protons at 4.98 ppm and 5.12 ppm, respectively. The data show a higher relative proportion of α-(1→3) bonds for a given media with the use of the W. cibaria 64 strain by comparison with the L. pseudomesenteroides 56 strain, as reported in Table 3, indicating a tendency to produce higher ramified EPSs for that strain.
In addition, NMR analysis showed the absence of contamination from fruit DFs. Fruit soluble dietary fibers are mainly pectins, and their presence in the sample would have led to the detection of galacturonic acid, rhamnose, galactose or arabinose. In addition, the presence of modified cellulose, such as methylcellulose, would have result in β-linked glucose residues.

4. Discussion

The use of a solid medium containing fruit juice or purée and agar led to the recovery of bacterial EPSs without contamination with fruit DFs. Hence, the EPSs produced were successfully quantified, from the culture of three strains under different conditions, and their structure was analyzed. The use of visual scoring showed some limits: though the highest EPS content for each score and average production respected the scoring order, EPS contents overlapped the visual scores. The ropiness of EPS, estimated from strand length formed after touching the colony with a loop, and slime consistency, varying from liquid to compact, was dependent on the EPS type and possibly on chain length of α-(1,3)-linked branches [9,10,29,30]. L. pseudomesenteroides 56 produced a dextran, mainly linear with α-(1→6) linkages and a proportion below 4.3% of α-(1→3) bonds. On the opposite, strain 64 dextran contained between 4.6% and 14.7% of α-(1→3) linkages. Those differences partly explained their colony phenotype. Nevertheless, the observed variability of EPS quantification showed that the method requires some improvements. In existing methods, a further purification step was used to remove non-EPS compounds which could interfere with the phenol-sulfuric colorimetric method [29]. NMR analysis showed the presence of residual sucrose and glucose in the EPS preparation. Hence, an additional step designed specifically to remove monosaccharides and sucrose should be added. Dialysis, gel filtration or EPS precipitation with ethanol would be relevant to that aim.
In spite of this drawback, the EPS production level and structure were determined for the three bacterial strains under various conditions.
Production of EPSs during lactic fermentation of fruit or vegetable beverages presents interests for texture properties [12,22], but also nutritional benefits [2,5,31]. Fermentation of carrot beverage with selected lactic acid bacteria, including Leuconostoc and Weissella strains, resulted in EPS production and consequently modified perceived texture and flavor to pleasant ones [9]. The choice of a strain or a mixture of strains to ferment fruit or vegetables is crucial to control the quality of the product [32,33]. The strains used in this study were previously isolated from fruit. Both L. pseudomesenteroides and W. cibaria are already known to produce dextran from sucrose [24,25,26,27,28,34].
All three strains, L. pseudomesenteroides 56, W. cibaria 64 and 21, showed the highest production of EPS in MRS at 20% sucrose and pH 6. L. pseudomesenteroides 56 was the lowest EPS producer, whatever the medium, i.e., MRS or fruit-based agar, compared to other strains. However, visual scores did not point out this lower ability, indicating this strain would still be suitable for texture modification. The production of EPS on pineapple medium was the highest for W. cibaria 64 with 20% sucrose and pH 6, whereas on mango medium 20% sucrose and pH 6 the strain W. cibaria 21 was the best producer. Compared to production on MRS, these values remained lower, indicating the possibility of optimization.
In previously published data, L. pseudomesenteroides produces the highest EPS levels in MRS with 18% sucrose, 20 °C and pH 7.3 in [35], and 10% sucrose, 25 °C and pH 7 in [36]. Lower optimal pH values for EPS production, between 6.2 and 7, were reported for W. cibaria, whereas the optimal temperature varied between 22 °C and 37 °C, and sucrose level varied between 4 and 6%, indicating a strain diversity [27,34,37]. Hence, lowering temperature, hereby 30 °C, could be assayed for strains used in this study to increase EPS production level. The optimal pH for EPS production was slightly below or close to neutrality in the different studies. In food fermentation, the initial pH depends on the fruit or vegetable used. The moderate effect of pH, in the range 4.5 to 6, on EPS production in this study is advantageous for low acidic fruit, such as mango, whose pH was 4.2 but could be up to 5.5 [38]. In addition, a high maturity level of mango favors higher pH. The use of over-ripe fruit would then be advantageous for EPS production. Moreover, sucrose could be added prior to fermentation to stimulate EPS production. This was previously successfully assayed on carrot beverage supplemented with 5% sucrose [9]. However, in the perspective of the production of lactic fermented beverages, addition of sucrose would be detrimental for nutritional properties.

5. Conclusions

EPS structural characteristics, which are close to that of naturally present DF in fruit, prevent the analysis of LAB-produced EPSs in fermented fruit or vegetable based-foods. With a cultivation step on a solid medium containing fruit juice or purée followed by the recovery of EPSs from the colony, we could perform the quantitative determination of EPS production. The NMR analysis revealed the presence of a dextran with a main chain of α-(1→6) bonds and α-(1→3) ramifications. The availability of this method will facilitate the optimization of fermentation conditions of fruit and vegetables to reach high levels of EPS production.

Author Contributions

Conceptualization, F.R. and C.G.; methodology and investigation, M.G.; writing—original draft preparation, F.R.; writing—review and editing, M.G., C.G. and C.R.-D.S.; supervision, F.R., C.G. and C.R.-D.S.; NMR spectroscopy, J.C. All authors have read and agreed to the published version of the manuscript.

Funding

This research was funded by Région Réunion and by the European regional fund FEDER PO 2014-2020.

Institutional Review Board Statement

Not applicable.

Informed Consent Statement

Not applicable.

Data Availability Statement

Not applicable.

Conflicts of Interest

The authors declare no conflict of interest.

References

  1. Singh, P.; Saini, P. Food and health potentials of exopolysaccharides derived from Lactobacilli. Microbiol. Res. J. Int. 2017, 22, 1–14. [Google Scholar] [CrossRef]
  2. Guérin, M.; Silva, C.R.-D.; Garcia, C.; Remize, F. Lactic acid bacterial production of exopolysaccharides from fruit and vegetables and associated benefits. Fermentation 2020, 6, 115. [Google Scholar] [CrossRef]
  3. Cui, J.; Lian, Y.; Zhao, C.; Du, H.; Han, Y.; Gao, W.; Xiao, H.; Zheng, J. Dietary fibers from fruits and vegetables and their health benefits via modulation of gut microbiota. Compr. Rev. Food Sci. Food Saf. 2019, 18, 1514–1532. [Google Scholar] [CrossRef] [Green Version]
  4. Nabot, M.; Guérin, M.; Sivakumar, D.; Remize, F.; Garcia, C. Variability of bacterial homopolysaccharide production and properties during food processing. Biology 2022, 11, 171. [Google Scholar] [CrossRef]
  5. Sørensen, H.M.; Rochfort, K.D.; Maye, S.; MacLeod, G.; Brabazon, D.; Loscher, C.; Freeland, B. Exopolysaccharides of lactic acid bacteria: Production, purification and health benefits towards functional food. Nutrients 2022, 14, 2938. [Google Scholar] [CrossRef] [PubMed]
  6. Fuller, S.; Beck, E.; Salman, H.; Tapsell, L. New horizons for the study of dietary fiber and health: A review. Plant Foods Hum. Nutr. 2016, 71, 1–12. [Google Scholar] [CrossRef] [PubMed]
  7. Dubois, M.; Gilles, K.; Hamilton, J.K.; Rebers, P.A.; Smith, F. A colorimetric method for the determination of sugars. Nature 1951, 168, 167. [Google Scholar] [CrossRef]
  8. Leroy, F.; De Vuyst, L. Advances in production and simplified methods for recovery and quantification of exopolysaccharides for applications in food and health. J. Dairy Sci. 2016, 99, 3229–3238. [Google Scholar] [CrossRef] [Green Version]
  9. Juvonen, R.; Honkapää, K.; Maina, N.H.; Shi, Q.; Viljanen, K.; Maaheimo, H.; Virkki, L.; Tenkanen, M.; Lantto, R. The impact of fermentation with exopolysaccharide producing lactic acid bacteria on rheological, chemical and sensory properties of pureed carrots (Daucus carota L.). Int. J. Food Microbiol. 2015, 207, 109–118. [Google Scholar] [CrossRef]
  10. Malang, S.K.; Maina, N.H.; Schwab, C.; Tenkanen, M.; Lacroix, C. Characterization of exopolysaccharide and ropy capsular polysaccharide formation by Weissella. Food Microbiol. 2015, 46, 418–427. [Google Scholar] [CrossRef]
  11. Velamakanni, R.P.; Vuppugalla, P.; Merugu, R. Techniques Used for characterization of microbial exopolysaccharides. In Microbial Exopolysaccharides as Novel and Significant Biomaterials; Nadda, A.K., Sajna, K.V., Sharma, S., Eds.; Springer Series on Polymer and Composite Materials; Springer International Publishing: Cham, Switzerland, 2021; pp. 19–43. ISBN 978-3-030-75289-7. [Google Scholar]
  12. Tinzl-Malang, S.K.; Rast, P.; Grattepanche, F.; Sych, J.; Lacroix, C. Exopolysaccharides from co-cultures of Weissella confusa 11GU-1 and Propionibacterium freudenreichii JS15 act synergistically on wheat dough and bread texture. Int. J. Food Microbiol. 2015, 214, 91–101. [Google Scholar] [CrossRef] [PubMed]
  13. Garcia-Amezquita, L.E.; Tejada-Ortigoza, V.; Heredia-Olea, E.; Serna-Saldívar, S.O.; Welti-Chanes, J. Differences in the dietary fiber content of fruits and their by-products quantified by conventional and integrated AOAC official methodologies. J. Food Compos. Anal. 2018, 67, 77–85. [Google Scholar] [CrossRef]
  14. Mashitoa, F.M.; Akinola, S.A.; Manhevi, V.E.; Garcia, C.; Remize, F.; Slabbert, R.M.; Sivakumar, D. Influence of fermentation of pasteurised papaya puree with different lactic acid bacterial strains on quality and bioaccessibility of phenolic compounds during in vitro digestion. Foods 2021, 10, 962. [Google Scholar] [CrossRef] [PubMed]
  15. Guérin, M.; Remize, F.; Bringart, M.; Planesse, C.; Rondeau, P.; Da Silva, C.R.; Garcia, C. Fermented pineapple juice consumption limits metabolic disorders associated to sugary drinks on high-fat diet-fed mice. Mol. Nutr. Food Res. 2023, 67, 2200670. [Google Scholar] [CrossRef] [PubMed]
  16. Ye, G.; Li, G.; Wang, C.; Ling, B.; Yang, R.; Huang, S. Extraction and characterization of dextran from Leuconostoc pseudomesenteroides YB-2 isolated from mango juice. Carbohydr. Polym. 2019, 207, 218–223. [Google Scholar] [CrossRef]
  17. Cele, N.P.; Akinola, S.A.; Shoko, T.; Manhevi, V.E.; Remize, F.; Sivakumar, D. The bioaccessibility and antioxidant activities of fermented mango cultivar juices after simulated in vitro digestion. Foods 2022, 11, 2702. [Google Scholar] [CrossRef]
  18. Fessard, A.; Remize, F. Genetic and technological characterization of lactic acid bacteria isolated from tropically grown fruits and vegetables. Int. J. Food Microbiol. 2019, 301, 61–72. [Google Scholar] [CrossRef]
  19. Ciqual Table de Composition Nutritionnelle des Aliments. Available online: https://ciqual.anses.fr/ (accessed on 24 October 2022).
  20. FoodData Central. US Department of Agriculture, Agricultural Research Service. Available online: https://fdc.nal.usda.gov/ (accessed on 24 October 2022).
  21. Li, Y.; Xiao, L.; Tian, J.; Wang, X.; Zhang, X.; Fang, Y.; Li, W. Structural characterization, rheological properties and protection of oxidative damage of an exopolysaccharide from Leuconostoc citreum 1.2461 fermented in soybean whey. Foods 2022, 11, 2283. [Google Scholar] [CrossRef]
  22. Yilmaz, M.T.; İspirli, H.; Taylan, O.; Taşdemir, V.; Sagdic, O.; Dertli, E. Characterisation and functional roles of a highly branched dextran produced by a bee pollen isolate Leuconostoc mesenteroides BI-20. Food Biosci. 2022, 45, 101330. [Google Scholar] [CrossRef]
  23. Purama, R.K.; Goswami, P.; Khan, A.T.; Goyal, A. Structural analysis and properties of dextran produced by Leuconostoc mesenteroides NRRL B-640. Carbohydr. Polym. 2009, 76, 30–35. [Google Scholar] [CrossRef]
  24. Du, R.; Qiao, X.; Zhao, F.; Song, Q.; Zhou, Q.; Wang, Y.; Pan, L.; Han, Y.; Zhou, Z. Purification, characterization and antioxidant activity of dextran produced by Leuconostoc pseudomesenteroides from homemade wine. Carbohydr. Polym. 2018, 198, 529–536. [Google Scholar] [CrossRef] [PubMed]
  25. Wang, B.; Song, Q.; Zhao, F.; Xiao, H.; Zhou, Z.; Han, Y. Purification and characterization of dextran produced by Leuconostoc pseudomesenteroides PC as a potential exopolysaccharide suitable for food applications. Process Biochem. 2019, 87, 187–195. [Google Scholar] [CrossRef]
  26. Kavitake, D.; Devi, P.B.; Shetty, P.H. Overview of exopolysaccharides produced by Weissella genus—A Review. Int. J. Biol. Macromol. 2020, 164, 2964–2973. [Google Scholar] [CrossRef] [PubMed]
  27. Yu, Y.-J.; Chen, Z.; Chen, P.T.; Ng, I.-S. Production, characterization and antibacterial activity of exopolysaccharide from a newly isolated Weissella cibaria under sucrose effect. J. Biosci. Bioeng. 2018, 126, 769–777. [Google Scholar] [CrossRef] [PubMed]
  28. Bejar, W.; Gabriel, V.; Amari, M.; Morel, S.; Mezghani, M.; Maguin, E.; Fontagné-Faucher, C.; Bejar, S.; Chouayekh, H. Characterization of glucansucrase and dextran from Weissella sp. TN610 with potential as safe food additives. Int. J. Biol. Macromol. 2013, 52, 125–132. [Google Scholar] [CrossRef]
  29. Tirtaatmadja, V.; Dunstan, D.E.; Boger, D.V. Rheology of dextran solutions. J. Non-Newton. Fluid Mech. 2001, 97, 295–301. [Google Scholar] [CrossRef]
  30. Li, C.; Li, W.; Chen, X.; Feng, M.; Rui, X.; Jiang, M.; Dong, M. Microbiological, physicochemical and rheological properties of fermented soymilk produced with exopolysaccharide (EPS) producing lactic acid bacteria strains. LWT—Food Sci. Technol. 2014, 57, 477–485. [Google Scholar] [CrossRef]
  31. Salazar, N.; Gueimonde, M.; de los Reyes-Gavilán, C.G.; Ruas-Madiedo, P. Exopolysaccharides produced by lactic acid bacteria and bifidobacteria as fermentable substrates by the intestinal microbiota. Crit. Rev. Food Sci. Nutr. 2016, 56, 1440–1453. [Google Scholar] [CrossRef]
  32. Di Cagno, R.; Surico, R.F.; Siragusa, S.; De Angelis, M.; Paradiso, A.; Minervini, F.; De Gara, L.; Gobbetti, M. Selection and use of autochthonous mixed starter for lactic acid fermentation of carrots, french beans or marrows. Int. J. Food Microbiol. 2008, 127, 220–228. [Google Scholar] [CrossRef]
  33. Garcia, C.; Guerin, M.; Souidi, K.; Remize, F. Lactic fermented fruit or vegetable juices: Past, present and future. Beverages 2020, 6, 8. [Google Scholar] [CrossRef] [Green Version]
  34. Benhouna, I.S.; Heumann, A.; Rieu, A.; Guzzo, J.; Kihal, M.; Bettache, G.; Champion, D.; Coelho, C.; Weidmann, S. Exopolysaccharide produced by Weissella confusa: Chemical characterisation, rheology and bioactivity. Int. Dairy J. 2019, 90, 88–94. [Google Scholar] [CrossRef]
  35. Farinazzo, F.S.; Fernandes, M.T.C.; Mauro, C.S.I.; Garcia, S. Statistical optimization of exopolysaccharide production by Leuconostoc pseudomesenteroides JF17 from native Atlantic forest juçara fruit. Prep. Biochem. Biotechnol. 2022, 52, 245–252. [Google Scholar] [CrossRef] [PubMed]
  36. Pan, L.; Wang, Q.; Qu, L.; Liang, L.; Han, Y.; Wang, X.; Zhou, Z. Pilot-scale production of exopolysaccharide from Leuconostoc pseudomesenteroides XG5 and its application in set yogurt. J. Dairy Sci. 2022, 105, 1072–1083. [Google Scholar] [CrossRef]
  37. Wongsuphachat, W.; H-Kittikun, A.; Maneerat, S. Optimization of exopolysaccharides production by Weissella confusa NH 02 isolated from Thai fermented sausages. Songklanakarin J. Sci. Technol. 2010, 32, 27–35. [Google Scholar]
  38. Leneveu-Jenvrin, C.; Apicella, A.; Bradley, K.; Meile, J.; Chillet, M.; Scarfato, P.; Incarnato, L.; Remize, F. Effects of maturity level, steam treatment, or active packaging to maintain the quality of minimally processed mango (Mangifera indica Cv. Jose). J. Food Process. Preserv. 2021, 45, e15600. [Google Scholar] [CrossRef]
Figure 1. Boxplot of EPS production, in mg glucose equivalent per plate, for the visual scores of EPS production on MRS plates, for the three strains 21, 56 and 64, three pH levels, 4.5, 5 and 6, and three sucrose content, 5%, 10% and 20%. Three replicates per condition were performed. Visual score of colonies was rated as (0) non-mucoid, (1) slightly mucoid, (2) mucoid and (3) strongly mucoid. Examples of visual scoring are reported with pictures on top of the plot. The line showed the average value of EPS production for each score.
Fermentation 09 00657 g001
Figure 2. Production of EPS per MRS plate for the three strains (W. cibaria 21: grey bars, L. pseudomesenteroides 56: hatched bars, W. cibaria 64: black bars), according to initial pH and sucrose content of the medium. Different lowercase letters correspond to significant differences between conditions within each strain assays (p-value = 0.0002 for strain 21 and <0.0001 for 56 and 64). Different uppercase letters correspond to significant differences between strains (p-value < 0.0001).
Fermentation 09 00657 g002
Figure 3. EPS production in mango purée agar medium, for the strains L. pseudomesenteroides 56, W. cibaria 21 and W. cibaria 64, at initial pH of 5 or 6 and sucrose level of 3.25% (level in diluted purée), 10% or 20%, with or without peptone 2%. Different lowercase letters correspond to significant differences between conditions within each strain assay (p-value = 0.028 for strain 56, 0.008 for strain 21 and 0.142 for 64). Different uppercase letters correspond to significant differences between strains (p-value = 0.0002).
Fermentation 09 00657 g003
Figure 4. EPS production in pineapple juice agar medium, for the strains L. pseudomesenteroides 56 and W. cibaria 64, at initial pH of 4.5, 5 or 6 and sucrose level at 9.6% (level in juice) or 20%. Different lowercase letters correspond to significant differences between conditions within each strain assay (p-value = 0.007 for strain 56 and 0.304 for 64). Different uppercase letters correspond to significant differences between strains (p-value = 0.013).
Fermentation 09 00657 g004
Figure 5. One-dimensional 1H NMR spectra of glucose and sucrose standards and sterile samples (C) from MRS, pineapple juice and mango purée media (pH 6, sucrose: 20% for MRS, 9.6% for pineapple juice and 3.25% for mango purée).
Fermentation 09 00657 g005
Figure 6. One-dimensional 1H NMR spectra in the anomeric region of EPS produced on (A) MRS, (B) mango purée, and (C) pineapple juice media (pH 6, sucrose: 20% for MRS, 9.6% for pineapple juice and 3.25% for mango purée). C: sterile medium, 56: L. pseudomesenteroides strain 56, 64: W. cibaria strain 64.
Fermentation 09 00657 g006
Table 1. Visual score of EPS production for the strains 56, 21 and 64, on fruit-based agar, with pH adjustment to 6 or sucrose addition to reach 20%. Scores were (0) non-mucoid, (1) slightly mucoid, (2) mucoid and (3) strongly mucoid.
FruitModification of ConditionL. pseudomesenteroides 56W. cibaria 21W. cibaria 64
pineapplenonen.d.(1)n.d.n.d.
pH adjusted to 6222
sucrose adjusted to 20%n.d.n.d.n.d.
pH 6 and sucrose 20%333
mangonone222
pH adjusted to 6233
sucrose adjusted to 20%222
pH 6 and sucrose 20%333
papayanone000
pH adjusted to 6000
sucrose adjusted to 20%000
pH 6 and sucrose 20%111
(1) n.d.: not determined.
Table 2. 1H and 13C chemical shifts of saccharide units constituting EPS produced by L. pseudomesenteroides 56 and W. cibaria 64 strains.
Main Saccharide Unit
Protonsδ (ppm)Carbonsδ (ppm)
H14.98C1100.5
H23.58C274.2
H33.73C376.1
H43.52C472.4
H53.91C572.9
H6; H6′3.77; 3.98C668.4
Minor saccharide unit
H15.12C1103.0
H23.55C2
Table 3. α-(1→3)/α-(1→6) linkages in dextran (%) among glucosyl residues obtained from one-dimensional 1H NMR spectra of EPS produced on MRS, mango purée and pineapple juice media (pH 6, sucrose: 20% for MRS, 9.6% for pineapple juice and 3.25% for mango purée). 56: L. pseudomesenteroides strain 56, 64: W. cibaria strain 64.
MRSMangoPineapple
563.23/96.773.74/96.264.33/95.67
6414.68/85.324.64/95.368.59/91.41
Disclaimer/Publisher’s Note: The statements, opinions and data contained in all publications are solely those of the individual author(s) and contributor(s) and not of MDPI and/or the editor(s). MDPI and/or the editor(s) disclaim responsibility for any injury to people or property resulting from any ideas, methods, instructions or products referred to in the content.

