Article

Formulation of a Gluten-Free Carob-Based Bakery Product: Evaluation of Glycemic Index, Antioxidant Activity, Rheological Properties, and Sensory Features

1
Department of Pharmacy, Health and Nutritional Sciences, University of Calabria, 87036 Rende, Italy
2
Department of Bioscience and Technology for Food, Agriculture and Environment, University of Teramo, 64100 Teramo, Italy
3
Ionian Department of Law, Economics and Environment, University of Bari Aldo Moro, 74123 Taranto, Italy
4
Department of Chemistry and Chemical Technologies & UdR INSTM, University of Calabria, 87036 Rende, Italy
5
Interdisciplinary Department of Medicine, University of Bari Aldo Moro, 70125 Bari, Italy
6
Department of Experimental and Clinical Medicine, University of Catanzaro ‘Magna Græcia’, 88100 Catanzaro, Italy
7
Department of Medical and Surgical Science, University of Catanzaro ‘Magna Græcia’, 88100 Catanzaro, Italy
*
Authors to whom correspondence should be addressed.
Fermentation 2023, 9(8), 748; https://doi.org/10.3390/fermentation9080748
Submission received: 25 June 2023 / Revised: 9 August 2023 / Accepted: 10 August 2023 / Published: 12 August 2023
(This article belongs to the Special Issue Fermented Foods for Boosting Health)

Abstract

:
A baked gluten-free pastry was formulated using milk kefir, rice, and different amounts of carob pulp flour, i.e., 20% (B1) and 40% (B2). In all cases, B2 showed the most remarkable antioxidant properties in terms of total phenolic, phenolic acid, and flavonoid content, as well as scavenging activity both in aqueous and organic media. This trend was observed over a 6-day storage time. Lower cohesive interactions among dough aggregate domains were recorded as the carob pulp flour amount increased. At the same time, rigidity decreased in the order B0 > B1 > B2 as confirmed by lower textural properties shown by the carob-added samples. Sensory analysis recorded overall acceptability for both B1 and B2, with sweetness, cocoa, gingerbread, and rye aroma as predominant descriptors. The glycemic index determination confirmed a better score for B2 and revealed a medium GI value (62), in comparison with high GIs recorded for B1 and B0 (115 and 100, respectively).

1. Introduction

The number of people suffering from gluten-related disorders (GRD) has increased dramatically in recent years with an incidence of about 5% at the global level [1]. These pathologies are usually related to celiac disease (CD), dermatitis herpetiformis (DH), gluten ataxia (GA), non-celiac gluten sensitivity (NCGS), and wheat allergy (WA). Triggered by the consumption of gluten-containing foods (wheat, barley, and rye and other grains such as oat, triticale, and spelt), they are all classified as autoimmune diseases, except WA showing food allergy symptoms [2]. Although CD, DH, GA, and WA have been widely studied and elucidated, not a lot of information is available on the mechanisms involved in NCGS pathogenesis and diagnosis. Usually, after gluten consumption, patients show CD-like gastrointestinal symptoms combined with one or more extra-intestinal manifestations, including fatigue, lack of well-being, headache, foggy mind, anxiety, joint/muscle pain, anemia, weight loss, dermatitis, and skin rash, among others [3]. Once CD and WA pathologies are excluded, gluten banishment allows the symptoms to be eased. Moreover, irrespective of the specific pathology, every GRD needs lifelong gluten removal under strict nutritional control [4], although, depending on the specific disorder, diet restraints can be modified accordingly.
As a gluten-free (GF) diet is the only way to avoid the outbreak of GRD symptoms, adherence to this nutritional regimen involves the consumption of naturally GF foods (GF cereals, pseudocereals, fruits, vegetables, pulses, meat) and/or products specifically formulated for such a purpose. In this light, the food industry has put in great effort to improve food technologies and diversify GF products in a bid to fulfill any possible individual need [5]. This led to an impressive growth of the GF market, reaching about USD 5.9 billion on a global scale in 2021 with a forecast compound annual growth rate (CAGR) of 9.8% from 2022 to 2030 [6]. More recently, the demand has been further fueled by many healthy individuals who, during the recent pandemic, embraced a GF diet as a result of assumed health-promoting effects [7].
Among food products, baked goods are obviously the most consumed GF foods; bread leads the way, along with cakes, biscuits, pastries, pasta, and breakfast cereals. However, owing to more sophisticated technologies and empowered distribution channels, other products are now growing rapidly, including GF baby foods and extruded and annealed GF products [5,6]. However, among the plethora of GF foods, a great variability has been reported in their nutritional, sensory, and overall quality features, leading to difficult choices from a consumer point of view. Moreover, in many supposed GF foods, gluten can be hidden as a minor or a functional ingredient. In this regard, to support European consumers, Regulation 609/2013 defined specific GF products’ composition and labeling requirements [8]; at the same time, the Food and Drug Administration (FDA) stated that products could claim to be GF if the gluten concentration does not exceed 20 ppm [9]. This is easier said than done as GF diet compliance must overcome other difficulties including high prices, limited availability, psychological concerns, and possible negative effects on social behavior and quality of life [10].
The health, social, and economic implications of GF products have drawn the attention of the food industry and researchers to the proper design and formulation of these products. However, when approaching the task, two main issues cannot be overlooked: nutritional suitability and technological/sensory viability [11]. Considering the first aspect, there is a general consensus about some composition-related drawbacks of GF foods, especially if they are not fortified [4]. These can be ascribed to higher levels of fats, carbohydrates, sugars, fermentable oligosaccharides, disaccharides, monosaccharides, polyols (FODMAPs), and sodium [4,12]. At the same time, wheat replacement with rice or corn flours can result in fiber, protein, folate, iron, potassium, and zinc deficiencies, as well as in a higher glycemic index (GI), the latter increasing the incidence of metabolic syndrome and cardiovascular diseases among CD-suffering people [12,13].
From a technological point of view, gluten removal also poses severe limitations in the management of baked GF products [14]. In gluten-containing foods, water addition, kneading operations, and oxygen entrapment allow the development of a viscoelastic gel able to support volume, shape, and texture along with shelf life and organoleptic features [15]. Although many attempts have been carried out to mimic gluten features and related effects, the obtained outcomes are still far from satisfying. They generally include the use of different GF ingredients (different flours and starches, proteins, hydrocolloids, enzymes, fibers, fats, among others) [16] and/or the exploitation of cutting-edge technologies (high hydrostatic pressure; microwave, infrared, ohmic, or hybrid heating methods; extrusion; active packaging; sourdough fermentation) [17]. Overall, baked GF products, and bread in particular, have been proven to show much worse overall quality characteristics, other than consumer preference, in comparison to their gluten-containing counterparts [5].
In this context, we decided to formulate a new sweet-baked GF product, based on our previous encouraging research, in which kefir enriched with a carob leaf extract was added during a GF bread-making process. It was found that kefir addition to rice flour improved both the mechanical and nutritional values of the obtained product. Moreover, the presence of the carob leaf extract also imparted antioxidant properties on the GF bread [18].
Many studies have been carried out on carob pod (90% pulp, 10% seed) extracts [19] and their application for food formulations. In addition, other authors used carob pulp flour (CPF) with rice flour to decrease the total GI and add nutritional value and health-promoting effects. In fact, it has been proven that CPF is rich in fiber, potassium, phosphorus, protein (caroubin), inositols, as well as cocoa’s aroma compounds (furans, esters, and pyrroles) which come about during fruit roasting by caramelization and Maillard reaction [20]. It follows that carob-based products are natural sweeteners widely used as a healthier substitute for chocolate. Moreover, they are considered to be vegan, GF, and indicated for low-sodium diets. At the same time, carob-based products, as well as food fortified with carob extracts, also exerted important biological effects, including mitigation of gastrointestinal diseases, diabetes, hyperlipidemia, inflammation, and oxidative stress [21].
In this work, a sweet baked product was chosen as GF cakes are widely consumed and are generally more appreciated by patients than GF bread [15]. It is well known that in the case of cakes and biscuits, the negative technological impact of gluten replacement is less severe [22]. In the present study, a CPF was used at two different addition levels (20 and 40%), as a partial substitute for rice flour. On the other hand, kefir was used to partially replace water, to exploit its unique nutritional and functional properties [23,24]. Rheological, sensory, and antioxidant characteristics of the final product were analyzed, and their GIs were measured by in vivo clinical evaluations. To the best of the authors’ knowledge, this is the first attempt to use such a formulation to design a new GF-baked product with a low GI and valuable organoleptic and antioxidant properties.

2. Materials and Methods

2.1. Chemicals and Reagents

Folin–Ciocalteu reagent, sodium carbonate, 2,2′-diphenyl radical-1picrylhydrazyl (DPPH), radical 2,2′-azino-bis (3-ethylbenzothiazolin-6-sulfonic) (ABTS), sodium carbonate, sodium nitrite, gallic acid, catechin, aluminum chloride, hydrochloric acid, sodium hydroxide sodium molybdate, and ascorbic acid were purchased from Sigma Aldrich (Sigma Chemical Co., St Louis, MO, USA). Chlorogenic acid was purchased from Phytolab (Aprilia, Noale, Italy). HPLC-grade water was supplied by Merk Life Science S.r.l. (Milan, Italy). Other chemicals and reagents used in this study were purchased from Merck (Darmstadt, Germany) and VWR International (Milan, Italy) and, unless specified otherwise, were of analytical grade or higher.

2.2. Characterization of Carob Pulp Flour

The carob pulp flour (Amele cv) was provided by Masseria Agricola Olère (Contrada San Salvatore, 10, 40017 Ostuni, Brindisi, Italy). Its main nutritional facts are summarized in Table 1.

2.2.1. Total Content of Polyphenol Compounds

The organic carob pulp flour was characterized to quantify total phenolic content (TPC) by using Folin–Ciocalteu reagent following a slightly modified protocol from the literature [24]. An aqueous solution (1.0 mL) of carob flour (1.0 mg mL−1) was added to the Folin–Ciocalteu reagent (6 mL) and an aqueous solution (3.0 mL) of Na2CO3 (2% w/v). The solution was subjected to stirring in the dark for 2 h and then the absorbance was spectrophotometrically measured at 760 nm (Evolution 201 spectrophotometer (Thermo Fisher Scientific, Hillsboro, OR, USA)), against a control prepared including all of the reagents except the sample replaced with purified water. The result was expressed in milligrams of gallic acid (GA) per gram of dry sample (mg GA/g dry sample). A calibration curve was constructed using aqueous solutions of gallic acid (8.0–40.0 µM).

2.2.2. Phenolic Acid Content

The assessment of the phenolic acid content (PAC) in the carob pulp flour was performed by employing the Arnov test with some modifications [25]. An aqueous solution (1.0 mL) of carob flour (1.0 mg mL−1) was added to HCl 0.5 mol L−1 (1.0 mL), NaOH (1.0 mL, 4.0% w/v), Arnov’s reagent (1.0 mL of sodium nitrite 0.1 mg mL−1 and sodium molybdate 0.1 mg mL−1), and purified water up to 10 mL. The absorbance was spectrophotometrically recorded at 490 nm. The PAC value was expressed as milligrams of gallic acid per gram of sample (mg GA/g sample), after having carried out the relative calibration line.

2.2.3. Flavonoid Content

Flavonoid content (FC) in the carob pulp flour was spectrophotometrically determined by a methodology reported in the literature with some adjustments [18]. An aqueous solution (0.5 mL) of the carob flour (1.0 mg mL−1) was mixed with NaNO2 aqueous solution (0.15 mL, 15% w/v) of purified water (2.0 mL). After 6 min, AlCl3 solution (0.15 mL, 10% w/v) was added and, subsequently (after 6 min), NaOH (3.0 mL, 4% w/v) and purified water up to 5 mL were added. After 15 min under darkness, the absorbance of the solutions was spectrophotometrically recorded at 510 nm. The recorded result was expressed as milligrams of catechin (CT) per gram of sample (mg CT/g sample).

2.2.4. Antioxidant Performances

Free radical scavenging properties of the carob pulp flour were estimated toward ABTS (2,20-azinobis (3-ethylbenzothiazoline-6-sulphonic acid)) and DPPH (2,2-diphenyl-1-picrylhydrazyl) radical specie.
To evaluate the scavenging effect of the carob flour, an aqueous solution (0.5 mL, 0.01–0.1 mg mL−1) of the sample was mixed with an ABTS radical solution (2.0 mL) and the mixture was incubated for 5 min at 37 °C; then, the absorbance was spectrophotometrically determined at 734 nm [26].
The scavenging effect was evaluated in an organic environment by adding an aqueous solution of carob flour (5 mL, 0.01–0.1 mg mL−1) to an ethanolic solution of DPPH (5.0 mL, 200 µmol L−1) and the mixture was kept at 25 °C for 30 min. The outstanding concentration of the lipophilic radical was spectrophotometrically estimated at 517 nm [27].
The percentages of inhibition of both the radical species were estimated according to the following formula:
Inhibition (%) = (A0 − A1)/A0 × 100
where A0 is the absorbance of the control prepared under the same conditions using purified water or ethanol and A1 is the absorbance of the sample. The scavenging activity of the sample was expressed in terms of IC50. Ascorbic acid was used as a positive control.

2.3. Preparation of Milk Kefir

In a single-neck glass flask, 800 mL of pasteurized whole milk and 80 g of kefir grains KEFIRALIA (Burumart Commerce S.L, Arrasate, Spagna) were mixed. The suspension, covered with a cotton napkin, was stored at 25 °C for 24 h and then the fermented milk was stored at 25 °C for a further 24 h.

2.4. Carob Flour-Based Bakery Product: Preparation and Sampling

The baked product was prepared by following a procedure reported in the literature with some modifications [28]. A straight dough process was performed using different flour mixing based on rice and carob pulp flours (180.0 g), cornstarch (20.0 g), yeast (12.0 g), salt (2.0 g), milk kefir (150.0 mL), and water (5.0 mL). Specifically, three different formulations were prepared by employing a rice flour/carob flour (w/w) equal to 3.50 (labeled B1) and 1.25 (labeled B2). A dough, acting as a control, was also prepared by using only rice flour (preparation B0). In the preparation of the dough, the flours and the cornstarch were previously dry mixed. Each dough was prepared by mixing the ingredients for 20 min using a planetary mixer (speed 2) at 25 °C. The lyophilized yeast was first solubilized in water, while other ingredients were gradually added during the mixing. After obtaining the dough, it was placed in the fridge, covered with a transparent film, and left to rest overnight. Then, the dough was taken from the fridge and left to rest at room temperature for at least 6 h. Finally, loaves were shaped and left to rest for another 2 h at room temperature. The oven was preheated for 30 min and the doughs were then baked at 200 °C for 30 min, with 10% relative humidity. Three experimental replicates for each formulation were tested. Two hours after baking, samples were stored at 20 °C in polyethylene bags to evaluate their stability. Rheological and antioxidant features of the products were evaluated at different storage times (1, 4, and 6 days), keeping the sample at 20 °C in polyethylene bags.

Water Activity and pH Determination

The water activity (aw) values of baked products were obtained with an Aqualab 4 TE kit (Court Pullman, WA, USA). Values of pH were taken with a pH meter (model 2500 L, VWR, Milan, Italy). All values were measured in triplicate.

2.5. Antioxidant Characteristics of Carob Flour-Based Bakery Product Samples

The baked samples (B0, B1, and B2) were analyzed in terms of antioxidant properties after 1, 4, and 6 days using a procedure reported in the literature [25]. In a standard procedure, 5 g from each sample was defatted with n-hexane (150 mL at 70 °C for 20 min). The organic fraction was decanted, and the defatted sample was extracted with 40 mL of a mixture (70% methanol, 29.7% water, and 0.3% formic acid) at 70 °C for 45 min under stirring, then filtered, evaporated, and dried under vacuum to constant weight and stored at 4 °C until the analyses were carried out. The extracts were evaluated in terms of TPC, PAC, FC, and scavenging activity against hydrophilic (ABTS) and lipophilic (DPPH) radical species at different storage times (1, 4, and 6 days), following the procedure previously described.

2.6. Rheological Characterization of Dough and Bakery Product Samples

2.6.1. Dynamic Rheological Tests

The rheological measurements of the freshly prepared dough before leavening were carried out using a strain-controlled rheometer RFS III (Rheometric Scientific Inc. at Piscataway, NJ, USA) with a plate/plate geometry (gap 2.0 ± 0.1 mm, diameter 25 mm). Dynamic rheological tests (frequency experiments sweep) were performed at 25 °C, with a 0.1% strain determined by strain-sweep experiments to ensure that they were in the linear viscoelasticity regime.

2.6.2. Dynamic-Mechanical Analyses

The rheological measurements of the final samples were carried out by means of a dynamic-mechanical analyzer (DMA) with plate/plate geometry (40 mm). Force vs. deformation (displacement) rheograms were recorded. A controlled force (from 0.1 N to 25 N) was applied at room temperature (25 °C) and the deformation of the sample was determined. The rheological test was performed on the final products, sampled after 1 and 6 days of storage (at 20 °C in polyethylene bags).

2.7. Sensory Analysis

Samples were evaluated by means of quantitative descriptive analysis (QDA) for five classes of descriptors grouped as appearance, odor, flavor, taste, and textural properties. All terms for describing the samples were evaluated and chosen according to recent literature reviews [29,30]. A panel group of seven women and three men from twenty-five to fifty years old (29.8 y.o average age of panelists) was trained for evaluation of the quality assessment of gluten-free bakery products. So, panelists were recruited and their ability to distinguish odors and tastes was evaluated, then they were trained for vocabulary development through a series of triangular tests as reported in ISO 8586:2012 [31]. Training duration was 80 h, including familiarization with relevant descriptive terms, and intensity scales use ISO 4121:2003 [32].
Celiac and non-celiac subjects do not differ in their sensory description of gluten-free bread, as their preferences are based on the same sensory attributes [33]. According to de Kock and Magano, specific considerations to conduct the training of panelists and on questions to deliver were carried out [34]. Panelists were asked to taste bakery products simultaneously. Equal slices of products were served on a white dish. Panelists were provided with individual templates, where descriptors were grouped per section. Intensity scales were used; values ranged from 1 to 5. Here, 1 stands for the absence of the attribute while 5 is the maximum rate. Samples were obtained from 180 g loaves cooked on the same day of the sensory test to provide products at their highest qualitative state. Samples were codified with random numbers to avoid external influences on the liking rating of panelists. All sensory tests and training sessions were carried out in the sensory laboratory of the University of Teramo, which fulfills the required standards for these analyses according to ISO 8589:2007 [35].

2.8. Determination of Glycemic Index

The glycemic index (GI) was determined by feeding each food sample to 5 healthy individuals, according to the method of Wolever et al. [36]. The selected subjects were healthy, non-smokers, not pregnant or diabetic, and they had a body mass index of less than 25 kg/m². The study began in the morning after an overnight fast by the subjects. A fasting blood sample was taken at 0 min; subjects consumed one of the three samples (B0, B1, and B2) containing 50 g of carbohydrates in a comfortable place and this was repeated on three different days for each sample. Blood glucose values were taken at 15, 30, 60, 90, and 120 min through the sensor applied on the back of the upper arm (Freestyle Libre 2, Abbott). The glycemic index was calculated as the incremental area under the glucose response curve (IAUC), ignoring the area below the baseline, and was calculated geometrically [37]. The calculated IAUC for each test meal consumed by each subject was expressed as a percentage of the mean IAUC for the standard food consumed by the same subject as follows [37].
GI = Incremental blood glucose area of test food/Incremental blood glucose area of reference food × 100

2.9. Statistical Analysis

Statistical significance was assessed using analysis of variance (ANOVA) with the LSD (least significant differences) test multiple comparison analysis using XLSTAT software version 2019.1 for Microsoft Excel (Addinsoft, New York, NY, USA). All results were considered statistically significant at p < 0.05.

3. Results and Discussion

3.1. Antioxidant Properties of Carob Pulp Flour

Antioxidant properties of the CPF were evaluated by spectroscopic tests and the results are reported in Table 2.
Specifically, the Folin–Chiocalteau test returned a TPC value of 50.94 mg GAE g DW−1, almost one order of magnitude higher compared to the value recorded in the carob seed flour (8.1 mg GAE g DW−1) [38]. Total polyphenol compounds in the carob flour are mainly phenolic acids (3,4-dihydroxybenzoic, 4-hydroxybenzoic, caffeic, coumaric, cinnamic, ellagic, gallic, and syringic acids) and flavonoid molecules (catechin, epicatechin gallate, epigallocatechin, and different flavonol glycosides involving quercetin and myricetin) [39]. However, it was observed that, as in the carob pulp, variety and genotypes within a plant species caused a significant variation in the phenolic profile [40]. In our research, carob pulp flour returned a total phenolic acid content equal to 10.89 mg GAE g DW−1, corresponding to 21.4% of total phenolic compounds. Similarly, an important correlation between phenolic content and scavenger activity was recorded, due to the high capacity of the carob pulp flour to inhibit radical species both in organic (against DPPH radical) and aqueous (against ABTS radical) environments, confirming the data reported in the literature [41,42,43].

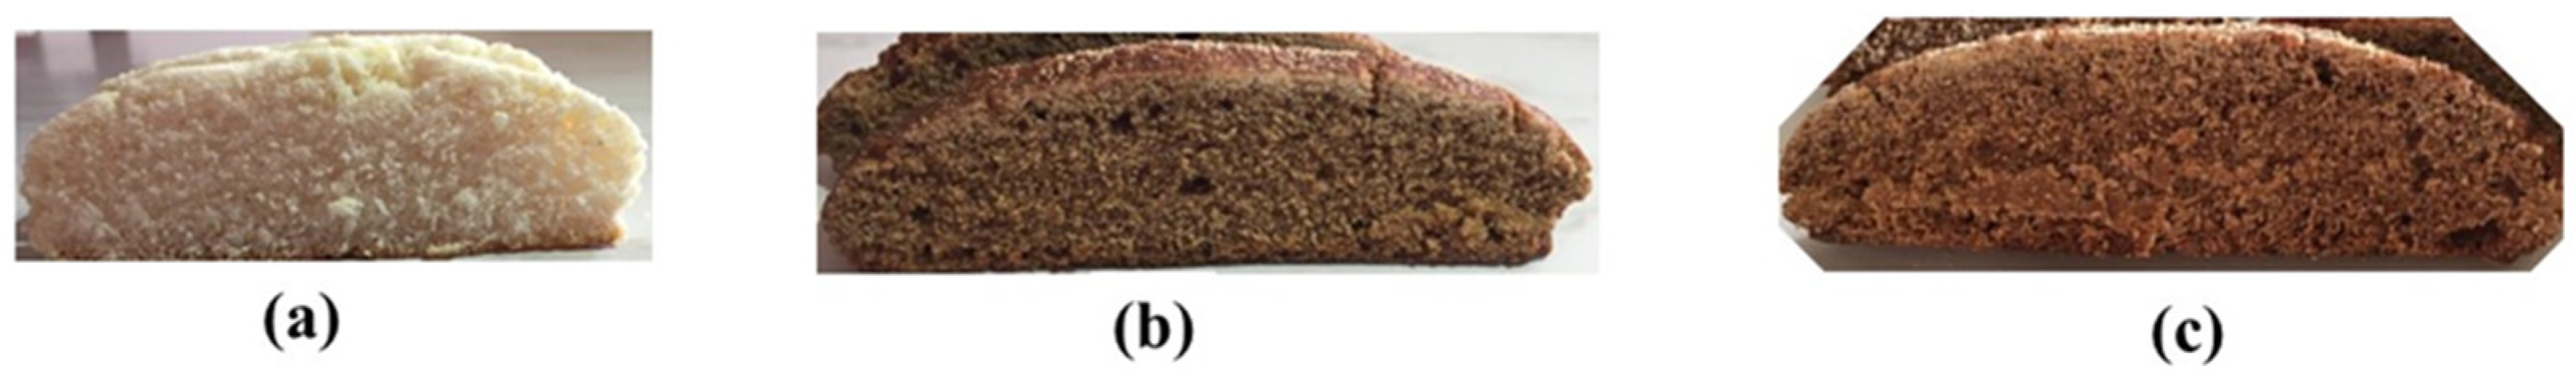
3.2. Carob Flour-Based Bakery Product Preparation

Carob pulp represents a mixture of micro- and macronutrients, such as vitamins and minerals, carbohydrates, and secondary metabolites, with remarkable biological features. Carob pulp displays similar organoleptic, nutritional, and biological properties to cocoa, with the advantage of being a theobromine- and caffeine-free food with low-fat content [44]. Three different gluten-free bakery products were formulated, employing rice and carob flours. The maximum ratio (w/w) between the two flours was equal to 3.25 and two different formulations in which carob flour represented about 20% (B1) and 40% (B2) (w/w) of the whole dough were prepared (Figure 1b,c). As a control, a formulation only containing rice flour was evaluated (Figure 1a).
In the proposed formulation, a key role is played by milk kefir because data from the literature suggested that the addition of kefir to gluten-free dough had a positive effect on the volume of the loaf, moisture of the crumb, color of the crust, and porosity [28]. As previously described [18], kefir was successfully employed in the preparation of bakery products by almost completely replacing the water in the dough to produce gluten-free final products able to retain their mechanical features over time. The lack of gluten in bakery products is a technological challenge due to the lower resistance to hardening compared to goods prepared by hiring wheat flour [45]. However, this inconvenience can be overcome if the network behavior of gluten can be imitated by employing suitable and innovative sources of proteins, polysaccharides, and minerals, such as dairy dry powders [46]. To maximize the amount the kefir in the dough, different attempts were performed, and a percentage of kefir of around 35% made it possible to produce a workable dough before baking.
The fermentation process was followed by measuring pH values at each step of the dough obtention (Figure S1). Data showed a little difference among doughs at the beginning (4.76 ± 0.02, 4.72 ± 0.03, and 4.62 ± 0.04, for B0, B1, and B2, respectively). During 12 h of refrigerated fermentation, CPF doughs had a different behavior from the control, registering a weak increase with respect to the initial point. Probably the presence of fibers and other compounds slower fermentative phenomena. In further measures, all samples reduced the pH, arriving at the final point (20 h, in total) at values of 4.63 ± 0.01, 4.59 ± 0.01, and 4.56 ± 0.05, for B0, B1, and B2, respectively. The utilization of kefir milk and yeast makes pH values more similar to common sourdough breads (ranging from 3.5 to 4.5) known as tangy and characteristic flavored, and more stable to starch retrogradation and other deteriorative phenomena [47].
A difference in air dispersion is notable from Figure 1, reporting the longitudinal section of samples B0 (a), B1 (b), and B2 (c). Probably the different final pH of B1 and B2 affected the network formation in the dough, resulting in a less compact product. In this, the specific composition of CPF can have a role too. Finally, a significant difference in air bubble dispersion was confirmed by a panel test. In the next lines, more explanations are given (see Section 3.2 and Section 3.4).

3.3. Rheological Characterization of Dough and Baked Samples

The viscoelastic properties of three doughs (B0, B1, and B2) were analyzed by small amplitude oscillatory experiments at a temperature of 25 °C. The storage and loss moduli as a function of frequency are shown. All samples exhibit a viscoelastic response typical of strong gel-like materials (G′ > G″); storage and loss modulus functions are only slightly dependent on frequency and reveal a multiple relaxation process [48,49]. In addition, it is to be noted that dough with a higher percentage of carob flour (sample B2) shows lower values of storage and viscous moduli within all frequency ranges investigated. Figure 2 clearly shows that the trends of carob flour samples are similar and sample B2 is significantly lower than the other preparations. This behavior suggests a remarkable decrease in the cohesive interactions among dough aggregate domains when the amount of carob flour is increased.
Cohesive interactions are very important for stabilizing the solid–air emulsions, and they refer to the integration among components in the dough matrix [50]. During the dough production (fermentation and leavening steps) it is important for the greatest interaction to have a well-established network that will characterize the final cooked product. In gluten-free products, cohesive interactions are minimized, so in bakery products, gums have been used to improve dough performance, bread, and cake quality characteristics, and extension the products shelf life; Furthermore, many studies tested the effect of locust bean gums and/or other hydrocolloids on the rheological, physicochemical, textural, and sensory properties of gluten-free breads and cakes [51]. Regardless, to recover by-products from locust bean gum production, carob pulp flour can also be employed in these formulations.
Besides a decreased value of interactions in the dough, carob pulp addition results in firmer consistency and longer development time [52]. Moreover, final products can have an improved specific volume, increased dietary fiber content, and reduced crumbliness. These features can greatly ameliorate the performances and acceptability of gluten-free leavened products, even if this ingredient cannot be considered an absolute substitute for gluten.
The analysis of the trend force vs. displacement strongly shows differences in terms of mechanical properties during the storage of the final products (Figure 3).
In Table 3, the slopes of the mechanical profiles of the three sample products after 1 and 6 days of storage are reported.
The slopes indicate the Young modulus, which translates to the stiffness of the material. The value of the slope can be related to the rigidity of the material. Higher values reflect higher rigidity [18]. The control sample shows the highest slope, and this is constant with time. The effect of carob flour is quite evident. The increase in the dosage of the carob flour in the preparation decreases the rigidity of the baked products; this is immediately visible. Additionally, it is worth noting that after 6 days of storage, the rigidity increases in the samples containing carob pulp flour, and the behavior seems to be dependent on its amount. It is reasonable to suppose that carob pulp flour has an effect on the higher retention of humidity in experimental samples. The aw values detected immediately after cooking are similar for B1 (0.889 ± 0.007) and B2 (0.886 ± 0.008) and higher than the control (0.858 ± 0.005), directly affecting the final rigidity of the products. It is in fact well known how fibers and sugars behave as plasticizing agents [53,54].

3.4. Antioxidant Characterization of Baked Samples

The antioxidant performance of the gluten-free bakery products was evaluated as a function of time (up to 6 days), and the results are reported in Table 2. Data from the literature clearly displayed that fermentative processes, as well as cooking steps, should deeply affect the antioxidant properties of the bakery products, and remarkable modification of the polyphenol profile could occur [55,56]. These findings suggest performing a detailed evaluation of the total polyphenol content, as well as the scavenger activity against hydrophilic and lipophilic radicals of the prepared cooked products.
The data clearly show that the amount of carob pulp flour in the dough deeply influenced the TPC, as well as the PAC and FC values of the final bakery products. In particular, B2 displayed a TPC 64.0% higher compared to B1, while this increase was equal to 50.4% and 52.9% for PAC and FC values, respectively. This trend was substantially confirmed during the storage time, with a slight reduction (lower than 15%) recorded for all parameters after 6 days. The data are in the same order of magnitude as the values recorded for a sample of pasta containing 10% (w/w) carob flour [57]. The same measurements performed on the control sample (B0) returned a detectable result only in the case of TPC. However, the recorded TPC values are almost one order of magnitude lower compared to the sample containing carob pulp flour, and this was a result of the contribution of the non-phenolic reducing agents, such as sugars, present in the dough [58]. PAC and FC values under the limit of detection clearly confirmed this finding, as well as the absence of any scavenger activity both in organic and aqueous environments. On the contrary, carob pulp flour-based bakery products displayed a remarkable scavenger activity related to the amount of carob flour in the dough and the storage time of the products. Specifically, the B2 sample exhibited a higher scavenger activity than B1, and both samples returned IC50 values lower in the aqueous environment against ABTS radical than in the organic one against the DPPH specie. The measurements performed during the storage time displayed a loss of the antioxidant performances of both samples, more evident in the organic medium (−61.5%) than in the water-based environment (−17.8%).

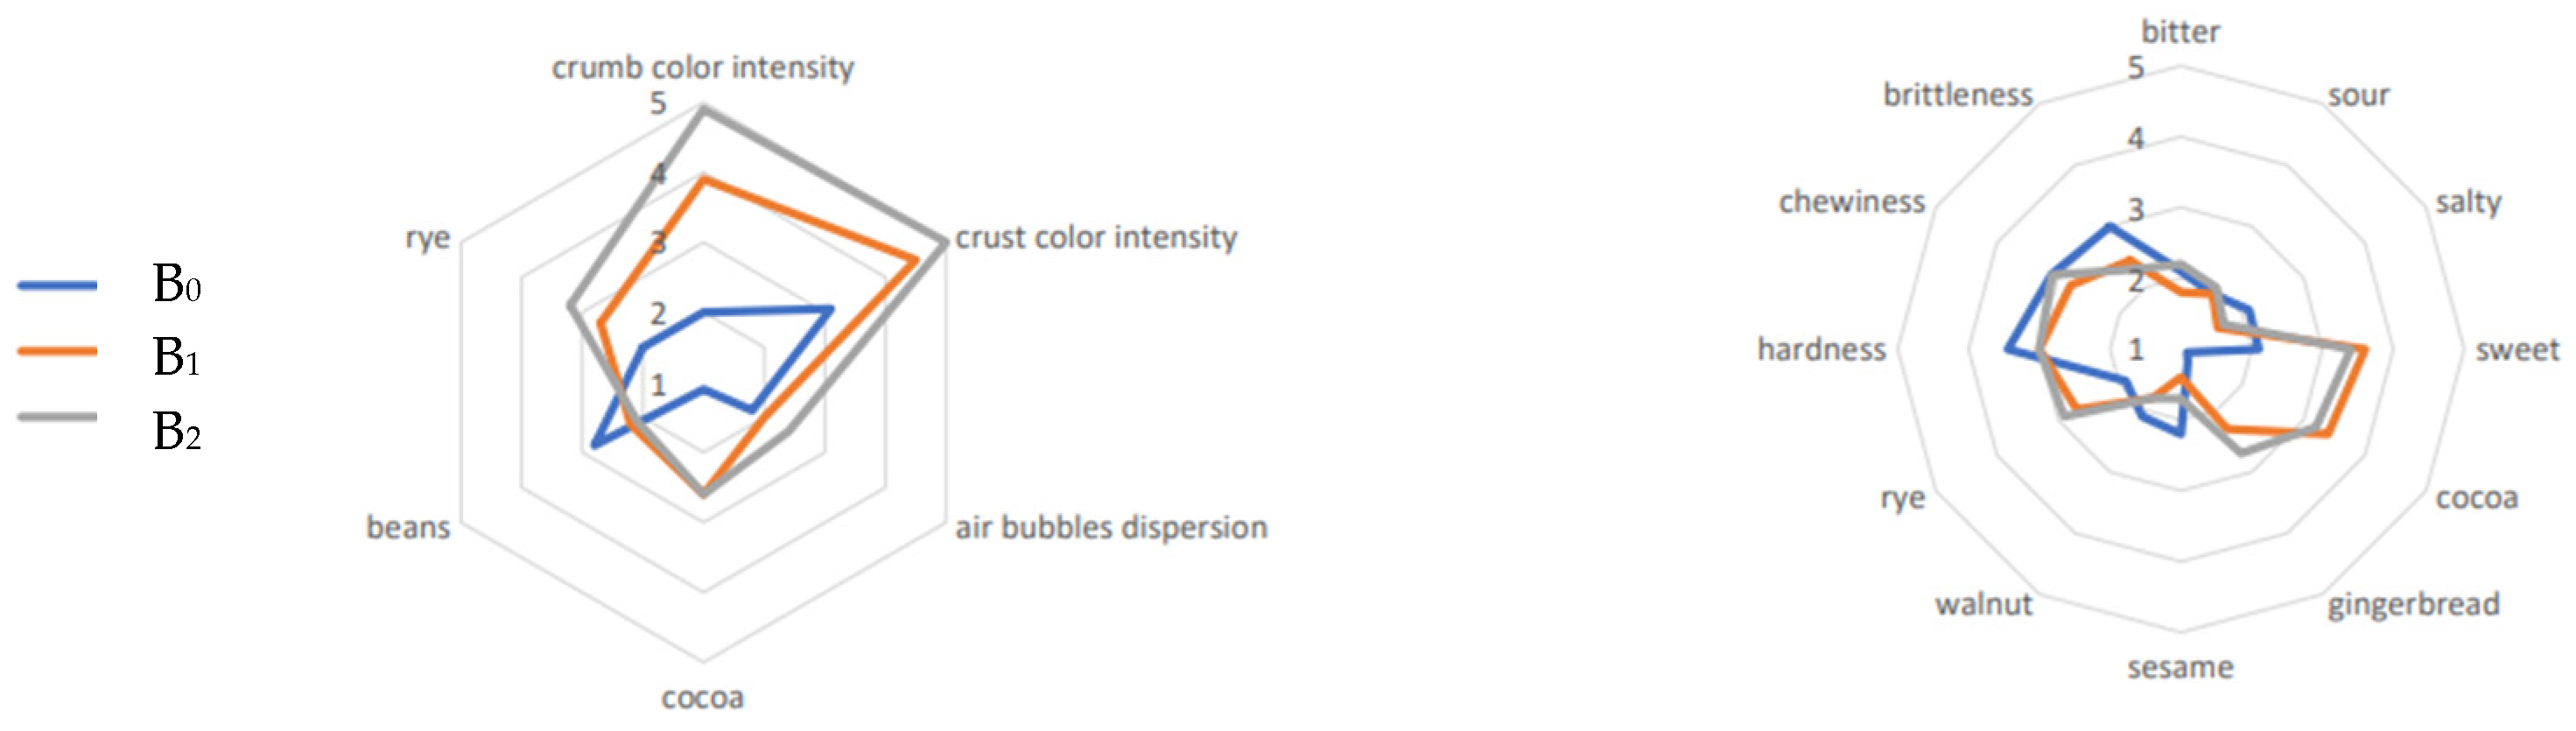
3.5. Sensory Analysis

Descriptive sensory analysis (QDA) results of the investigated samples are shown in the radar plot form of Figure 4. The panel described the samples with 18 sensory terms and statistically significant differences were found. Figure 4 shows the mean values assigned to the attributes by the panelists (for all data, see Additional Material, Table S1).
As expected, the high coloring power of carob pulp flour significantly affects the appearance of the two experimental samples with respect to the control [30]. Despite this, it seems that panelists appreciated both carob-containing products since their score for overall acceptability was statistically similar (unpublished work). However, standard acceptability tests with more and more consumers should be performed to assess sensory acceptability results. On the basis of the one-way ANOVA, significant differences (p < 0.05) were observed for most descriptors of appearance and odor (olfactive analysis), with a significantly higher increase in score by increasing the percentage of carob flour (Figure 4a), except for bean odor. Panelists assigned scores for air bubble dispersion and slight significant differences were found; these results may be correlated with a different cohesive interaction, as discussed previously (see Section 3.2); in any case, an effective leavening activity was evident in all investigated samples.
Concerning taste and flavor analyses (Figure 4b), sweetness, cocoa, gingerbread, and rye aroma were significantly higher in samples with 20 and 40% carob pulp flour (similar among them). Some authors reported that carob flour may be substituted for some goods without a perceivable change in flavor [29,59]. Moreover, Issaoui et al. (2021) looked for different recipes for innovative breads with carob flour, finding an interesting volatile compound fingerprint [60]. Breads made with carob pulp flour give a complex aroma where fruity and cheesy volatile esters evolve into nutty, roasted, cocoa and cinnamon odors thanks to fermentation and baking. Rye flour’s odor is characterized by aldehydes and esters described as waxy, musty, green, and fruity [61]. Sourdough fermentation and baking results in a toasty, acid, and cocoa-like aroma that is somehow linked to carob pulp flour formulations here tested. Similar descriptors were also found by Antoniou et al. (2021), who tested carob pod flour at different ripening stages [62]. Fruity, waxy, cheesy, and cocoa-like signs are even here the most tracked descriptors.
Textural properties were tested by chewing and hardness and brittleness scored lower values than the control, in accordance with the mechanical properties observed by means of rheological measurements (see Figure 3).
Our sensory results demonstrated that carob pulp flour may be employed as a valuable ingredient for the formulation of sweet newer bakery products, more than bread. An appropriate shape and size in manufacturing and the perfect serving (slices of different shapes and weights), could give a varied offer of gingerbread-like products (e.g., Dijon pain d’épice) lower in calories, gluten-free, with acceptable texture and sensory attributes.

3.6. Determination of Glycemic Index

Table 4 shows the GI and classification of the three samples tested. Our results showed that GI values ranged from 115 to 62, which classified them as high glycemic index foods in sample B1 and medium glycemic index foods in sample B2. Sample B2 had the lowest GI value (62), while sample B1 had a higher mean value (115) compared to sample B0 (100), but without a significant difference (Table 4).
Table 5 shows the IAUC for the three samples. Significant differences were found in the IAUC between B0 and B2. The lower glycemic index of sample B2 could be linked to the higher content of carob flour compared to sample B1.
Epidemiological studies have widely shown that the daily consumption of foods with a high glycemic index is correlated with the risk of developing cardiovascular disease, insulin resistance, diabetes, and obesity [63,64,65]. GF products often have a higher GI than gluten-containing products [66,67]. Nowadays, it is an area that receives little attention in research. The presence of gluten in foods is able to inhibit the hydrolysis rates of starch in the small intestine, and, therefore, its elimination from foods can increase the glycemic response to carbohydrates [68]. These results are relevant for individuals with CD because of the prevalence of type 1 diabetes in this population than in the general population [69]. Among the different types of flour used in G-F products, corn, and rice flours are the most suitable for the gelatinization process, but they have a high GI. Our GI determination showed that sample B2 has a medium GI, this could be due to the higher locust bean flour content compared to sample B1, which showed a high GI. Therefore, the consumption of GF products with a medium/low glycemic index, such as sample B2, could improve the health status of many subjects (with celiac disease, allergies, diabetes, and other ailments) via the consumption of healthy foods.

4. Conclusions

The formulation of GF products presents a huge task from technological and nutritional points of view. In this regard, the present study provides data on the technological performance and nutritional and functional aspects of a carob pulp flour-based bakery product. CPF could be considered as a partial substitute for rice flour, helping to mitigate the complex problem of limiting the glycemic index (especially for gluten-free bakery foods). As rice flour shows a high GI, its replacement should be advised, although low levels of substitution could not achieve the goal. In fact, the data showed that only the 40% CPF sample was able to reduce the GI of the final product to a significant amount, in comparison to the control. Owing to the presence of several valuable bioactive compounds, the addition of CFP during baking also conferred antioxidant and scavenging properties on the product, mostly kept over 6 days storage time. Additionally, the sensory analysis provided encouraging results for both CPF levels used, with appreciable taste and aroma and acceptable texture and sensory attributes. The obtained data are the starting point of a deeper study to comprehend how to enhance the best newly formulated bakery product to meet consumers’ quality and nutritional needs. In this regard, further studies will be necessary in order to evaluate actual consumers’ acceptance of these kinds of products.

Supplementary Materials

The following supporting information can be downloaded at: https://www.mdpi.com/article/10.3390/fermentation9080748/s1, Figure S1: Behaviour of pH value during dough preparation of the samples B0 (blue line), B1 (orange line) and B2 (grey line).; Table S1: Results of qualitative descriptive analysis (QDA) assessed for visual, olfactive, taste, flavor, and textural analyses of bread samples (A, B, C).

Author Contributions

Conceptualization: U.G.S., D.R., M.M. and F.A.; methodology: U.G.S., M.M. and C.O.R.; data curation: U.G.S., P.C., M.M., R.P. and M.L.C.; formal analysis: U.G.S., P.C., E.M., T.M. and L.E.; accomplished funds: M.L.C., D.R., F.A., M.M. and C.O.R.; drafted and reviewed the manuscript: U.G.S., P.C., F.A., L.E., C.O.R., M.M., A.P., R.P. and D.R. All authors have read and agreed to the published version of the manuscript.

Funding

This research received no external funding.

Institutional Review Board Statement

The study was conducted in accordance with the Declaration of Helsinki, and approved by the Ethics Committee of Mater Domini University Hospital in Catanzaro, Italy (protocol code 5/2018 approved January 2018).

Informed Consent Statement

Informed consent was obtained from all subjects involved in the study.

Data Availability Statement

The datasets generated during the current study are available from the corresponding author upon appropriate request.

Acknowledgments

The authors wish to thank Carmela Ricciardi (Masseria Agricola Olère) for supplying the carob pulp flour used in this research.

Conflicts of Interest

The authors declare no conflict of interest.

References

  1. Taraghikhah, N.; Ashtari, S.; Asri, N.; Shahbazkhani, B.; Al-Dulaimi, D.; Rostami-Nejad, M.; Rezaei-Tavirani, M.; Razzaghi, M.R.; Zali, M.R. An updated overview of spectrum of gluten-related disorders: Clinical and diagnostic aspects. BMC Gastroenterol. 2020, 20, 258–269. [Google Scholar] [CrossRef]
  2. Al-Toma, A.; Volta, U.; Auricchio, R.; Castillejo, G.; Sanders, D.S.; Cellier, C.; Mulder, C.J.; Lundin, K. European Society for the Study of Coeliac Disease (ESsCD) guideline for coeliac disease and other gluten-related disorders. United Eur. Gastroenterol. J. 2019, 7, 583–613. [Google Scholar] [CrossRef]
  3. Leonard, M.M.; Sapone, A.; Catassi, C.; Fasano, A. Celiac disease and nonceliac gluten sensitivity: A review. JAMA 2017, 318, 647–656. [Google Scholar] [CrossRef]
  4. Lerner, A.; O’Bryan, T.; Matthias, T. Navigating the Gluten-Free Boom: The Dark Side of Gluten Free Diet. Front. Pediatr. 2019, 7, 414–421. [Google Scholar] [CrossRef] [Green Version]
  5. Aguiar, E.V.; Santos, F.G.; Krupa-Kozak, U.; Capriles, V.D. Nutritional facts regarding commercially available gluten-free bread worldwide: Recent advances and future challenges. Crit. Rev. Food Sci. 2023, 63, 693–705. [Google Scholar] [CrossRef]
  6. Grandviewresearch. Gluten-Free Products Market Size, Share & Trends Analysis Report by Product (Bakery Products, Dairy/Dairy Alternatives), by Distribution Channel (Supermarkets & Hypermarkets, Convenience Stores), by Region, and Segment Forecasts, 2022–2030 Report ID: GVR-1-68038-834-3 available at: Gluten-Free Products Market Size Report, 2022–2030. 2021. Available online: grandviewresearch.com (accessed on 20 May 2023).
  7. Prada, M.; Godinho, C.; Rodrigues, D.L.; Lopes, C.; Garrido, M.V. The impact of a gluten-free claim on the perceived healthfulness, calories, level of processing and expected taste of food products. Food Qual. Prefer. 2019, 73, 284–287. [Google Scholar] [CrossRef] [Green Version]
  8. European Union. Regulation (EU) No 609/2013 of the European Parliament and of the Council of 12 June 2013 on food intended for infants and young children, food for special medical purposes, and total diet replacement for weight control and repealing Council Directive 92/52/EEC, Commission Directives 96/8/EC, 1999/21/EC, 2006/125/EC and 2006/141/EC, Directive 2009/39/EC of the European Parliament and of the Council and Commission Regulations (EC) No 41/2009 and (EC) No 953/2009. 2013. [Google Scholar]
  9. McCabe, M.S. Balancing consumer protection and scientific integrity in the face of uncertainty: The example of gluten-free foods. Food Drug Law J. 2010, 65, 367–390. [Google Scholar]
  10. Lee, A.R. Review article: Dietary management of coeliac disease. Aliment. Pharmacol. Ther. 2022, 56, 38–48. [Google Scholar] [CrossRef]
  11. El Khoury, D.; Balfour-Ducharme, S.; Joye, I.J. A review on the gluten-free diet: Technological and nutritional challenges. Nutrients 2018, 10, 1410. [Google Scholar] [CrossRef] [Green Version]
  12. Krupa-Kozak, U.; Lange, E. The gluten-free diet and glycaemic index in the management of coeliac disease associated with Type 1 Diabetes. Food Rev. Int. 2019, 35, 587–608. [Google Scholar] [CrossRef]
  13. Scazzina, F.; Dall’Asta, M.; Pellegrini, N.; Brighenti, F. Glycaemic index of some commercial gluten-free foods. Eur. J. Nutr. 2015, 54, 1021–1026. [Google Scholar] [CrossRef]
  14. Šmídová, Z.; Rysová, J. Gluten-Free Bread and Bakery Products Technology. Foods 2022, 11, 480. [Google Scholar] [CrossRef]
  15. Gao, Y.; Janes, M.E.; Chaiya, B.; Brennan, M.A.; Brennan, C.S.; Prinyawiwatkul, W. Gluten-free bakery and pasta products: Prevalence and quality improvement. Int. J. Food Sci. Technol. 2018, 53, 19–32. [Google Scholar] [CrossRef] [Green Version]
  16. Woomer, J.S.; Adedeji, A.A. Current applications of gluten-free grains—A review. Crit. Rev. Food Sci. Nutr. 2021, 61, 14–24. [Google Scholar] [CrossRef]
  17. Naqash, F.; Gani, A.; Gani, A.; Masoodi, F.A. Gluten-free baking: Combating the challenges—A review. Trends Food Sci. Technol. 2017, 66, 98–107. [Google Scholar] [CrossRef]
  18. Spizzirri, U.G.; Abduvakhidov, A.; Caputo, P.; Crupi, P.; Muraglia, M.; Oliviero Rossi, C.; Clodoveo, M.L.; Aiello, F.; Restuccia, D. Kefir Enriched with Carob (Ceratonia siliqua L.) Leaves Extract as a New Ingredient during a Gluten-Free Bread-Making Process. Fermentation 2022, 8, 305. [Google Scholar] [CrossRef]
  19. Rizzo, V.; Tomaselli, F.; Gentile, A.; La Malfa, S.; Maccarone, E. Rheological properties and sugar composition of Locust Bean gum from different carob varieties (Ceratonia siliqua L.). J. Agric. Food Chem. 2004, 52, 7925–7930. [Google Scholar] [CrossRef]
  20. Brassesco, M.E.; Brandao, T.R.S.; Silva, C.L.M.; Pintado, M. Carob bean (Ceratonia siliqua L.): A new perspective for functional food. Trends Food Sci. Technol. 2021, 114, 310–322. [Google Scholar] [CrossRef]
  21. Xu, J.; Zhang, Y.; Wang, W.; Li, Y. Advanced properties of gluten-free cookies, cakes, and crackers: A review. Trends Food Sci. Technol. 2020, 103, 200–213. [Google Scholar] [CrossRef]
  22. Bourrie, B.C.; Willing, B.P.; Cotter, P.D. The Microbiota and Health Promoting Characteristics of the Fermented Beverage Kefir. Front. Microbiol. 2016, 7, 647. [Google Scholar] [CrossRef] [Green Version]
  23. Guzel-Seydim, Z.B.; Kok-Tas, T.; Greene, A.K.; Seydim, A.C. Review: Functional properties of kefir. Crit. Rev. Food Sci. Nutr. 2011, 51, 261–268. [Google Scholar] [CrossRef]
  24. De Luca, M.; Restuccia, D.; Spizzirri, U.G.; Crupi, P.; Ioele, G.; Gorelli, B.; Clodoveo, M.L.; Saponara, S.; Aiello, F. Wine Lees as Source of Antioxidant Molecules: Green Extraction Procedure and Biological Activity. Antioxidant 2023, 12, 622. [Google Scholar] [CrossRef]
  25. Carullo, G.; Spizzirri, U.G.; Montopoli, M.; Cocetta, V.; Armentano, B.; Tinazzi, M.; Sciubba, F.; Giorgi, G.; Di Cocco, M.E.; Bohn, T.; et al. Milk Kefir Enriched with Inulin Grafted Seed Extract from White Wine Pomace: Chemical Characterization, Antioxidant Profile and in vitro Gastrointestinal Digestion. Int. J. Food Sci. Technol. 2022, 57, 4086–4095. [Google Scholar] [CrossRef]
  26. Spizzirri, U.G.; Carullo, G.; Aiello, F.; Paolino, D.; Restuccia, D. Valorisation of olive oil pomace extracts for a functional pear beverage formulation. Int. J. Food Sci. Technol. 2021, 56, 5497–5505. [Google Scholar] [CrossRef]
  27. La Torre, C.; Fazio, A.; Caputo, P.; Plastina, P.; Caroleo, M.C.; Cannataro, R.; Cione, E. Effects of Long-Term Storage on Radical Scavenging Properties and Phenolic Content of Kombucha from Black Tea. Molecules 2021, 26, 5474. [Google Scholar] [CrossRef]
  28. Gómez, A.V.; Ferrero, C.; Puppo, C.; Tadini, C.C.; Abraham, A.G. Fermented milk obtained with kefir grains as an ingredient in breadmaking. Int. J. Food Sci. 2014, 49, 2315–2322. [Google Scholar] [CrossRef]
  29. Pawłowska, K.; Kuligowski, M.; Jasińska-Kuligowska, I.; Kidoń, M.; Siger, A.; Rudzińska, M.; Nowak, J. Effect of Replacing Cocoa Powder by Carob Powder in the Muffins on Sensory and Physicochemical Properties. Plant Foods Hum. Nutr. 2018, 73, 196–202. [Google Scholar] [CrossRef] [Green Version]
  30. Papageorgiou, M.; Paraskevopoulou, A.; Pantazi, F.; Skendi, A. Cake Perception, Texture and Aroma Profile as Affected by Wheat Flour and Cocoa Replacement with Carob Flour. Foods 2020, 9, 1586. [Google Scholar] [CrossRef]
  31. ISO 8586:2012; Sensory Analysis—General Guidelines for the Selection, Training and Monitoring of Selected Assessors and Expert Sensory Assessors. ISO: Geneva, Switzerland, 2015.
  32. ISO 4121:2003; Sensory Analysis—Guidelines for the Use of Quantitative Response Scales. ISO: Geneva, Switzerland, 2003.
  33. Laureati, M.; Giussani, B.; Pagliarini, E. Sensory and hedonic perception of gluten-free bread: Comparison between celiac and non-celiac subjects. Food Res. Int. 2012, 46, 326–333. [Google Scholar] [CrossRef]
  34. de Kock, H.L.; Magano, N.N. Sensory tools for the development of gluten-free bakery foods. J. Cereal Sci. 2020, 94, 102990. [Google Scholar] [CrossRef]
  35. ISO 8589:2007; Sensory Analysis—General Guidance for the Design of Test Rooms. ISO: Geneva, Switzerland, 2017.
  36. Wolever, T.; Katzman-Relle, L.; Jenkins, A.; Vuksan, V.; Josse, R.G.; Jenkins, D. Glycaemic index of 102 complex carbohydrate foods in patients with diabetes. Nutr. Res. 2001, 14, 651–669. [Google Scholar] [CrossRef]
  37. Omage, K.; Omage, S.O. Evaluation of the glycemic indices of three commonly eaten mixed meals in Okada, Edo State. Food Sci. Nutr. 2017, 6, 220–228. [Google Scholar] [CrossRef] [Green Version]
  38. Petkova, N.; Petrova, I.; Ivanov, I.; Mihov, R.; Hadjikinova, R.; Ognyanov, M.; Nikolova, V. Nutritional and antioxidant potential of carob (Ceratonia siliqua) flour and evaluation of functional properties of its polysaccharide fraction. J. Pharm. Sci. Res. 2017, 9, 2189–2195. [Google Scholar]
  39. Stavrou, I.J.; Christou, A.; Kapnissi-Christodoulou, C.P. Polyphenols in carobs: A review on their composition, antioxidant capacity and cytotoxic effects, and health impact. Food Chem. 2018, 269, 355–374. [Google Scholar] [CrossRef]
  40. Durazzo, A.; Turfani, V.; Narducci, V.; Azzini, E.; Maiani, G.; Carcea, M. Nutritional characterization and bioactive components of commercial carobs flours. Food Chem. 2014, 153, 109–113. [Google Scholar] [CrossRef]
  41. Custódio, L.; Escapa, A.L.; Fernandes, E.; Fajardo, A.; Aligué, R.; Alberício, F.; Neng, N.; Nogueira, J.M.F.; Romano, A. Phytochemical profile, antioxidant and cytotoxic activities of the carob tree (Ceratonia siliqua L.) germ flour extracts. Plant Foods Hum Nutr. 2011, 66, 78–84. [Google Scholar] [CrossRef]
  42. Uysal, S.; Zengin, G.; Aktumsek, A.; Karatas, S. Chemical and biological approaches on nine fruit tree leaves collected from the Mediterranean region of Turkey. J. Funct. Foods 2016, 22, 518–532. [Google Scholar] [CrossRef]
  43. Aissani, N.; Coroneo, V.; Fattouch, S.; Caboni, P. Inhibitory effect of Carob (Ceratonia siliqua) leaves methanolic extract on listeria monocytogenes. J. Agric. Food Chem. 2012, 60, 9954–9958. [Google Scholar] [CrossRef]
  44. Rodríguez-Solana, R.; Romano, A.; Moreno-Rojas, J.M. Carob Pulp: A Nutritional and Functional By-Product Worldwide Spread in the Formulation of Different Food Products and Beverages. A Review. Process. 2021, 9, 1146. [Google Scholar] [CrossRef]
  45. Graça, C.; Raymundo, A.; Sousa, I. Wheat Bread with Dairy Products-Technology, Nutritional, and Sensory Properties. Appl. Sci. 2019, 9, 4101. [Google Scholar] [CrossRef] [Green Version]
  46. Ziobro, R.; Witczak, T.; Juszczak, L.; Korus, J. Supplementation of gluten-free bread with non-gluten proteins. Effect on dough rheological properties and bread characteristic. Food Hydrocoll. 2013, 32, 213–220. [Google Scholar] [CrossRef]
  47. Kazakos, S.; Mantzourani, I.; Plessas, S. Quality Characteristics of Novel Sourdough Breads Made with Functional Lacticaseibacillus paracasei SP5 and Prebiotic Food Matrices. Foods 2022, 11, 3226. [Google Scholar] [CrossRef]
  48. Coppola, L.; Gianferri, R.; Oliviero, C.; Nicotera, I.; Ranieri, G.A. Structural Changes in CTAB/H2O Mixtures Using a Rheological Approach. Phys. Chem. Chem. Phys. 2004, 6, 2364–2372. [Google Scholar] [CrossRef]
  49. Carullo, G.; Scarpelli, F.; Belsito, E.L.; Caputo, P.; Oliviero Rossi, C.; Mincione, A.; Leggio, A.; Crispini, A.; Restuccia, D.; Spizzirri, U.G.; et al. Formulation of New Baking (+)-Catechin Based Leavening Agents: Effects on Rheology, Sensory and Antioxidant Features during Muffin Preparation. Foods 2020, 9, 1569. [Google Scholar] [CrossRef]
  50. Marchetti, L.; Cardós, M.; Campaña, L.; Ferrero, C. Effect of glutens of different quality on dough characteristics and breadmaking performance. LWT—Food Sci. Technol. 2012, 46, 224–231. [Google Scholar] [CrossRef]
  51. Salehi, F. Improvement of gluten-free bread and cake properties using natural hydrocolloids: A review. Food Sci Nutr. 2019, 7, 3391–3402. [Google Scholar] [CrossRef] [Green Version]
  52. Novotni, D.; Mutak, N.; Nanjara, L.; Drakula, S.; Čukelj Mustač, N.; Voučko, B.; Ćurić, D. Sourdough fermentation of carob flour and its application in wheat bread. Food Technol Biotechnol. 2020, 58, 465–474. [Google Scholar]
  53. Martuscelli, M.; Di Teodoro, G.; Sacchetti, G.; Pittia, P. Amaretti senza amido e farina quali ingredienti in sistemi alimentari ad alta umidità: Reidratazione e caratteristiche fisiche. Ind. Aliment. 2008, 482, 717–724. [Google Scholar]
  54. Pittia, P.; Sacchetti, G. Antiplasticization effect of water in amorphous foods. A review. Food Chem. 2008, 106, 1417–1427. [Google Scholar] [CrossRef]
  55. Satir, G.; Guzel-Seydim, Z.B. Influence of Kefir fermentation on the bioactive substances of different breed goat milks. LWT—Food Sci. Technol. 2015, 63, 852–858. [Google Scholar] [CrossRef]
  56. Debelo, H.; Li, M.; Ferruzzi, M.G. Processing influences on food polyphenol profiles and biological activity. Curr. Opin. Food Sci. 2020, 32, 90–102. [Google Scholar] [CrossRef]
  57. Turfani, V.; Narducci, V.; Durazzo, A.; Galli, V.; Carcea, M. Technological, nutritional and functional properties of wheat bread enriched with lentil or carob flours. LWT—Food Sci. Technol. 2017, 78, 361–366. [Google Scholar] [CrossRef]
  58. Christodoulou, M.C.; Orellana Palacios, J.C.; Hesami, G.; Jafarzadeh, S.; Lorenzo, J.M.; Domínguez, R.; Moreno, A.; Hadidi, M. Spectrophotometric Methods for Measurement of Antioxidant Activity in Food and Pharmaceuticals. Antioxidants 2022, 11, 2213. [Google Scholar] [CrossRef]
  59. Rosa, C.S.; Tessele, K.; Prestes, R.C.; Silveira, M.; Franco, F. Effect of substituting of cocoa powder for carob flour in cakes made with soy and banana flours. Int. Food Res. J. 2015, 22, 2111–2118. [Google Scholar]
  60. Issaoui, M.; Flamini, G.; Delgado, A. Sustainability Opportunities for Mediterranean Food Products through New Formulations Based on Carob Flour (Ceratonia siliqua L.). Sustainability 2021, 13, 8026. [Google Scholar] [CrossRef]
  61. Kirchhof, E.; Schieberle, P. Quantitation of Odor-Active Compounds in Rye Flour and Rye Sourdough Using Stable Isotope Dilution Assays. J. Agric. Food Chem. 2002, 50, 5378–5385. [Google Scholar] [CrossRef]
  62. Antoniou, C.; Kyratzis, A.C.; Soteriou, G.A.; Rouphael, Y.; Kyriacou, M.C. Configuration of the Volatile Aromatic Profile of Carob Powder Milled from Pods of Genetic Variants Harvested at Progressive Stages of Ripening from High and Low Altitudes. Front. Nutr. 2021, 8, 789169. [Google Scholar] [CrossRef]
  63. Livesey, G.; Taylor, R.; Livesey, H.; Liu, S. Is there a dose-response relation of dietary glycemic load to risk of type 2 diabetes? Meta-analysis of prospective cohort studies. Am. J. Clin. Nutr. 2013, 97, 584–596. [Google Scholar] [CrossRef] [Green Version]
  64. Liu, S.; Willett, W.C.; Stampfer, M.J.; Hu, F.B.; Franz, M.; Sampson, L.; Hennekens, C.H.; Manson, J.E.A. prospective study of dietary glycemic load, carbohydrate intake, and risk of coronary heart disease in US women. Am. J. Clin. Nutr. 2000, 71, 1455–1461. [Google Scholar] [CrossRef] [Green Version]
  65. Brand-Miller, J.C.; Holt, S.H.; Pawlak, D.B.; McMillan, J. Glycemic index and obesity. Am. J. Clin. Nutr. 2013, 76, 281–285. [Google Scholar] [CrossRef] [Green Version]
  66. Penagini, F.; Dilillo, D.; Meneghin, F.; Mameli, C.; Fabiano, V.; Zuccotti, G.V. Gluten free diet in children: An approach to a nutritionally adequate and balanced diet. Nutrients 2013, 5, 4553–4565. [Google Scholar] [CrossRef] [PubMed] [Green Version]
  67. Segura, M.E.; Rosell, C.M. Chemical composition and starch digestibility of different gluten-free breads. Plant Foods Hum. Nutr. 2011, 66, 224–230. [Google Scholar] [CrossRef] [PubMed] [Green Version]
  68. Zuccotti, G.; Fabiano, V.; Dilillo, D.; Picca, M.; Cravidi, C.; Brambilla, P. Intakes of nutrients in Italian children with celiac disease and the role of commercially available gluten-free products. J. Hum. Nutr. Diet. 2013, 26, 436–444. [Google Scholar] [CrossRef] [PubMed]
  69. Kylökäs, A.; Kaukinen, K.; Huhtala, H.; Collin, P.; Mäki, M.; Kurppa, K. Type 1 and type 2 diabetes in celiac disease: Prevalence and effect on clinical and histological presentation. BMC Gastroenterol. 2016, 16, 76–82. [Google Scholar] [CrossRef] [PubMed] [Green Version]
Figure 1. Representative samples of B0 (a), B1 (b), and B2 (c).
Fermentation 09 00748 g001
Figure 2. Viscoelastic properties of B0 (blue), B1 (red), and B2 (gray) doughs. G* represents the complex shear modulus.
Fermentation 09 00748 g002
Figure 3. Trend of force vs. deformation of samples B0 (blue line), B1 (red line), and B2 (gray line) after 1 (a) and 6 (b) days of storage (at 20 °C in polyethylene bag).
Fermentation 09 00748 g003
Figure 4. Descriptive sensor analyses of samples B0 (blue line), B1 (red line), and B2 (gray line). Values ranged from 1-absence of the attribute, to 5-maximum intensity.
Fermentation 09 00748 g004
Table 1. Nutritional information of the organic carob pulp flour as reported on the label.
Average Values for 100 g of Product% RDA
Energy value (Kcal)371
Fat (g)0.30.4
Of which is saturated (g)<0.1<0.1
Carbohydrate (g)41.3015.48
Of which is sugar (g)36.50
Fiber (g)6.5026
Protein (g)4.709.4
Salt (mg)00
Potassium (mg)80039
Vitamin B2 (mg)0.4532
Table 2. Antioxidant properties of carob pulp flour (CPF) and bakery product samples over a six-day storage time (at 20 °C, in polyethylene bags).
SampleStorage
Time
(d)
TPC
(mg GAE g DW−1)
PAC
(mg GAE g DW−1)
FC
(mg CT g DW−1)
IC50 (mg mL−1)
DPPH Radical ABTS Radical
CPF 50.94 ± 0.2510.89 ± 0.141.54 ± 0.060.082 ± 0.0030.078 ± 0.003
B010.208 ± 0.009 f----
40.147 ± 0.008 g----
60.118 ± 0.005 h----
B111.542 ± 0.046 d0.103 ± 0.004 c0.059 ± 0.002 c0.788 ± 0.029 d0.160 ± 0.008 c
41.464 ± 0.034 d0.099 ± 0.002 c0.049 ± 0.001 d0.867 ± 0.033 e0.165 ± 0.008 c
61.354 ± 0.035 e0.087 ± 0.002 d0.042 ± 0.001 e0.954 ± 0.041 f0.172 ± 0.009 c
B212.532 ± 0.085 a0.155 ± 0.007 a0.091 ± 0.003 a0.478 ± 0.020 a0.112 ± 0.005 a
42.242 ± 0.078 b0.141 ± 0.005 b0.088 ± 0.004 a0.621 ± 0.029 b0.120 ± 0.005 a
62.082 ± 0.074 c0.135 ± 0.005 b0.078 ± 0.002 b0.772 ± 0.033 c0.132 ± 0.007 b
Positive control
Ascorbic acid 0.002 ± 0.0010.005 ± 0.001
TPC: total phenolic content; PAC: phenolic acid content; FC: flavonoid content; GAE: gallic acid equivalent; CT: catechin; DW: dry weight; DPPH: (2.2-diphenyl-1-picrylhydrazyl); ABTS: (2.2′-azinobis (3-ethylbenzothiazoline-6-sulphonic acid)). Each measurement was carried out in triplicate and data are expressed as means (±SD). Different letters express significant differences (p < 0.05).
Table 3. Mechanical profiles of the investigated baked products, after 1 and 6 days of storage (at 20 °C in polyethylene bag).
SampleDaysSlope ± 400
B0163,100
661,700
B1124,000
637,000
B211100
63700
Table 4. GI classification of the three samples.
SamplesAvailable CHO (g)GI ValueClassification
B050100High
B150115High
B25062Medium
CHO: carbohydrates; GI: glycemic index.
Table 5. Incremental area under the curve (IAUC) for calculating the GI of samples.
SamplesIAUC ± SDp Value
B03430 ± 1233
B13114 ± 1183NS
B21147 ± 1174<0.05
GI: glycemic index. Values represent mean ± standard deviation (SD).
Disclaimer/Publisher’s Note: The statements, opinions and data contained in all publications are solely those of the individual author(s) and contributor(s) and not of MDPI and/or the editor(s). MDPI and/or the editor(s) disclaim responsibility for any injury to people or property resulting from any ideas, methods, instructions or products referred to in the content.

