Article

Performance of a Drip Irrigation System under the Co-Application of Water, Fertilizer, and Air

1
Farmland Irrigation Research Institute, Chinese Academy of Agricultural Sciences, Xinxiang 453002, China
2
Nanjing Tentoo Energy Saving Science and Technology, Nanjing 210000, China
3
China Railway Construction Group Central Plain Construction, Zhengzhou 450046, China
*
Author to whom correspondence should be addressed.
Horticulturae 2024, 10(1), 6; https://doi.org/10.3390/horticulturae10010006
Submission received: 3 November 2023 / Revised: 15 December 2023 / Accepted: 17 December 2023 / Published: 19 December 2023
(This article belongs to the Special Issue Irrigation and Water Management Strategies for Horticultural Systems)

Abstract

:
The co-application of water, fertilizer, and air is a new water-saving irrigation method based on drip irrigation technology, which can effectively alleviate the phenomenon of soil rhizosphere hypoxia, improve water and fertilizer utilization efficiency, and inhibit the clogging of irrigation equipment in drip irrigation systems. The performance of drip irrigation systems is one of the important factors affecting the effectiveness of the co-application of water, fertilizer, and air. However, the impact of factors such as the aeration method, fertilization device, and working parameters on the performance of drip irrigation systems for the co-application of water, fertilizer, and air is still unclear. Therefore, based on two typical aeration methods, i.e., micro-nano and Venturi aeration, the performance of a drip irrigation system under the co-application of water, fertilizer, and air was studied by comparing and analyzing the effects of different aeration methods, working pressures of the drip irrigation system, and the pressure difference between the inlet and outlet of fertilizer irrigation on the spatial distribution uniformity of water, fertilizer, and air in the drip irrigation pipeline network. The results showed that the pressure difference between the inlet and outlet of fertilization irrigation had no significant impact on system performance, while the working pressure significantly affected system performance. Compared with the effective effect of Venturi aeration on system performance, micro-nano aeration can significantly affect drip irrigation system performance and effectively improve drip irrigation system performance. The micro-nano-aerated drip irrigation system with the co-application of water, fertilizer, and air under a working pressure of 0.1 MPa has better system performance. The research results are of great significance for revealing the mechanism underlying the impact of the co-application of water, fertilizer, and air on the performance of drip irrigation systems and constructing efficient drip irrigation technology for the co-application of water, fertilizer, and air.

1. Introduction

Efficient and water-saving agriculture plays an important role in the sustainable development strategy of agriculture. Modern agricultural efficient water use is facing a shift from a single focus on water-saving technology to a combination of multiple agricultural technologies and the integration of multiple factors such as water, fertilizer, and air. The co-application of water, fertilizer, and air endows drip irrigation technology with new connotations [1,2]. It aims to achieve the optimal growth state of crops and regulates the soil environment in the root zone of crops as a means to fully improve the synergistic effect between multiple factors such as water, fertilizer, air, and soil during crop growth. It is a manifestation of the advantages of the integrated application of drip irrigation technology. Research has demonstrated that utilizing drip irrigation with the co-application of water, fertilizer, and air can effectively enhance soil conditions. This approach reduces soil mechanical strength, improves soil aeration [3,4], and alleviates oxygen-related stress due to irrigation in crops [5]. By creating a favorable environment for soil microbial communities in the crop’s root zone [6,7], it ultimately accomplishes the objectives of water conservation, increased yields, and improved quality [8,9,10,11]. At the same time, the co-application of water, fertilizer, and air also has a significant inhibitory effect on the clogging process of drip irrigation emitters, which can extend the service life of drip irrigation systems [12,13].
In summary, the co-application of water, fertilizer, and air drip irrigation represents an innovative water-saving technology that builds upon traditional drip irrigation methods. This approach offers benefits such as water conservation, increased crop yields, improved quality, and effective blockage control, demonstrating significant technical advantages and promising application prospects. However, the addition of air to water generates an air–liquid two-phase flow in the drip irrigation pipeline network, causing disturbance to the flow of water bodies. At the same time, fertilizers also alter the flow characteristics of existing water bodies [14]. Therefore, the co-application of water, fertilizer, and air in a drip irrigation system provides unique system performance. In the co-application of water, fertilizer, and air drip irrigation system, the uniformity of water, fertilizer, and air is the key to evaluating the irrigation quality, fertilization, and aeration effects of the drip irrigation system and is also an important indicator for evaluating the performance of the drip irrigation system. However, the impact of factors such as the aeration method, fertilization device, and working parameters of the drip irrigation system on the performance of the co-application of water, fertilizer, and air drip irrigation system is still unclear, which directly affects the scientific and rational implementation of the co-application of water, fertilizer, and air drip irrigation system. Therefore, this article is based on two typical aeration methods, i.e., a micro-nano bubble generator and a Venturi injector, using a pressure difference fertilization tank as the fertilization device. The performance test method is used to compare and analyze the effects of different aeration methods, the working pressure of the drip irrigation system, and the pressure difference between the inlet and outlet of the fertilization tank on the spatial distribution and uniformity of water, fertilizer, and air. Research has been conducted on the spatial distribution and uniformity of water, fertilizer, and air in drip irrigation networks, providing a theoretical basis for the co-application of water, fertilizer, and air drip irrigation. Our research aims to investigate the impact of the co-application of water, fertilizers, and air in modern agriculture on the hydraulic performance of irrigation systems and its potential applications, providing valuable insights for different types of crops and agricultural systems, particularly in environments where efficient irrigation and water resource management are pursued. Therefore, our research has broad applicability and can offer valuable insights into various agricultural cultures and practices.

2. Materials and Methods

2.1. Selection of Drip Irrigation Belts

The experiment selected the commonly used embedded patch drip irrigation belt (Inner Mongolia Muhe Water Saving Engineering Equipment Co., Ltd., Chifeng, China) available on the market as the research object. Before the experiment, the flow pressure relationship and coefficient of variation (Cv) of the drip irrigation emitter were measured according to the national standard GB/T 19812.3-2017 [15]. The flow–pressure relationship of the drip irrigation emitter is represented by the following formula:
qe = kpm
In the formula:
  • qe—flow rate of the drip irrigation emitter, L/h;
  • p—working pressure, kPa;
  • k—flow coefficient;
  • m—flow state index.
The coefficient of variation (Cv, %) is calculated using the following formula:
C v = S / x ¯
In the formula:
  • S —standard deviation of the observed values of all sampling points;
  • x ¯ —average flow rate of the drip irrigation emitter sample, L/h.
The characteristic parameters and test results of the drip irrigation belt selected for the experiment are shown in Table 1. From Table 1, it can be seen that the flow coefficient of the emitter is 0.259; the flow regime index is 0.45; and the coefficient of variation is 2.28%. According to ASAE Standards (2003) [16], the quality of the drip irrigation belts is “excellent”.

2.2. Test Setup

The experiment was conducted at the Quality Inspection Center for Water Saving Irrigation Equipment of the Ministry of Water Resources, Farmland Irrigation Research Institute, Chinese Academy of Agricultural Sciences. A schematic diagram of the test device is shown in Figure 1. The experiment uses an intelligent variable frequency constant temperature and pressure water tank (Hebei Kedao Testing Machine Technology Co., Ltd., Shijiazhuang, China) to provide power and water sources for the experiment. U-PVC pipes are used as the test pipeline system; the turbine flowmeter (China Nuclear Instrument Co., Ltd., CNIC, Wuhan, China, with an accuracy of 1.0 and a range of 3–30 m3/h) is used to monitor the experimental water flow rate; a pressure difference fertilizer tank (Shandong Fengtian Water-saving Equipment Co., Ltd., Jinan, China, 30 L) is used as the fertilizer application device; a precision pressure gauge (Shanghai Automation Instrumentation Co., Ltd., Shanghai, China, with a class of 0.4 and a range of 0.4 MPa) is used to monitor the pressure difference between the inlet and outlet of the fertilizer tank; an intelligent variable frequency constant temperature and pressure water tank is used, and mesh filters (AZUD, 120 mesh, Murcia, Spain) are installed on the main pipeline behind the fertilizer tank to prevent impurities in the water and fertilizer particles that cannot be completely dissolved from entering the pipeline system, causing blockage of the water dispenser; a Venturi injector (Mazzei, A-20) and micro-nano bubble generator (Yunnan Xiazhichun Environmental Protection Technology Co., Ltd., Kunming, China) are used as aeration devices, respectively. Among them, the fertilization device and the aeration device are both connected in parallel with the main pipeline. The experimental pipeline network is constructed by laying 5 drip irrigation belts (100 m long and 0.5 m apart) along the north–south direction. According to the American Society of Agricultural Engineers (ASAE) standard EP 458 [17], the confidence level for drip irrigation uniformity testing was set at 90%. According to the principle of uniform distribution of points, 10 sampling points were set for each drip irrigation belt, and a total of 50 sampling points were set for each group of experiments.
The experimental water source was groundwater; the air source was air, and the fertilizer was potassium sulfate (K2SO4, potassium content ≥ 99%, Tianjin Sailboat). At the same time, a measuring cup (3 L) was used to collect solution samples passing through the drip head at the sampling point. A measuring cylinder (with a measuring range of 2 L and minimum scale of 20 mL) was used to measure the volume of the sample solution; a conductivity meter (SX-650, Shanghai Sanxin, Shanghai, China) was used to measure the conductivity of the sample solution; and a dissolved oxygen analyzer (Seven2Go Pro S7, Mettler Toledo, Columbus, OH, USA) was used to measure the dissolved oxygen concentration of the sample solution.

2.3. Test Methods

(1) Test plan
Two sets of aeration experiments and one set of comparative experiments were set up to study the driving effects of factors such as aeration method, working pressure, and pressure difference between the inlet and outlet of fertilizer tanks on the spatial distribution and uniformity of water, fertilizer, and air in drip irrigation networks. Among them, two typical aeration methods, i.e., Venturi and micro-nano aeration, were set up for the aeration experiment, while the comparative experiment used a traditional drip irrigation system without aeration treatment. The working pressure was set at two levels of 0.05 and 0.1 MPa, respectively, and the pressure difference at the inlet and outlet of the fertilizer tank was set at five levels of 0.05, 0.10, 0.15, 0.20, and 0.25 MPa, respectively. A full-factor experiment was conducted, with a total of 30 groups of experiments conducted, each with 3 replicates. In each experiment, the fertilization rate was set to 1 kg and the aeration rate was 3 L/min. The experimental processing and scheme settings are shown in Table 2.
(2) Calibration test of fertilizer concentration
During the experiment, the concentration and conductivity of the fertilizer solution were calibrated daily. During calibration, a quadratic curve regression method was used [18] to establish a mapping relationship between fertilizer concentration and conductivity for calculating fertilizer content. The relationship between fertilizer concentration and conductivity can be expressed by Formula (3), and the regression coefficients of the standard curve for this mapping relationship are shown in Table 3.
C = a E C 2 + b E C + c
In the formula:
  • C—concentration of fertilizer solution, g/mL;
  • EC—conductivity of the fertilizer solution, ms/cm;
  • a, b, c—regression coefficients.
Table 3. Regression coefficients of the standard curve for the relationship between fertilizer concentration and conductivity.
ProcessabcR2EC
10.0000050.0008−0.0020.9940.4
20.0000090.0007−0.00160.9944.6
30.0000050.0008−0.00210.9969.1
40.000010.0007−0.00170.99713.6
50.0000030.0009−0.00210.99417.1
60.0000090.0007−0.00160.99520.6
70.0000030.0009−0.00230.99524.8
80.0000050.0008−0.0020.99828.2
90.0000030.0009−0.00230.99732.1
100.000010.0007−0.00170.99635.4
110.0000040.0009−0.00230.99438.6
120.0000090.0005−0.00160.99441.5
(3) Fertilization time
Each experiment required the differential pressure fertilization tank to complete a full fertilization process, which necessitated ensuring that the test time was greater than the fertilization time. Therefore, it was necessary to determine the time required for the differential pressure fertilization tank to fully fertilize under different technical parameter combinations. During the experiment, the conductivity of the test water source was first measured. Then, K2SO4 was prepared into a 30 L solution using the test water source and stirred to completely dissolve and mix evenly so that the conductivity of the solution could be measured at this time. The experimental system was run to fill the differential pressure fertilizer tank with clean water. After the system ran stably, the pressure difference between the inlet and outlet of the fertilizer tank was adjusted to the corresponding level. Then, the inlet valve of the fertilizer tank was closed, and the clean water in the fertilizer tank was discharged. After adding the prepared fertilizer solution to the fertilizer tank, the valve was reopened. Samples were taken at intervals of every 0.5 min at the sampling port of the fertilizer tank while measuring the conductivity of the fertilizer solution sample. When the conductivity of the sample was the same or very similar (±2%) to that of clean water, fertilization was considered completed, the fertilization time was recorded, and the experiment was stopped. The experiment shows that under different technical parameter combinations, the fertilization time of the fertilization tank does not exceed 8.5 min, as shown in Table 4.
(4) Uniformity test
When conducting uniformity tests, first, the aeration device was adjusted to the required operating parameters for the test. After the system ran stably, rain buckets were placed in sequence at the measuring points (with an interval of 5 s), and the test timing started at the same time. After 5 min, the differential pressure fertilization tank was opened, and fertilization began. After 3 min, the rainfall buckets were retrieved in order of placement and time interval. The volume, conductivity, and dissolved oxygen concentration of the solution in the rainfall buckets were measured and recorded. The duration and fertilization amount of each experiment were consistent.

2.4. Uniformity Evaluation

This article uses Christensen’s uniformity coefficient C u , distribution uniformity coefficient D U , coefficient of variation C v , and statistical uniformity coefficient U s as indicators for evaluating the uniformity of drip irrigation systems. The calculation methods for each uniformity coefficient are as follows:
(1) Christensen’s uniformity coefficient C u , %
C u = 1 i = 1 N x i x ¯ ̄ i = 1 N x i × 100 %
In the formula:
  • xi—the observed values of the irrigation amount, fertilization amount, and dissolved oxygen content of the drip irrigation emitter at the i-th sampling point;
  • x—mean value of the sample;
  • N—number of sampling points.
(2) Distribution uniformity coefficient D U
D U = 100 × x l q ¯ x ¯
In the formula:
  • x l q ¯ —the mean of the 1/4 observed value with the smallest value among all sampling points;
  • x ¯ —the meaning is the same as in Formula (4).
(3) The calculation of the coefficient of variation C v is the same as in Formula (2);
(4) Statistical uniformity coefficient U s , %
U s = 100 % × ( 1 S / x ¯ )
The meanings of each parameter in the equation are the same as before.

3. Results and Analysis

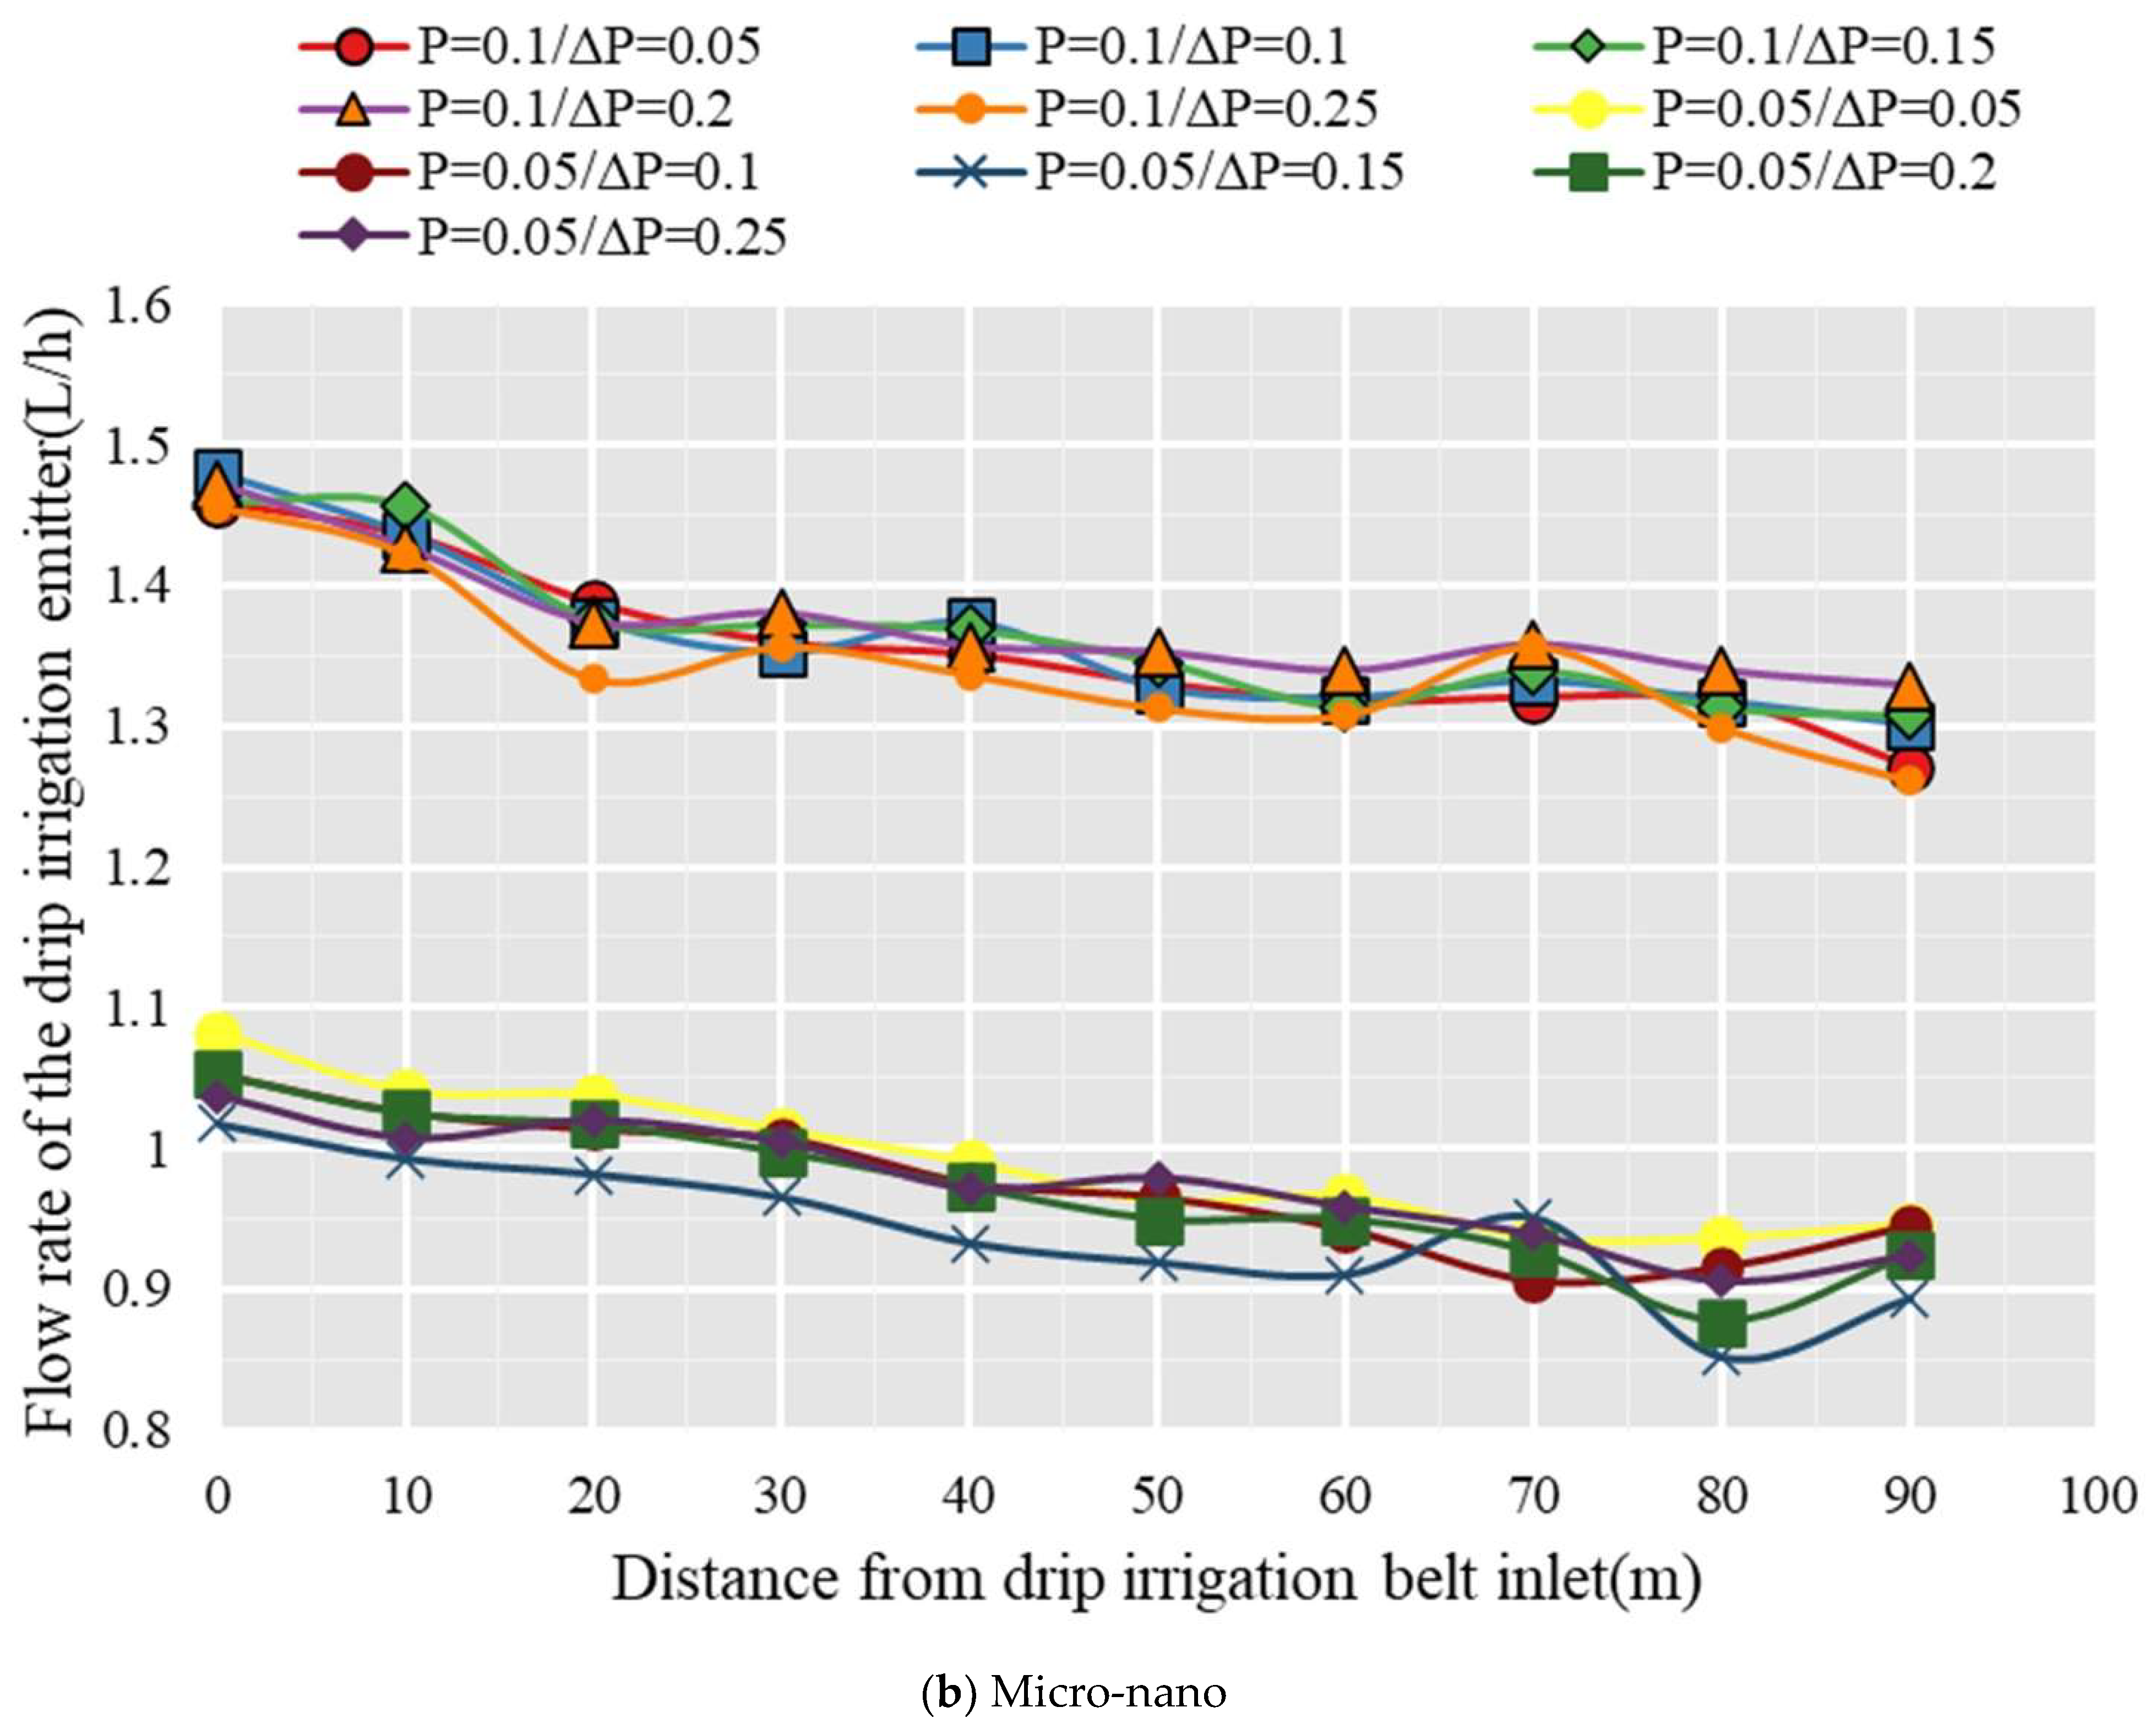
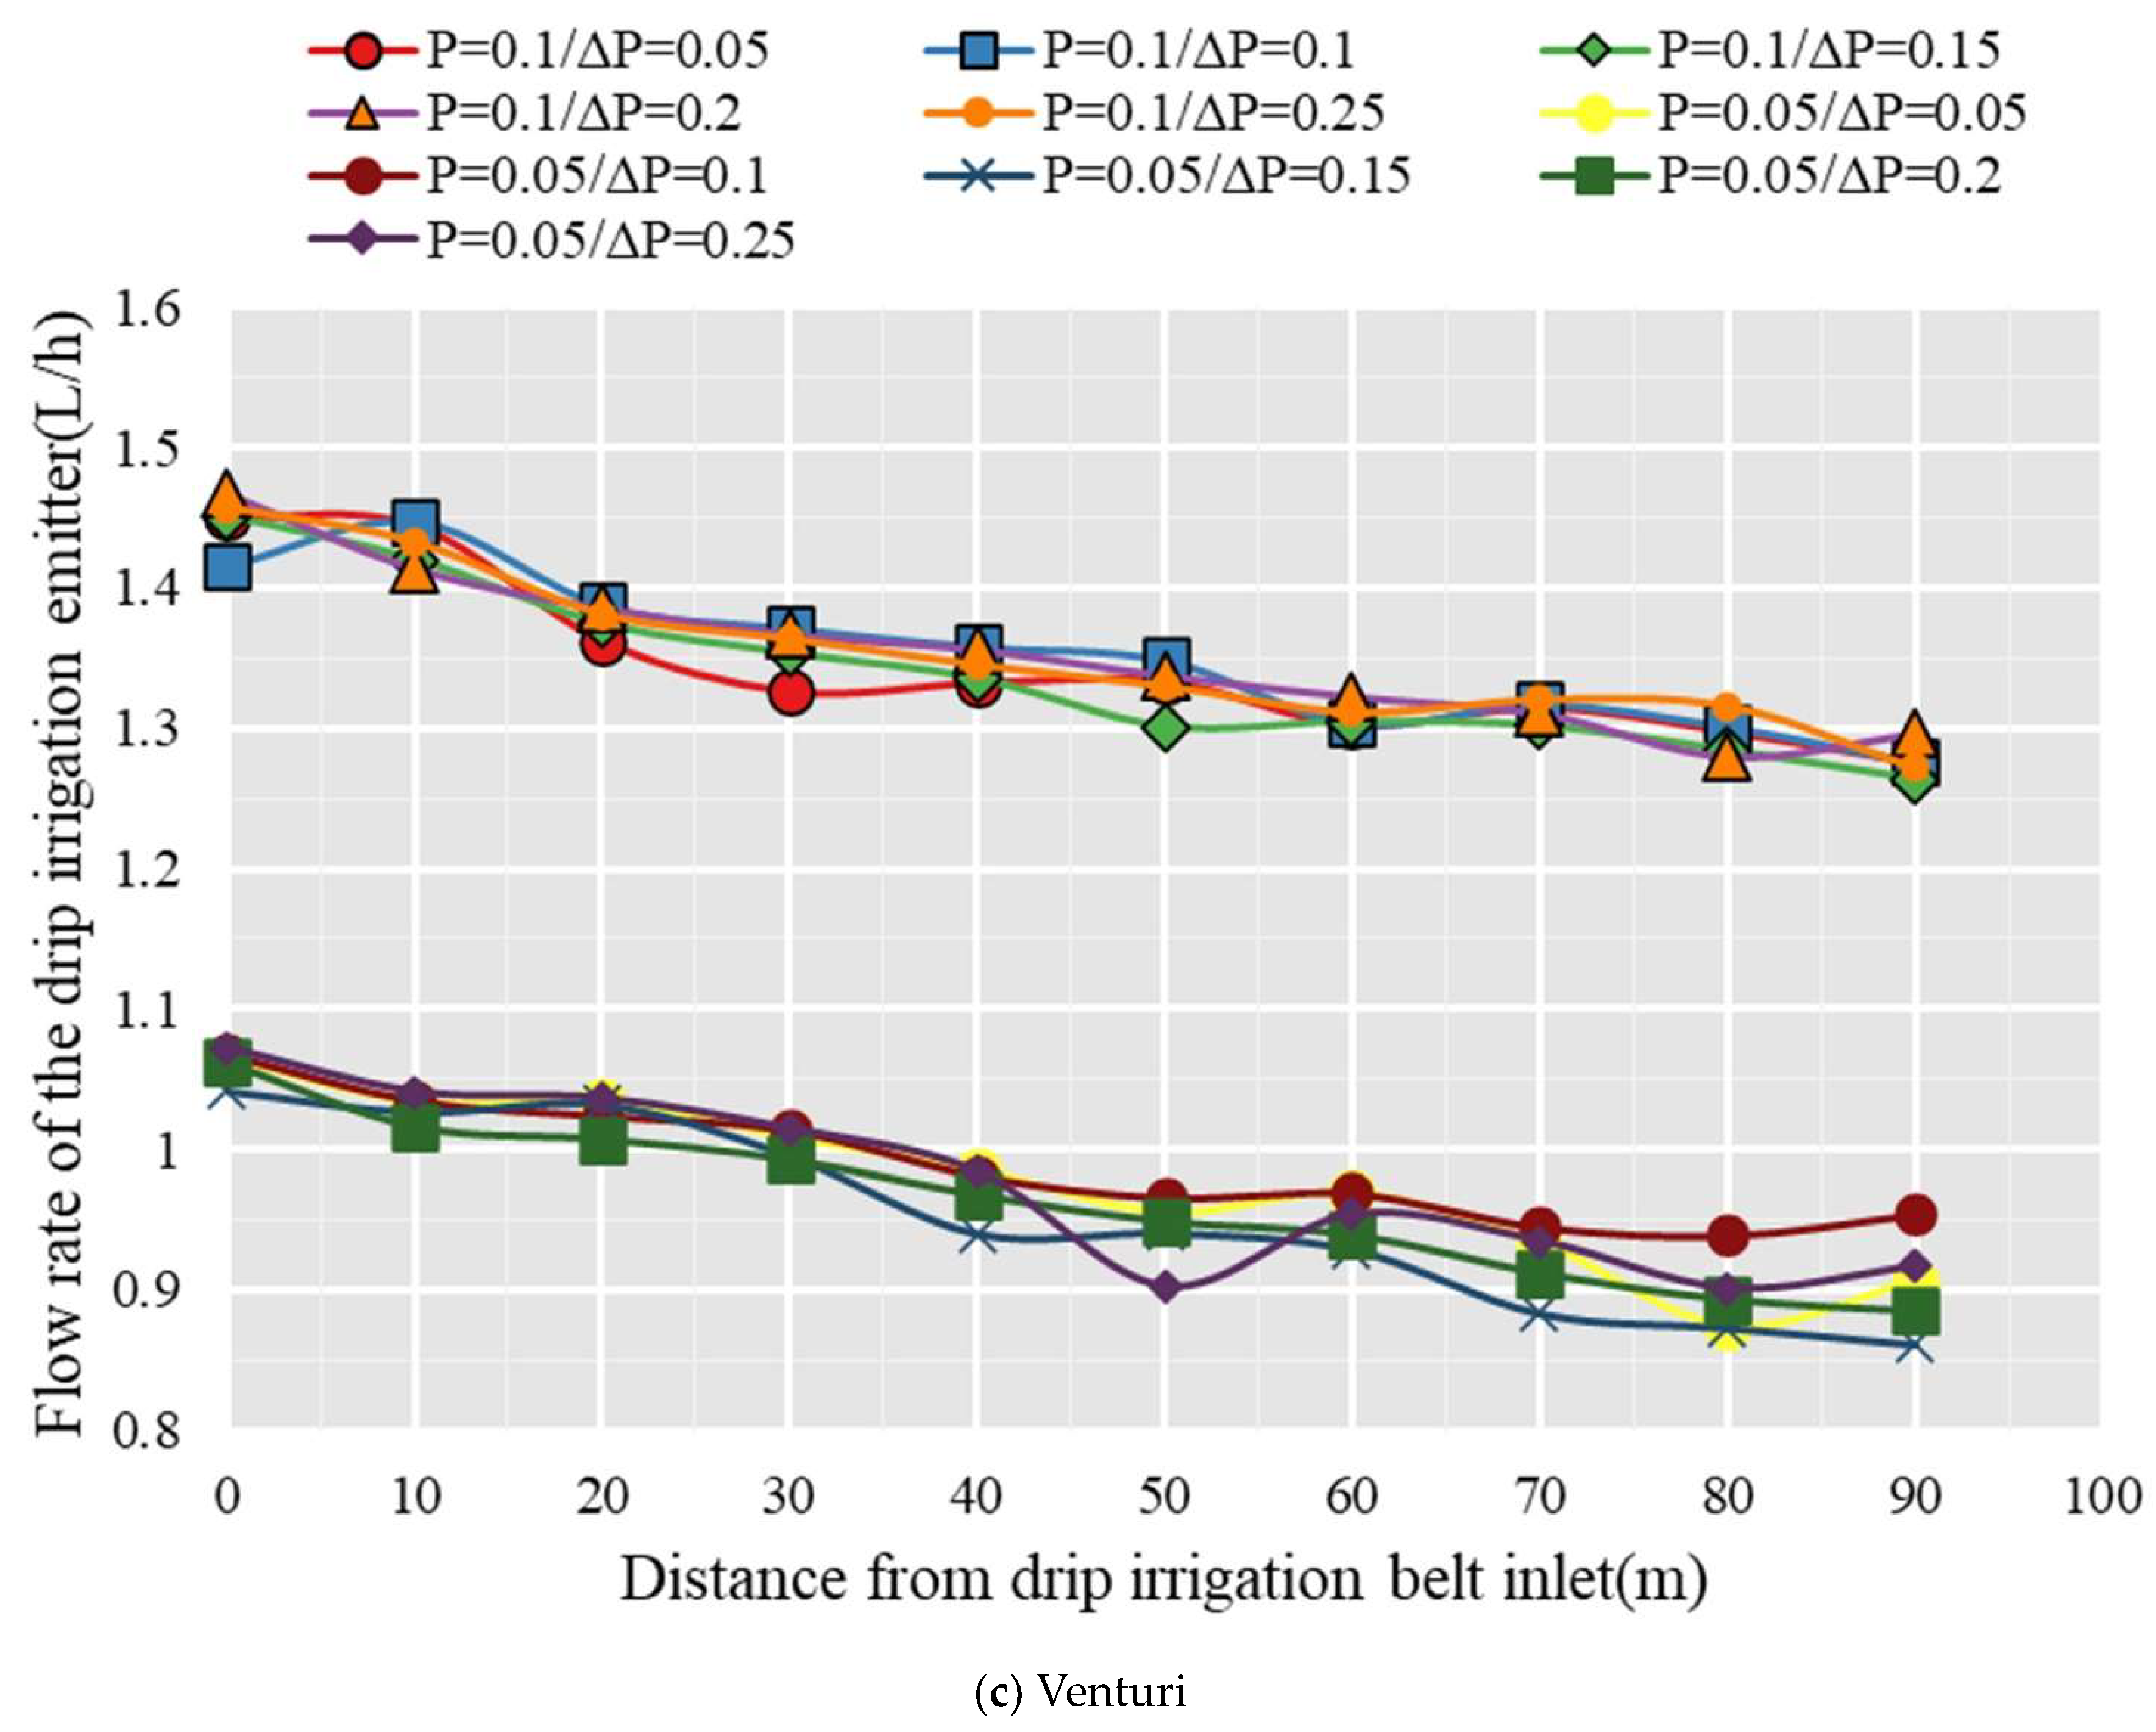
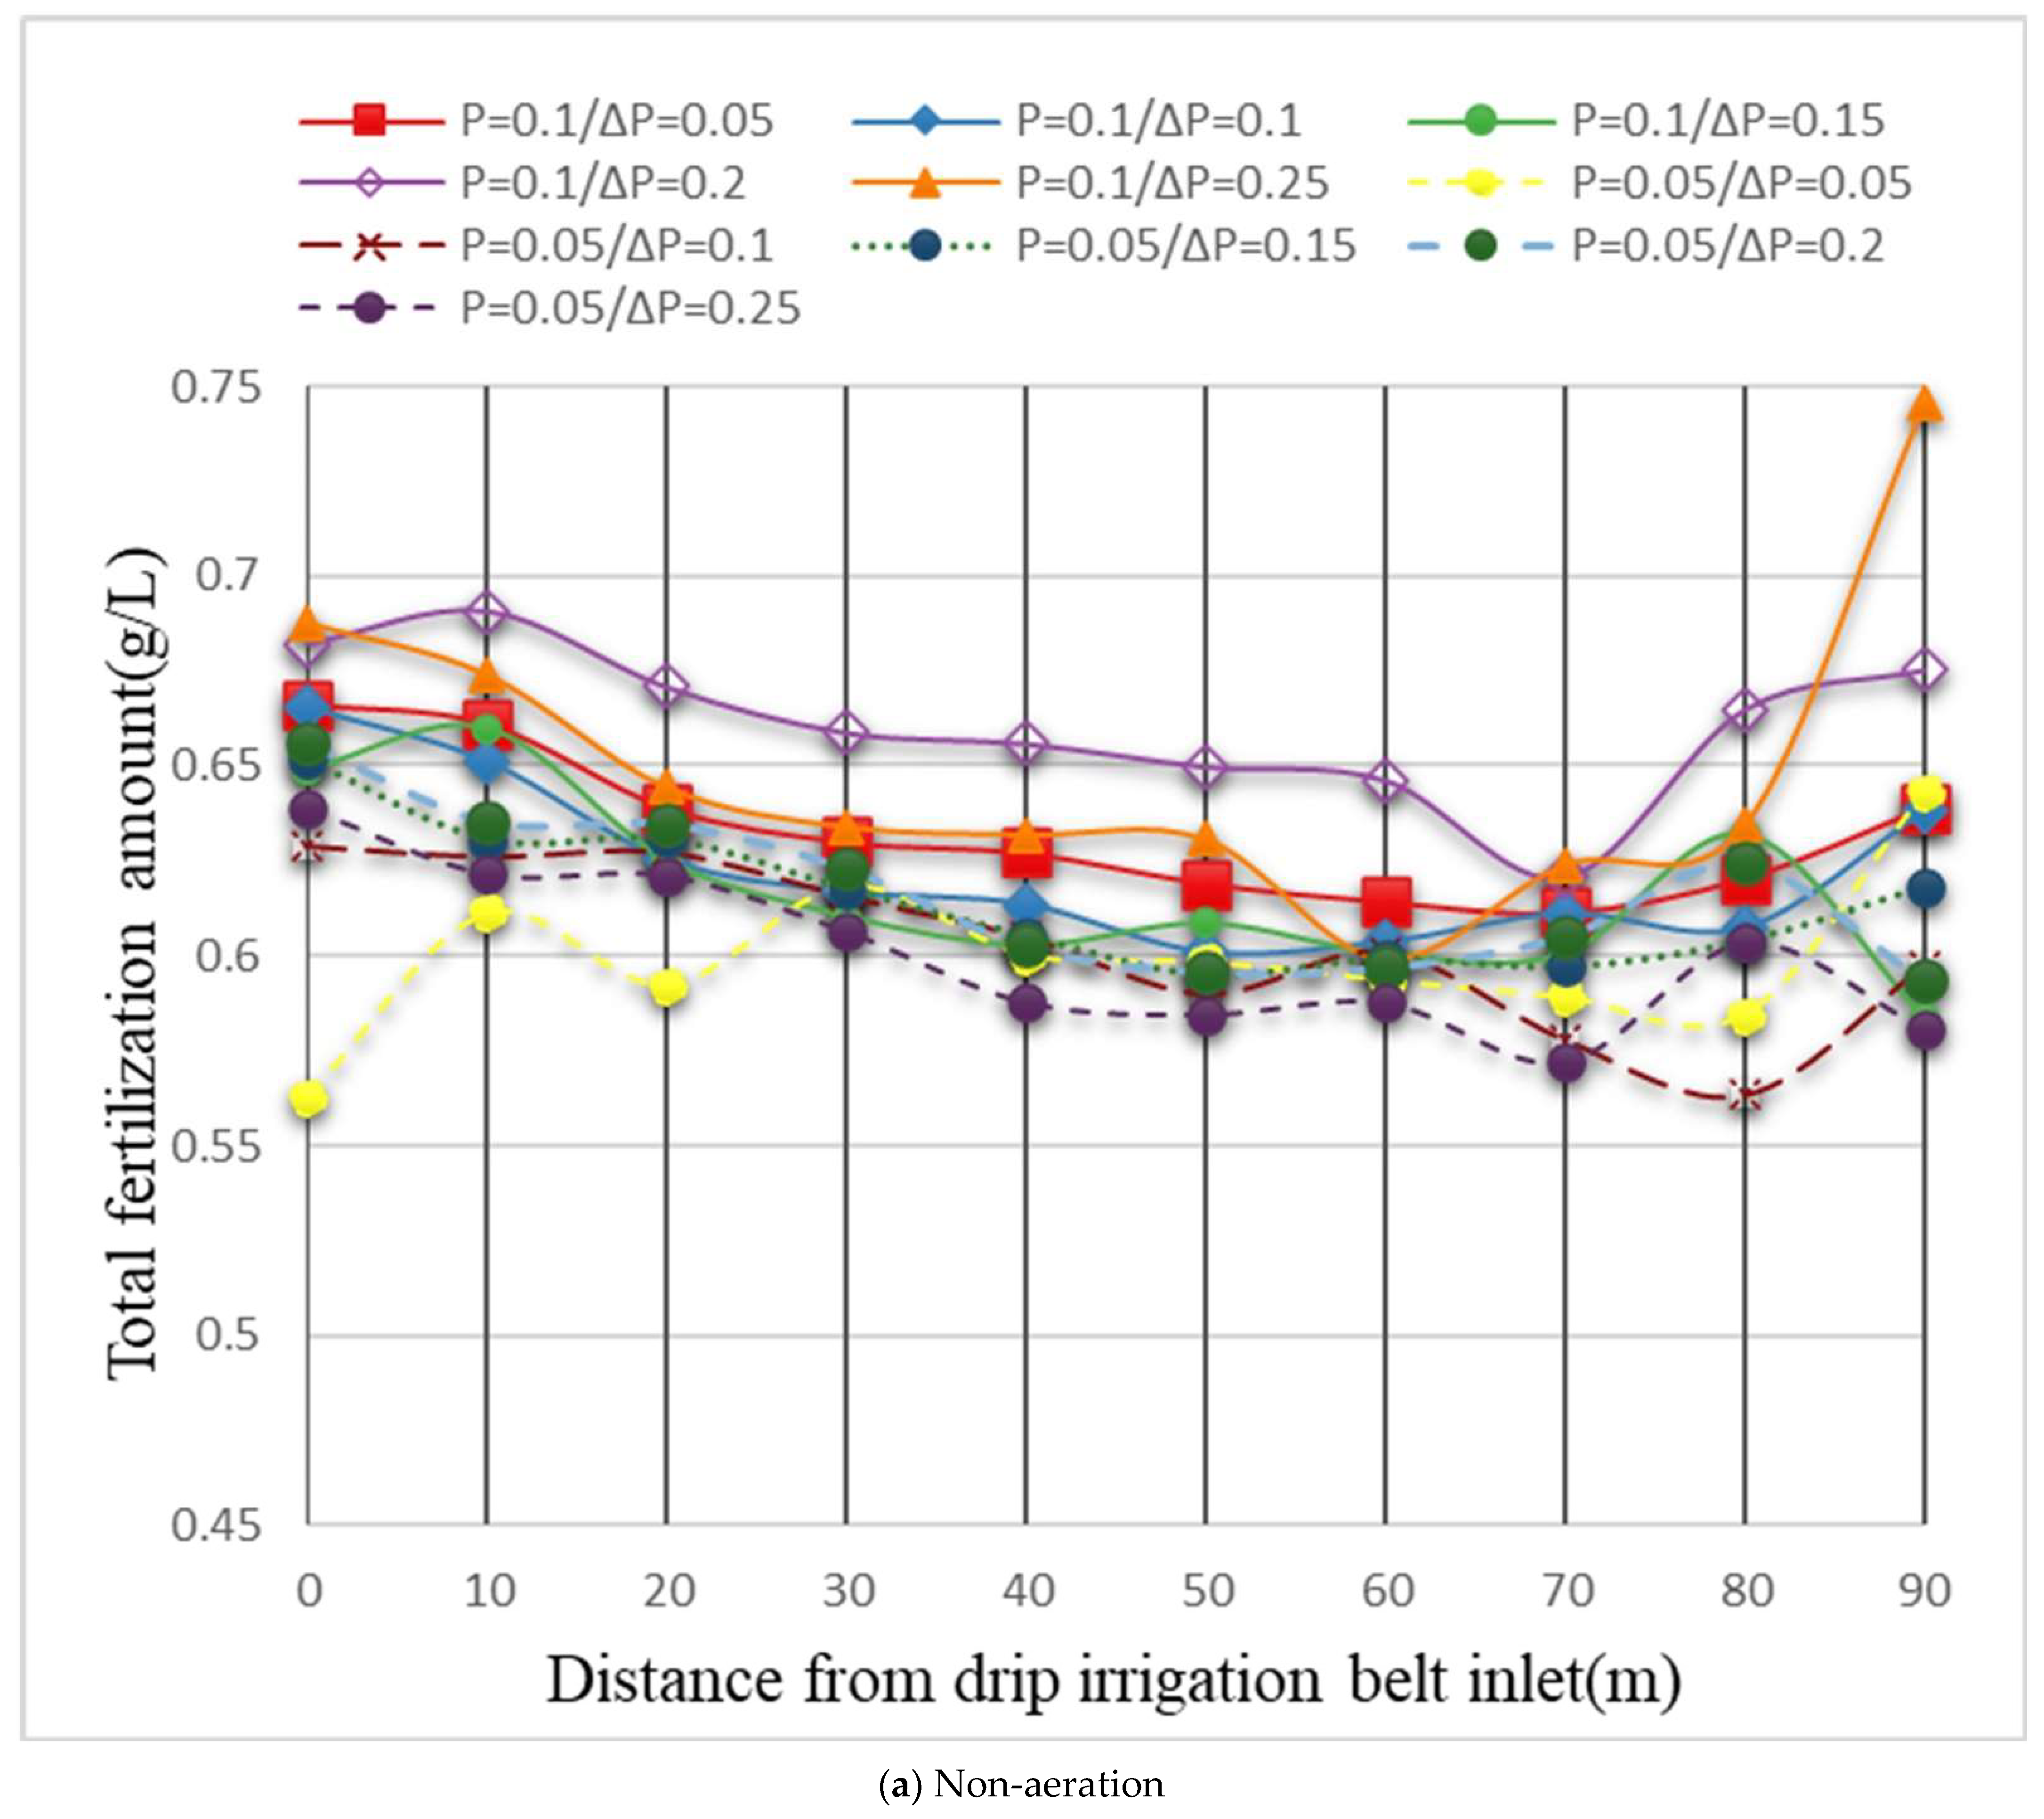
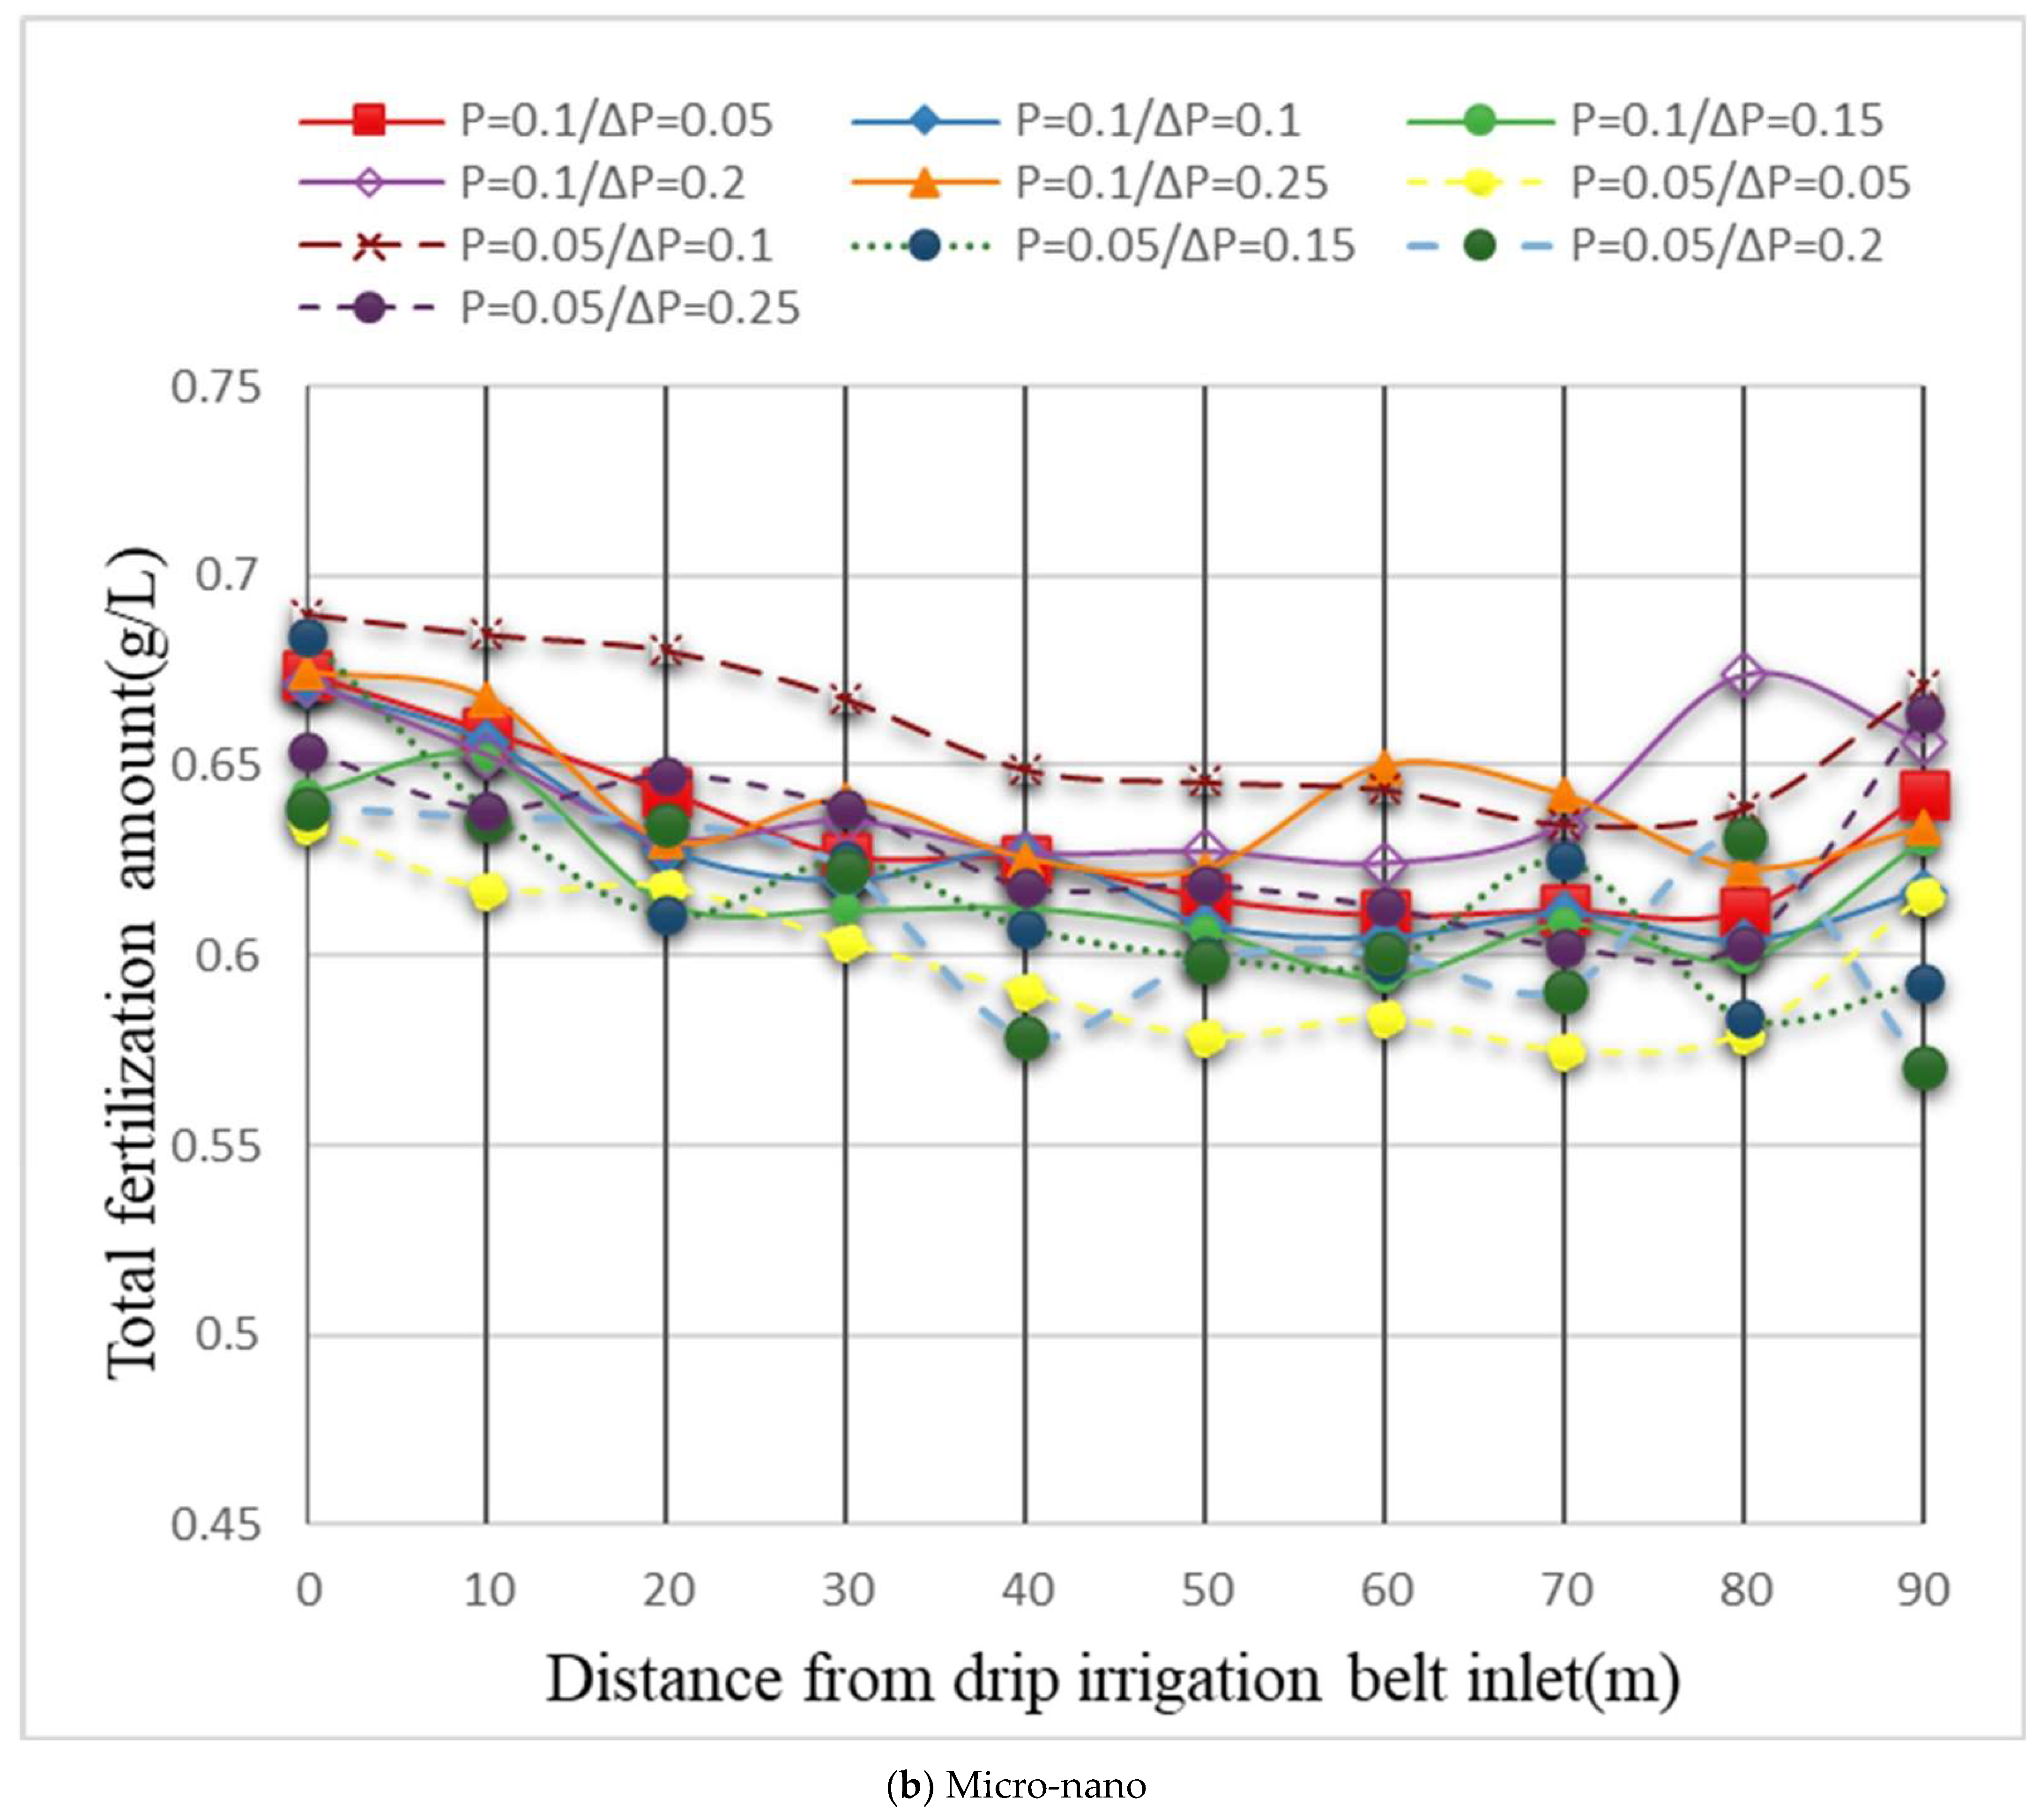
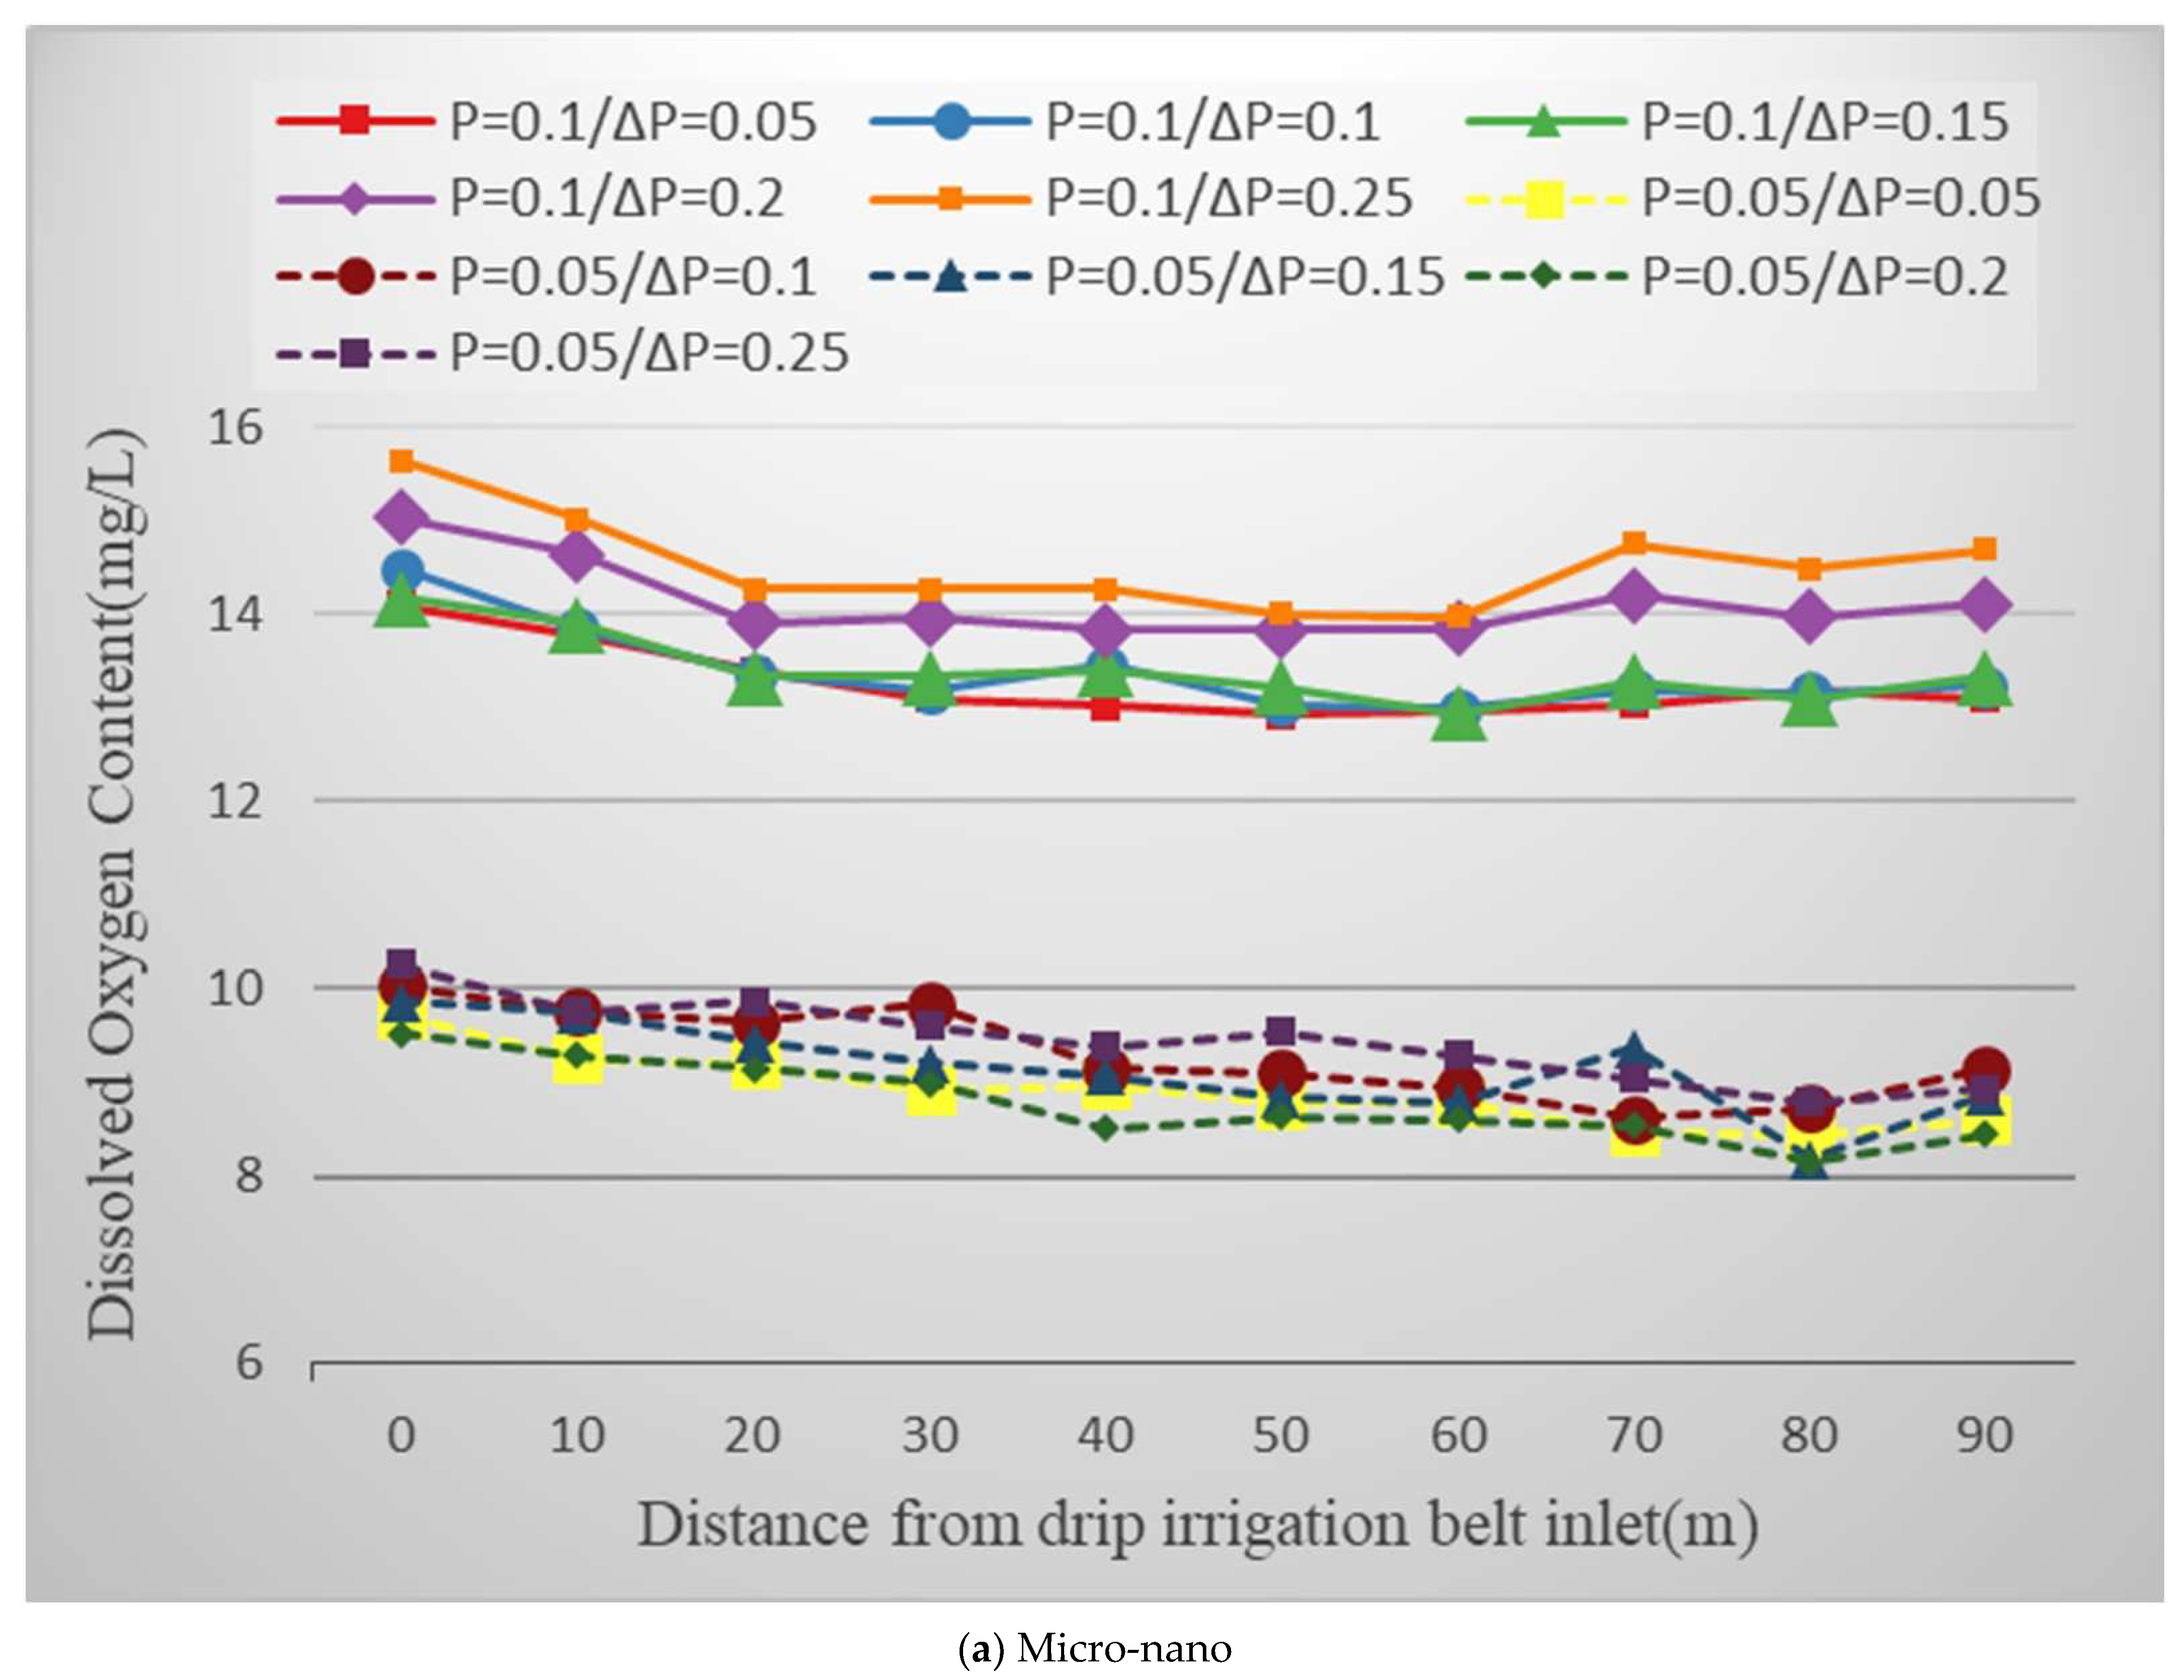
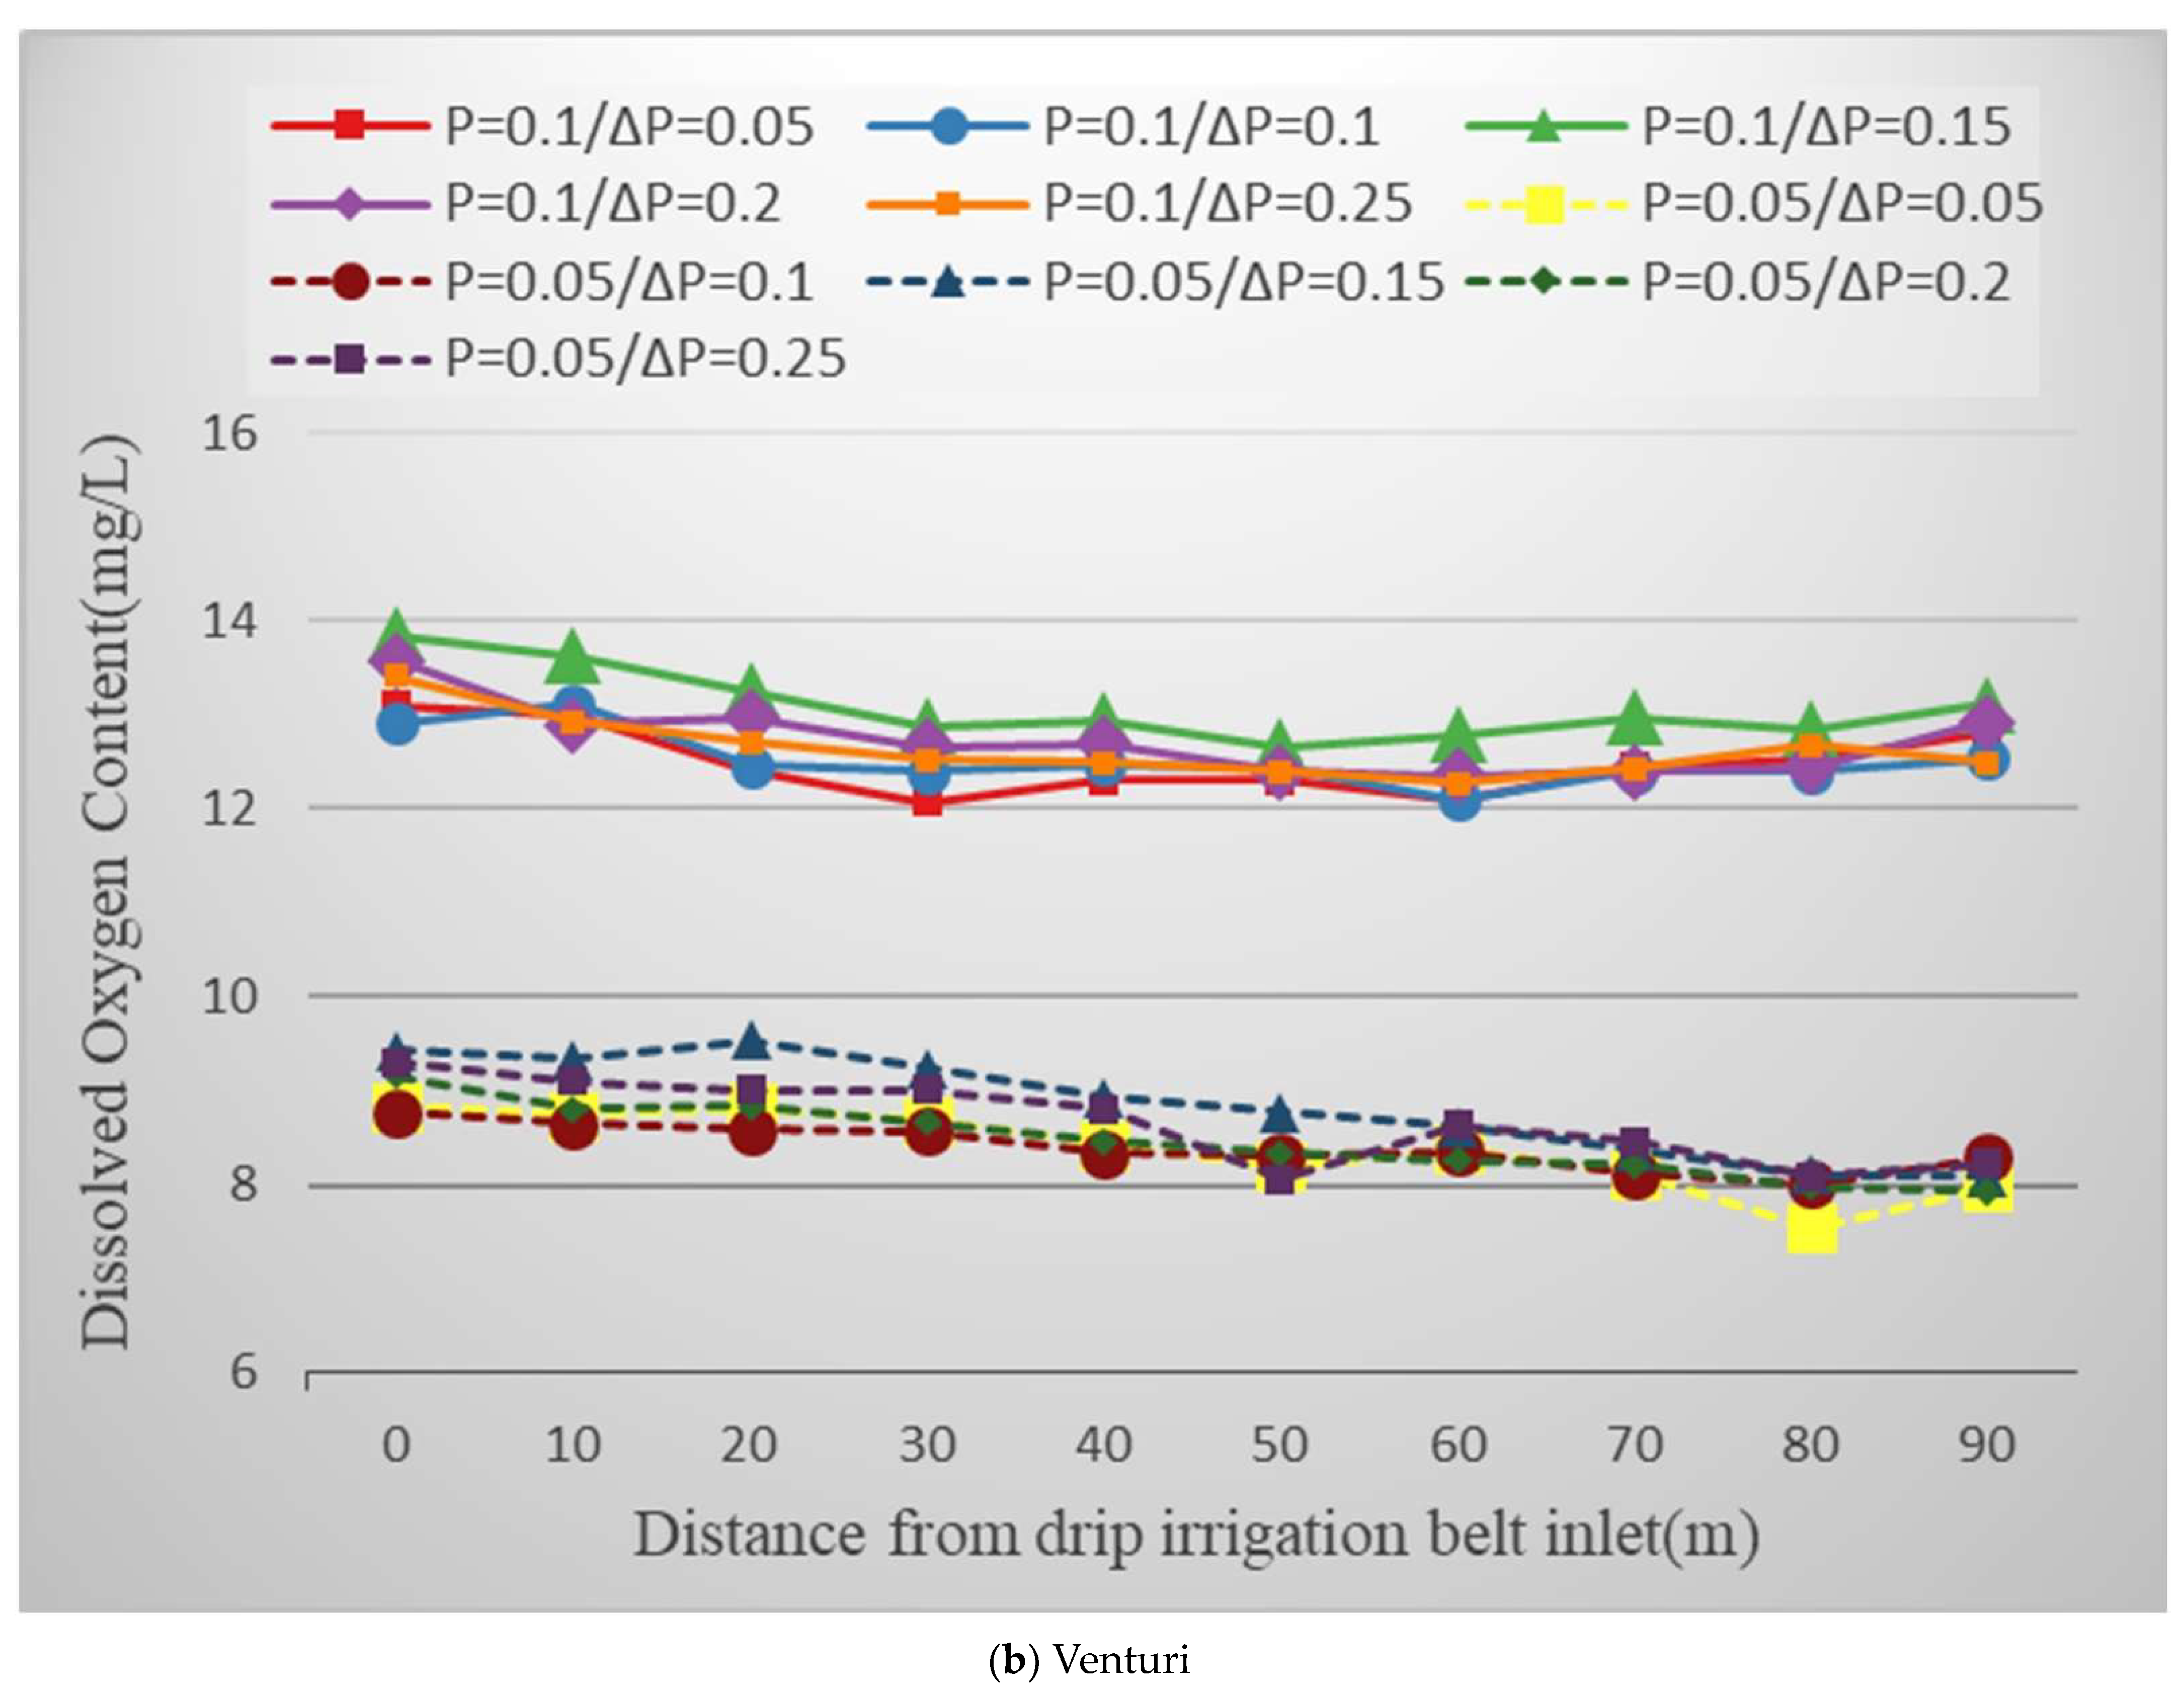
Under different technical parameter combinations, the spatial distribution of water flow rate, total fertilization amount, and dissolved oxygen content along the drip irrigation belt is shown in Figure 2, Figure 3, Figure 4, Figure 5 and Figure 6. Each point in the figure represents the average of the data from three repeated tests at each sampling point of five drip irrigation belts.

3.1. Spatial Distribution Characteristics of Water, Fertilizer, and Air

3.1.1. Spatial Distribution of the Emitter Flow Rate

From Figure 2, it can be seen that under different technical parameter combinations, the flow distribution pattern of the emitters along the drip irrigation belt is similar: there is a certain fluctuation in the flow rate of the emitters at different positions along the drip irrigation belt, and the fluctuation pattern is consistent, but overall, it shows a gradually decreasing trend. The effect of working pressure on the flow rate of the emitter is significant. At the same position of the drip irrigation belt, the flow rate of the emitter under working pressure P = 0.1 MPa is higher than that under working pressure P = 0.05 MPa by more than 25%. The pressure difference between the inlet and outlet of fertilization irrigation and the effect of aeration on the spatial distribution of the flow rate of the drip irrigation emitter is limited. After aeration, the flow rate of the drip irrigation emitter at P = 0.1 MPa has higher distribution uniformity compared with P = 0.05 MPa, and the performance is most obvious under the micro-nano aeration method.
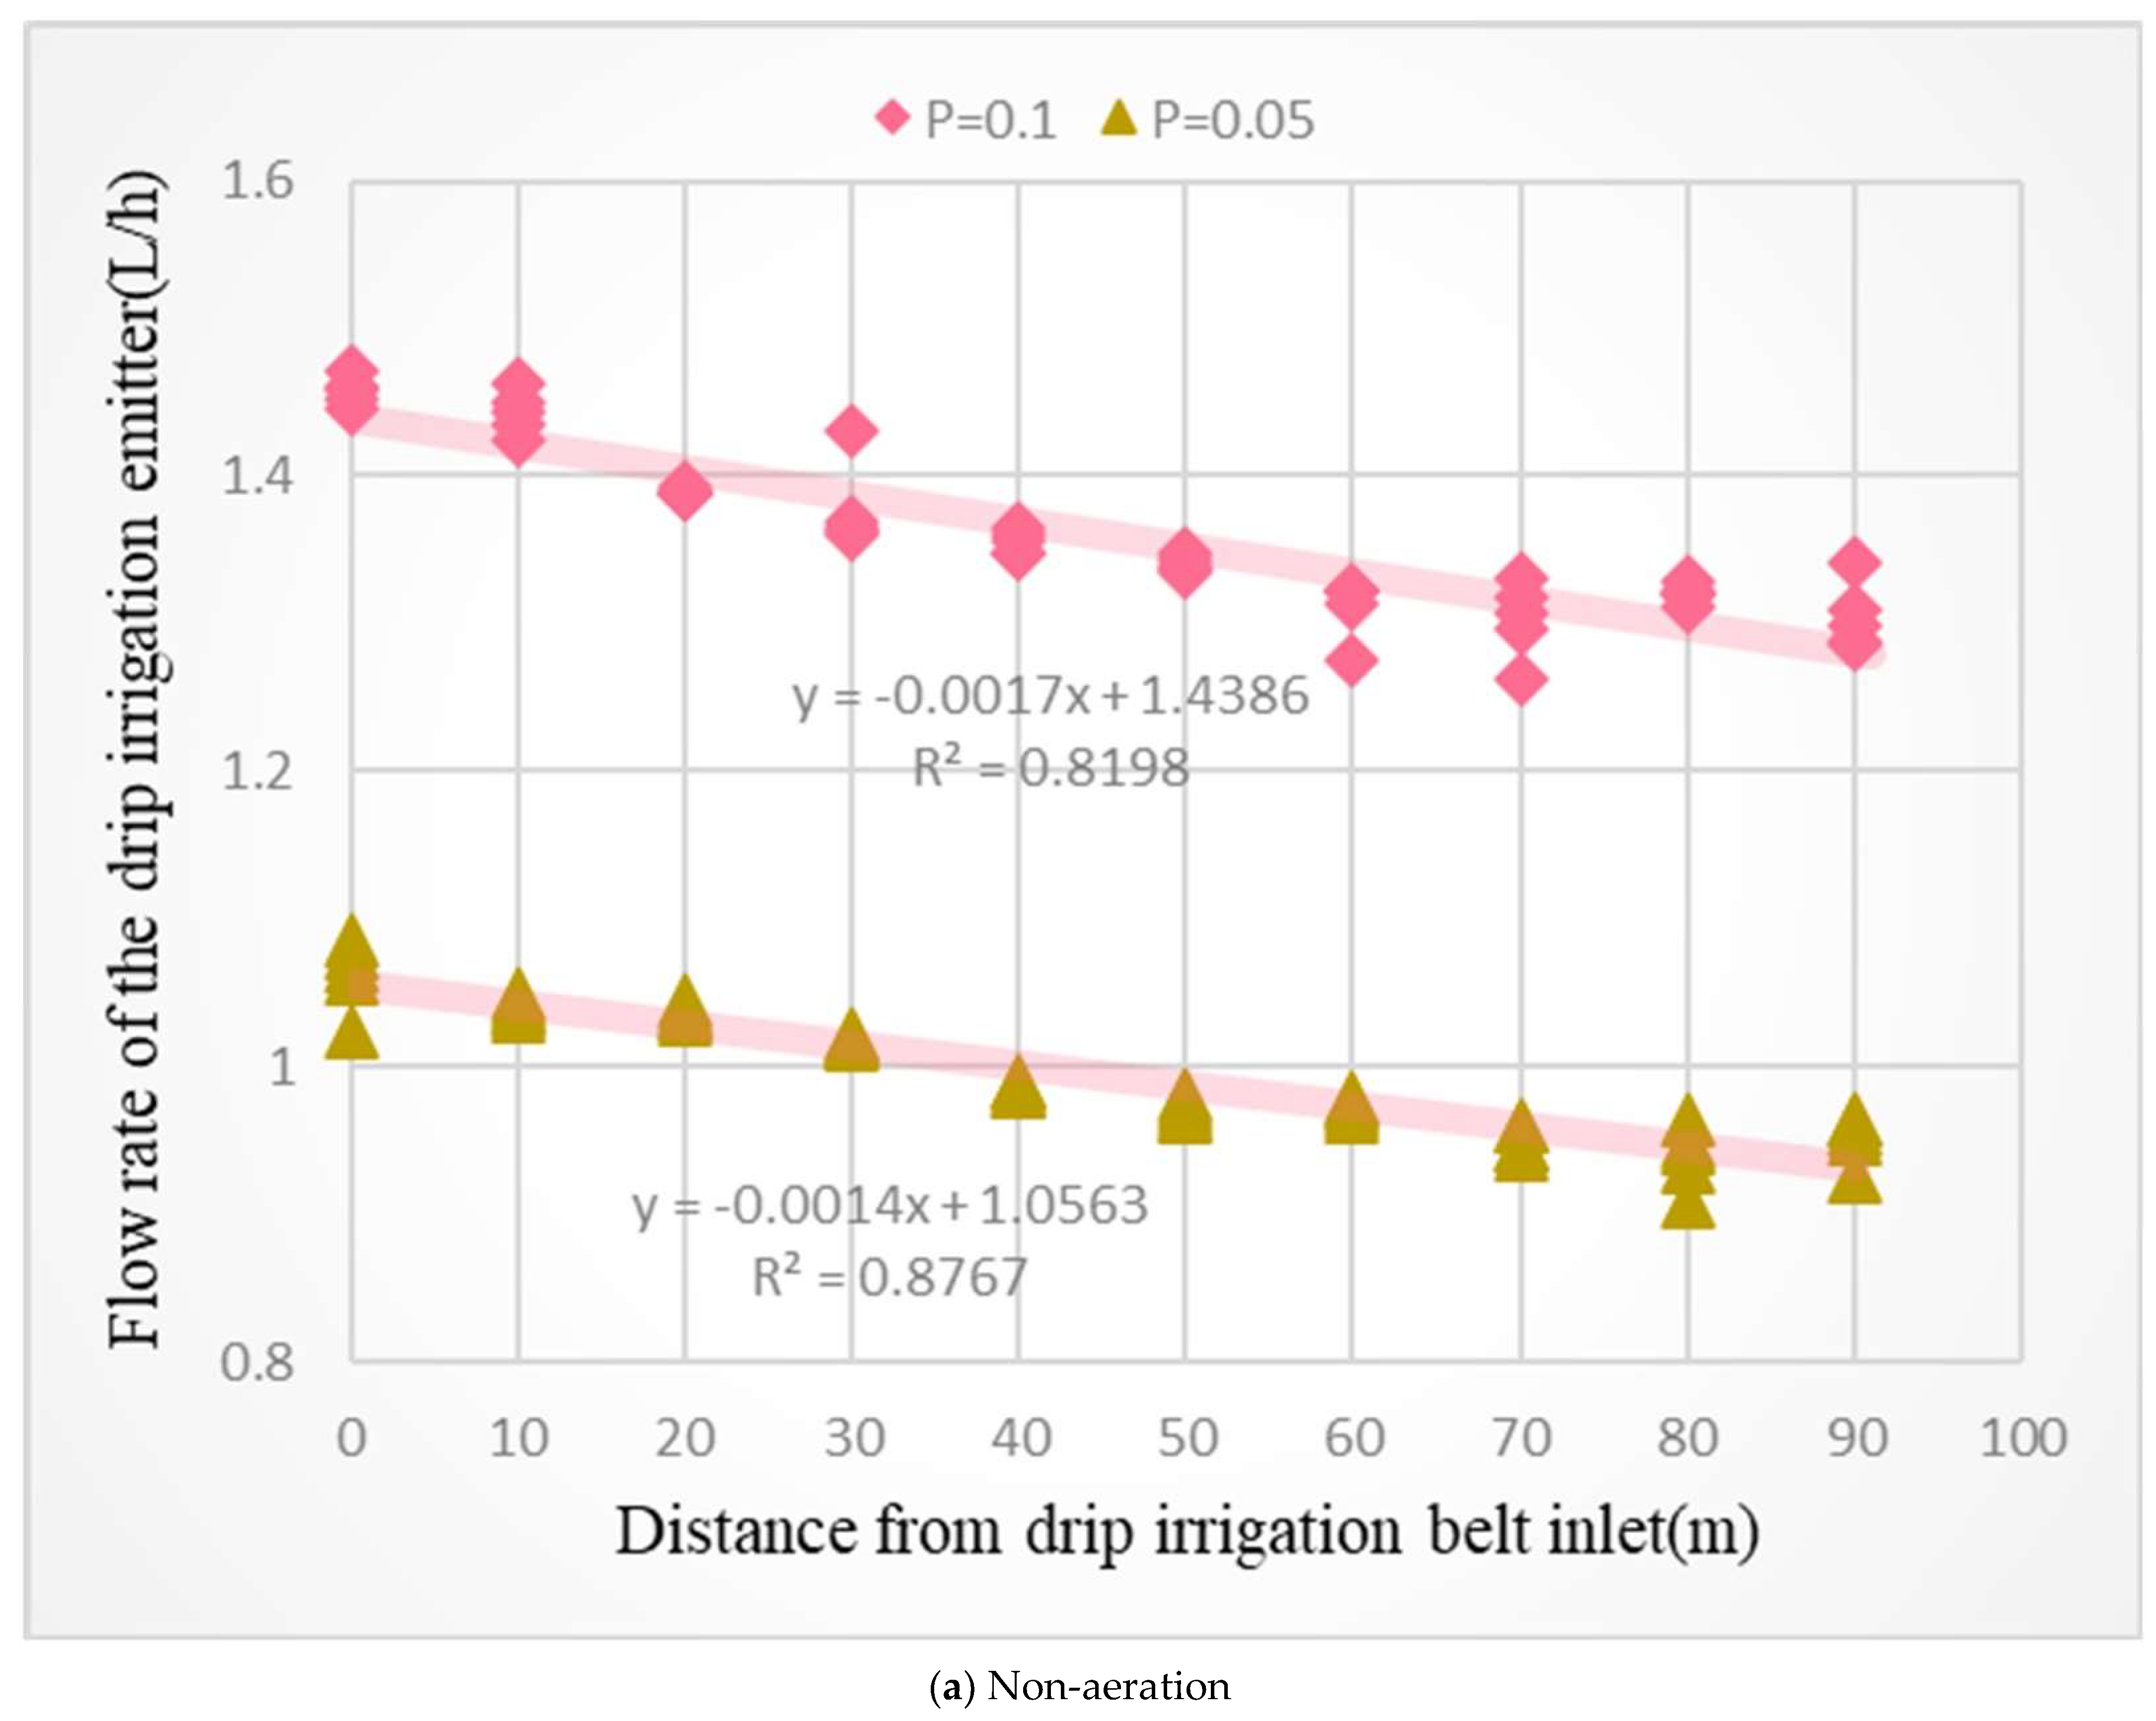
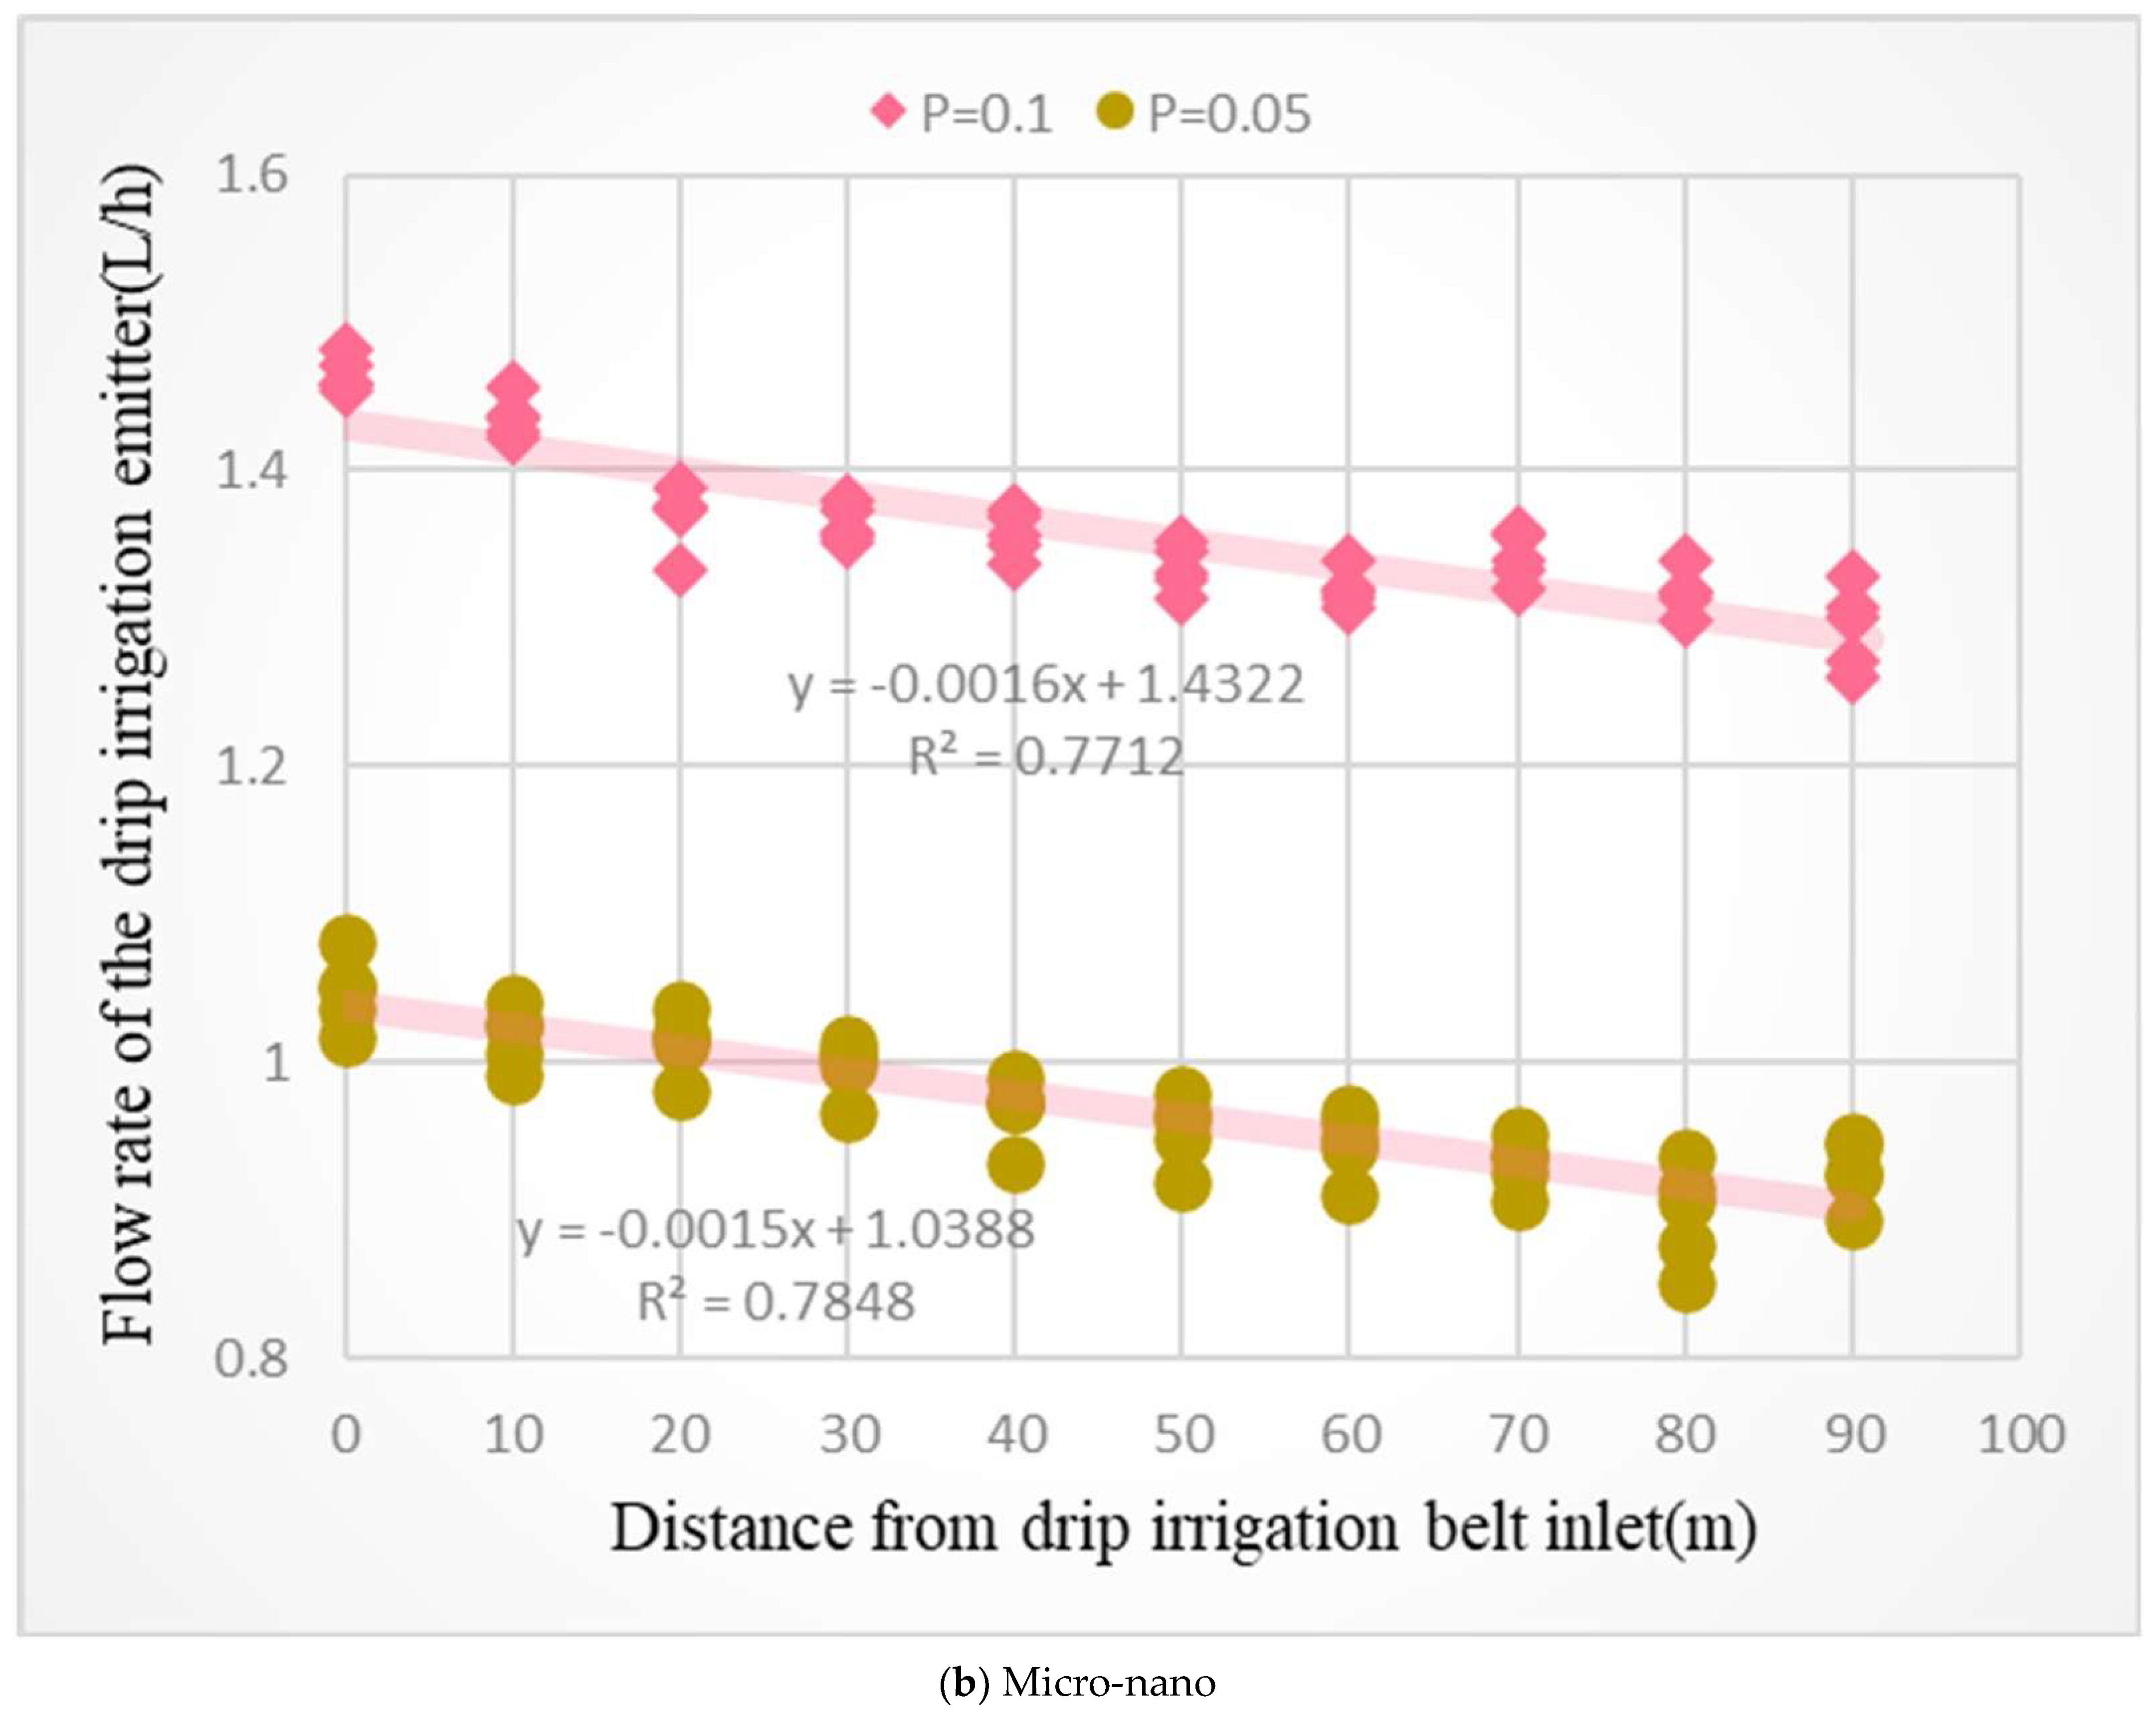
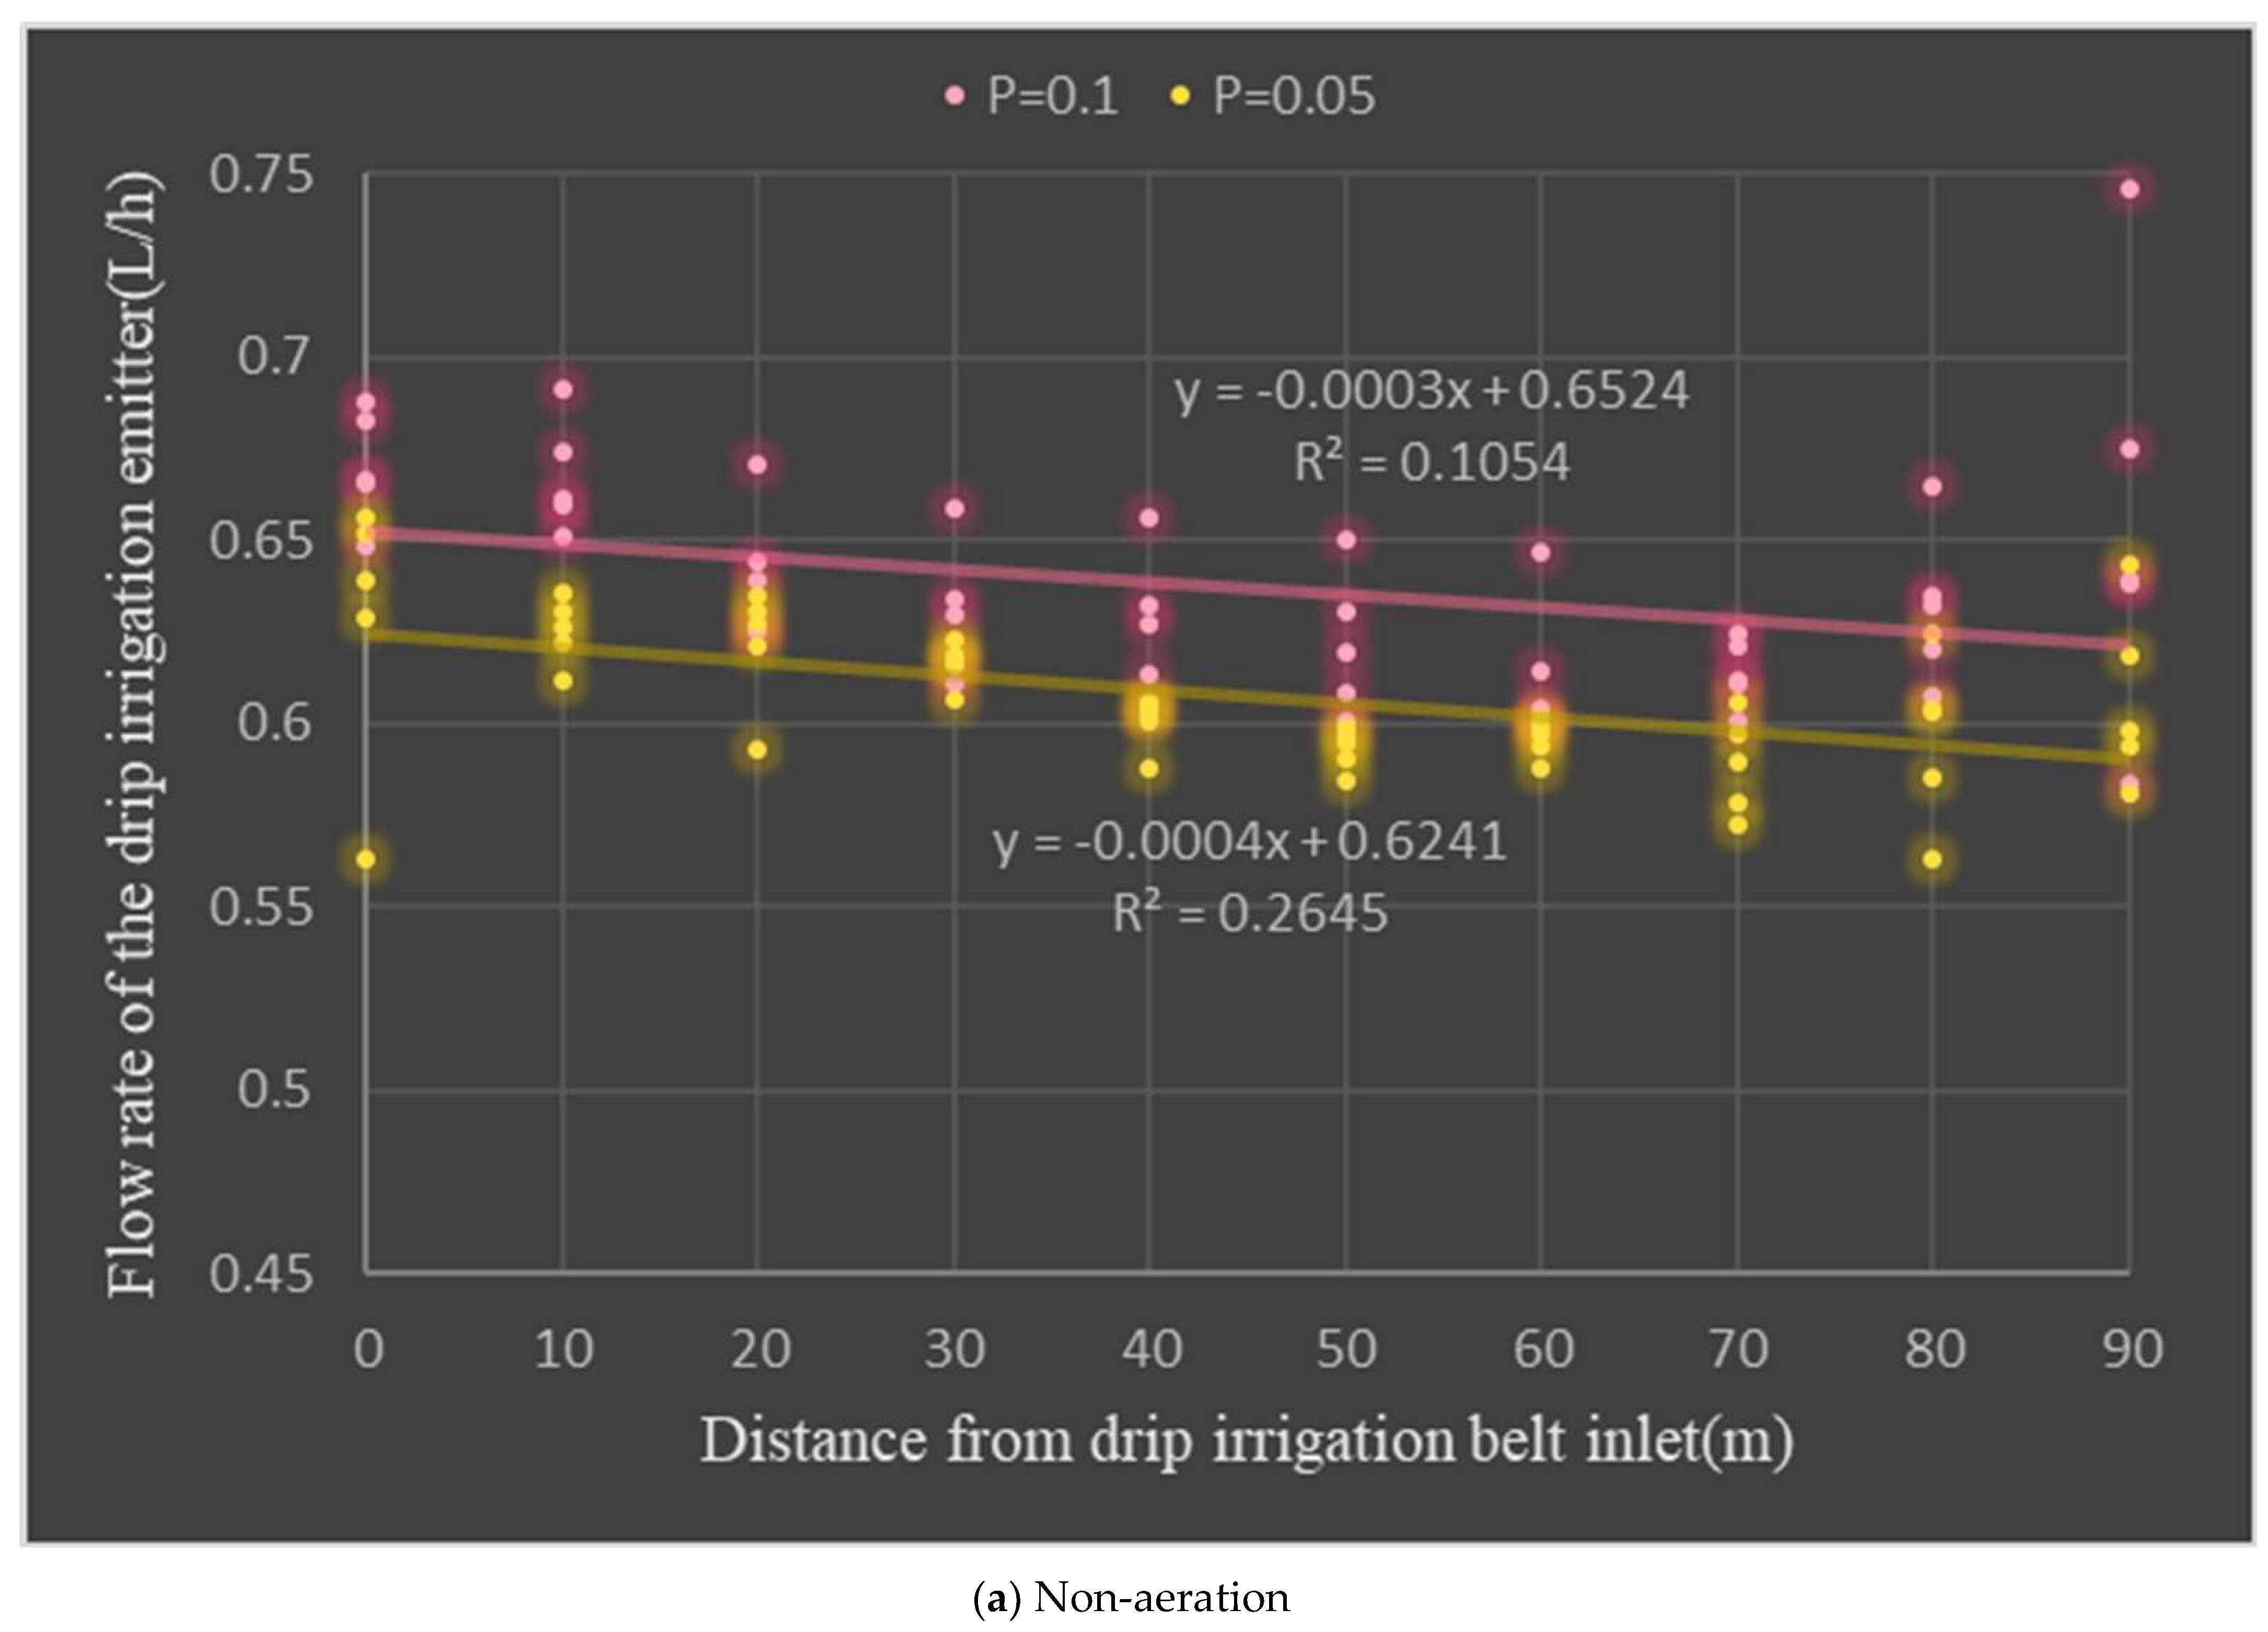
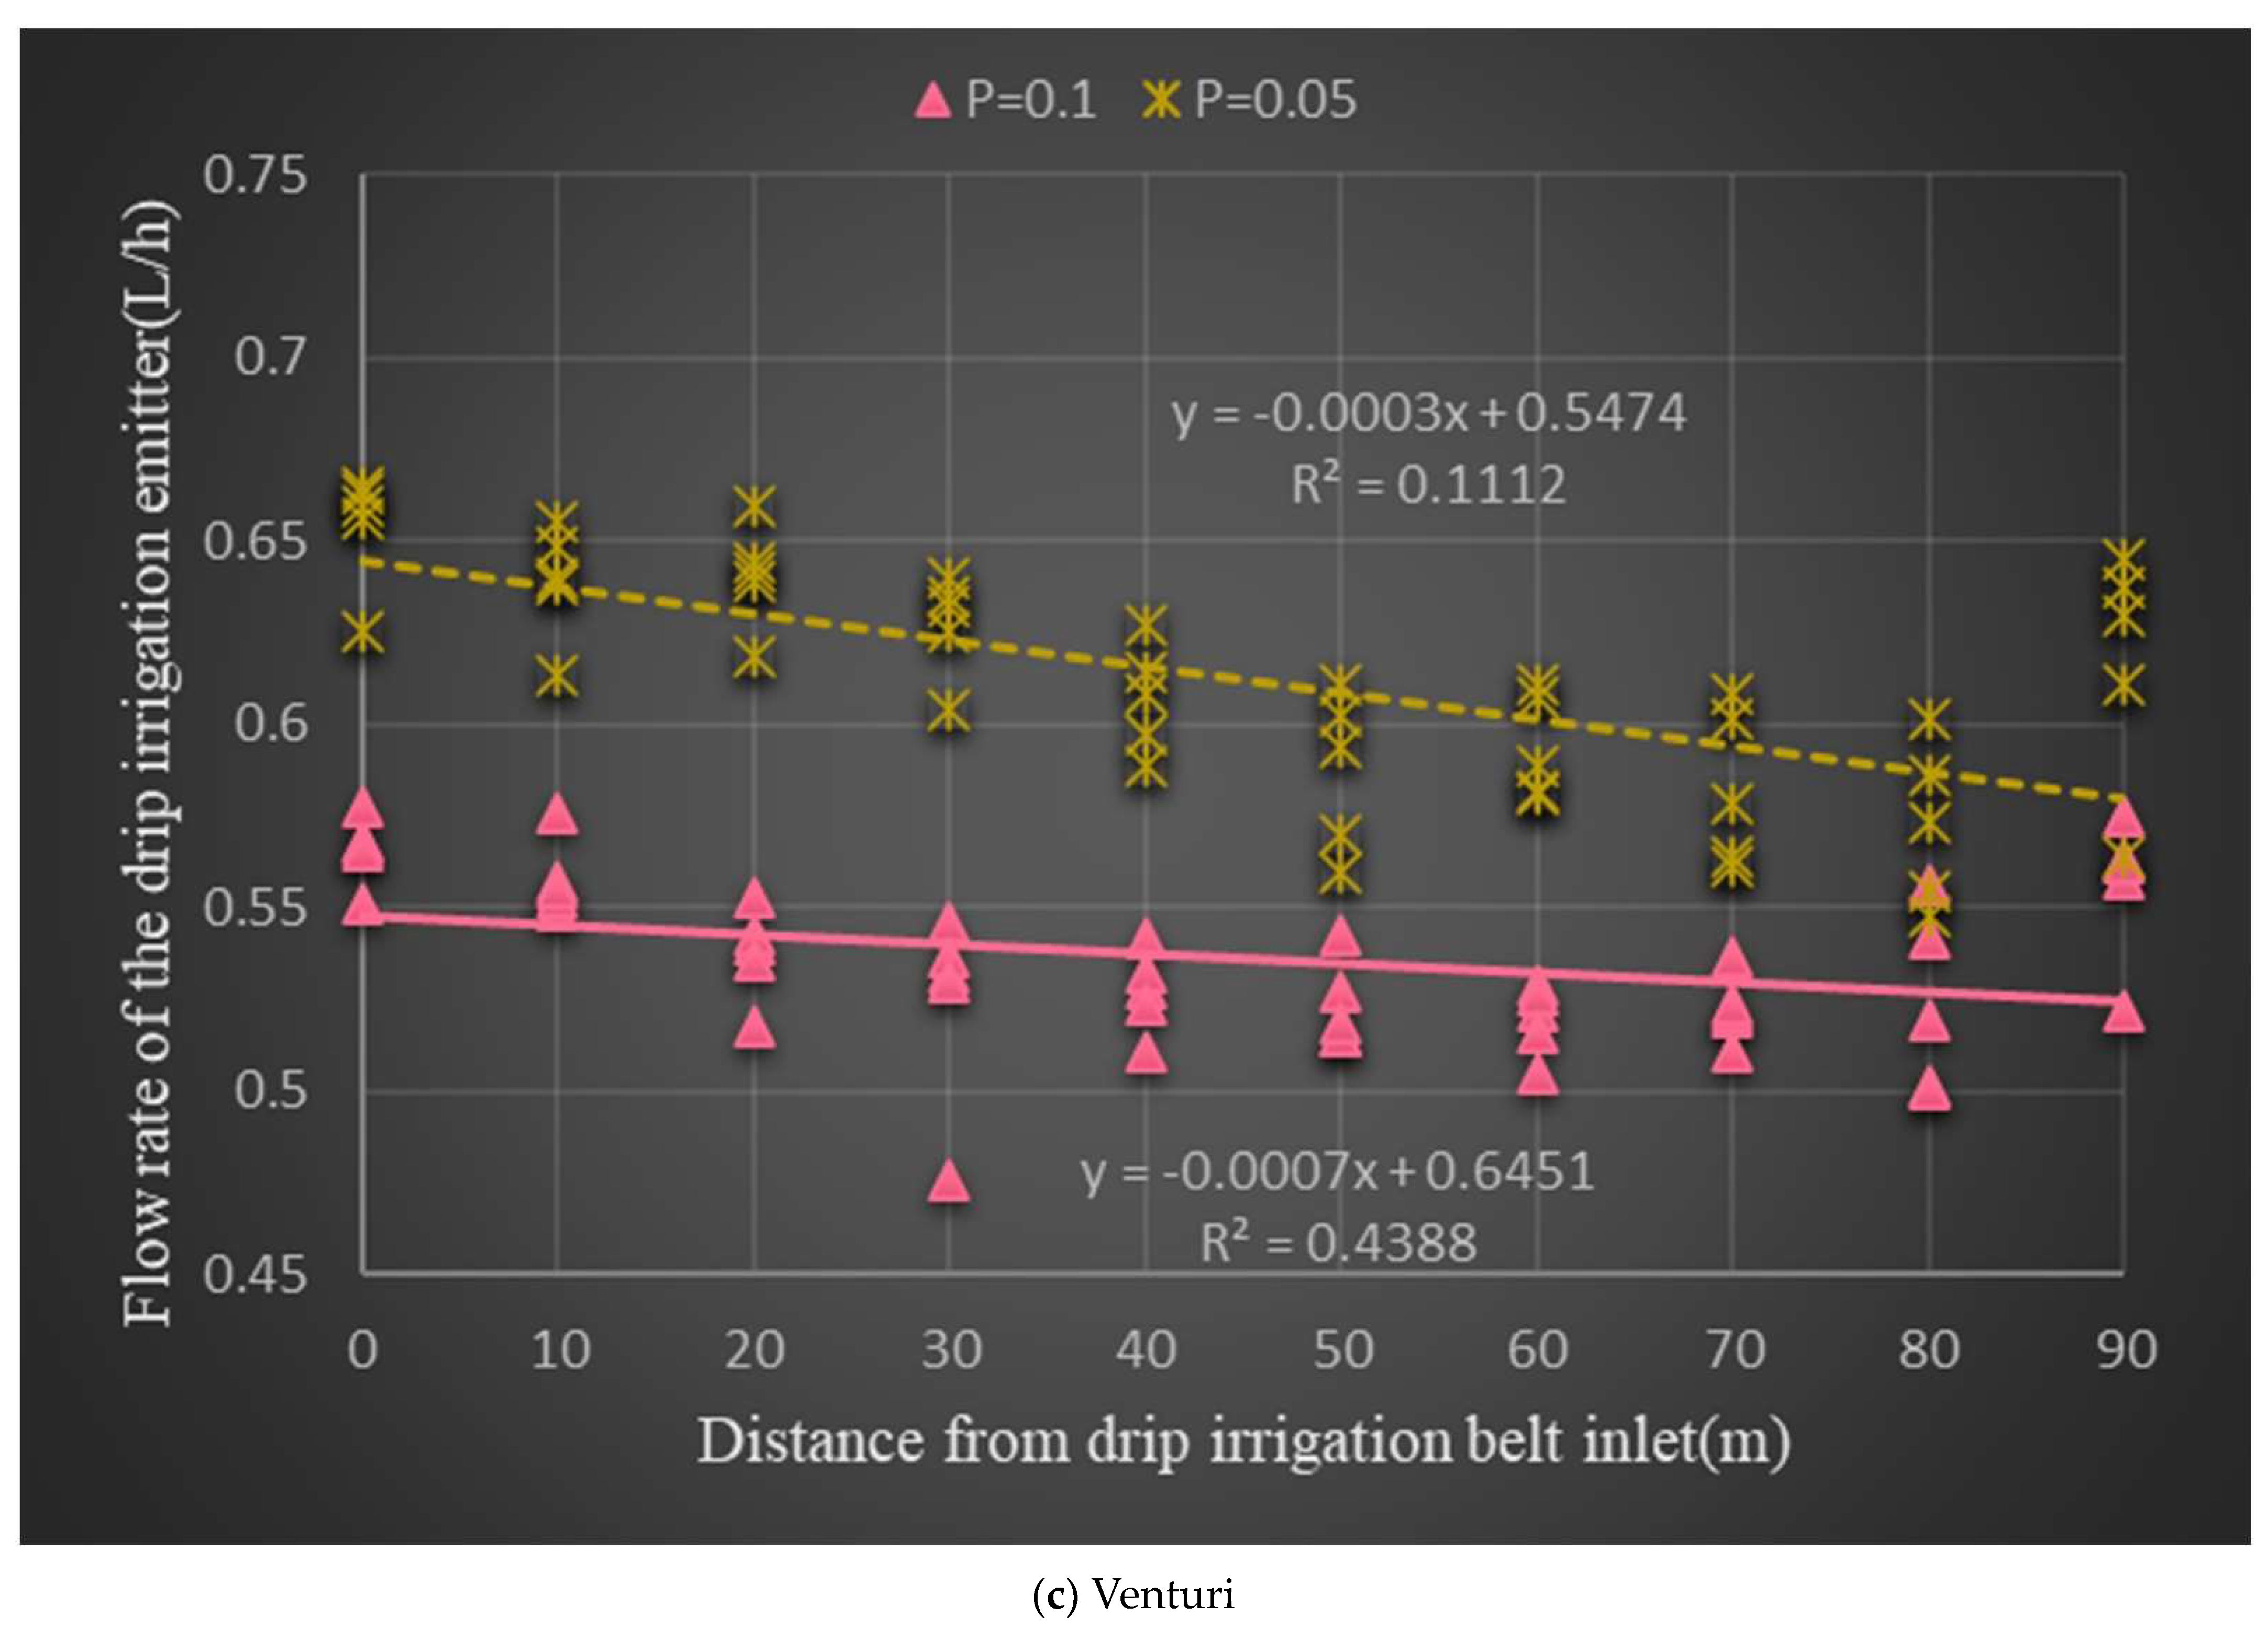
To further analyze the spatial distribution characteristics of the emitter flow rate under different technical parameter combinations, a linear fitting was performed on the emitter flow rate variation curve, as shown in Figure 3. According to the fitting curve, the slope of the fitting curve under the working pressure P = 0.1 MPa of the nonaerated test group is higher than that under the working pressure P = 0.05 MPa. In the two aeration test groups, the slope of the fitting curve remains unchanged under different working pressure conditions. After aeration, the working pressure has a significant impact on the flow rate of the emitter at the same location, but it has almost no effect on the spatial distribution of the flow rate of the emitter along the drip irrigation belt, only slowing down the rate of decrease in the flow rate of the emitter along the drip irrigation belt.

3.1.2. Spatial Distribution of the Total Fertilization Amount

The distribution of the total amount of fertilizer applied by the drip irrigation emitter along the drip irrigation belt under various technical parameter combinations is shown in Figure 4. From the figure, it can be seen that the spatial distribution characteristics of the total amount of fertilizer applied by the drip irrigation emitter and the total amount of irrigation are similar, where both show a gradual downward trend along the drip irrigation belt, but significantly lower than the rate of decrease in the flow rate of the drip irrigation emitter. In some cases, the total amount of fertilization at the end of the drip irrigation belt slightly increases. As the total amount of irrigation water gradually decreases along the direction of the drip irrigation belt, the increasing trend in the total amount of fertilization at the end of the drip irrigation belt indicates an increase in the concentration of fertilizer solution at the end of the drip irrigation belt. After comparing the spatial distribution patterns of total fertilization under various technical parameter combinations, it can be found that compared with the flow rate of the drip irrigation emitter, the pressure has a smaller impact on the spatial distribution of total fertilization. By comprehensively analyzing the distribution curve of the total fertilization and the fitting curve of the total fertilization spatial distribution (Figure 5), it can be concluded that aeration can affect the spatial distribution of total fertilization. Compared with Venturi aeration, micro-nano aeration weakens the fluctuation in total fertilization along the drip irrigation belt and reduces the rate of decrease in total fertilization along the drip irrigation belt, significantly improving the uniformity of the fertilization distribution. At the same time, it is found that Venturi aeration increases the impact of pressure on the total amount of fertilization, while micro-nano aeration significantly weakens the impact of pressure on the total amount of fertilization.
To further investigate the impact of different aeration methods on the spatial distribution of total fertilization, multiple comparative analyses were conducted in SPSS 22.0 for the different aeration methods, and the results are shown in Table 5. From the table, it can be seen that p = 0.731 > 0.05 for the nonaerated and Venturi aerated systems, p = 0.000 < 0.05 for the nonaerated and micro-nano aerated systems, and p = 0.000 < 0.05 for the micro-nano aerated and Venturi aerated systems. According to α = 0.05, except for the difference in the total fertilization between the nonaerated and Venturi-aerated groups that is not statistically significant, any of the other two groups have statistical significance. Therefore, the Venturi aeration method has no significant impact on the distribution of total fertilization in drip irrigation systems, while the micro-nano aeration method has a significant impact on the spatial distribution of total fertilization.

3.1.3. Spatial Distribution of the Dissolved Oxygen Content

Figure 6 shows the spatial distribution of dissolved oxygen content along the drip irrigation belt under two different aeration methods. From the figure, it can be seen that under the two aeration methods, the spatial distribution characteristics of dissolved oxygen content along the drip irrigation belt have similar trends, both gradually decreasing along the direction of the drip irrigation belt, and at the end of the drip irrigation belt, the dissolved oxygen content shows a slight upward trend.
However, the distribution characteristics of the dissolved oxygen content in the irrigation water vary under the different aeration methods. Under various experimental conditions, the dissolved oxygen content is higher at a working pressure of P = 0.1 MPa than at P = 0.05 MPa. The pressure difference between the inlet and outlet of the fertilizer tank has a limited influence on the dissolved oxygen content under the different aeration methods. Under the same working conditions, the dissolved oxygen content under micro-nano aeration is higher than that under Venturi aeration.

3.2. Significance Analysis of the Spatial Distribution of Water, Fertilizer, and Air

To further study the effects of various technical parameters on the spatial distribution of water, fertilizer, and air in the co-application of the water, fertilizer, and air drip irrigation system, the statistical analysis software SPSS 22.0 was used to conduct a one-way analysis of variance on the flow rate of the irrigation system, total amount of fertilization, and dissolved oxygen content. The analysis results are shown in Table 6.
From the table, it can be seen that the working pressure can have a significant impact on the flow rate, the total amount of fertilization, and the dissolved oxygen content of the drip irrigation emitter (p < 0.01), with a particularly significant impact on the flow rate and dissolved oxygen content of the drip irrigation emitter. The aeration method does not have an impact on the flow rate of the drip irrigation emitter (p > 0.05), but it has a significant impact on the total amount of fertilization and the dissolved oxygen content (p < 0.01). The pressure difference between the inlet and outlet of the fertilization tank has no significant impact on the flow rate of the drip irrigation emitter, the total amount of fertilization, or the dissolved oxygen content (p > 0.05).

3.3. Calculation and Evaluation of System Uniformity

To study the performance of drip irrigation systems under the co-application of water, fertilizer, and air, based on the fact that the pressure difference between the inlet and outlet of the fertilization tank has no significant impact on the flow rate, fertilization, and aeration of the drip irrigation emitter, the average values of the irrigation amount, total amount of fertilization, and dissolved oxygen content of each inlet and outlet pressure difference under different technical parameter combinations were taken for system uniformity calculation and evaluation. The evaluation indicators for system uniformity under various technical parameter combinations are shown in Table 7.
From the table, it can be seen that under different technical parameter combinations, the irrigation uniformity of the drip irrigation system is good. Among them, Christensen’s uniformity coefficient C u of the irrigation amount is about 95% to 97%; the distribution uniformity coefficient D U is about 0.92 to 0.95; the coefficient of variation C v is approximately 0.04–0.06; and the statistical uniformity coefficient U s is approximately 94% to 96%. The uniformity of the dissolved oxygen and the irrigation amount is relatively similar: among them, Christensen’s uniformity coefficient C u of dissolved oxygen is about 95% to 97%; the distribution uniformity coefficient D U is about 0.93 to 0.96; the coefficient of variation C v is approximately 0.04–0.06; and the statistical uniformity coefficient U s is approximately 94% to 96%. The uniformity of fertilization is relatively poor: among them, Christensen’s uniformity coefficient C u of the fertilization amount is about 95% to 96%; the distribution uniformity coefficient D U is about 0.92 to 0.95; the coefficient of variation C v is approximately 0.05–0.07; and the statistical uniformity coefficient U s is approximately 93% to 95%.
According to ASAE standard EP 458 [17], the uniformity of the emitter flow rate, the total amount of fertilization, and the dissolved oxygen content in drip irrigation systems under different technical parameter combinations can be classified and evaluated using the statistical uniformity coefficient U s . The evaluation criteria are shown in Table 8. The results (Table 9) indicate that the uniformity of the flow rate of the water dispenser is excellent under nonaerated conditions, and after aerating, it is only optimal at the working pressure P = 0.1 MPa. At the working pressure P = 0.05 MPa, the uniformity of the water flow rate under both aeration methods is between good and excellent. The uniformity of the total amount of fertilization is optimal under the micro-nano aeration method and the working pressure P = 0.1 MPa, while the uniformity is between good and excellent under other technical parameter combinations. The uniformity of dissolved oxygen content is between good and excellent under the micro-nano aeration method, and the uniformity is between good and excellent under the working pressure P = 0.05 MPa. The uniformity under other technical parameter combinations is excellent. Overall, the uniformity of the aerated drip irrigation system is better when the working pressure is P = 0.1 MPa, with the combination of the micro-nano aeration method and working pressure P = 0.1 MPa achieving the best system performance (Table 3, Table 4, Table 5, Table 6, Table 7, Table 8 and Table 9).

4. Discussion

The aeration in a drip irrigation system generates air–liquid two-phase flow, which disturbs the flow of the original medium in the drip irrigation system, affects system performance, and changes the distribution characteristics of water, fertilizer, and air in the entire system. The experimental results show that under different technical parameter combinations, the co-application of water, fertilizer, and air results in similar changes in water, fertilizer, and air along the drip irrigation belt and overall show a gradually decreasing trend. This phenomenon is consistent with the research results of Li Jiusheng et al. [19] and Fan Junliang et al. [20]. The head loss along the drip irrigation belt causes the flow rate of the emitter to gradually decrease.

4.1. Effect of the Co-Application of Water, Fertilizer, and Air on the Flow Rate of Emitters in Drip Irrigation Systems

In the process of water, fertilizer, and air transportation in drip irrigation systems, the flow rate of the emitter at a working pressure of P = 0.1 MPa is significantly higher than that at a working pressure of P = 0.05 Mpa. This is because the increase in pressure increases the water flow rate in the emitter channel. As the pressure increases, the area of the low-speed zone in the emitter channel gradually decreases, while the area of the high-speed zone increases, resulting in a larger flow rate of the emitter [21,22]. Compared with the significant impact of working pressure on the flow rate of the emitter, the pressure difference between the inlet and outlet of the aeration and fertilization tank has no significant impact on the flow rate of the emitter. This is because the pressure difference between the inlet and outlet of the fertilization tank mainly affects the uniformity of fertilization and cannot change the inlet pressure of the emitter flow channel [23]. This result is consistent with the research of Fan Junliang et al. [20]. Aeration can slow down the decrease in the flow rate of the drip irrigation belt along the emitter. At the same time, the flow rate of the emitter at P = 0.1 MPa after aeration has a higher distribution uniformity compared with P = 0.05 MPa, and the performance is most obvious under the micro-nano aeration method. This is because different water supply pressures result in different water, fertilizer, and air transmission states in the pipeline. When supplying water at low pressure, the phenomenon of bubbles adhering to the inner wall of the pipeline is obvious, and aeration has little effect on the flow distribution. However, as the water supply pressure increases, the two-phase flow velocity in the pipeline increases, and there are almost no bubbles attached. In addition, as the pressure inside the tube increases, the surface tension of the microbubbles decreases, the bubble volume decreases, and the air solubility also increases [24]. When there are a large number of microbubbles in the water, it changes the local effective viscosity and density of air–liquid two-phase flow [25] and plays a drag-reducing role [26], ultimately achieving an improvement in the uniformity of flow distribution in the emitter, which is consistent with Li and others’ research [13,27]. At the same time, it was found in this study that the flow rate of micro-nano-aerated drip irrigation emitters along the drip irrigation belt decreases faster than that of Venturi-aerated drip irrigation. This is because compared with the larger diameter bubbles generated by Venturi aeration, micro-nano bubbles are small bubbles with a diameter between 200 nm and 50 μm and characteristics such as super stability and strong oxidation [28], which can significantly improve the irrigation uniformity of drip irrigation systems [12]. Therefore, compared with the other experimental groups, micro-nano-aerated drip irrigation with P = 0.1 MPa has better system performance.

4.2. Effect of the Co-Application of Water, Fertilizer, and Air on Fertilization in Drip Irrigation Systems

During the co-application of water, fertilizer, and air, the pressure difference between the inlet and outlet of fertilization irrigation in this experiment ranges from 0.05 MPa to 0.25 MPa, which has little effect on the total amount of fertilization. Pressure has little effect on the uniformity of fertilization when not aerated, which is consistent with the research results of Zhou Zhou et al. [29]. The co-application of water, fertilizer, and air has an overall effect on fertilization that is consistent with the amount of irrigation, but in some cases, the total amount of fertilization at the end of the drip irrigation belt slightly increases. This phenomenon is consistent with the experimental results of Han Qibiao [30]. The occurrence of this phenomenon is mainly attributed to the operating characteristics of the pressure difference fertilization tank: during the fertilization process, as the fertilizer in the tank continuously enters the pipeline network and the irrigation water is continuously replenished, the concentration of the fertilizer in the tank continues to decay, resulting in a gradual decrease in the concentration of the fertilizer entering the drip irrigation belt, and the fertilizer gradually flows out of the drip irrigation emitter along the drip irrigation belt. Thus, the phenomenon of the total amount of drip fertilization gradually decreasing along the drip irrigation belt is formed [31]. However, after the fertilizer liquid moves to the end of the drip irrigation belt, under the action of the plug, the flow is suddenly blocked, which forms a reflux that causes the fertilizer liquid to accumulate, leading to an increase in concentration and thus resulting in an increase in the total amount of fertilizer at the end of the drip irrigation belt. Compared with Venturi aeration, which increases the impact of pressure on the total amount of fertilization, micro-nano aeration weakens the impact of pressure on the total amount of fertilization and can significantly improve the spatial distribution uniformity of fertilization. On the one hand, because the bubble size generated by Venturi aeration is relatively large [32], the phenomenon of bubble attachment on the inner wall of the pipeline is obvious under low pressure. During a high-pressure water supply, more air dissolves in the water, and the bubbles also have smaller diameters and larger velocities. Pressure has a significant impact on bubble solubility and two-phase flow velocity. At the same time, large-diameter bubbles are prone to water vapor separation and the “chimney effect” during transportation [33]. Compared with the mm-sized bubbles produced by Venturi aeration, micro-nano aeration produces tiny bubbles with a diameter between 200 nm and 50 μm, which have super stability and a larger specific surface area [34] and can effectively adsorb small fertilizer particles in irrigation water bodies. In addition, micro-nano bubbles can generate strong long-range hydrophobic forces during the bridging process, which can improve the adhesion ability between fertilizer particles and bubbles [35], reduce the probability of their detachment, and promote the transport of water to fertilizers. Therefore, compared with increasing the pressure of Venturi aeration on the total amount of fertilization, micro-nano aeration can significantly weaken the effect of pressure on the total amount of fertilization and improve the uniformity of the co-application of water, fertilizer, and air drip irrigation system’s total amount of fertilization.

4.3. Characteristics of Air Transport in Drip Irrigation Systems under the Co-Application of Water, Fertilizer, and Air

Under the two aeration methods, the co-application of water, fertilizer, and air drip irrigation system has similar spatial distribution characteristics of dissolved oxygen content along the drip irrigation belt, both of which gradually decrease along the direction of the drip irrigation belt. At the end of the drip irrigation belt, the dissolved oxygen content shows a slight upward trend. This phenomenon is similar to the slight increase in the total amount of fertilization at the end of the drip irrigation belt. When water, fertilizer, and air return at the end of the drip irrigation belt, the dissolved oxygen in the irrigation water continuously accumulates at the end of the drip irrigation belt, increasing local dissolved oxygen concentration and increasing the dissolved oxygen content in the irrigation water. Under the same working conditions, the dissolved oxygen content under the micro-nano aeration method is significantly higher than that under Venturi aeration. According to Stokes’ law, the rising speed of bubbles in water is directly proportional to the square of the bubble diameter, while micro-nano bubbles have the characteristics of small bubble size, large specific surface area, high adsorption efficiency, and slow rising speed in water [6,36], which can greatly prolong their suspension time in water and significantly increase the dissolved oxygen content in irrigation water. The size of bubbles generated by Venturi aeration varies, and larger bubbles easily escape from irrigation water [37], resulting in higher dissolved oxygen content in micro-nano-aerated drip irrigation water. When the working pressure is P = 0.1 MPa, the dissolved oxygen content is higher than at P = 0.05 MPa. On the one hand, under high pressure, the flow velocity of the water dispenser channel is fast, and the adhesion of bubbles on the inner wall of the pipeline is not obvious, making it difficult for bubbles to escape [24]. On the other hand, an increase in the pressure inside the tube results in a decrease in the number of large bubbles, an increase in the number of small bubbles, and a gradual decrease in bubble size [38]. It also increases the bubble breakage rate and the average air holdup [39] and thus has a higher dissolved oxygen content.

5. Conclusions

(1) Under the co-application of water, fertilizer, and air, the flow distribution of the sprinkler gradually decreases, while the pressure difference between the inlet and outlet of the fertilizer tank has no significant effect on the flow rate and its distribution uniformity. Compared with the effect of pressure on the flow rate of the emitter under nonaerated-drip irrigation, aeration has a certain impact on the attenuation rate of the flow rate of the emitter along the drip irrigation belt, which can slow down the decrease in the flow rate of the emitter along the way. Under micro-nano aeration, the flow rate of the emitter decreases faster than that under Venturi aeration and can improve the uniformity of the flow distribution of the emitter in the drip irrigation system.
(2) In the co-application of water, fertilizer, and air, the spatial distribution characteristics of the total amount of fertilizer applied by the drip irrigation emitter are similar to the amount of irrigation. Compared with the amount of water filled by the drip irrigation emitter, the total amount of pressure fertilization has a smaller impact, and the pressure difference between the inlet and outlet of the fertilization tank does not have an impact on the flow rate or distribution characteristics of the drip irrigation emitter. Venturi aeration increases the impact of pressure on the total amount of fertilization in the drip irrigation emitter but has a limited impact on the spatial distribution of the total amount of fertilization. Micro-nano aeration can reduce the fluctuation in total fertilization along the drip irrigation belt, giving the water–fertilizer–air drip irrigation system better distribution uniformity.
(3) The two aeration methods show similar distribution characteristics of dissolved oxygen content in the co-application of water, fertilizer, and air. The dissolved oxygen content gradually decreases along the drip irrigation belt, with a lower rate of decline compared with the distribution characteristics of water and fertilizer. The pressure difference between the inlet and outlet of the fertilizer tank does not affect the dissolved oxygen content. The pressure can have a significant impact on the dissolved oxygen content of both aeration methods and micro-nano aeration has higher dissolved oxygen content and better distribution uniformity.
(4) Overall, the pressure difference between the inlet and outlet of the fertilizer tank in the co-application of water, fertilizer, and air drip irrigation system has a relatively small impact on system performance. The working pressure can have an impact on the flow rate of the drip irrigation emitter, the total amount of fertilization, and the dissolved oxygen content of the emitter. Compared with the total amount of fertilization, its impact on the dissolved oxygen content of the emitter flow meter is more significant. Aeration does not affect the flow rate of the drip irrigation emitter, but it can change the distribution characteristics of the total amount of fertilization and dissolved oxygen content. Based on the comprehensive analysis of the results of various combination experiments, the co-application of water, fertilizer, and air under a working pressure of 0.1 MPa has better system performance.

Author Contributions

Conceptualization, H.L. and P.L.; methodology, J.C.; software, Y.L.; validation, P.L., J.C. and Y.L.; formal analysis, G.Z.; data curation, Z.M. and G.Z.; writing—original draft preparation, H.L.; writing—review and editing, P.L.; visualization, H.L. All authors have read and agreed to the published version of the manuscript.

Funding

This research was funded by the National Natural Science Fund of China (52009137), the Scientific and Technological Project of Henan Province (232102110058), the Central Public-interest Scientific Institution Basal Research Fund (Y2022PT13), Agricultural Science and Technology Innovation Program of Chinese Academy of Agricultural Sciences, the Major Science and Technology Project of Henan Province (221100110700), National Key Research and Development Program (2022YFD-1900403), the Post-Disaster Reconstruction Project of Xinxiang (21CJ001).

Data Availability Statement

Data is available within the article.

Conflicts of Interest

The authors declare no conflict of interest.

References

  1. Kang, S.; Huo, Z.; Li, W. Research status and prospect of agricultural efficient water use and eco-environmental effects in arid regions. Sci. Found. China 2016, 30, 208–212. [Google Scholar]
  2. Lei, H.; Xiao, Z.; Zhang, Z.; Yang, H.; Liu, X.; Pan, H. Improving soil aeration and water and nitrogen utilization of tomato in greenhouse by coupled drip irrigation. J. Irrig. Drain. 2019, 39, 8–16. [Google Scholar]
  3. Zan, O.; Tian, J.; Deng, H.; Yan, X. Effects of different aeration methods on dissolved oxygen in brackish water and medium water. J. Drain. Irrig. Mach. Eng. 2019, 37, 806–814. [Google Scholar]
  4. Zhu, Y.; Cai, H.; Song, L.; Chen, H. Aerated Irrigation Promotes Soil Respiration and Microorganism Abundance around Tomato Rhizosphere. Soil Sci. Soc. Am. J. 2019, 83, 1343–1355. [Google Scholar] [CrossRef]
  5. Ben-Noah, I.; Friedman, S. Aeration of clayey soils by injecting air through subsurface drippers: Lysimetric and field experiments. Agric. Water Manag. 2016, 176, 222–233. [Google Scholar] [CrossRef]
  6. Zhou, Y.; Zhou, B.; Xu, F.; Muhammad, T.; Li, Y. Appropriate dissolved oxygen concentration and application stage of micro-nano bubble water oxygation in greenhouse crop plantation. Agric. Water Manag. 2019, 223, 105713. [Google Scholar] [CrossRef]
  7. Wu, Y.; Lyu, T.; Yue, B.; Tonoli, E.; Verderio, E.A.; Ma, Y.; Pan, G. Enhancement of Tomato Plant Growth and Productivity in Organic Farming by Agri-Nanotechnology Using Nanobubble Oxygation. J. Agric. Food Chem. 2019, 67, 10823–10831. [Google Scholar] [CrossRef]
  8. Pendergast, L.; Bhattarai, S.; Midmore, D. Evaluation of aerated subsurface drip irrigation on yield, dry weight partitioning and water use efficiency of a broad-acre chickpea (Cicer arietinum, L.) in a vertosol. Agric. Water Manag. 2019, 217, 38–46. [Google Scholar] [CrossRef]
  9. Wang, D.; Li, A.; Li, L. Research on cucumber subsurface aerated drip irrigation technology in greenhouse in North China. Agric. Mech. Res. 2019, 42, 43–47. [Google Scholar]
  10. Ben-Noah, I.; Nitsan, I.; Cohen, B.; Kaplan, G.; Friedman, S.P. Soil aeration using air injection in a citrus orchard with shallow groundwater. Agric. Water Manag. 2021, 245, 106664. [Google Scholar] [CrossRef]
  11. Zhang, Q.; Zeng, J.; Zhang, Z.; Lei, H.; Zhang, P.; Liu, D. Study on growth characteristics and yield of tomato in greenhouse under subsurface aeration drip irrigation. Trans. Chin. Soc. Agric. Mach. 2022, 53, 365–377. [Google Scholar]
  12. Li, P.; Li, H.; Li, J.; Huang, X.; Liu, Y.; Jiang, Y. Effect of Aeration on Blockage Regularity and Microbial Diversity of Blockage Substance in Drip Irrigation Emitter. Agriculture 2022, 12, 1941. [Google Scholar] [CrossRef]
  13. Li, H.; Li, H.; Han, Q.; Huang, X.; Jiang, Y.; Sun, H.; Li, H. Influence of micro/nanobubbles on clogging in drip irrigation systems. RSC Adv. 2020, 64, 38912–38922. [Google Scholar] [CrossRef]
  14. Li, Y.; Zhou, B.; Yang, P. Research progress on clogging mechanism and control methods of irrigators in drip irrigation system. J. Hydraul. Eng. 2018, 49, 103–114. [Google Scholar]
  15. GB/T 19812.3-2017; Plastic Water-Saving Irrigation Equipment—Part 3: Inlaid Drip Irrigation Pipes and Belts, National Technical Committee for Standardization of Plastic Products (SAC/TC 48). General Administration of Quality Supervision, Inspection and Quarantine of the People’s Republic of China; Standardization Administration of China: Beijing, China, 2017.
  16. EP405.1; Design and Installation of Microirrigation Systems. ASAE Standards; ASAE: St. Joseph, MI, USA, 2003.
  17. Lamm, F.; Storlie, C.; Pitts, D. Revision of EP-458: Field evaluation of microirrigation systems. Pap. Am. Soc. Agric. Eng. Pap. 1997, 972070, 20. [Google Scholar]
  18. Dai, J.; Fan, X.; Liang, Y.; Sun, L. Study on calibration of standard curve for determination of concentration of fertilizer solution by conductivity method. Phosphate Compd. Fertil. 2005, 15–17. [Google Scholar]
  19. Li, J.; Du, Z.; Li, Y. Field trial evaluation of fertilization and irrigation uniformity in subsurface drip irrigation system. Trans. Chin. Soc. Agric. Eng. 2008, 83–87. [Google Scholar]
  20. Fan, J.; Zhang, F.; Wu, L.; Yan, S.; Xiang, Y. Comprehensive evaluation of irrigation and fertilizer uniformity in drip irrigation and differential pressure fertilization system. Trans. Chin. Soc. Agric. Eng. 2016, 32, 96–101. [Google Scholar]
  21. Zhai, Y.J.; Wu, W.Y.; Wang, Z.H.; Hu, Y.Q.; Hu, X.U. Research on Hydraulic characteristics and anti-clogging performance of pressure on flow channel unit of irrigator based on Ansys Fluent. Water Sav. Irrig. 2022, 47–53+59. [Google Scholar]
  22. Li, Y.; Yang, P.; Xu, T.; Ren, S.; Lin, X.; Wei, R.; Xu, H. CFD and digital particle tracking to assess flow characteristics in the labyrinth flow path of a drip irrigation emitter. Irrig. Sci. 2008, 26, 427–438. [Google Scholar] [CrossRef]
  23. Hu, X.; Yan, H.; Chen, X. Uniform fertilization method based on differential pressure fertilization tank. Trans. Chin. Soc. Agric. Eng. 2019, 36, 119–127. [Google Scholar]
  24. Tian, Z.; Cheng, Y.; Wang, L.; Li, X. Effect of temperature and pressure on bubble formation at orifice in viscous fluid. J. Chem. Eng. Univ. 2020, 34, 34–43. [Google Scholar]
  25. Wu, H.; Wu, W.; Chen, K. Research progress of bubble drag reduction in ships. Shipbuild. China 2019, 60, 212–227. [Google Scholar]
  26. Zhao, X.; Zong, Z.; Jiang, Y. Numerical Analysis of drag reduction of flat Microbubbles based on OpenFOAM. J. Ship Mech. 2020, 24, 989–996. [Google Scholar]
  27. Reinders, F.B.; Niekerk, A.S.V. Technology Smart Approach to Keep Drip Irrigation Systems Functional. Irrig. Drain. 2018, 67, 82–88. [Google Scholar] [CrossRef]
  28. Rognes, T.; Flouri, T.; Nichols, B.; Quince, C.; Mahé, F. VSEARCH: A versatile open source tool for metagenomics. PeerJ 2016, 4, e2584. [Google Scholar] [CrossRef] [PubMed]
  29. Zhou, Z.; Fu, Z.; Wang, X.; Qi, L. Irrigation and fertilization uniformity test of drip irrigation fertilizer applicator. Trans. Chin. Soc. Agric. Eng. 2009, 25, 7–13. [Google Scholar]
  30. Han, Q. Study on the Change of Fertilizer Concentration and Its Effect on Water and Fertilizer Distribution in Drip Irrigation with Differential Pressure Fertilization. Ph.D. Thesis, Yangzhou University, Yangzhou, China, 2019. [Google Scholar]
  31. Li, H.; Tang, P.; Chen, C.; Zhang, Z.; Xia, H. Research status and development trend of integrated water-fertilizer fertilization equipment in China. J. Drain. Irrig. Mach. Eng. 2021, 39, 200–209. [Google Scholar]
  32. Caporaso, J.G.; Kuczynski, J.; Stombaugh, J.; Bittinger, K.; Bushman, F.D.; Costello, E.K.; Fierer, N.; Peña, A.G.; Goodrich, J.K.; Gordon, J.I.; et al. QIIME allows analysis of high-throughput community sequencing data. Nat. Methods 2010, 7, 335–336. [Google Scholar] [CrossRef]
  33. Liu, Y.; Zhou, Y.; Wang, T.; Pan, J.; Zhou, B.; Muhammad, T.; Zhou, C.; Li, Y. Micro-nano bubble water oxygation: Synergistically improving irrigation water use efficiency, crop yield and quality. J. Clean. Prod. 2019, 222, 835–843. [Google Scholar] [CrossRef]
  34. Atkinson, A.J.; Apul, O.G.; Schneider, O.; Garcia-Segura, S.; Westerhoff, P. Nanobubble Technologies Offer Opportunities To Improve Water Treatment. Acc. Chem. Res. 2019, 52, 1196–1205. [Google Scholar] [CrossRef] [PubMed]
  35. Wang, T.; Sun, T.; Wang, C.; Xu, C.; Wei, Y. Large Eddy Simulation of Microbubble Drag Reduction in Fully Developed Turbulent Boundary Layers. J. Mar. Sci. Eng. 2020, 8, 524. [Google Scholar] [CrossRef]
  36. Sun, Y.; Wang, S.; Niu, J. Microbial community evolution of black and stinking rivers during in situ remediation through micro-nano bubble and submerged resin floating bed technology. Bioresour. Technol. 2018, 258, 187–194. [Google Scholar] [CrossRef] [PubMed]
  37. Zhou, B.; Li, Y.; Pei, Y.; Liu, Y.; Zhang, Z.; Jiang, Y. Quantitative relationship between biofilms components and emitter clogging under reclaimed water drip irrigation. Irrig. Sci. 2013, 31, 1251–1263. [Google Scholar] [CrossRef]
  38. Mach, J.; Wiens, J.; Adjaye, J.; Donaldson, A.A.; Macchi, A. Effect of pressure on the drag coefficient of individual bubbles in a contaminated polydisperse swarm. Chem. Eng. Sci. 2020, 223, 115728. [Google Scholar] [CrossRef]
  39. Zhang, H.; Wang, T. Research on the generality of CFD-PBM coupling model to simulate gas-liquid bubble bed. Acta Chemologica Sin. 2019, 70, 487–495. [Google Scholar]
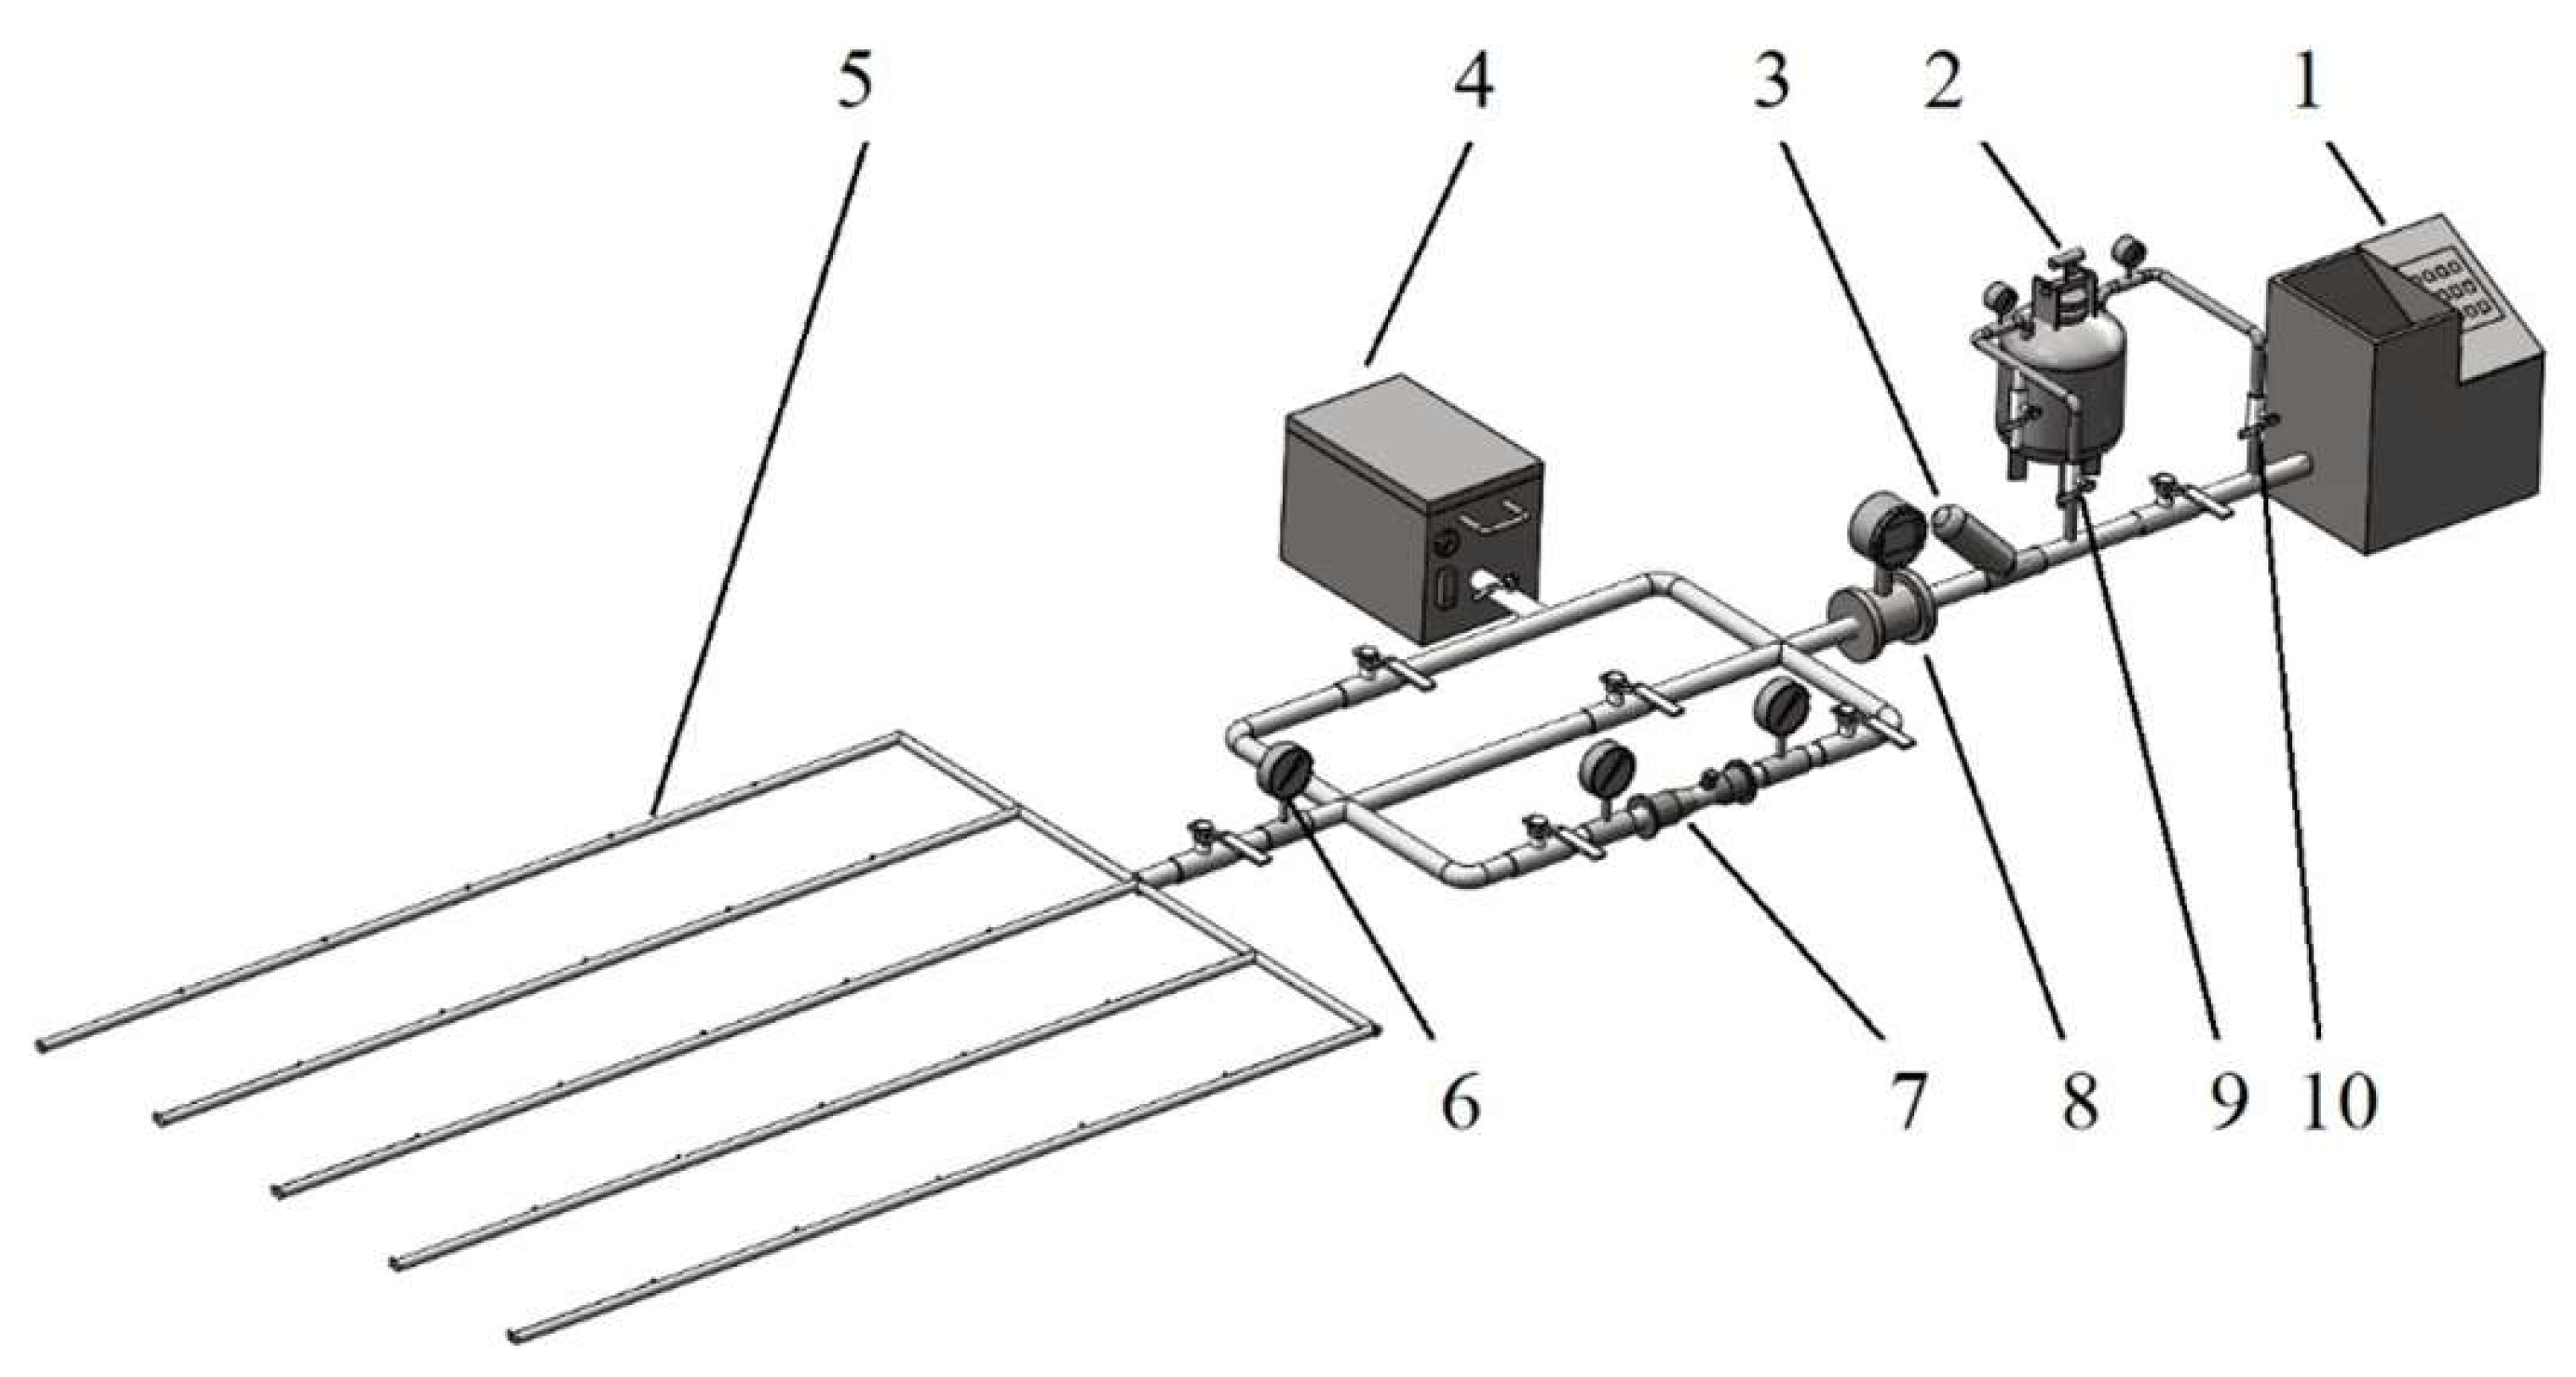
Figure 1. Schematic diagram of the drip irrigation uniformity test device. 1. Intelligent variable frequency constant temperature and pressure water tank, 2. differential pressure fertilization tank, 3. filter, 4. micro-nano bubble generator, 5. drip irrigation belt, 6. precision pressure gauge, 7. venturi injector, 8. turbine flowmeter, 9. valve 2, and 10. valve 1.
Horticulturae 10 00006 g001
Figure 2. Flow distribution curves of the drip irrigation emitters along the drip irrigation belt under different experimental treatments.
Horticulturae 10 00006 g002aHorticulturae 10 00006 g002bHorticulturae 10 00006 g002c
Figure 3. Fitting curve of the flow distribution of the drip irrigation emitters along the drip irrigation belt under different experimental treatments.
Horticulturae 10 00006 g003aHorticulturae 10 00006 g003bHorticulturae 10 00006 g003c
Figure 4. Distribution curves of the total fertilization amount of the drip irrigation emitters along the drip irrigation belt under different experimental treatments.
Horticulturae 10 00006 g004aHorticulturae 10 00006 g004bHorticulturae 10 00006 g004c
Figure 5. Fitting curves of the total fertilization distribution of the drip irrigation emitters along the drip irrigation belt under different experimental treatments.
Horticulturae 10 00006 g005aHorticulturae 10 00006 g005bHorticulturae 10 00006 g005c
Figure 6. Distribution curves of the dissolved oxygen content of the drip irrigation emitters along the drip irrigation belt under different aeration methods.
Horticulturae 10 00006 g006aHorticulturae 10 00006 g006b
Table 1. Characteristic parameters of the experimental drip irrigation belts.
EmittersRated Flow Rate (L/h)Spacing (m)Connection MethodCompensation FunctionDischarge Coefficient kFlow Index mCoefficient of Variation Cv (%)
Horticulturae 10 00006 i0011.420.3Inlaid with patchNon pressure compensation0.2590.452.28
Table 2. Test plan.
Table 2. Test plan.
Aeration MethodPipe Network Pressure (MPa)Pressure Difference of Fertilizer Tank (MPa)
Nonaeration
Micro-nano aeration
Venturi aeration
0.050.05
0.1
0.15
0.2
0.25
0.1
Table 4. Fertilization time of the fertilization tank under different working parameters.
ProcessInlet Pressure P1
(MPa)
Outlet Pressure P2
(MPa)
Pressure Difference ΔP
(MPa)
Fertilization Time (min)
10.150.10.056.5
20.20.10.15.5
30.250.10.155
40.30.10.25
50.350.10.255
60.10.050.058.5
70.150.050.18.5
80.20.050.158
90.250.050.27.5
100.30.050.257.5
Table 5. Multiple comparisons of the aeration methods on the total fertilization amount.
Aeration MethodDifference in Average ValueStandard ErrorSignificance95% Confidence Interval
Lower LimitUpper Limit
Non-aerationMicro-nano aeration0.0425737 *0.004113700.0000.03449460.0506528
Venturi aeration0.00141260.004113700.731−0.00666640.0094917
Micro-nano aerationNon-aeration−0.0425737 *0.004113700.000−0.0506528−0.0344946
Venturi aeration−0.0411611 *0.004113700.000−0.0492402−0.0330820
Venturi aerationNon-aeration−0.00141260.004113700.731−0.00949170.0066664
Micro-nano aeration0.0411611 *0.004113700.0000.03308200.0492402
* The significance level of the difference in the average values is 0.05.
Table 6. One-way ANOVA of the co-application of water, fertilizer, and air drip irrigation system performance.
System PerformanceOperation ParametersSum of Squares for Class IIIDegree of FreedomMean SquareF Valuep-Value
Flow rate of the irrigation systemOperating pressure22.822122.8229543.2280.000
Aeration methods0.00820.0040.0950.910
Pressure difference between the inlet and outlet of the fertilizer tank0.00840.0020.0480.996
Total amount of fertilizationOperating pressure0.01810.0188.7310.003
Aeration methods0.23420.11769.1140.000
Pressure difference between the inlet and outlet of the fertilizer tank0.00440.0010.5320.712
Dissolved oxygen contentOperating pressure1303.52411303.5242015.6390.000
Aeration methods32.678132.6788.5100.004
Pressure difference between the inlet and outlet of the fertilizer tank7.32441.8310.4660.761
Table 7. Evaluation indicators for uniformity of the drip irrigation system under different conditions.
System PerformanceAeration MethodsPipeline Network
Pressure (MPa)
Cu
(%)
DUCvUS
(%)
Flow rate of the irrigation systemNon-aeration0.05960.940.0595
0.1960.940.0595
Micro-nano0.05950.930.0694
0.1970.950.0496
Venturi0.05950.920.0694
0.1960.950.0595
Total amount of fertilizationNon-aeration0.05950.930.0694
0.1960.940.0694
Micro-nano0.05950.920.0793
0.1960.950.0595
Venturi0.05950.920.0793
0.1960.940.0694
Dissolved oxygen contentMicro-nano0.05950.930.0694
0.1970.960.0496
Venturi0.05960.930.0595
0.1970.950.0496
Table 8. Uniformity evaluation.
U s 100–9590–8580–7570–65<60
RatingExcellentGoodMiddlePoorSubstandard
Table 9. Evaluation results of water, fertilizer, and air uniformity in aerated drip irrigation systems under different conditions.
Aeration MethodsPipeline Network PressureFlow Rate of the Irrigation SystemTotal Amount of FertilizationDissolved Oxygen Content
Non-aeration0.05ExcellentGood–excellent——
0.1ExcellentGood–excellent——
Micro-nano aeration0.05Good–excellentGood–excellentGood–excellent
0.1ExcellentExcellentExcellent
Venturi aeration0.05Good–excellentGood–excellentExcellent
0.1ExcellentGood–excellentExcellent
Disclaimer/Publisher’s Note: The statements, opinions and data contained in all publications are solely those of the individual author(s) and contributor(s) and not of MDPI and/or the editor(s). MDPI and/or the editor(s) disclaim responsibility for any injury to people or property resulting from any ideas, methods, instructions or products referred to in the content.