Article

Integrated Transcriptome and Metabolome Analysis Revealed Mechanism Underlying Anthocyanin Biosynthesis During Flower Color Formation in Lagerstroemia indica

1
Zhejiang Academy of Forestry, Hangzhou 310023, China
2
Research Institute of Subtropical Forestry, Chinese Academy of Forestry, Hangzhou 311400, China
*
Authors to whom correspondence should be addressed.
Horticulturae 2024, 10(11), 1229; https://doi.org/10.3390/horticulturae10111229
Submission received: 18 October 2024 / Revised: 14 November 2024 / Accepted: 18 November 2024 / Published: 20 November 2024

Abstract

:
Lagerstroemia indica is a widely used ornamental woody plant known for its summer flowering and significant ornamental and economic value. While L. indica boasts a variety of rich flower colors, the molecular mechanisms underlying this color formation remain unclear. In this study, we selected three different flower colors of L. indica—white (W), red (R), and purple (P)—for transcriptome and metabolome analysis. The metabolome analysis identified 538 flavonoids, with 22 anthocyanins highly accumulated in the red and purple flowers. RNA-seq analysis annotated a total of 35,505 genes. Furthermore, we identified 42 differentially expressed genes (DEGs) involved in anthocyanin biosynthesis, with their expression levels aligning with anthocyanin content. Correlation analysis revealed that 19 MYB and 11 bHLH transcription factors are likely involved in anthocyanin biosynthesis. Additionally, we identified 59 auxin biosynthesis and signaling-related genes that are positively correlated with anthocyanin-related genes and metabolites, suggesting that auxin may play a role in regulating anthocyanin biosynthesis in L. indica. This study provides valuable insights into the regulatory mechanisms underlying anthocyanin accumulation and color formation in L. indica petals and identifies several potential genes, laying the groundwork for further research on regulatory mechanisms and genetic improvement of L. indica.

1. Introduction

Flower color is one of the most intuitive features of ornamental plants. It not only attracts insects for pollination and serves as a protective color for flower organs in nature [1] but also enhances the plant’s stress resistance by adjusting the color of its flowers [2]. Additionally, flower color often plays a crucial role in the ornamental value and quality of plants. In everyday life, flower pigments such as flavonoids and carotenoids—known for their functions in preventing heart disease, lowering blood pressure, and antiaging [3]—are recognized as “nutritional” compounds due to their medicinal and nutritional value. These pigments have significant applications in skincare, healthcare, and food [4].
Flower color is determined by the pigment components in the petal cells and is influenced by multiple factors, including temperature and pH [5]. Flower pigments include flavonoids, carotenoids, and betalaine [6]. Flavonoids, the largest and most widely present pigment group in plants, are crucial for the formation of flower colors in most plant species [7]. Structurally, flavonoids can be classified into 12 subgroups, such as anthocyanins, flavones, chalcones, flavonols, isoflavones, and proanthocyanidins [8]. Different types of flavonoids give plants different colors, and anthocyanins endow plants with red, pink, purple, and orange colors [8]. Flavonoids are synthesized via the phenylpropanoid metabolic pathway, with anthocyanins representing a key branch of this pathway [9]. The synthesis of anthocyanins begins with the conversion of phenylalanine to coumaroyl-CoA by the enzymes phenylalanine ammonia-lyase (PAL), cinnamate 4-hydroxylase (C4H), and 4-coumarate-CoA ligase (4CL). Coumaroyl-CoA then combines with malonyl-CoA, catalyzed by chalcone synthase (CHS), to form chalcone. Chalcone acts as an important intermediate in the flavonoid pathway, converting to dihydroflavonols through the action of chalcone isomerase (CHI) and flavanone-3-hydroxylase (F3H). Dihydroflavonols are then converted into anthocyanins or flavonols by dihydroflavonol reductase (DFR) and flavonol synthase (FLS). In the anthocyanin synthesis pathway, dihydroflavonols are further converted into anthocyanins such as delphinidin, pelargonidin, and cyanidin through the actions of DFR and anthocyanin synthase (ANS) [10].
These anthocyanins follow a complete synthesis pathway in higher plants, with many transcription factors involved in pigment synthesis and the regulation of structural genes at the transcriptional level, especially in the structure, function, and regulation of MBW complexes. In blueberries, 11 MYB, 7 bHLH, and 6 WD40 genes have been identified. Studies verified that the expression patterns of MYB-bHLH-WD40 genes are positively correlated with anthocyanin accumulation and color development in blueberries [11]. In Fagopyrum tataricum, the gene FtMYB3, which belongs to the fourth subfamily of R2R3-MYB, can downregulate the expressions of DFR and ANS in transgenic Arabidopsis thaliana, acting as a negative regulatory transcription factor for anthocyanins [12]. The overexpression of AcMYB10 in Red-fleshed kiwifruit increased anthocyanin accumulation in the fruit peel. The virus-induced silencing of AcMYB10 and its transient expression in tobacco leaves confirmed the positive regulatory effect of AcMYB10 on anthocyanins in red-fleshed kiwifruit [13]. In Antirrhinum majus, bHLH-1 and bHLH-2 proteins help establish the pigment distribution pattern in jujube flowers through two mechanisms: by regulating the expression of anthocyanin biosynthesis genes through functional redundancy and by influencing the encoding of transcription factor genes through protein differences [14].
Plant hormones, as small organic signaling molecules, play crucial roles in the synthesis and metabolism of anthocyanins. For example, in red raspberry (Rubus idaeus L.), auxin reverse-regulates the metabolism of anthocyanins [15]. Anthocyanin synthesis is promoted in nonlimetic sweet cherry (Prunus avium L.) by the exogenous addition of auxin [16]. Ethylene regulates fruit ripening and enhances anthocyanin biosynthesis by promoting the expression of MdMYB1, resulting in more vibrant fruit color [10]. Gibberellin negatively regulates flavonoid biosynthesis by reducing the expression of GA4, which promotes the accumulation of anthocyanins in Arabidopsis thaliana. These findings highlight the significant role of plant hormones in the anthocyanin synthesis metabolic pathway [10].
Lagerstroemia indica, a deciduous small tree or shrub from the genus Lagerstroemia in the family Lythraceae, blooms predominantly in summer and is commonly planted in tropical and warm temperate regions [17]. As a prominent ornamental plant in traditional China, L. indica is a key species for distribution and cultivation in the country. Its extended summer flowering period makes it a valuable ornamental plant [18]. In addition, L. indica has pharmacological effects such as anti-inflammatory, analgesic, antipyretic, antioxidant, anticancer, antibacterial, anti-Alzheimer’s disease, antidiabetes, liver protection, and antithrombin effects. It can be used as a medicinal plant to generate considerable economic benefits and has notable development prospects [19]. Beyond its aesthetic appeal, L. indica also contributes to environmental health by resisting pollution and absorbing harmful gases and dust, making it an important choice for landscaping.
In the 1960s, Dr. Zhang began investigating and hybridizing the Lagerstroemia genus in China, successfully cultivating more than 200 varieties with diverse plant structures and flower colors [20]. Despite this progress, there remains a lack of blue, yellow, green, and orange flowers in Lagerstroemia. While anthocyanins play a crucial role in determining the color of Lagerstroemia petals, the molecular regulatory mechanisms in L. indica are still not fully understood. This study focused on the petals from three different flower colors—white, red, and purple—derived from the semihybrid descendants of the “Jianmin Hong” variety. Through transcriptome and metabolome analysis, this research aimed to provide important data on the molecular mechanisms underlying Lagerstroemia flower color and anthocyanin biosynthesis.

2. Materials and Methods

2.1. Plant Materials

The plant material was grown at the Lagerstroemia Germplasm Resources of the Zhejiang Academy of Forestry in Hangzhou, Zhejiang Province. The selected Lagerstroemia indica variety was a semisibling descendant of “Jianmin Hong”, bred by Boxin Hou et al. from Hunan Crape Myrtle Institute. Three color varieties of crape myrtle—white (W), red (R), and purple (P)—were chosen for this study. All plants were approximately 10 years old and had received regular irrigation and fertilization. Sampling was carried out in the summer of 2023, with petals randomly collected from healthy plants. Each flower color was sampled three times (each sample was no less than 5 g), and the petals were stored in liquid nitrogen at −80 °C until subsequent transcriptome and flavonoid metabolomics studies.

2.2. Detection of Total Flavonoids in Lagerstroemia indica Petals for Metabolomic Analysis

The petal samples, frozen in liquid nitrogen, were placed in a freeze-dryer (Scientz-100F, Ningbo, China) for vacuum freeze-drying. The samples were ground into powder using a grinder (MM 400, Retsch, Arzberg, Germany) at a frequency of 30 Hz for 1.5 min. Then, 50 mg of the sample powder was weighed using an electronic balance (MS105D Μ, Mettler Toledo, Zurich, Switzerland). Further, 1200 μL of the internal standard extraction (70% methanol-water, v/v) solution was added, after which it was precooled to −20 °C and vortex every 30 min for 30 s, repeating six times. Finally, the vortexed sample was placed into a centrifuge (Eppendorf, Hamburg, Germany) at 12,000 rpm (11,304× g) and centrifuged for 3 min. Then, the supernatant was extracted and filtered using a microporous membrane (0.22 μm pore size) and transferred to a liquid-nitrogen storage bottle for ultra-high-performance liquid chromatography tandem mass spectrometry analysis.
Data collection was performed using ultra-performance liquid chromatography (UPLC, sciex, Singapore) with an ExionLC™ AD system (https://sciex.com.cn/, accessed on 20 March 2024) and tandem mass spectrometry (MS/MS, sciex, Singapore). The UPLC conditions were applied according to the method by Wang et al. [21] and mass spectrometry followed the method of Chen et al. [22]. For liquid chromatography (SB-C18, Agilent, Santa Clara, CA, USA), an Agilent SB-C18 1.8 μm column (2.1 mm × 100 mm) was used. Mobile phase A was ultrapure water with 0.1% formic acid (v/v), and mobile phase B was acetonitrile with 0.1% formic acid. The elution gradient was set as follows: 5% phase B at 0 min, increasing linearly to 95% phase B over 9 min, and maintaining at 95% for 1 min. From 10 to 11 min, phase B was reduced to 5% and held for 14 min. The flow rate was set to 0.35 mL/min, the column temperature to 40 °C, and the injection volume to 2 μL. For tandem mass spectrometry analysis, the spray ion source (ESI) temperature was set to 55 °C and the ion spray voltage to 5500 V (positive ion mode) or −4500 V (negative ion mode). Ion source gases were set to I (GSI) and II (GSII) and curtain gas (CUR) to 50, 60, and 25 psi, with collision-induced ionization parameters set to high. The QQQ scan was used in MRM mode, and the collision gas (nitrogen) was set to medium. Specific MRM ion pairs were monitored based on the metabolites eluted during each period.

2.3. Transcriptome Analysis Method for Lagerstroemia indica

The petal samples, frozen in liquid nitrogen, were placed in a precooled grinding bowl for thorough grinding. Total RNA was extracted from each sample using a Difficult to Extract Plant RNA Small Extraction Kit (Magen, Guangzhou, China). mRNA was then enriched with polyA tails using Oligo(dT) magnetic beads for NEB library construction. After constructing the library, a Qubit 3.0 fluorometer (Invitrogen, Waltham, MA, USA) was used for preliminary quantification, and the library was diluted to 1.5 ng/µL. Then, an Agilent 2100 Bioanalyzer (Agilent Technologies, Santa Clara, CA, USA) was used to detect the insert size of the library. Once the insert size was verified, qRT-PCR was performed to accurately quantify the effective concentration of the library (which should be higher than 1.5 nM) to ensure quality. After passing quality control, different libraries were pooled according to effective concentration and target data volume requirements for Illumina sequencing (Illumina, San Diego, CA, USA).
Adapter and low-quality reads were eliminated to obtain clean raw data. Q20, Q30, and GC values were calculated to evaluate data quality. Raw data were filtered to remove reads with adapters, reads containing ‘N’, and low-quality reads (with Qphred ≤ 5 accounting for more than 50% of the read length) to obtain clean reads for subsequent analysis. New transcripts were assembled using StringTie v2.2.3 software [23] and were annotated using databases such as Pfam (Protein family, http://pfam-legacy.xfam.org/, accessed on 25 July 2024), SUPERFAMILY (https://supfam.org/, accessed on 25 July 2024), GO (Gene Ontology, https://geneontology.org/, accessed on 25 July 2024), and KEGG (Kyoto Encyclopedia of Genes and Genomes, https://www.genome.jp/kegg/, accessed on 25 July 2024).

2.4. Quantitative Real-Time PCR (qRT-PCR)

To verify the reliability and accuracy of the transcriptome data, DEGs related to the flavonoid pathway were randomly selected for qRT-PCR analysis. RNA samples were reverse-transcribed using PrimeScript RT Master Mix (Takara, Dalian, China). Gene-specific primers were designed using Primer Express v3.0.1 software (Table S1), and qRT-PCR was performed using an ABI 7500 Fast Real-Time PCR System (ABI, Oyster Bay, New York, NY, USA) and TB Green® Premix Ex Taq II (Takara, Dalian, China). Relative gene expression was quantified using the 2−∆∆CT method.

2.5. Transcription Factors Analysis

Given the crucial role of transcription factors (TFs) in anthocyanin synthesis, we analyzed TF expression across all samples. We identified putative TFs from the transcription annotation file using the keyword ‘transcription factors’, calculated their number and categories, and sorted them using the Chiplot webpage (https://www.chiplot.online/, accessed on 10 September 2024).

2.6. Statistical Analysis

Statistical analyses were performed with GraphPad Prism 9 (GraphPad, San Diego, CA, USA). The results are expressed as the mean ± SE of three independent experiments. Statistical significance was determined using Student’s t-test (* p < 0.05 and ** p < 0.01), PCA was performed using R 4.4.0 (http://www.r-project.org/, accessed on 12 September 2024) according to a method described previously [24].

3. Results

3.1. Principal Component Analysis of Metabolites

Metabolomics analysis was conducted on three crape myrtle color variants: red, purple, and white (Figure 1A). After detection by UPLC-MS/MS, principal component analysis (PCA) was applied to the dataset. We screened PC1 and PC2 from the scree plot using principal component analysis for subsequent model plotting (Figure S1). The results revealed a significant separation of flavonoid metabolites among the three color variants of crape myrtle (Figure 1B). A total of 538 flavonoid metabolites were detected across the samples (Figure 1C and Table S2), including flavonols (28.07%), flavones (23.61%), tannins (15.06%), dihydroflavones (7.43%), other flavonoids (6.51%), anthocyanins (5.95%), isoflavones (3.35%), chalcones (3.16%), flavanols (2.97%), dihydroflavonols (2.60%), flavonoids (0.74%), and orange ketones (0.56%; Figure 1D). Among these, 358 differentially accumulated flavonoids (DAFs) were identified in all samples (Table S3).

3.2. Analysis of Differential Metabolites

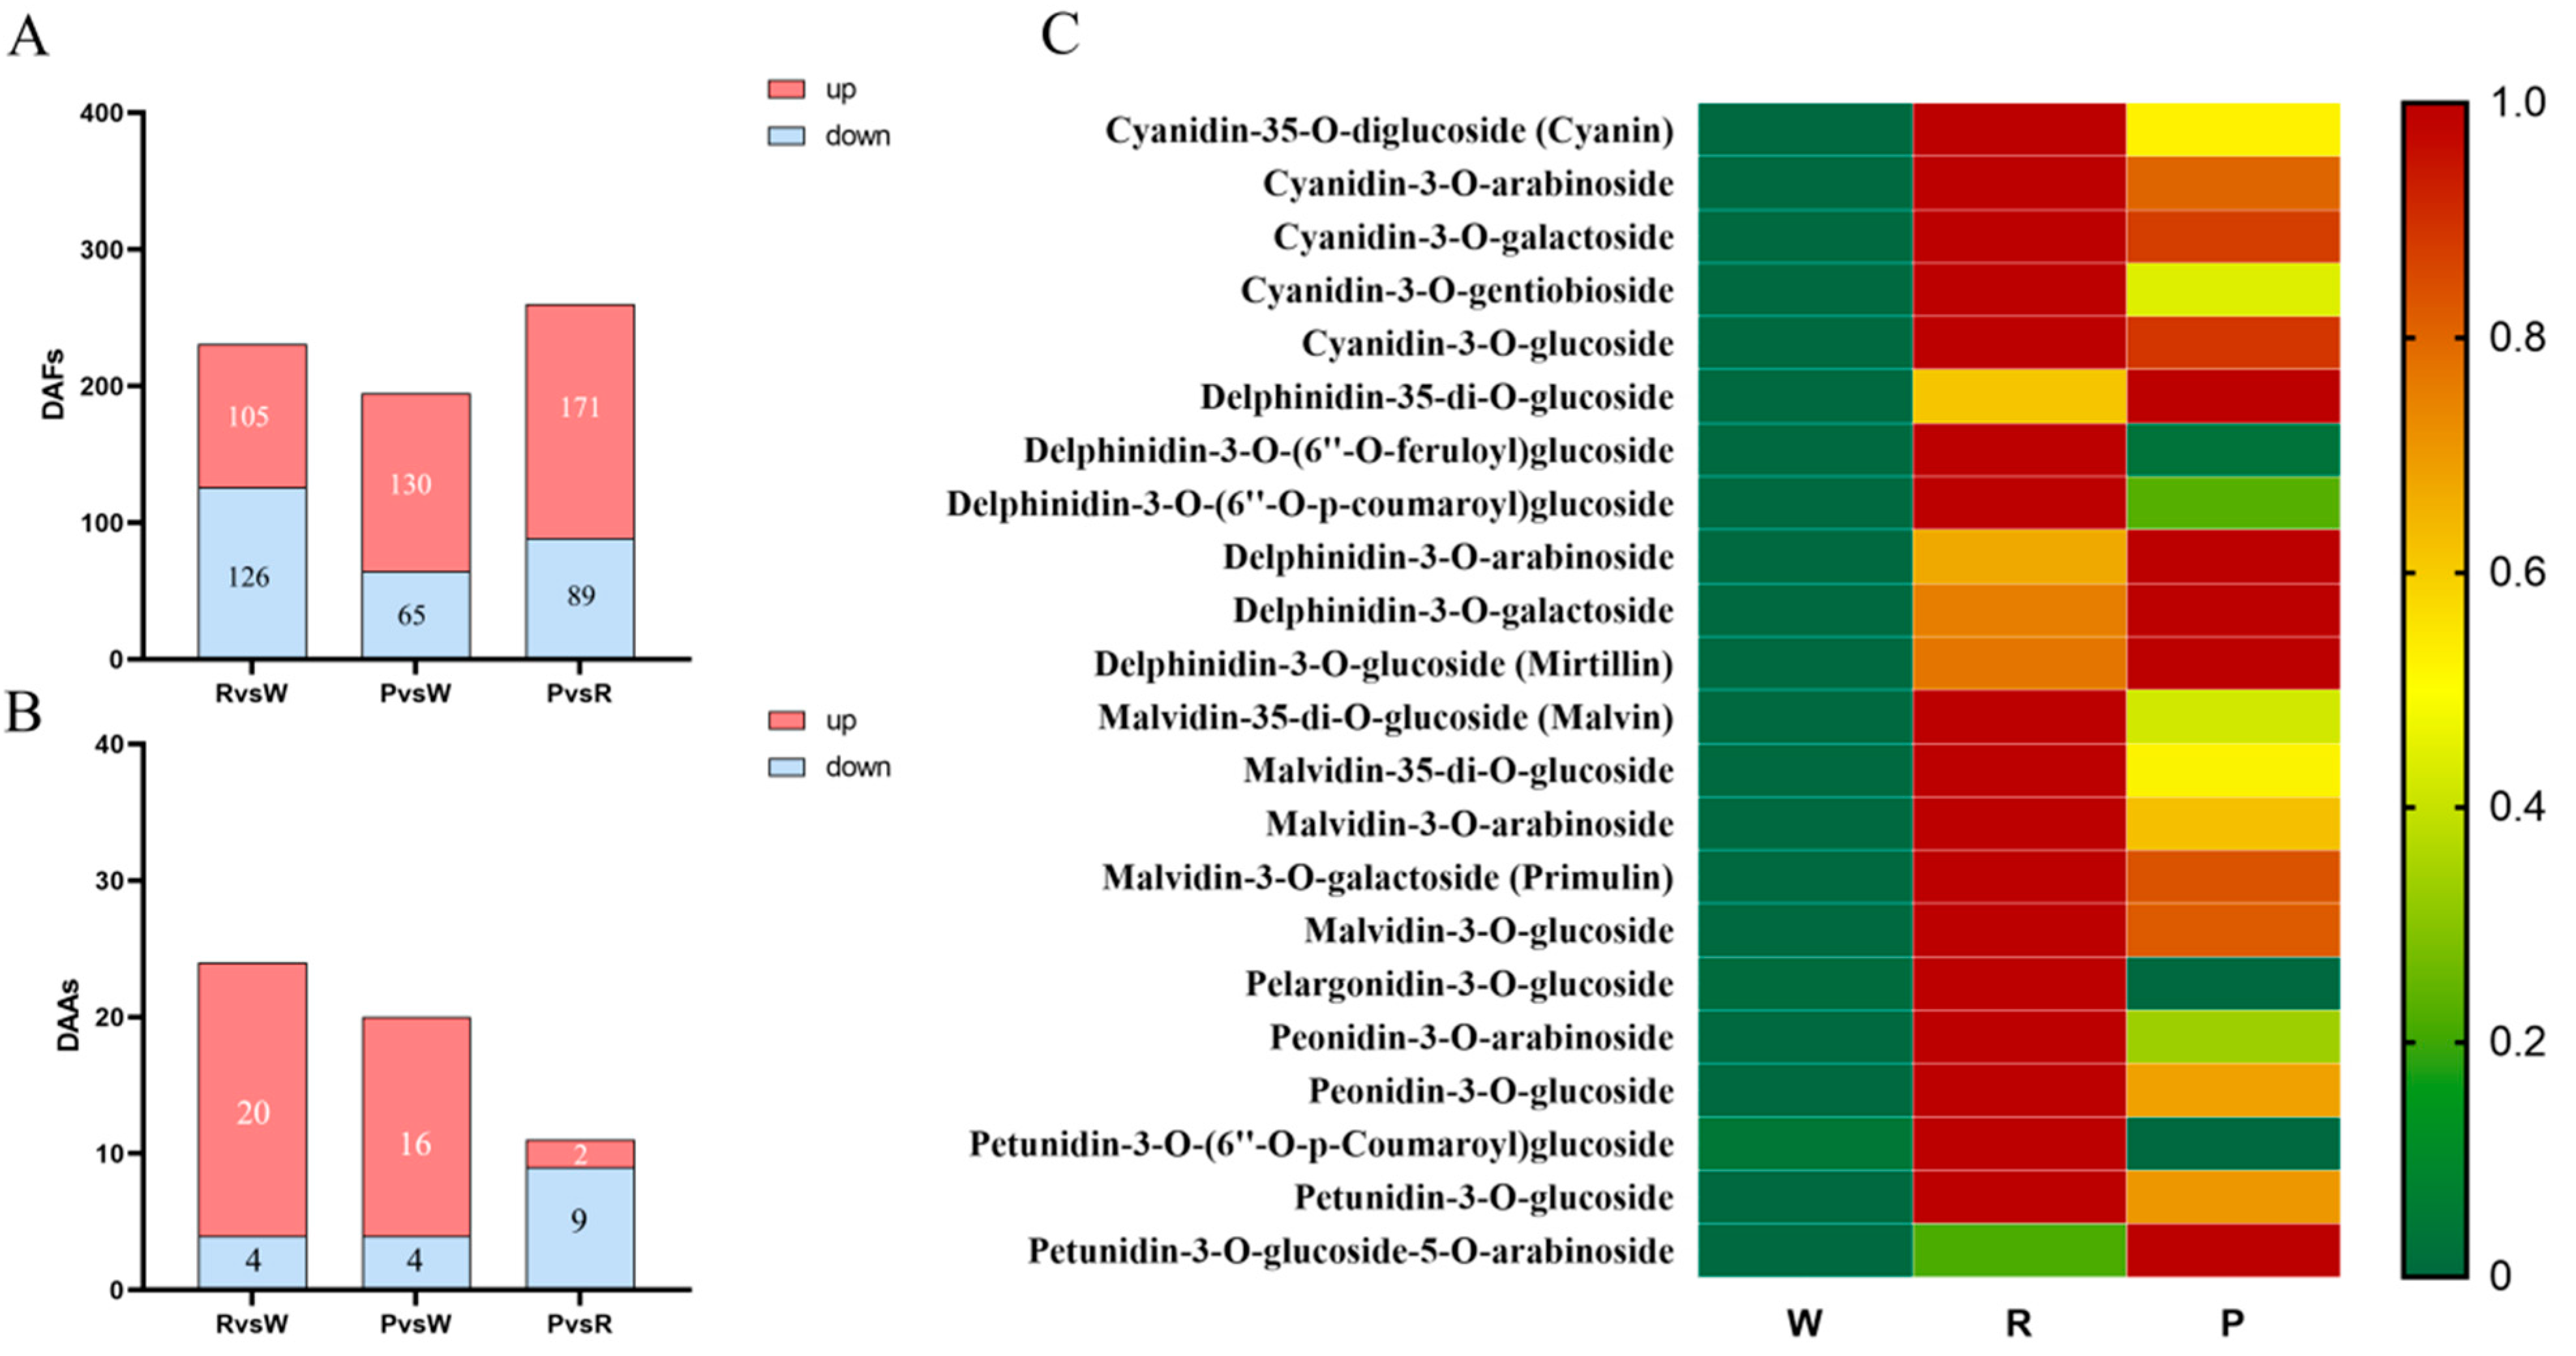
In the comparisons of red versus white (R vs. W), purple versus white (P vs. W), and purple versus red (P vs. R) groups, 231, 195, and 260 differential flavonoids were identified, respectively, with 105, 130, and 171 being upregulated, and 126, 65, and 89 being downregulated (Figure 2A). Anthocyanins, the main pigments responsible for the red color in plants, showed 24, 20, and 11 differentially accumulated anthocyanins (DAAs) in the R vs. W, P vs. W, and P vs. R groups, respectively, with 20, 16, and 2 upregulated, and 4, 4, and 9 downregulated (Figure 2B). Among these, 22 anthocyanins were upregulated relative to white, red, and purple (Figure 2C).

3.3. Transcriptome Sequencing and Analysis

Further analysis of the gene expression in the three crape myrtle petal types yielded 56.04 Gb of clean data after filtering out low-quality reads (NCBI number: SUB14762385), with each sample exceeding 6.5 Gb. The Q20 and Q30 values for each library were at least 97.78% and 93.66%, respectively, and the GC content was at least 50.54% (Table S4). By assembling new transcripts with StringTie and annotating them using databases such as Pfam, GO, and KEGG, a total of 35,505 genes were annotated (Table S5). Among these, Pfam, GO, KEGG, and swissport annotated 25,998, 17,204, 6759 and 25,194 genes, respectively (Table S6).

3.4. Identification and Enrichment of DEGs

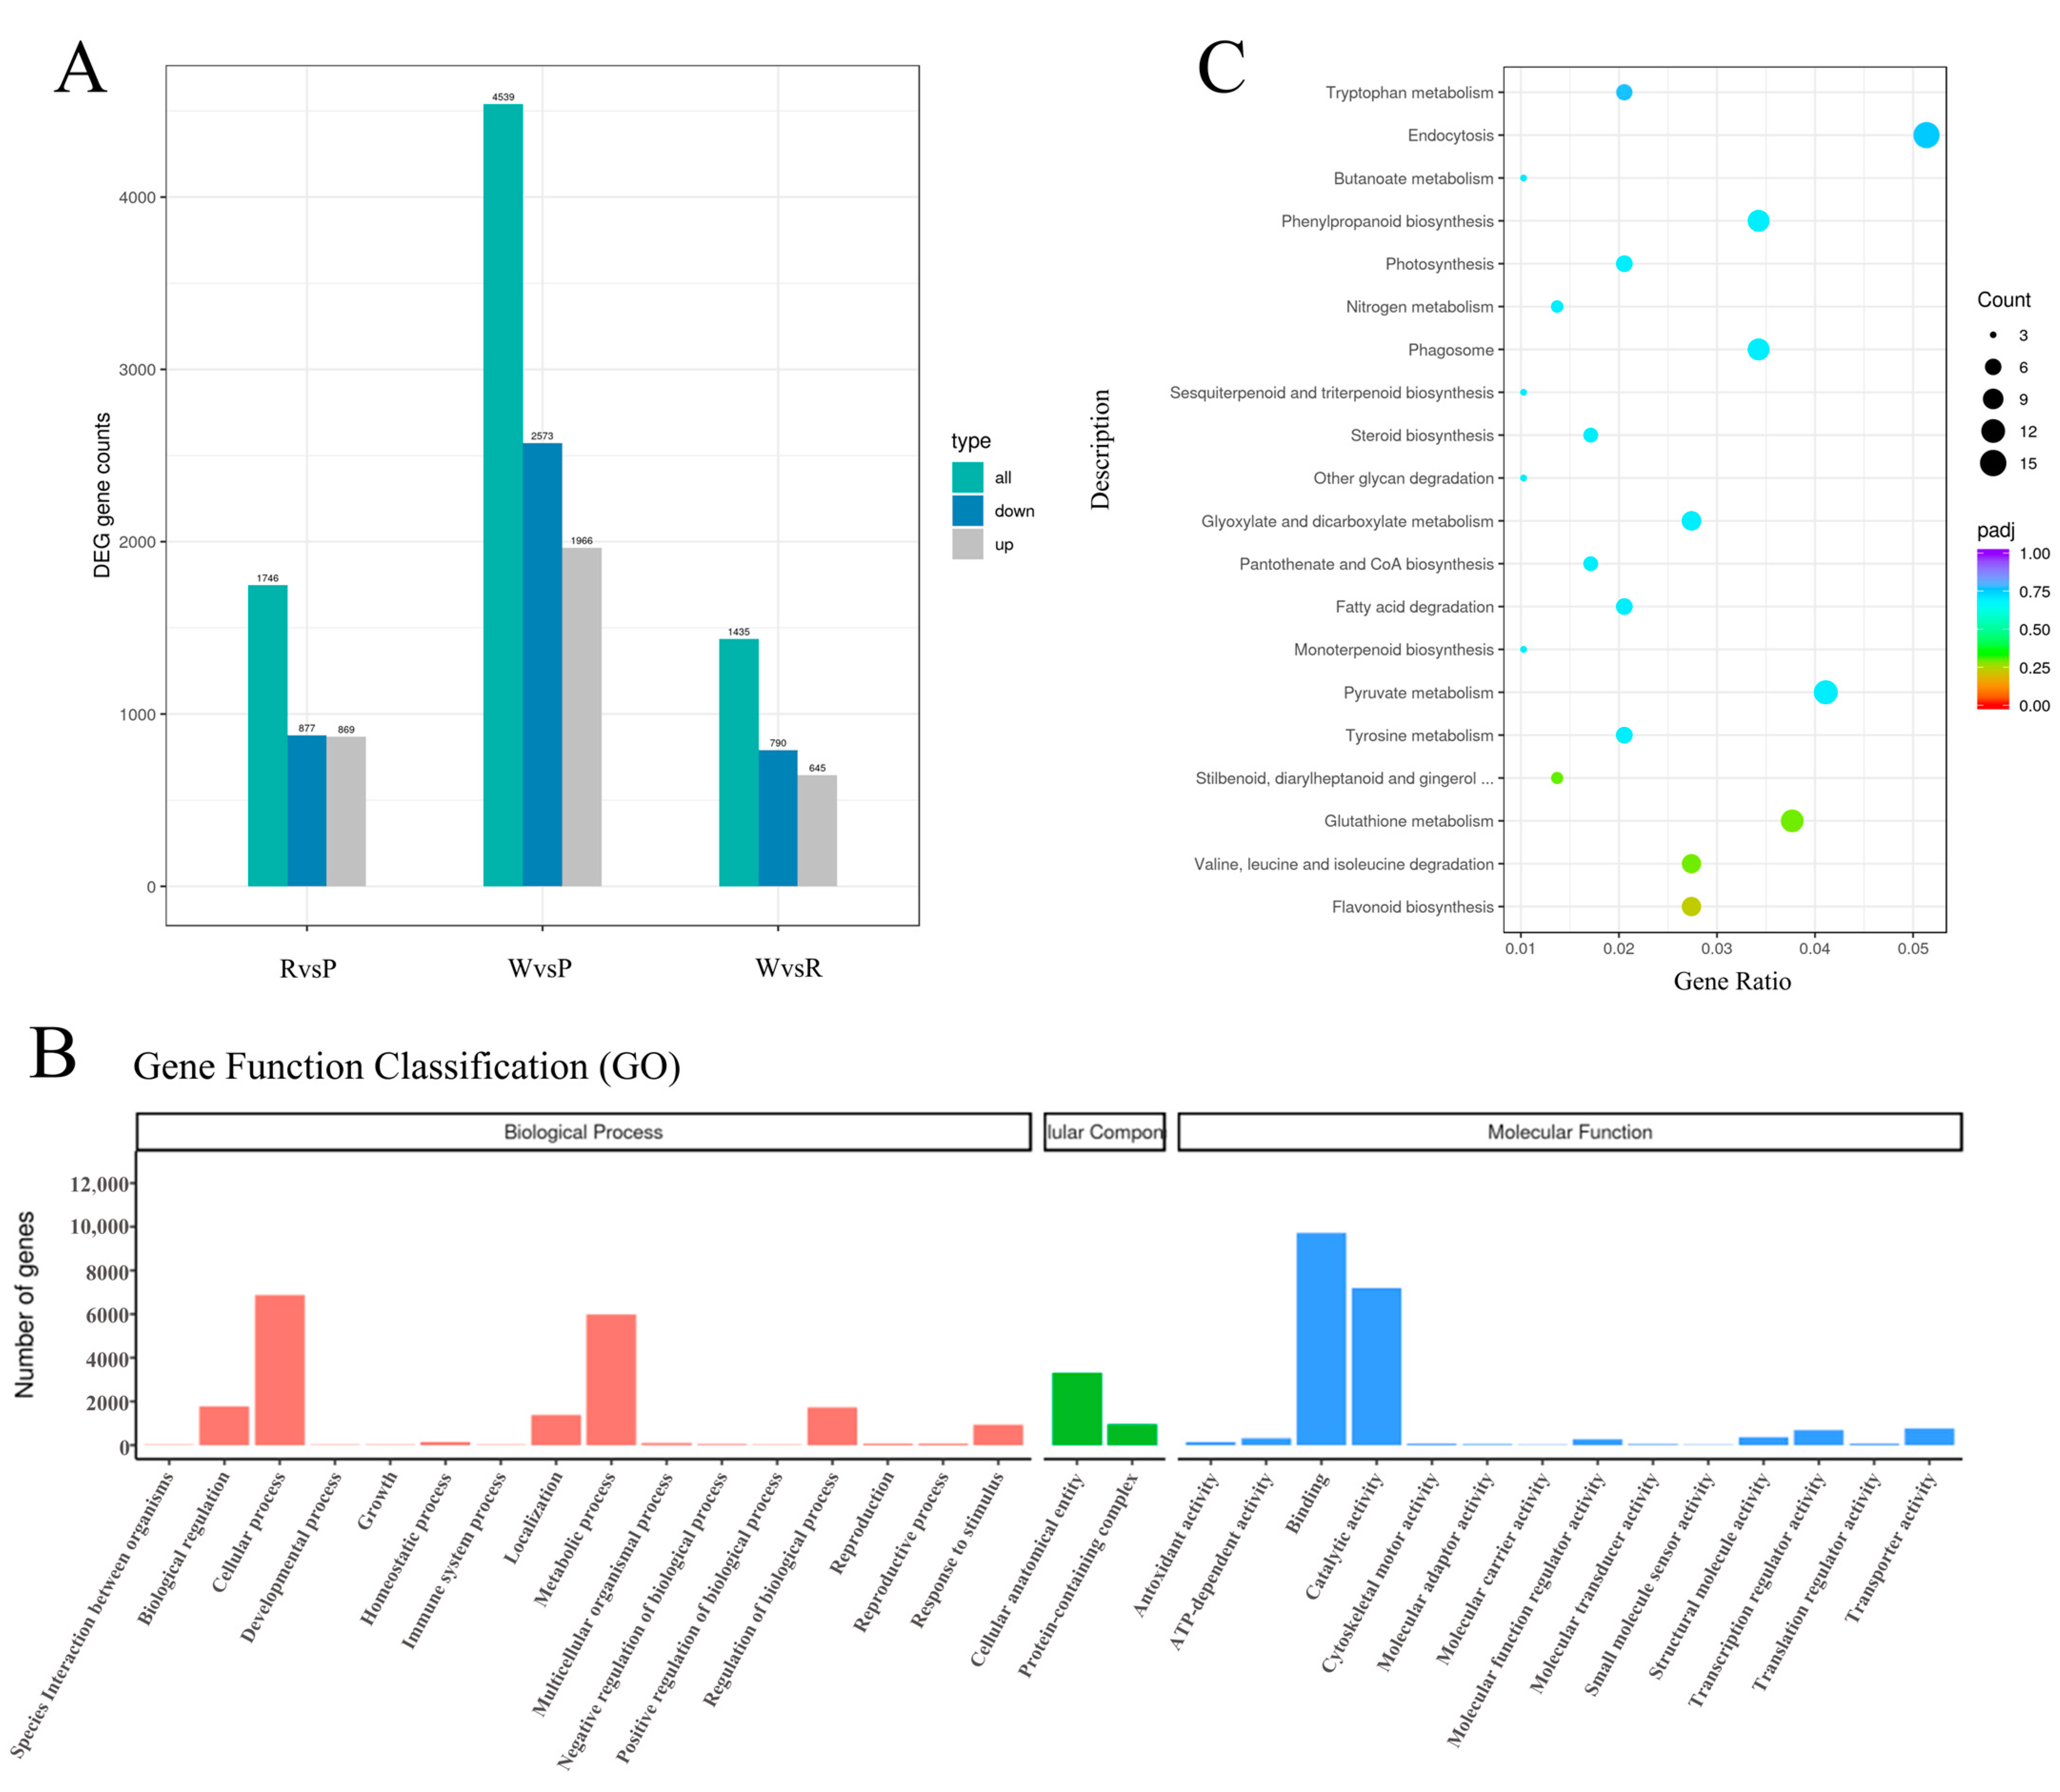
Differentially expressed genes (DEGs) between the three different-colored Lagerstroemia indica petals were identified using DESeq2 (1.20.0), with a q-value ≤ 0.05 and an absolute log2 fold change ≥ 1 (padj < 0.05 and |log2(FoldChange)| > 1). In the three comparison groups (W vs. R, W vs. P, R vs. P), there were 1435, 4539, and 1746 DEGs, respectively (Figure 3A and Tables S7–S9). The W vs. P group had the highest number of DEGs, with 1966 upregulated genes and 2573 downregulated genes.
GO is a comprehensive database that describes gene functions, divided into three categories: biological processes, cellular components, and molecular functions. We performed GO functional enrichment analysis on the DEGs using ClusterProfiler to determine the main functional categories in these groups. From the GO enrichment analysis results, we selected 32 terms to create a bar chart (Figure 3B). We used the KEGG pathway database for enrichment analysis and selected the top 20 significant KEGG pathways to visualize with a scatter plot. If fewer than 20 pathways were found, we display all pathways below. The horizontal axis in the figure represents the ratio of DEGs annotated to each KEGG pathway relative to the total number of DEGs, while the vertical axis shows the KEGG pathways. The size of the dots indicates the number of genes annotated to each KEGG pathway, and the colors ranging from red to purple denote the significance of enrichment (Figure 3C).

3.5. DEGs Involved in the Anthocyanin Synthesis Pathway

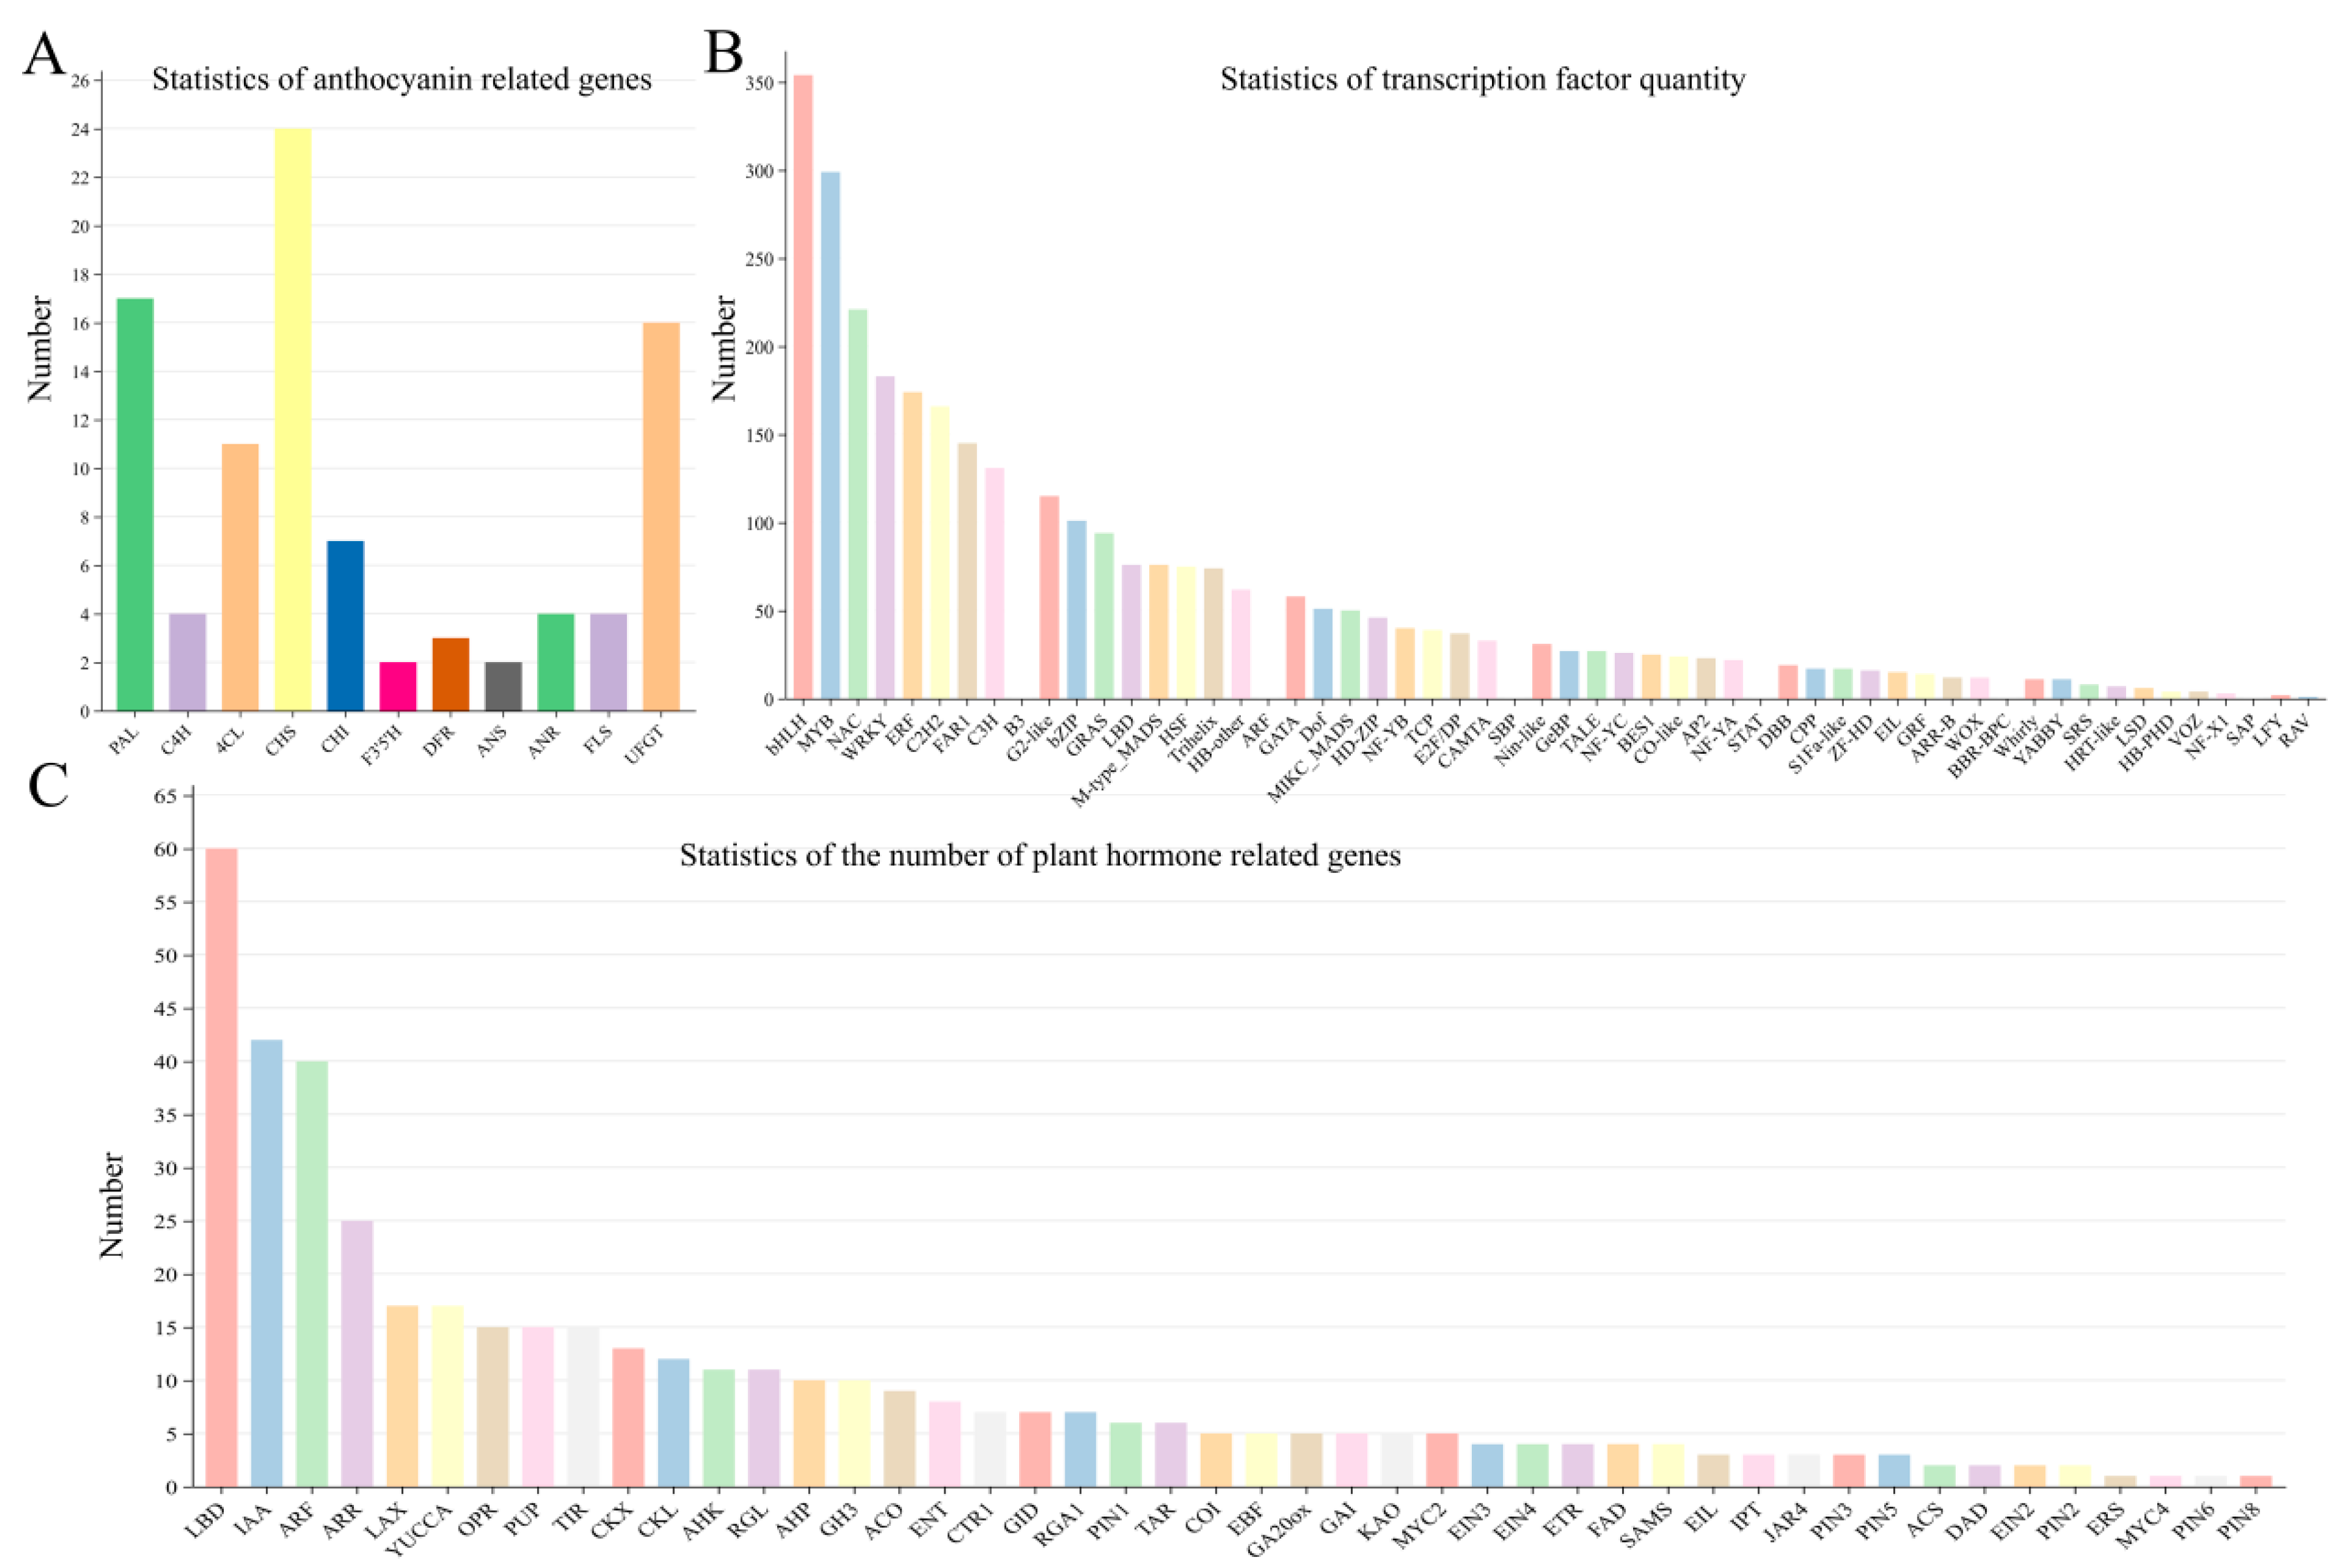
Based on the annotation of the 5785 DEGs in the transcriptome database (Table S10), 85 key genes related to anthocyanin synthesis were identified, such as PAL, C4H, 4CL, CHS, F3′5′H, DFR, ANS, ANR, FLS, and UFGT (Figure 4A). Among the three flower color varieties, a total of 42 DEGs showed higher expression levels in R and P than in W (Figure 5).
Transcriptome data analysis identified 1386 transcription factors among the DEGs, annotated as bHLH, NAC, WRKY, ERF, C2H2, FAR1, C3H, B3, MYB, G2-like, bZIP, GRAS, LBD, M-type MADS, HSF, Trihelix, HB other, ARF, GATA, Dof, MIKC-MADS, HD-ZIP, NF-YB, TCP, E2F, CAMTA, SBP, Nin-like, GeBP, TALE, NF-YC, BES1, CO-like, AP2, NF-YA, STAT, DBB, CPP, S1Fa-like, ZF-HD, EIL, GRF, ARR-B, WOX, BBR-BPC, Whirly, YABBY, SRS, HRT-like, LSD, HB-PHD, VOZ, NF-X1, SAP, LFY, RAV, etc. Among these, bHLH and MYB had the highest number of transcription factors, with 354 and 299, respectively (Figure 4B).
Plant hormones regulate growth and development, and several DEGs related to plant hormone signal transduction were identified. Among these, 394 genes are associated with growth hormone signal transduction. Specifically, 201 (51%) of these genes are related to auxin, including LBD, IAA, ARF, LAX, TIR, YUCCA, GH3, PIN, and TAR (Figure 4C).

3.6. Models of Anthocyanin Biosynthetic Pathways and qRT-PCR Verification

Based on transcriptome data, we constructed simplified models of the anthocyanin biosynthesis pathways in the three types of L. indica petals (Figure 5). These models illustrate the anthocyanin synthesis pathway starting from phenylalanine and show higher expression levels of PAL, C4H, 4CL, CHS, CHI, F3′H, F3′5′H, DFR, ANS, UFGT, and other genes in R and P petals compared with W petals.
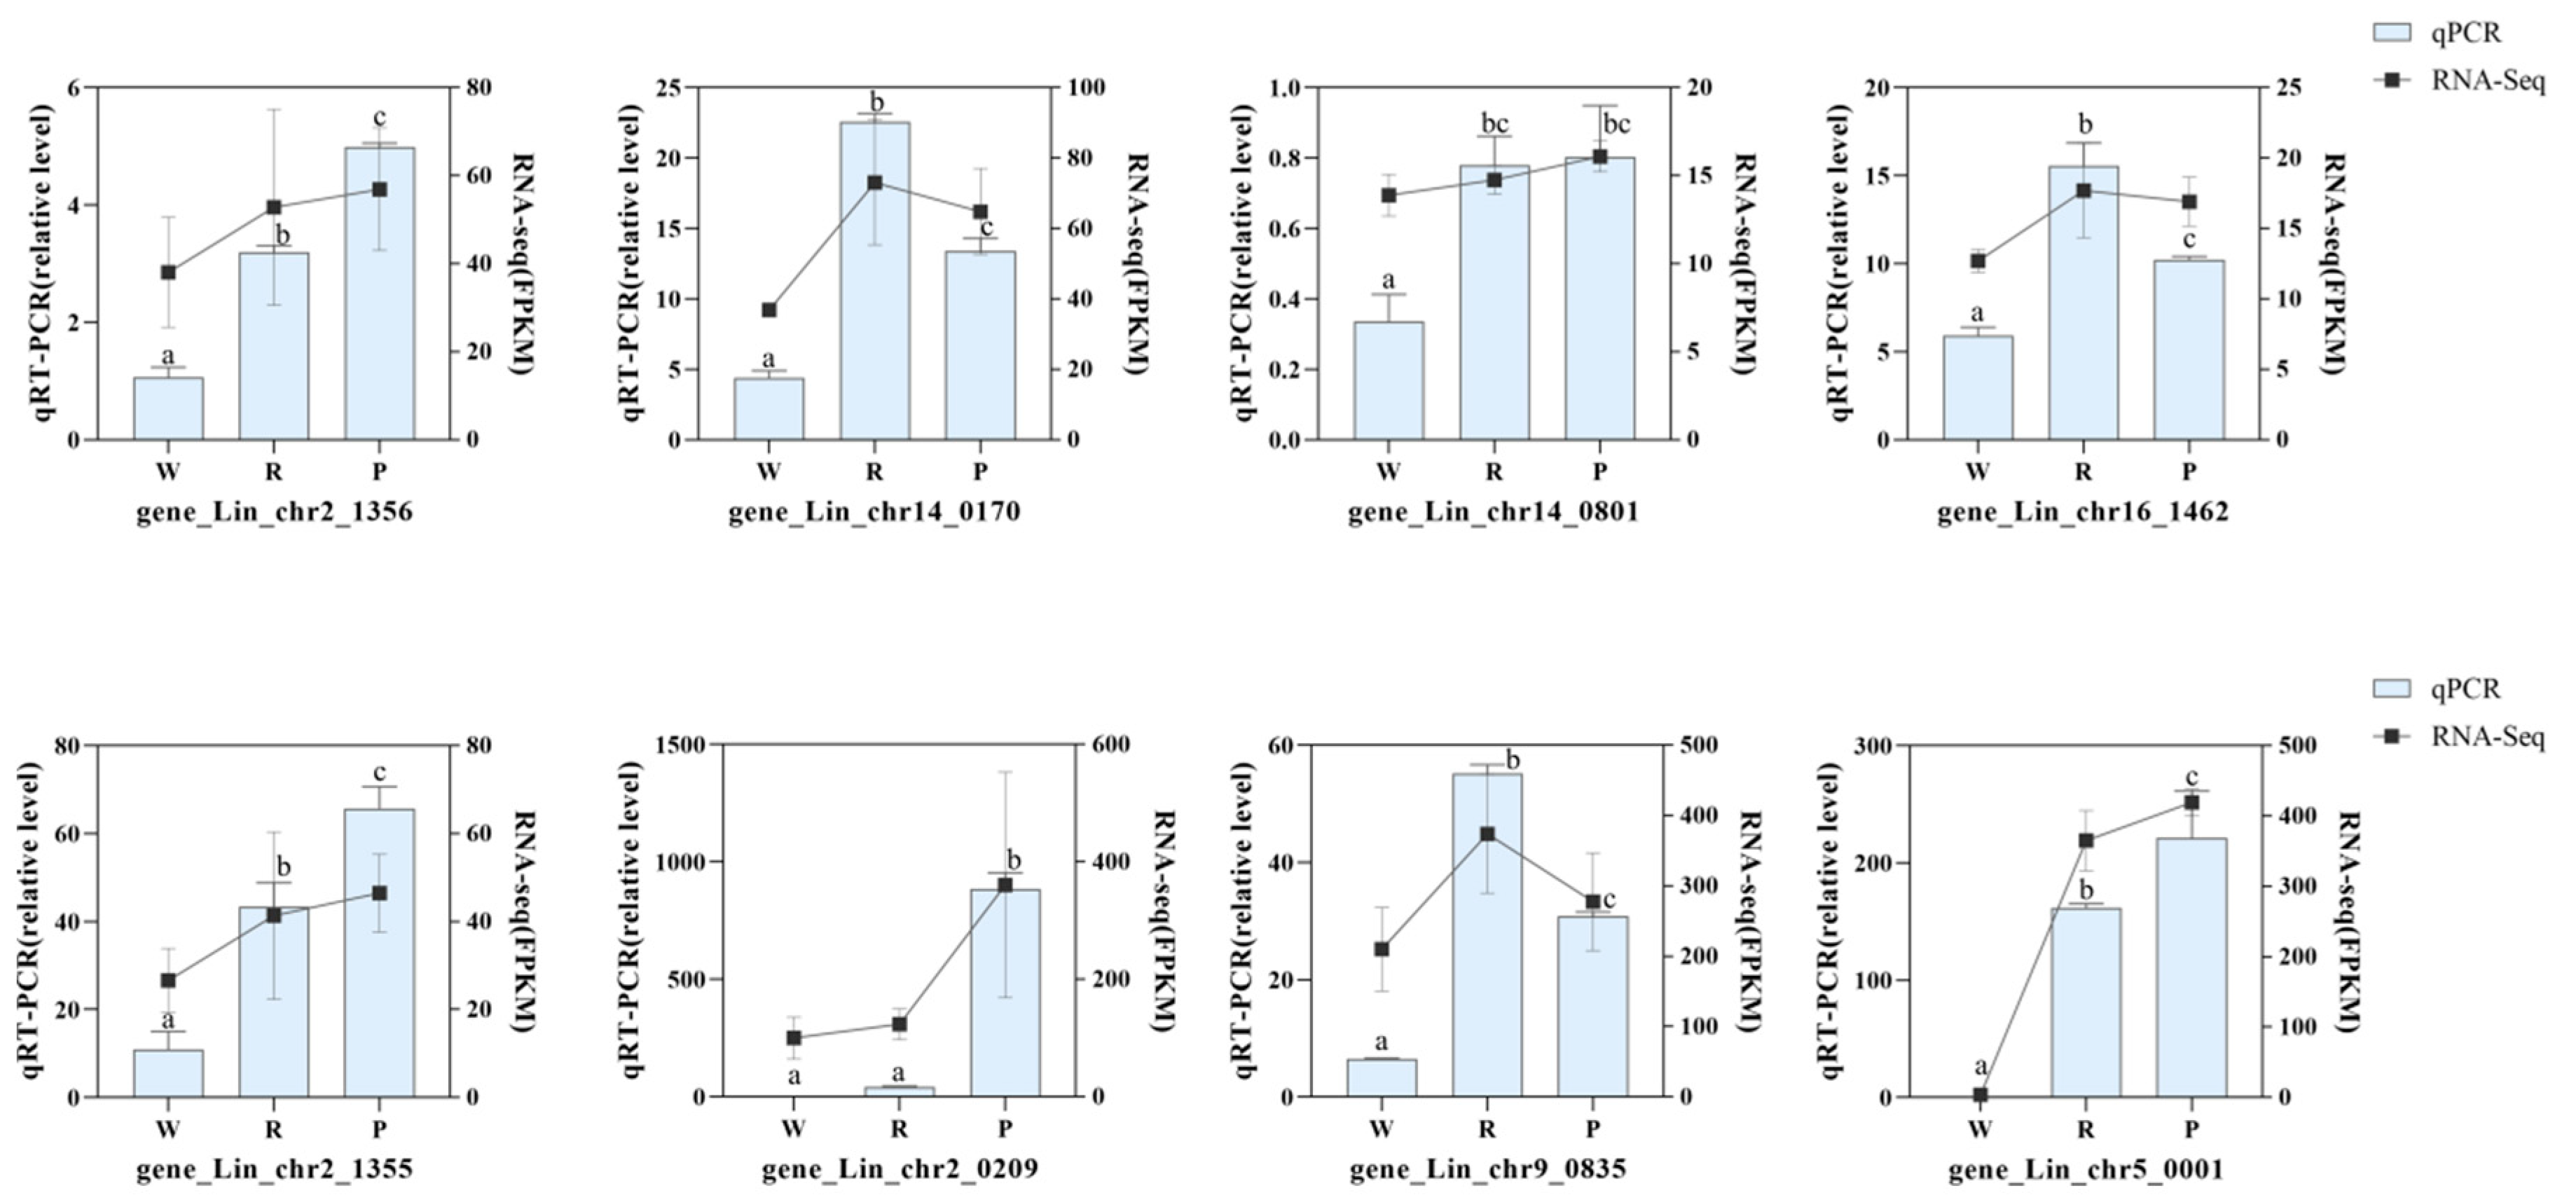
To validate the accuracy of the transcriptome data, 9 DEGs were selected from the 42 key DEGs for qRT-PCR analysis. The relative expression levels of these genes closely aligned with the transcriptome results (Figure 6), indicating that the RNA-seq data were reliable and accurate.

3.7. Correlation Analysis of Anthocyanin Synthesis Pathways

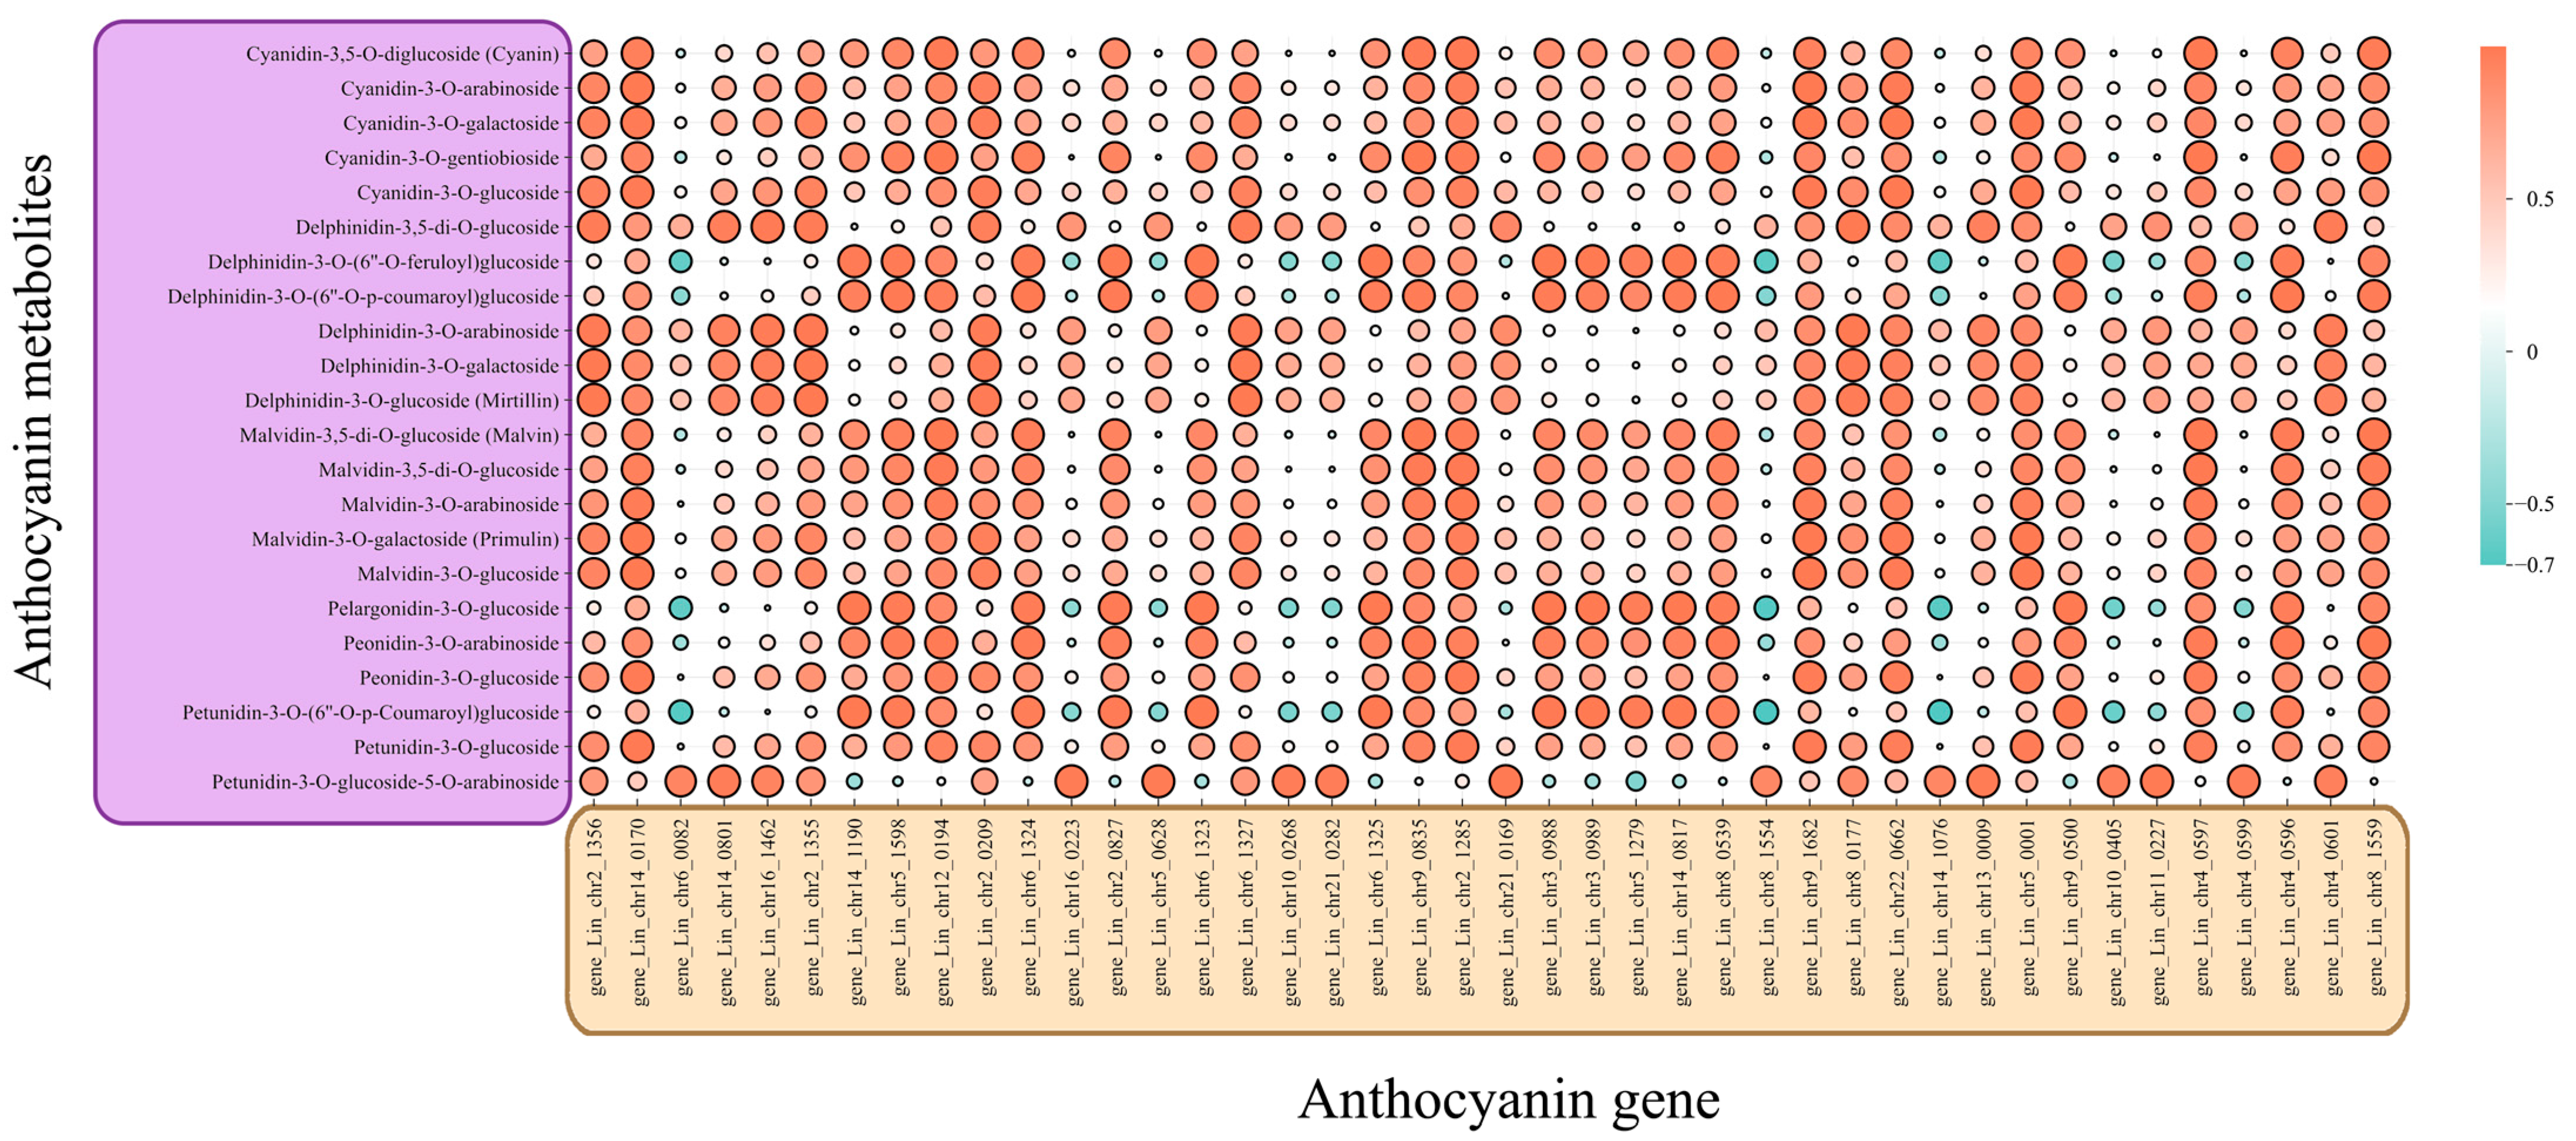
Using the annotation information from the 85 DEGs in the transcriptome database, we identified 42 key genes involved in anthocyanin synthesis, which play a significant role in the color of Lagerstroemia plants. These genes include PAL, C4H, 4CL, CHS, CHI, F3′5′H, DFR, ANS, and UFGT. Pearson correlation analysis was performed among these 42 functional genes and 22 selected anthocyanin metabolites with the Chiplot website (https://www.chiplot.online, accessed on 15 September 2024). The analysis revealed that most of these genes related to anthocyanin synthesis are positively correlated with the accumulation of the 22 anthocyanin metabolites (the correlation coefficient ranges > 0) (Figure 7), which may be associated with color.
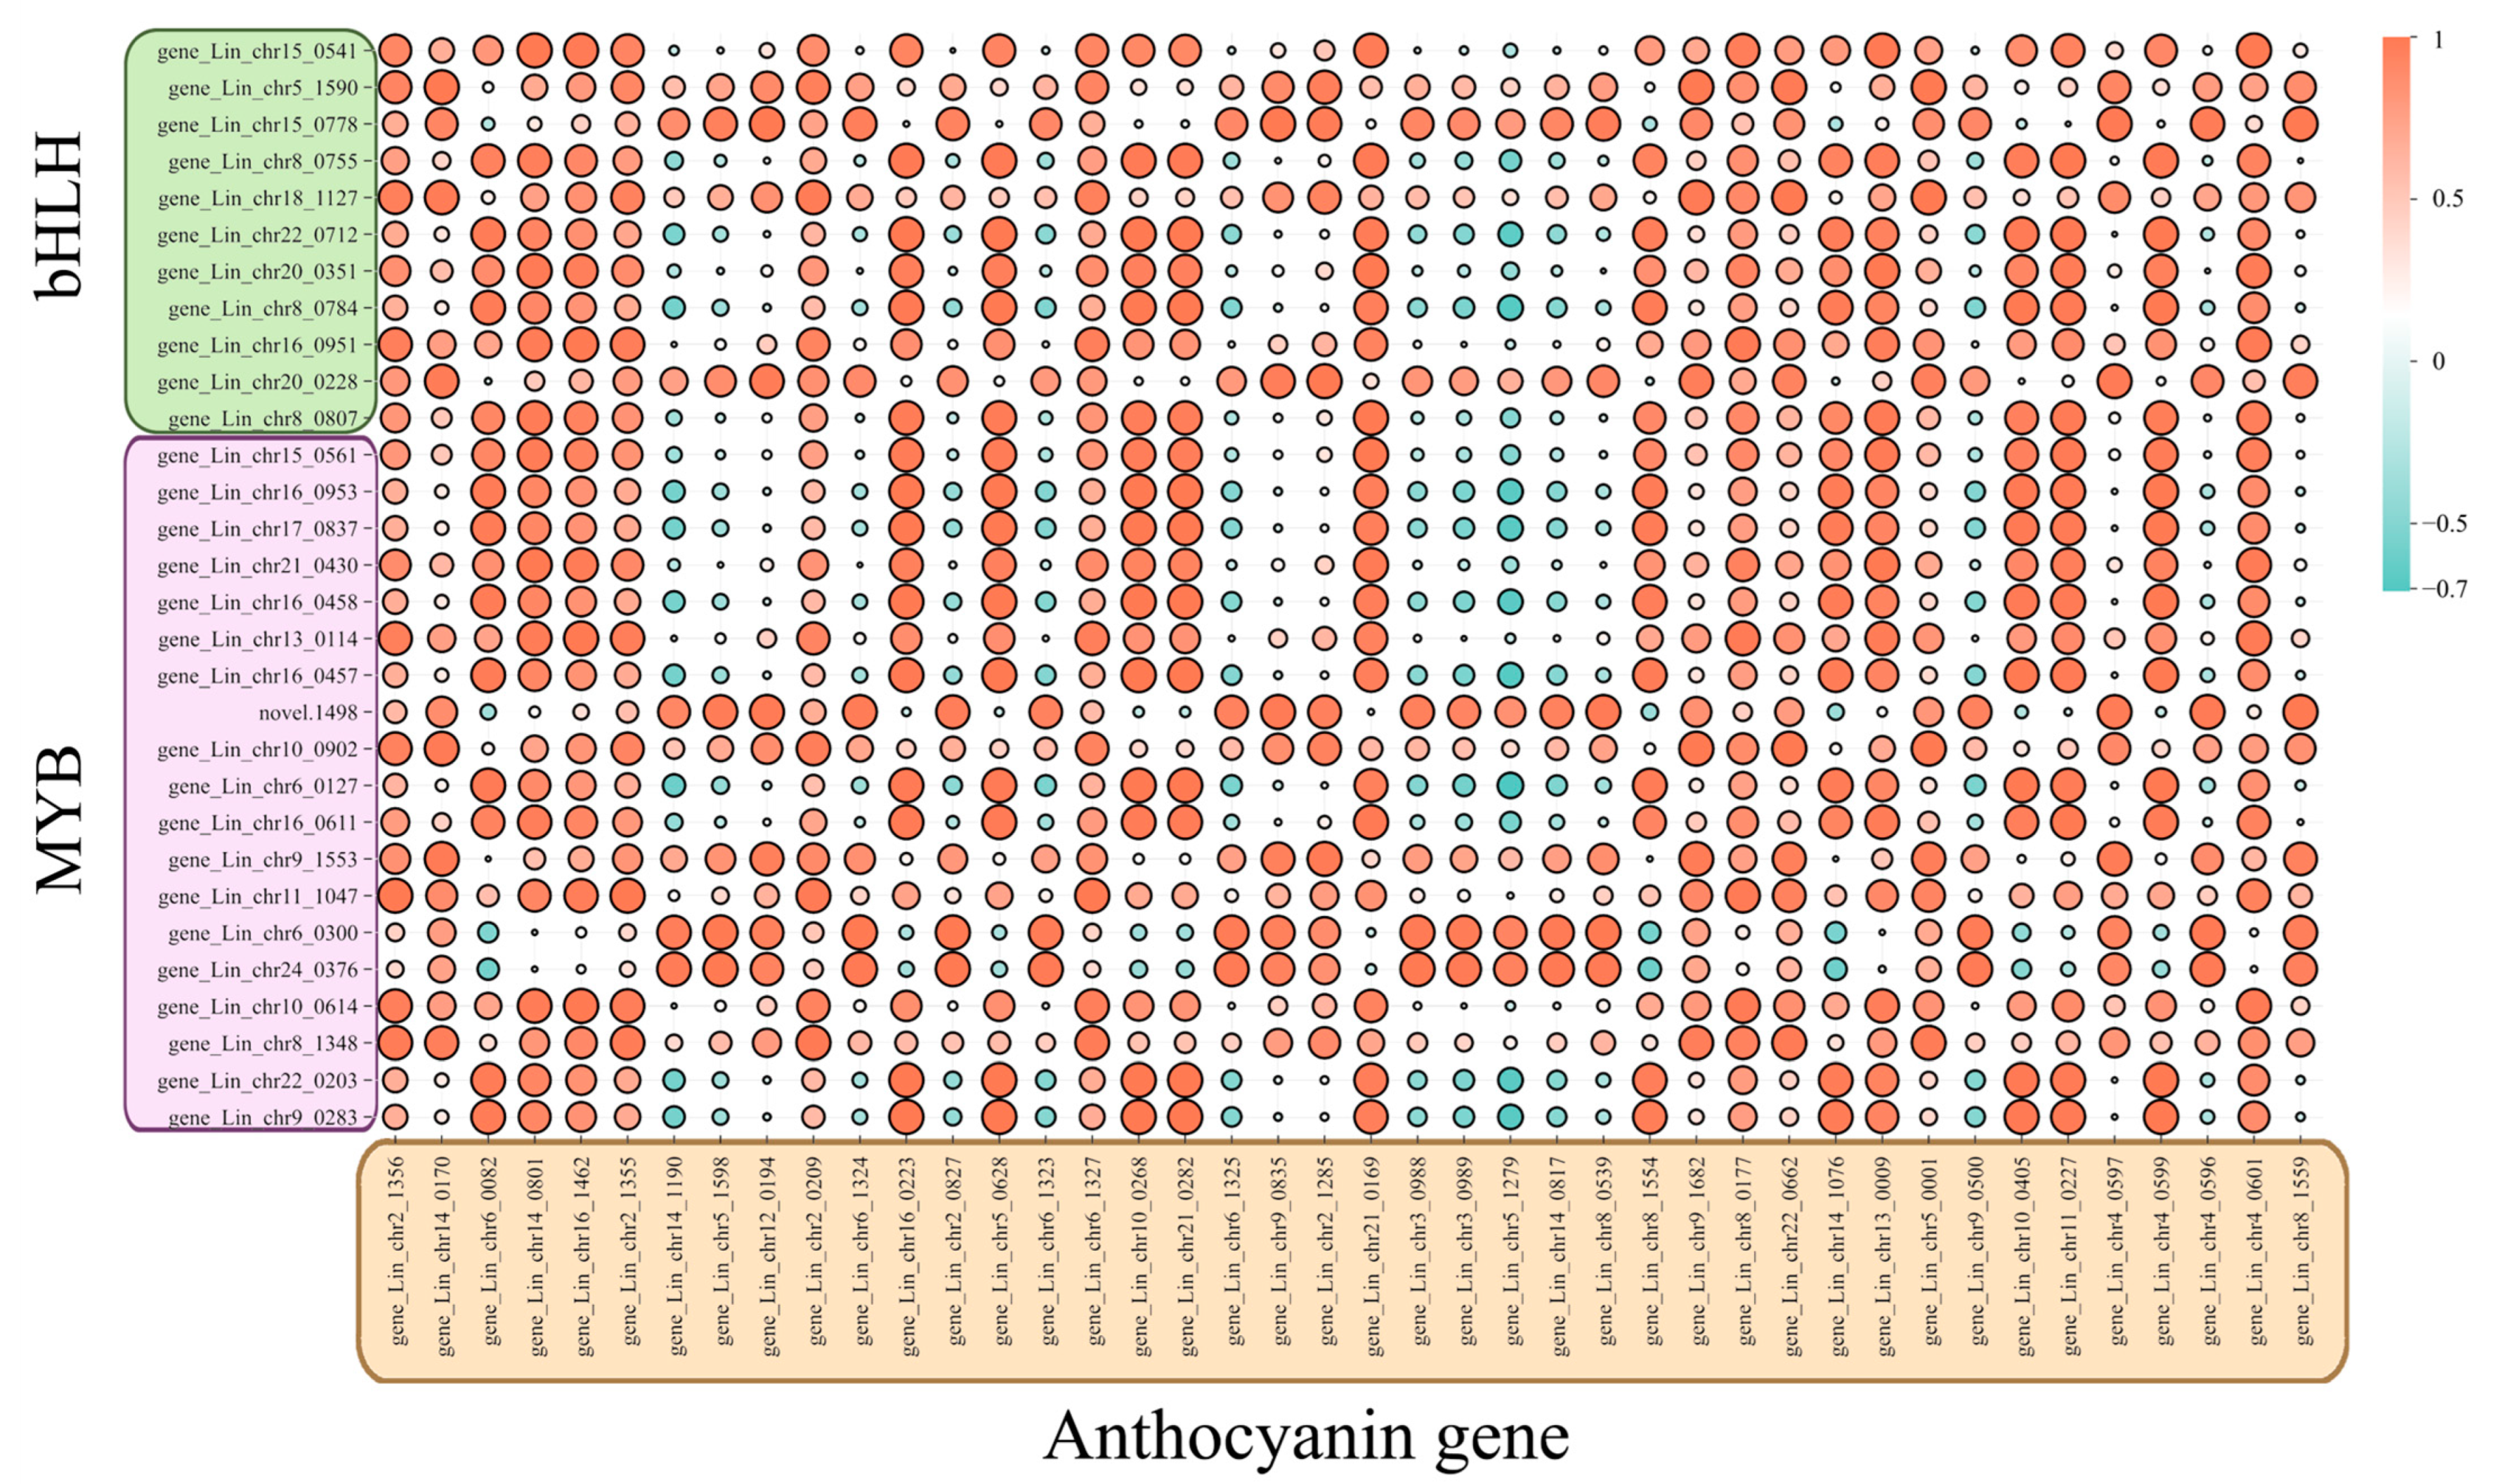
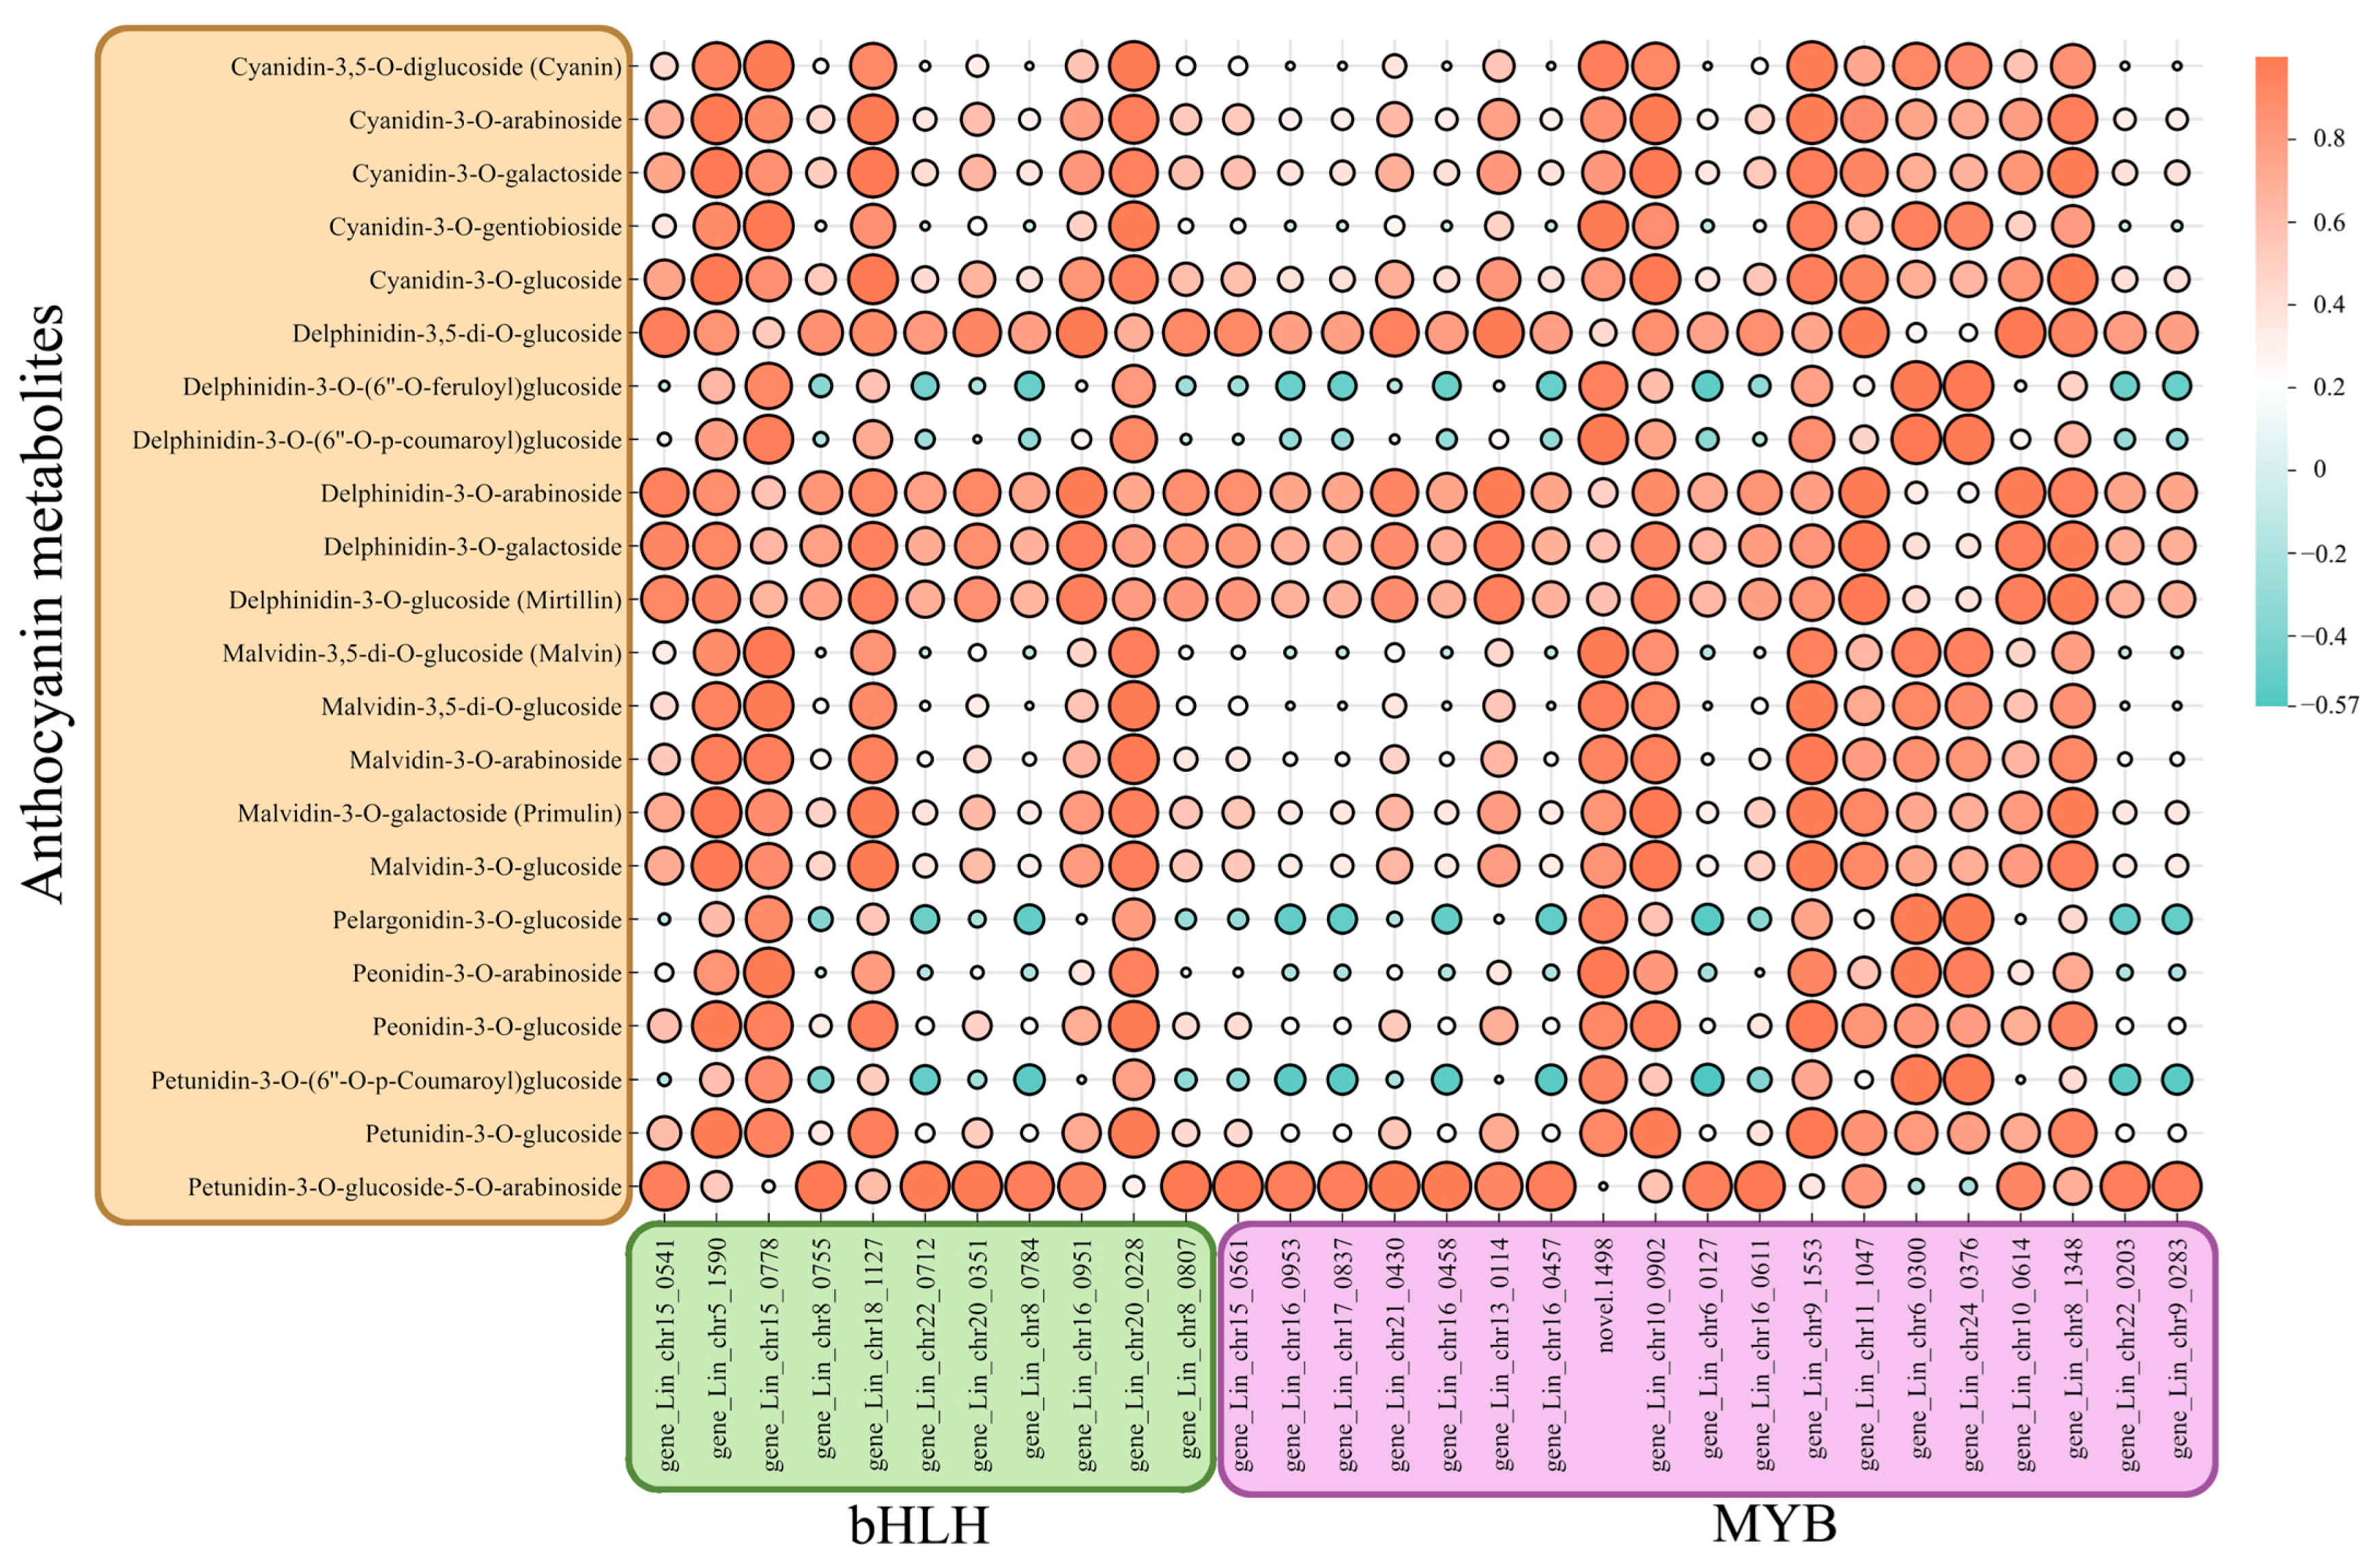
We screened 653 MYB and bHLH transcription factors from the transcriptome database and conducted a focused analysis on these factors. We identified 19 MYBs and 11 bHLHs that are more highly expressed in red and purple petals than in white petals. Correlation analysis between these MYBs and bHLHs, the 42 anthocyanin pathway-related genes, and the 22 anthocyanin metabolites revealed that the 19 MYBs, 11 bHLHs, and 42 anthocyanin synthesis pathway-related genes are positively correlated with the accumulation of the 22 anthocyanin metabolites (Figure 8 and Figure 9). These results suggest that transcription factors such as MYBs and bHLHs are involved in anthocyanin synthesis and influence flower color.
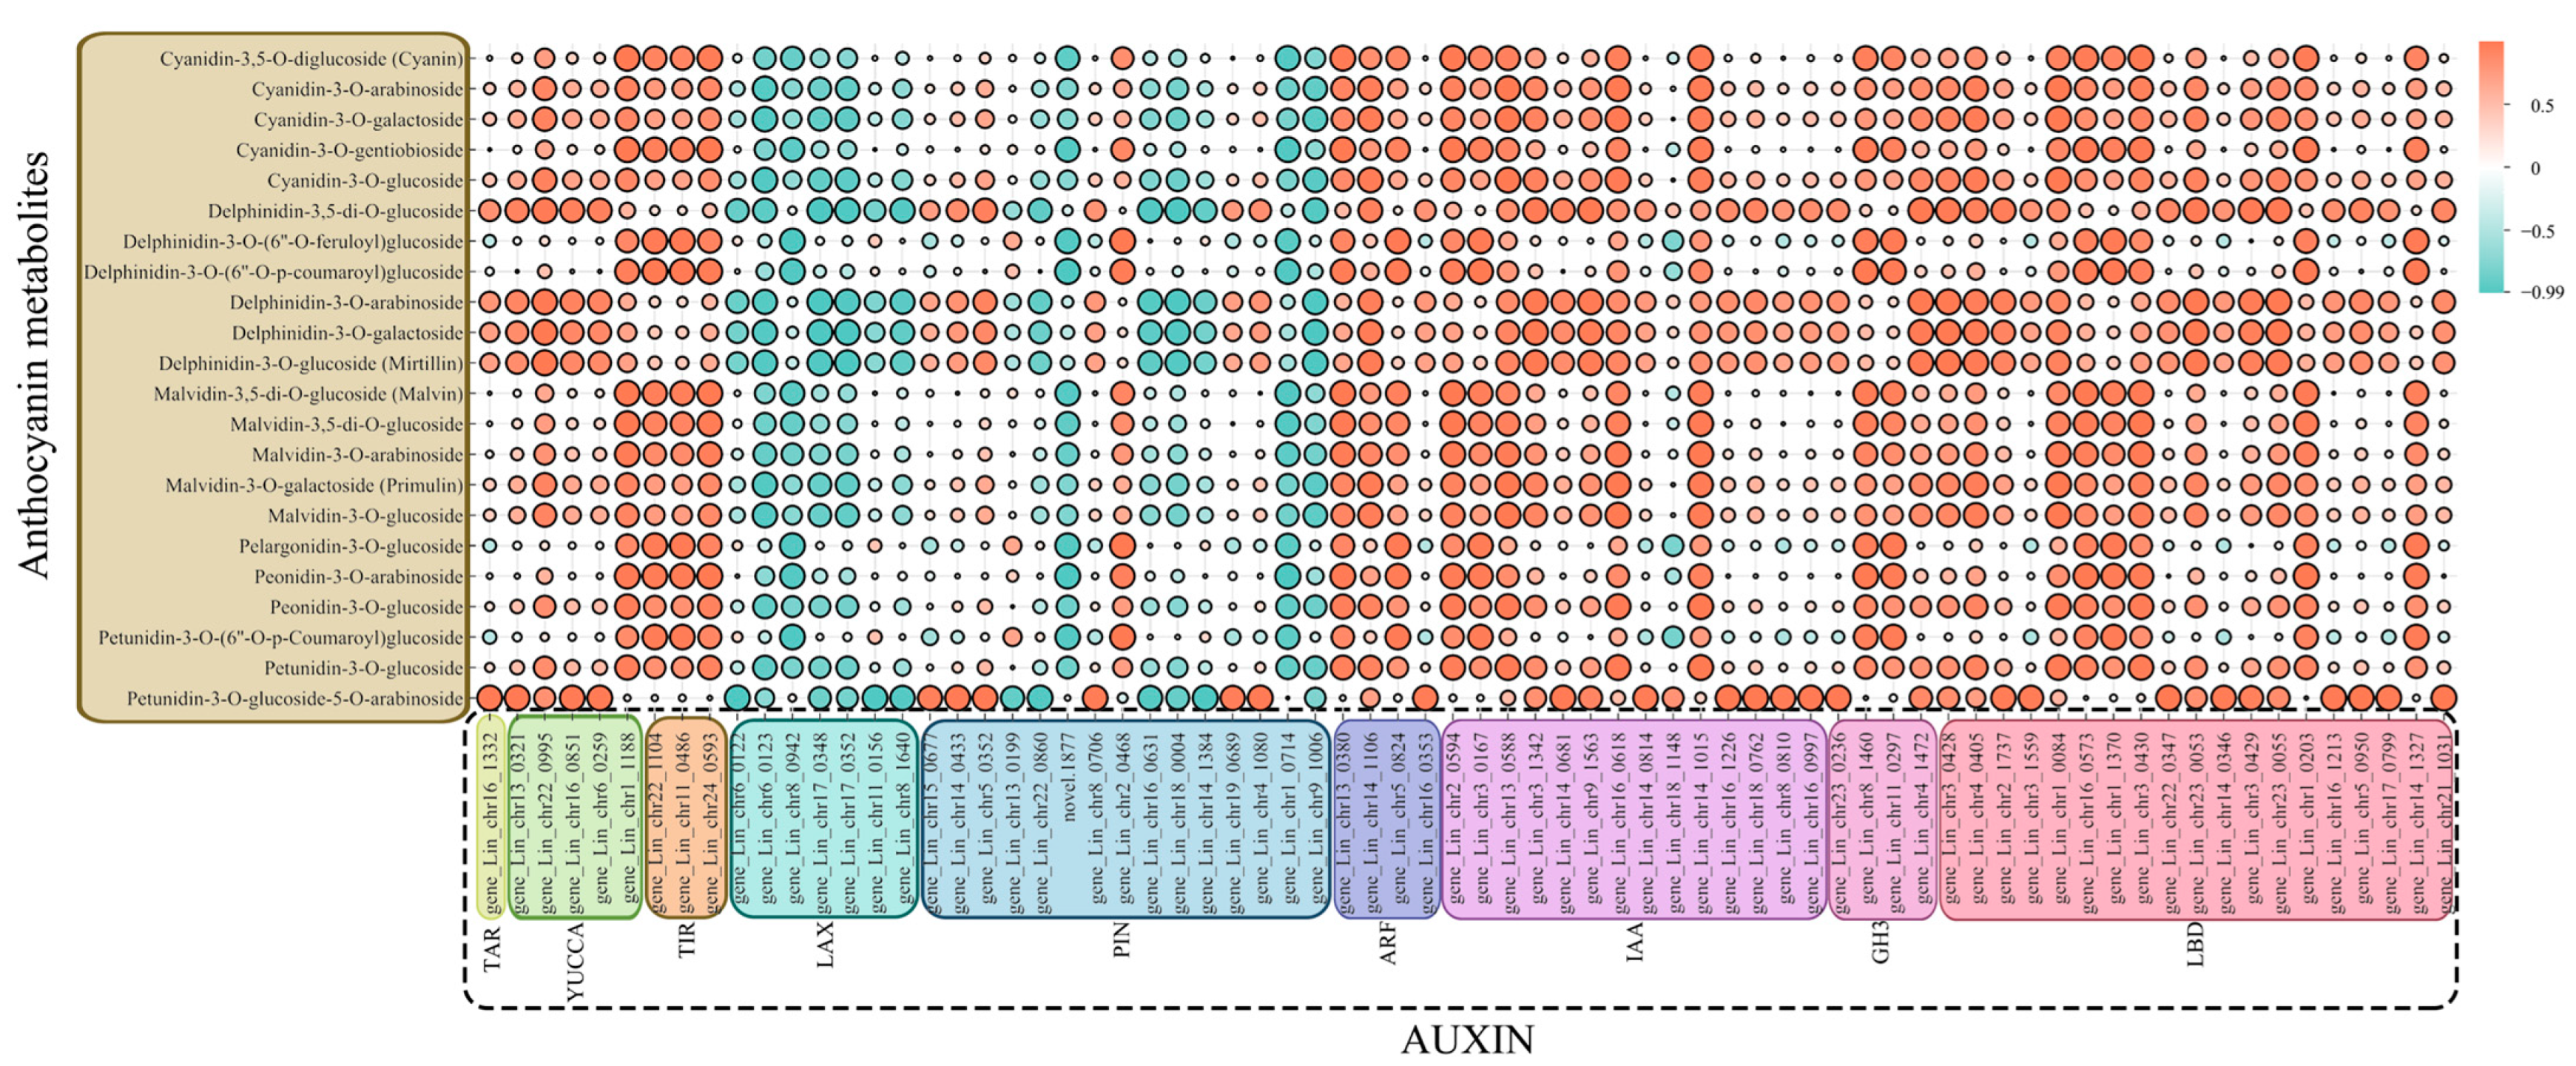
A total of 201 auxin-related genes were screened through transcriptome analysis, and their correlation with 42 anthocyanin-related genes and 22 anthocyanin metabolites was analyzed (Figure 10 and Figure 11). The analysis revealed that 74 auxin signaling genes strongly correlated with both the 42 anthocyanin synthesis genes and the 22 anthocyanin metabolites. Among these, 59 auxin signaling genes (TAR, YUCCA, TIR, ARF, IAA, GH3, LBD, PIN) were expressed at higher levels in the red and purple petals compared to white petals and positively correlated with anthocyanin-related genes and metabolites. Conversely, 15 auxin signaling genes (LAX, PIN) were expressed at lower levels in red and purple petals compared to white petals and were negatively correlated with anthocyanin-related genes and metabolites. These results suggest that auxin may play a role in regulating anthocyanin synthesis.

4. Discussion

Flower color is a key ornamental feature of plants, influencing their quality and market value. L. indica, known for its diverse color range, including white, red, and purple, is widely promoted for landscaping applications. Different types of flavonoids give plants different colors. The primary pigment in the red and purple varieties of Lagerstroemia indica flowers is anthocyanins, while in the yellow flowers of Heimia link, it is flavonols [25]. A study identified four types of anthocyanins in the petals of red and purple Lagerstroemia indica flowers: delphinidin-3-O-glucoside, cyanidin-3-O-glucoside, petunidin-3-O-glucoside, and malvidin-3-O-glucoside. In contrast, white Lagerstroemia indica flowers lack anthocyanins but contain high levels of flavonoids and flavonols compared to the red and purple varieties [26]. Anthocyanins are crucial pigments in petals, responsible for a spectrum of colors from orange/red to purple/blue [27]. For instance, the Japanese morning glory (Ipomoea nil) produces anthocyanins that give its petals a vibrant blue or red hue [28], while peony (Paeonia suffrutiosa) displays anthocyanin-induced spots in its petals [29]. This study used the red, pink, and white offspring from the half-sibling family of “Jianmin Red” to investigate the mechanism of color formation. Metabolome analysis revealed that anthocyanins are more abundant in red and pink Lagerstroemia indica flowers compared with white flowers (Figure 2B), with 22 anthocyanins upregulated in both red and pink varieties, which may be key components in the development of flower color in red Lagerstroemia indica.

4.1. Structural Gene Analysis of Anthocyanin Synthesis Pathway

The anthocyanin synthesis pathway of was elucidated [30], and the functions of the related synthetic genes were validated. For example, Chalcone synthase (CHS) is involved in anthocyanin synthesis and contributes to pigment deposition in papaya [31]. Overexpression of the BoDFR gene enhances anthocyanin accumulation in the petals of pink-leafed ornamental kale [32]. Additionally, ANS promotes anthocyanin expression in mature grape fruit epidermal cells, leading to increased pigment accumulation [33]. In this study, we detected the genes involved in the anthocyanin synthesis pathway, including PAL (6 DEGs), C4H (2 DEGs), 4CL (5 DEGs), CHS (10 DEGs), CHI (5 DEGs), F3′5′H (1 DEG), DFR (2 DEGs), ANS (2 DEGs), and UFGT (9 DEGs; Figure 5). Correlation analysis indicated that these anthocyanin synthesis pathway genes were strongly correlated with the 22 anthocyanin metabolites (Figure 7).

4.2. Correlation of Transcription Factors Involved in Anthocyanin Synthesis in L. indica

The transcriptional regulation of anthocyanin synthesis in plants is primarily controlled by a protein complex composed of MYB, bHLH, and WD40 proteins [34]. For instance, MYB6 promotes the biosynthesis of anthocyanins in Populus tomentosa [35]; PavMYB10.1 in cherries (Prunus avium) participates in anthocyanin biosynthesis and regulates fruit skin color [36]. The MYB transcription factor gene C1 in maize positively regulates ZmCHS and ZmDFR, thereby enhancing anthocyanin synthesis [37]. In Arabidopsis thaliana, the biosynthetic structural genes for anthocyanins are jointly regulated by the MBW complex [38]. FhMYB27 and FhMYBx in Freesia hybrida have been confirmed as inhibitors of R2R3 MYB and R3 MYB, showing a reverse regulatory effect on anthocyanin synthesis and accumulation [39]. The absence of bHLH expression in carnations inhibits DFR and downstream anthocyanin synthesis, leading to reduced anthocyanin accumulation and white petals [40]. DcTT8 in Dendrobium candidum can bind to and regulate the expression of DcF3′H and DcUFGT promoters, participating in anthocyanin synthesis [41]. Additionally, the activation of MYB is crucial for anthocyanin expression in fruits such as tomatoes, apples, kiwis, and pears, with the transcriptional abundance of activated MYB determining the level of anthocyanin accumulation [42]. This study screened differential transcription factors in R vs. W and P vs. W groups and found that MYBs and bHLHs were the most prevalent differential transcription factors (Figure 4B). The analysis of their correlation with genes and metabolites related to anthocyanin synthesis pathways revealed that MYBs and bHLHs transcription factors significantly correlated with the genes and metabolites involved in anthocyanin synthesis, with their expression trends being positively correlated (Figure 8 and Figure 9).

4.3. Auxins May Be Involved in the Regulation of Anthocyanin Synthesis in L. indica

Auxin is a crucial growth hormone in plants that plays a significant role in various growth and development processes [43]. Auxin is also involved in regulating plant anthocyanin synthesis. For example, treating Arabidopsis thaliana seedlings with an IAA solution increased the expression levels of transcription factors related to anthocyanin synthesis, thereby positively regulating anthocyanin synthesis [44]. In transgenic red meat apples (Malus domestica), the overexpression of MdIAA121 and MdARF13 in callus tissue reduced the inhibitory effect of MdARF13 on anthocyanin biosynthesis [45]. Additionally, the endogenous auxin content in purple wheat (Triticum aestivum) grains was positively correlated with anthocyanin accumulation [46]. In strawberries (Fragaria × ananassa), inhibiting anthocyanin-related genes with exogenous growth hormones delayed fruit ripening [47]. This study identified 394 plant-hormone-related genes, with auxin-related genes being the most numerous (Figure 4C). These genes are strongly correlated with both anthocyanin synthesis pathway genes and anthocyanin metabolites, showing a positive (TAR, YUCCA, TIR, ARF, IAA, GH3, LBD, and PIN) or negative (LAX, PIN) regulatory trend (Figure 10 and Figure 11). These findings suggest that auxin may play a role in regulating anthocyanin synthesis in L. indica, thereby influencing flower color formation.

5. Conclusions

Transcriptome and metabolome analyses were used for the identification and functional classification of DEGs and anthocyanin among three different-colored petals (white, red, and purple) in order to investigate the mechanism of flower color differentiation in L. indica. The results showed that 22 anthocyanins highly accumulated in the red and purple flowers. Additionally, 42 anthocyanin-biosynthesis-related genes, such as PAL, C4H, 4CL, CHS, CHI, F3′5′H, DFR, ANS, and UFGT, were highly expressed in red and purple petals, which positively correlated with the accumulation of the 22 anthocyanin metabolites. Meanwhile, we identified 19 MYB and 11 bHLH transcription factors that were highly expressed in red and purple petals. And, their expression trends were positively correlated with the accumulation of the 22 anthocyanins. Importantly, 59 auxin biosynthesis and signaling-related genes, such as TAR, YUCCA, TIR, ARF, IAA, GH3, LBD, and PIN, were positively correlated with anthocyanin-related genes and metabolites, indicating that the auxin pathway is related to anthocyanin metabolism and further involved in the flower color formation in L. indica. Further analyzing the molecular regulation mechanism involved and the screening of key genes will lay a foundation for understanding the genetics and for the breeding of L. indica.

Supplementary Materials

The following supporting information can be downloaded at: https://www.mdpi.com/article/10.3390/horticulturae10111229/s1, Figure S1: Scree plot of principal component analysis; Table S1: Primer sequences for RT-qPCR; Table S2: All metabolites in metabolomics analysis; Table S3: Differentially accumulated flavonoids; Table S4: Transcriptome analysis of three Lagerstroemia indica; Table S5: All genes in transcriptome analysis; Table S6: Summary of functional annotation result of unigenes; Table S7: Differentially expressed genes in W vs. R; Table S8: Differentially expressed genes in W vs. P; Table S9: Differentially expressed genes in R vs. P; Table S10: Differentially expressed genes.

Author Contributions

Z.G.: Investigation, formal analysis, writing—original draft; Z.C.: funding acquisition, visualization; J.W. and W.L.: conceptualization, formal analysis, writing—review and editing. All the authors reviewed and approved the final manuscript. All authors have read and agreed to the published version of the manuscript.

Funding

This work was funded by Zhejiang Provincial Natural Science Foundation of China (grant number: LY20C160001, 2020–2024) and Zhejiang Science and Technology Major Program on Agricultural New Variety Breeding (grant number: 2021C02071-4, 2021–2025) from Science and Technology Department of Zhejiang Province.

Data Availability Statement

The transcriptome sequence data used in this study were submitted to NCBI (SUB14762385).

Conflicts of Interest

The authors declare no conflicts of interest.

References

  1. Zhao, D.; Tao, J. Recent Advances on the Development and Regulation of Flower Color in Ornamental Plants. Front. Plant Sci. 2015, 6, 261. [Google Scholar] [CrossRef]
  2. Ahmed, N.U.; Park, J.-I.; Jung, H.-J.; Hur, Y.; Nou, I.-S. Anthocyanin Biosynthesis for Cold and Freezing Stress Tolerance and Desirable Color in Brassica Rapa. Funct. Integr. Genom. 2015, 15, 383–394. [Google Scholar] [CrossRef] [PubMed]
  3. Miyazaki, K.; Makino, K.; Iwadate, E.; Deguchi, Y.; Ishikawa, F. Anthocyanins from Purple Sweet Potato Ipomoea Batatas Cultivar Ayamurasaki Suppress the Development of Atherosclerotic Lesions and Both Enhancements of Oxidative Stress and Soluble Vascular Cell Adhesion Molecule-1 in Apolipoprotein E-Deficient Mice. J. Agric. Food Chem. 2008, 56, 11485–11492. [Google Scholar] [CrossRef] [PubMed]
  4. Hichri, I.; Barrieu, F.; Bogs, J.; Kappel, C.; Delrot, S.; Lauvergeat, V. Recent Advances in the Transcriptional Regulation of the Flavonoid Biosynthetic Pathway. J. Exp. Bot. 2011, 62, 2465–2483. [Google Scholar] [CrossRef] [PubMed]
  5. Yoshida, K.; Mori, M.; Kondo, T. Blue Flower Color Development by Anthocyanins: From Chemical Structure to Cell Physiology. Nat Prod. Rep. 2009, 26, 884–915. [Google Scholar] [CrossRef]
  6. Tanaka, Y.; Sasaki, N.; Ohmiya, A. Biosynthesis of Plant Pigments: Anthocyanins, Betalains and Carotenoids. Plant J. 2008, 54, 733–749. [Google Scholar] [CrossRef]
  7. Yoshida, K.; Oyama, K.; Kondo, T. Insight into Chemical Mechanisms of Sepal Color Development and Variation in Hydrangea. Proc. Jpn. Acad. Ser. B 2021, 97, 51–68. [Google Scholar] [CrossRef]
  8. Liu, W.; Feng, Y.; Yu, S.; Fan, Z.; Li, X.; Li, J.; Yin, H. The Flavonoid Biosynthesis Network in Plants. Int. J. Mol.Sci. 2021, 22, 12824. [Google Scholar] [CrossRef]
  9. Winkel-Shirley, B. Flavonoid Biosynthesis. A Colorful Model for Genetics, Biochemistry, Cell Biology, and Biotechnology. Plant Physiol. 2001, 126, 485–493. [Google Scholar] [CrossRef]
  10. Dong, N.; Lin, H. Contribution of Phenylpropanoid Metabolism to Plant Development and Plant–Environment Interactions. J. Integr. Plant Biol. 2021, 63, 180–209. [Google Scholar] [CrossRef]
  11. Zhao, M.; Li, J.; Zhu, L.; Chang, P.; Li, L.; Zhang, L. Identification and Characterization of MYB-bHLH-WD40 Regulatory Complex Members Controlling Anthocyanidin Biosynthesis in Blueberry Fruits Development. Genes 2019, 10, 496. [Google Scholar] [CrossRef] [PubMed]
  12. Wang, L.; Deng, R.; Bai, Y.; Wu, H.; Li, C.; Wu, Q.; Zhao, H. Tartary Buckwheat R2R3-MYB Gene FtMYB3 Negatively Regulates Anthocyanin and Proanthocyanin Biosynthesis. Int. J. Mol. Sci. 2022, 23, 2775. [Google Scholar] [CrossRef] [PubMed]
  13. Yu, M.; Man, Y.; Wang, Y. Light- and Temperature-Induced Expression of an R2R3-MYB Gene Regulates Anthocyanin Biosynthesis in Red-Fleshed Kiwifruit. Int. J. Mol. Sci. 2019, 20, 5228. [Google Scholar] [CrossRef] [PubMed]
  14. Albert, N.W.; Butelli, E.; Moss, S.M.A.; Piazza, P.; Waite, C.N.; Schwinn, K.E.; Davies, K.M.; Martin, C. Discrete bHLH Transcription Factors Play Functionally Overlapping Roles in Pigmentation Patterning in Flowers of Antirrhinum Majus. New Phytol. 2021, 231, 849–863. [Google Scholar] [CrossRef] [PubMed]
  15. Moro, L. Postharvest Auxin and Methyl Jasmonate Effect on Anthocyanin Biosynthesis in Red Raspberry (Rubus idaeus L.). J. Plant Growth Regul. 2017, 36, 773–782. [Google Scholar] [CrossRef]
  16. Clayton-Cuch, D.; Yu, L.; Shirley, N.; Bradley, D.; Bulone, V.; Böttcher, C. Auxin Treatment Enhances Anthocyanin Production in the Non-Climacteric Sweet Cherry (Prunus avium L.). Int. J.Mol. Sci. 2021, 22, 10760. [Google Scholar] [CrossRef]
  17. Li, Y.; Zhang, Z.; Wang, P.; Wang, S.; Ma, L.; Li, L.; Yang, R.; Ma, Y.; Wang, Q. Comprehensive Transcriptome Analysis Discovers Novel Candidate Genes Related to Leaf Color in a Lagerstroemia indica Yellow Leaf Mutant. Genes Genom. 2015, 37, 851–863. [Google Scholar] [CrossRef]
  18. Zetter, R.; Ferguson, D.K. Lagerstroemia (Lythraceae) Pollen from the Miocene of Eastern China. Grana 2008, 47, 262–271. [Google Scholar]
  19. Esmail Al-Snafi, A. A Review on Lagerstroemia Indica: A Potential Medicinal Plant. IOSR J. Pharm. 2019, 9, 6–42. [Google Scholar]
  20. Jin-fen, W. Research Progress in Breeding of Lagerstroemia Plant. Acta Hortic. Sin. 2013, 40, 1795–1804. [Google Scholar]
  21. Wang, A.; Li, R.; Ren, L.; Gao, X.; Zhang, Y.; Ma, Z.; Ma, D.; Luo, Y. A Comparative Metabolomics Study of Flavonoids in Sweet Potato with Different Flesh Colors (Ipomoea batatas (L.) Lam). Food Chem. 2018, 260, 124–134. [Google Scholar] [CrossRef]
  22. Chen, W.; Gong, L.; Guo, Z.; Wang, W.; Zhang, H.; Liu, X.; Yu, S.; Xiong, L.; Luo, J. A Novel Integrated Method for Large-Scale Detection, Identification, and Quantification of Widely Targeted Metabolites: Application in the Study of Rice Metabolomics. Mol Plant. 2013, 6, 1769–1780. [Google Scholar] [CrossRef] [PubMed]
  23. Pertea, M.; Pertea, G.M.; Antonescu, C.M.; Chang, T.-C.; Mendell, J.T.; Salzberg, S.L. StringTie Enables Improved Reconstruction of a Transcriptome from RNA-Seq Reads. Nat. Biotechnol. 2015, 33, 290–295. [Google Scholar] [CrossRef] [PubMed]
  24. Wang, S.; Tu, H.; Wan, J.; Chen, W.; Liu, X.; Luo, J.; Xu, J.; Zhang, H. Spatio-Temporal Distribution and Natural Variation of Metabolites in Citrus Fruits. Food Chem. 2016, 199, 8–17. [Google Scholar] [CrossRef] [PubMed]
  25. Lin, Q.; Liu, T.; Liu, J.; Cai, M.; Cheng, T.; Wang, J.; Zhang, Q.; Pan, H. Flavonoids Composition and Content in Petals of Lagerstroemia and Heimia Species and Cultivars. Acta Hortic. Sin. 2021, 48, 1956–1968. [Google Scholar]
  26. Zhang, J.; Wang, L.-S.; Gao, J.-M.; Shu, Q.-Y.; Li, C.-H.; Yao, J.; Hao, Q.; Zhang, J.-J. Determination of Anthocyanins and Exploration of Relationship between Their Composition and Petal Coloration in Crape Myrtle (Lagerstroemia Hybrid). J. Integr. Plant Biol. 2008, 50, 581–588. [Google Scholar] [CrossRef]
  27. Xia, Y.; Chen, W.; Xiang, W.; Wang, D.; Xue, B.; Liu, X.; Xing, L.; Wu, D.; Wang, S.; Guo, Q. Integrated Metabolic Profiling and Transcriptome Analysis of Pigment Accumulation in Lonicera Japonica Flower Petals during Colour-Transition. BMC. Plant Biol. 2021, 21, 98. [Google Scholar] [CrossRef]
  28. Morita, Y.; Hoshino, A.; Kikuchi, Y.; Okuhara, H.; Ono, E.; Tanaka, Y.; Fukui, Y.; Saito, N.; Nitasaka, E.; Noguchi, H. Japanese Morning Glory Dusky Mutants Displaying Reddish-brown or Purplish-gray Flowers Are Deficient in a Novel Glycosylation Enzyme for Anthocyanin Biosynthesis, UDP-glucose: Anthocyanidin 3-O-glucoside-2″-O-glucosyltransferase, Due to 4-bp Insertions in the Gene. Plant J. 2005, 42, 353–363. [Google Scholar]
  29. Gu, Z.; Zhu, J.; Hao, Q.; Yuan, Y.-W.; Duan, Y.-W.; Men, S.; Wang, Q.; Hou, Q.; Liu, Z.-A.; Shu, Q. A Novel R2R3-MYB Transcription Factor Contributes to Petal Blotch Formation by Regulating Organ-Specific Expression of PsCHS in Tree Peony (Paeonia suffruticosa). Plant Cell Physiol. 2019, 60, 599–611. [Google Scholar] [CrossRef]
  30. Sun, X. Anthocyanins: From Biosynthesis Regulation to Crop Improvement. Bot. Lett. 2021, 168, 1–12. [Google Scholar] [CrossRef]
  31. Deng, X.; Bashandy, H.; Ainasoja, M.; Kontturi, J.; Pieti, M.; Albert, V.A.; Valkonen, J.P.T.; Elomaa, P.; Teeri, T.H. Functional Diversification of Duplicated Chalcone Synthase Genes in Anthocyanin Biosynthesis of Gerbera Hybrida. New Phytol. 2014, 201, 1469–1483. [Google Scholar] [CrossRef] [PubMed]
  32. Feng, X. The Dihydroflavonol 4-Reductase BoDFR1 Drives Anthocyanin Accumulation in Pink-Leaved Ornamental Kale. Theor. Appl. Genet. 2021, 134, 159–169. [Google Scholar] [CrossRef] [PubMed]
  33. Wang, H.; Wang, W.; Zhang, P.; Pan, Q.; Zhan, J.; Huang, W. Gene Transcript Accumulation, Tissue and Subcellular Localization of Anthocyanidin Synthase (ANS) in Developing Grape Berries. Plant Sci. 2010, 179, 103–113. [Google Scholar] [CrossRef]
  34. Xue, L.; Huang, X.; Zhang, Z.; Lin, Q.; Zhong, Q.; Zhao, Y.; Gao, Z.; Xu, C. An Anthocyanin-Related Glutathione S-Transferase, MrGST1, Plays an Essential Role in Fruit Coloration in Chinese Bayberry (Morella rubra). Front. Plant Sci. 2022, 13, 903333. [Google Scholar] [CrossRef] [PubMed]
  35. Wang, L.; Lu, W.; Ran, L.; Dou, L.; Yao, S.; Hu, J.; Fan, D.; Li, C.; Luo, K. R2R3- MYB Transcription Factor MYB 6 Promotes Anthocyanin and Proanthocyanidin Biosynthesis but Inhibits Secondary Cell Wall Formation in Populus tomentosa. Plant J. 2019, 99, 733–751. [Google Scholar] [CrossRef]
  36. Jin, W.; Wang, H.; Li, M.; Wang, J.; Yang, Y.; Zhang, X.; Yan, G.; Zhang, H.; Liu, J.; Zhang, K. The R2R3 MYB Transcription Factor PavMYB10.1 Involves in Anthocyanin Biosynthesis and Determines Fruit Skin Colour in Sweet Cherry (Prunus avium L.). Plant Biotechnol. J. 2016, 14, 2120–2133. [Google Scholar] [CrossRef]
  37. Koes, R.; Verweij, W.; Quattrocchio, F. Flavonoids: A Colorful Model for the Regulation and Evolution of Biochemical Pathways. Trends Plant Sci. 2005, 10, 236–242. [Google Scholar] [CrossRef]
  38. Stracke, R.; Ishihara, H.; Huep, G.; Barsch, A.; Mehrtens, F.; Niehaus, K.; Weisshaar, B. Differential Regulation of Closely Related R2R3-MYB Transcription Factors Controls Flavonol Accumulation in Different Parts of the Arabidopsis thaliana Seedling. Plant J. 2007, 50, 660–677. [Google Scholar] [CrossRef]
  39. Li, Y.; Shan, X.; Gao, R.; Han, T.; Zhang, J.; Wang, Y.; Kimani, S.; Wang, L.; Gao, X. MYB Repressors and MBW Activation Complex Collaborate to Fine-Tune Flower Coloration in Freesia Hybrida. Commun. Biol. 2020, 3, 396. [Google Scholar] [CrossRef]
  40. Totsuka, A.; Okamoto, E.; Miyahara, T.; Kouno, T.; Cano, E.A.; Sasaki, N.; Watanabe, A.; Tasaki, K.; Nishihara, M.; Ozeki, Y. Repressed Expression of a Gene for a Basic Helix-Loop-Helix Protein Causes a White Flower Phenotype in Carnation. Breed Sci. 2018, 68, 139–143. [Google Scholar] [CrossRef]
  41. Jia, N.; Wang, J.-J.; Liu, J.; Jiang, J.; Sun, J.; Yan, P.; Sun, Y.; Wan, P.; Ye, W.; Fan, B. DcTT8, a bHLH Transcription Factor, Regulates Anthocyanin Biosynthesis in Dendrobium Candidum. Plant Physiol. Biochem. 2021, 162, 603–612. [Google Scholar] [CrossRef] [PubMed]
  42. Wang, Y.; Li, S.; Shi, Y.; Lv, S.; Zhu, C.; Xu, C.; Zhang, B.; Allan, A.C.; Grierson, D.; Chen, K. The R2R3 MYB Ruby1 Is Activated by Two Cold Responsive Ethylene Response Factors, via the Retrotransposon in Its Promoter, to Positively Regulate Anthocyanin Biosynthesis in Citrus. Plant J. 2024, 119, 1433–1448. [Google Scholar] [CrossRef] [PubMed]
  43. Jaakola, L. New Insights into the Regulation of Anthocyanin Biosynthesis in Fruits. Trends Plant Sci. 2013, 18, 477–483. [Google Scholar] [CrossRef] [PubMed]
  44. Lewis, D.R.; Ramirez, M.V.; Miller, N.D.; Vallabhaneni, P.; Ray, W.K.; Helm, R.F.; Winkel, B.S.J.; Muday, G.K. Auxin and Ethylene Induce Flavonol Accumulation through Distinct Transcriptional Networks. Plant Physiol. 2011, 156, 144–164. [Google Scholar] [CrossRef] [PubMed]
  45. Wang, Y.; Wang, N.; Xu, H.; Jiang, S.; Fang, H.; Su, M.; Zhang, Z.; Zhang, T.; Chen, X. Auxin Regulates Anthocyanin Biosynthesis through the Aux/IAA–ARF Signaling Pathway in Apple. Hortic. Res. 2018, 5, 59. [Google Scholar] [CrossRef]
  46. Li, L. Co-Regulation of Auxin and Cytokinin in Anthocyanin Accumulation During Natural Development of Purple Wheat Grains. J. Plant Growth Regul. 2021, 40, 1881–1893. [Google Scholar] [CrossRef]
  47. Chen, J.; Mao, L.; Lu, W.; Ying, T.; Luo, Z. Transcriptome Profiling of Postharvest Strawberry Fruit in Response to Exogenous Auxin and Abscisic Acid. Planta 2016, 243, 183–197. [Google Scholar] [CrossRef]
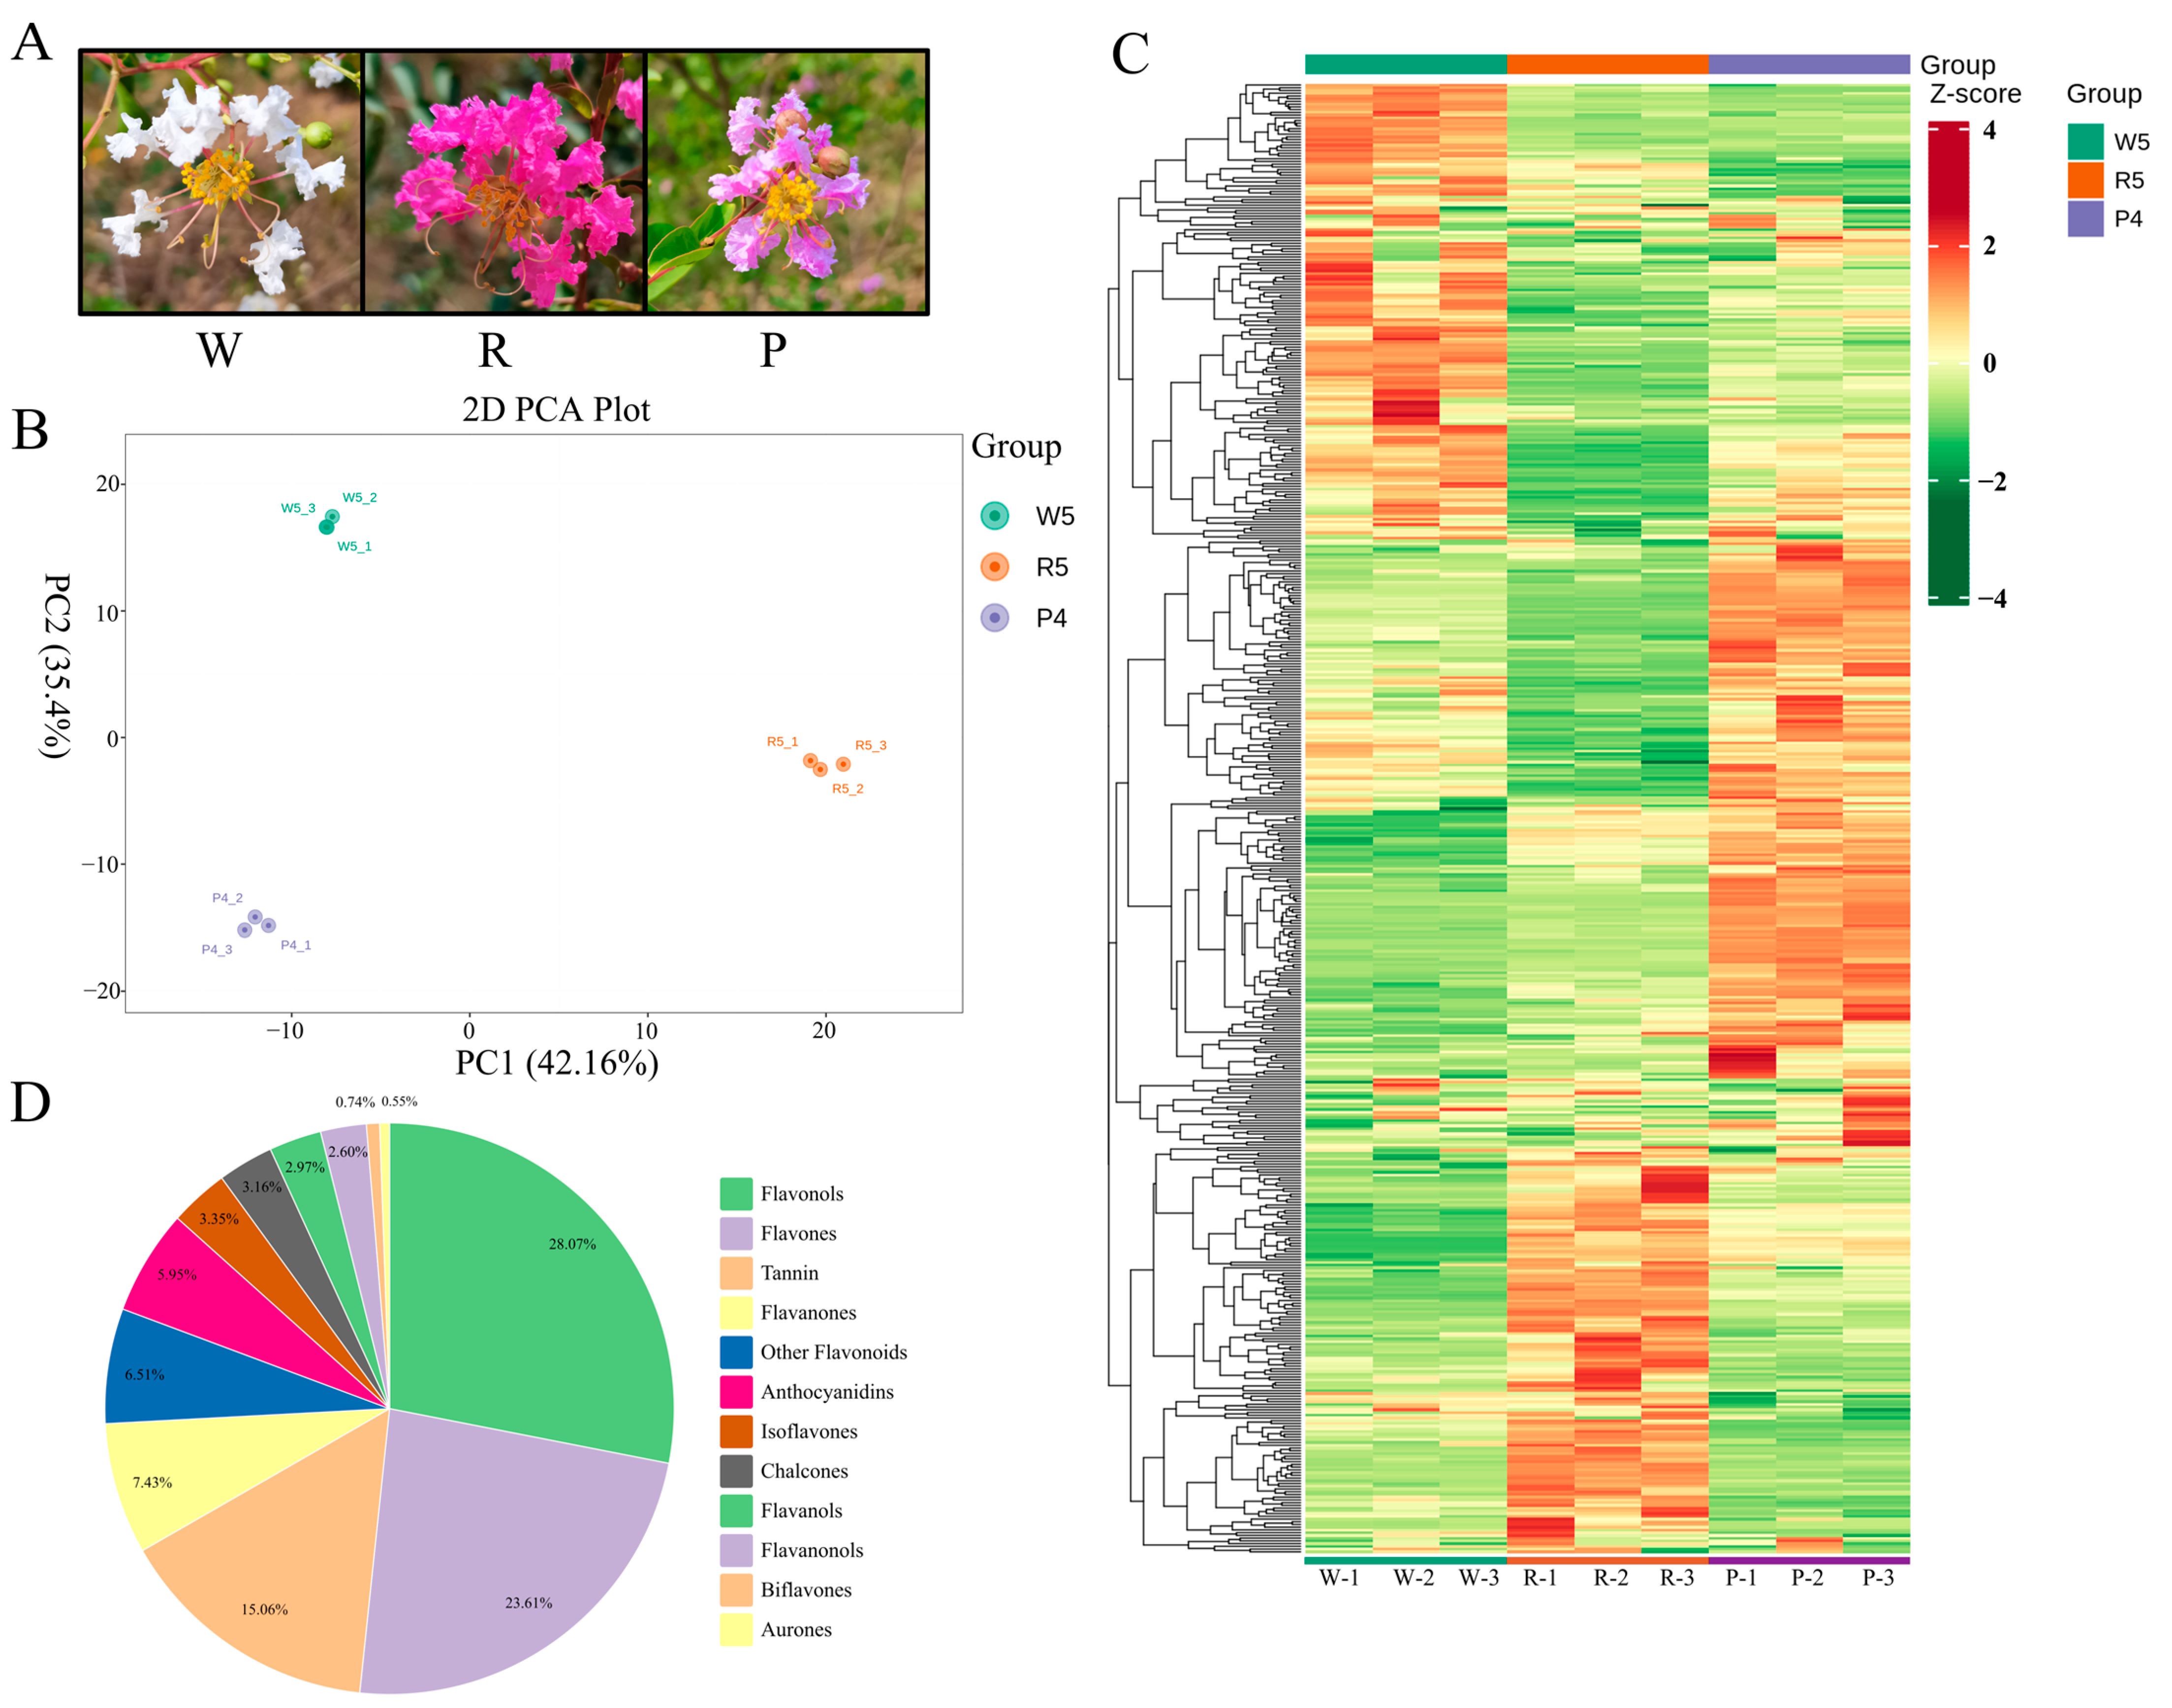
Figure 1. Metabolite analysis. (A) Lagerstroemia indica has three colors of petals (white, red, and purple); (B) two-dimensional PCA results of three different colors of crape myrtle samples; (C) cluster heatmap of all metabolite contents (clustering of metabolites and samples); (D) comprehensive analysis of flavonoid metabolite components.
Horticulturae 10 01229 g001
Figure 2. Differential metabolite analysis. (A) Analysis of differential flavonoids in the R vs. W, P vs. W, and P vs. R groups; (B) analysis of differential anthocyanin metabolites in the R vs. W, P vs. W, and P vs. R groups; (C) thermogram of upregulated anthocyanin metabolites in R vs. W and P vs. W.
Horticulturae 10 01229 g002
Figure 3. Transcriptome analysis. (A) Analysis of significantly different genes in the R vs. P, W vs. P, and W vs. R groups; (B) GO annotation enrichment analysis; (C) KEGG annotation enrichment analysis.
Horticulturae 10 01229 g003
Figure 4. Analysis of DEGs, transcription factors, and plant hormone genes. (A) Screening of DEGs for anthocyanin synthesis pathways; (B) screening of differentially expressed transcription factors in W, R, and P; (C) screening of plant hormone-related DEGs.
Horticulturae 10 01229 g004
Figure 5. Anthocyanin synthesis pathway.
Horticulturae 10 01229 g005
Figure 6. qRT-PCR validation of gene expression level in the transcriptome. Data are shown as mean ± standard deviation of three biological replicates. Different letters indicate significant differences among three species of Lagerstroemia indica in qRT-PCR validation (p < 0.05).
Horticulturae 10 01229 g006
Figure 7. Correlation analysis between 42 anthocyanin-related genes and 22 anthocyanin metabolites (the circle size represents the correlation coefficient, and the color range in the bar chart from red to green displays the correlation coefficient of the color gradient, ranging from 1 to −0.7).
Horticulturae 10 01229 g007
Figure 8. Correlation analysis between MYBs and bHLHs and 42 anthocyanin-related genes (the circle size represents the correlation coefficient, and the color range in the bar chart from red to green displays the correlation coefficient of the color gradient, ranging from 1 to −0.7).
Horticulturae 10 01229 g008
Figure 9. Correlation analysis between MYBs and bHLHs and 22 anthocyanin metabolites (the circle size represents the correlation coefficient, and the color range in the bar chart from red to green displays the correlation coefficient of the color gradient, ranging from 1 to −0.57).
Horticulturae 10 01229 g009
Figure 10. Correlation analysis between plant auxin-related genes and 42 anthocyanin synthesis-related genes (the circle size represents the correlation coefficient, and the color range in the bar chart from red to green displays the correlation coefficient of the color gradient, ranging from 1 to −0.99).
Horticulturae 10 01229 g010
Figure 11. Correlation analysis between plant auxin-related genes and 22 anthocyanin metabolites (the circle size represents the correlation coefficient, and the color range in the bar chart from red to green displays the correlation coefficient of the color gradient, ranging from 1 to −0.99).
Horticulturae 10 01229 g011
Disclaimer/Publisher’s Note: The statements, opinions and data contained in all publications are solely those of the individual author(s) and contributor(s) and not of MDPI and/or the editor(s). MDPI and/or the editor(s) disclaim responsibility for any injury to people or property resulting from any ideas, methods, instructions or products referred to in the content.