Abstract
Changes in physicochemical parameters, fruit softening enzymes and cell wall polysaccharides at four different maturation stages were investigated in two jackfruit genotypes (‘Accession 242’, ‘Accession 341’). For the first three maturity stages, fruit were harvested at 90, 110, and 130 days after flowering (Stage I, II and III, respectively), while Stage IV was determined based on the presence of a dull hollow tapping sound. The fruit edible portion and seed percentage increased, whilst the core and rag percentage decreased with advancement in fruit maturation and ripening. The fruit harvested at Stage IV had comparatively higher soluble solids content (SSC), ascorbic acid and flavonoids, along with lower titratable acidity (TA) and phenolics, than other maturity stages. Bulb firmness was higher at Stage I in both genotypes, along with higher total pectin, protopectin and cellulose compared to other maturity stages. The activity of cell wall hydrolases was higher during later maturity stages. Fruit harvested at Stage IV had higher edible portions, carotenoids, flavonoids and SSC, as well as better colour attributes, while those harvested at Stage I exhibited higher phenolics, TA, pectin and cellulose. These findings could serve as a baseline for future research related to the intended use and maturity standardisation of jackfruit.
1. Introduction
The maturity stage of fruit at harvest is one of the key preharvest factors affecting ripening, quality, and postharvest life [1]. During fruit development, the process of fruit maturation commences once fruit growth ceases, leading to fruit ripening [2]. Fruit maturation involves a series of well-coordinated physiological and biochemical processes that lead to changes in fruit size, colour, acidity and sugar content [3]. Different stages of fruit maturation are marked by the selective accumulation and breakdown of bioactive compounds, including a rise in soluble solids content (SSC) and a decline in organic acids [4]. Following maturity, fruit ripening is an irreversible and genetically programmed process that is comprised of a series of organoleptic and biochemical changes, resulting in the development of soft, palatable fruit suitable for consumption [5]. These processes are concurrent with an increased rate of ethylene production and respiration, along with changes in other functional compounds such as phenolics, carotenoids and aroma volatiles, which determine final sensory and nutraceutical properties of a climacteric fruit [1,5]. Alongside these changes, fruit softening is essential for achieving optimal eating quality during fruit maturation and ripening. Textural changes occur due to the solubilisation, de-esterification and de-polymerisation of cell wall polysaccharides via the action of various fruit softening enzymes [6]. The process of fruit softening varies among fruit crops [7], where examining the mechanism behind fruit softening in different fruits is commercially significant as this can directly influence the storage life and quality of fruit [5]. Following ripening, fruit senescence is an inevitable, irreversible and degenerative process that results in aging and eventual cell death. Once fruit senescence initiates and progresses, any loss in structural integrity deteriorates fruit quality, increases postharvest losses, and reduces the market appeal of fruit [8].
Jackfruit (Artocarpus heterophyllus Lam.) is harvested at different fruit maturity stages, depending upon its potential usage [9]. As a climacteric fruit, the maturity stage at harvest of jackfruit is a key factor impacting fruit ripening, quality and storage life [10]. Harvesting jackfruit at the optimum maturity stage is crucial, as fruit quality cannot be enhanced after fruit harvest, but can only be maintained by delaying senescence or deterioration [11]. The determination of morphological and biochemical attributes during fruit maturation and ripening has practical applications in designing equipment for handling, transportation, storage and processing of jackfruit [12]. Assessing these changes at different maturation stages could also help in determining the ideal maturity stage for the use of fruit in different products [13]. Previous research has been conducted on the effects of fruit maturity stage on the physicochemical characteristics of jackfruit in Bangladesh [14], India [15] and Sri Lanka [13]. Further to this, Ong et al. [16] observed significant changes in SSC, pH, sugars and volatile compounds over a six-day ripening period of jackfruit in Malaysia. The significant effect of the fruit maturity stage (12 to 15 weeks after flowering) on the sugars, organic acids and antioxidant content of ripe jackfruit has been reported in Malaysia by Mijin et al. [8]. However, there is a paucity of scientific research on changes in cell wall polysaccharides and activities of cell wall-degrading enzymes in jackfruit harvested at different maturity stages. Maturity time and indices differ among cultivars and vary with the climatic conditions of a growing region [17]. To the best of our knowledge, the effects of fruit maturation and ripening on changes in morphological and biochemical parameters, along with activities of fruit softening enzymes and cell wall components in jackfruit grown in Australia, have not yet been investigated. Therefore, this study aims to investigate changes in physical attributes, activities of fruit softening enzymes, cell wall polysaccharides and fruit quality during the maturation and ripening of two jackfruit genotypes.
2. Materials and Methods
2.1. Chemicals and Fruit Source
Chemicals required for biochemical and enzymatic analyses were procured from Merck Pty. Ltd., Macquarie Park (2113), New South Wales. Two independent experiments were conducted to assess changes in the physical and chemical parameters of jackfruit, in addition to activities of fruit softening enzymes and cell wall polysaccharides during maturation and ripening of fruit of ‘Accession 242’ and ‘Accession 341’. Jackfruit trees of both genotypes were grown at Coastal Plains Research Farm (12°35′47.76″ S and 131°18′23.04″ E), Middle Point, Northern Territory (NT) with average annual rainfall of 118.6 mm and temperature of 27.6 °C [18] (Figure 1). All trees were provided with uniform cultivation practices in terms of irrigation, fertilisation and plant protection measures. After harvesting, fruit were transported to the postharvest laboratory, Berrimah farm, Department of Agriculture and Fisheries, NT, within one hour.
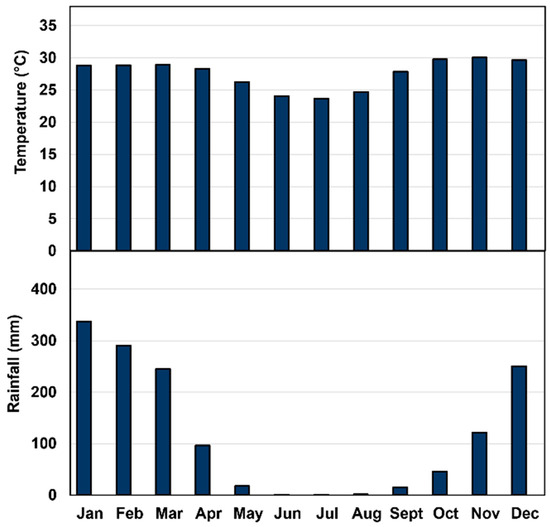
Figure 1.
Average monthly temperature and rainfall at Coastal Plains Research Farm, NT [18].
Healthy jackfruit trees of ‘Accession 242’ and ‘Accession 341’, planted at 1.5 m plant-to-plant and 3 m row-to-row distance, were used for this experiment. Since jackfruit trees flower continuously over a span of several months, inflorescences were tagged at the flowering stage to determine the time elapsed before harvest. For ‘Accession 242’, fruit were harvested at 90, 110, 130 and 153 days after flowering (DAF) (Stages I, II, III and IV, respectively). For ‘Accession 341’ the fruit for Stages I, II and III were harvested at 20 d intervals starting from 90 DAF, whilst fruit for the last stage were harvested at 142 DAF based on traditional maturity indicators (Table 1). Stage I was selected based on analysis of previous literature on jackfruit maturity [14,19]. Since the dull hollow tapping sound is considered to be the most reliable indicator of physiological maturity in jackfruit [20], fruit for Stage IV were harvested based on the presence of a dull hollow tapping sound (Table 1). The tapping sound was determined following the procedure given by Saha et al. [14]. Each fruit was tapped prior to harvest, and the tapping sound was assessed using the hedonic scale (1 to 4), where 1: absence of hollow sound; 2: slightly sensible sound; 3: moderately sensible sound; and 4: distinctly sensible sound. Along with recording changes in tapping sound, a decrease in spine density and an increase in spine flatness were also recorded across four maturity stages (Table 1). The spine number on a unit area basis on the lateral sides and bottom of the fruit were computed, after which the average was calculated to determine spine density. Spine flatness was recorded at the same points by measuring the distance between ten spines on the fruit surface, whereby the average was calculated to determine final spine flatness, expressed in centimetres. Fruit could not be harvested beyond Stage IV as at advanced maturity stages the fruit demonstrated a significant decline in quality, making them unsuitable for harvest and quality analyses. Following harvest, fruit were allowed to ripen at 25 ± 1 °C until the development of a fruit aroma and softening of the pericarp [21]. After analysis of fruit physical characteristics, SSC and titratable acidity (TA), the fruit pulp from 20 bulbs per replication (300–400 g) was cryopreserved before being stored at −20 °C for analysis of biochemical parameters, cell wall-degrading enzymes and cell wall polysaccharides. The experiment was conducted in a completely randomised design (CRD) with the maturity stage as a factor and included three replications for each maturity stage.

Table 1.
Spine density, spine flatness and tapping sound in fruit of jackfruit ‘Accession 242’ and ‘Accession 341’ at different maturity stages.
2.2. Physical Characteristics of Fruit, Seeds, and Bulbs
Fruit length and breadth were determined at the central point of the fruit using a measuring tape. The length and breadth of ten bulbs and seeds per replication were measured using a metric ruler, after which the average was calculated. The weight of fruit, seeds and bulbs were recorded using a precision weighing balance (FG-60 series, A & D weighing Ltd. Thebarton, South Australia and DS-673, Wedderburn, Australia).
2.3. Edible Portion, and Proportion of Core, Peel, Rag, Seed
Fruit were cut along the transverse section to separate pulp, seeds, core, rag and peel. Each part was weighed, after which the proportion of each section was calculated with respect to total fruit weight. The fruit edible portion was determined using the following equation:
2.4. Bulb Colour
The colour was determined on both sides of bulbs as L*, a* and b* colour coordinates using a Minolta chroma meter 300 (CR-300, Konica Minolta Camera Co., Ramsey, New Jersey). L* represents the lightness coordinate, ranging from 0–100 with 0 indicating the complete dark (black) and 100 showing complete light (white). The a* value represents the red-green axis, where the positive value indicates redness, and negative values show greenness. The b* values correspond to the yellow–blue axis, with positive values indicating yellowness and negative values representing blueness. Hue angle (h°) and chroma (C*) were quantified using chromaticity values a* and b* as:
2.5. Soluble Solids Content, Titratable Acidity, SSC: TA
Fruit juice of 10 jackfruit bulbs per replication was extracted and then filtered through muslin cloth, after which the pooled juice from three replications was used to calculate SSC and TA. SSC was determined using a digital refractometer (Atago Co., Ltd., Tokyo, Japan) while TA was calculated by titration of 5 mL fruit juice with 0.1 N NaOH solution. TA was expressed as % citric acid and % malic acid. The SSC: TA ratio was computed by dividing SSC values by their respective TA values.
2.6. Ascorbic Acid, Total Carotenoids, Phenolics, Flavonoids and DPPH Radical Scavenging Activity
Ascorbic acid (AsA) content was examined following the method detailed by Vithana et al. [22], with slight amendments. In brief, a 5 g pulp was extracted in 20 mL of metaphosphoric acid solution (6%) containing ethylenediaminetetraacetic acid (0.18%), followed by centrifugation at 5000× g under refrigerated conditions (4 °C) for 20 min (Eppendorf 5810 R, Hamburg, Germany). Absorbance of the chemical mixture comprising 200 µL supernatant, Folin–Ciocalteu (FC) regent (200 µL), 3% metaphosphoric acid (200 µL) and 1400 µL distilled water was recorded at 760 nm using a UV/VIS spectrophotometer (UV-1280, Kyoto, Japan), whereby total AsA content was quantified as mg kg−1 on a fresh weight (FW) basis using L-ascorbic acid as standard. Total carotenoid content (TCC) was determined using the method detailed previously by Guo et al. [23]. The jackfruit pulp sample (1 g) was extracted in acetone (5 mL), followed by incubation under dark conditions (3 h). The absorbance of the supernatant and 80% acetone (1 mL each) was recorded at 470, 645 and 663 nm, whereby TCC was quantified on a mg kg−1 FW basis. Total phenolics content (TPC) was recorded using FC reagent following the method detailed by Ainsworth and Gillespie [24], where TPC was quantified on a mg kg−1 gallic acid equivalent (GAE) FW basis using gallic acid as standard. TFC was measured following the colorimetric method detailed previously by Chang et al. [25] and was quantified on a mg kg−1 quercetin equivalent (QE) FW basis. DPPH radical scavenging assay was employed to determine the total antioxidant activity of samples following the procedure detailed by Shah et al. [26], where DPPH activity was expressed in %.
2.7. Bulb Firmness and Fruit Softening Enzymes
Bulb firmness was recorded using a texture analyser (TA.XT-plus, Stable Micro Systems, Godalming, UK) fitted with a 5 kg load cell. Jackfruit bulbs were punctured on both sides to a depth of 5 mm at a speed of 2.00 mm s−1 using a P/10 cylindrical probe. Bulb firmness was calculated as maximum force and expressed in Newton (N).
For the extraction of polygalacturonase (PG), cellulase (Cx) and pectate lyase (PL), the procedure detailed by Deng et al. [27] was followed with a few modifications. The fruit sample (2 g) was extracted in sodium acetate (50 mmol L−1, pH 5.5) and sodium chloride (0.2 mol L−1) solution. For PG determination, 100 μL enzyme extract, 500 μL sodium acetate buffer (0.2 M, pH 4.5) and 400 μL citrus pectin (1%) were mixed and incubated at 37 °C for 1 h. Following this, 3,5-dinitrosalicylic acid (DNS) (1%) was added and the reaction mixture was kept in boiling water for 5 min. The absorbance was recorded at 540 nm, where PG activity was quantified as mmol kg−1 s−1 on a protein basis. For the Cx assay, the enzyme extract (100 μL) was mixed with 0.1 M sodium acetate buffer (500 μL) and 1% carboxymethyl cellulose (400 μL). The chemical mixture was incubated at 37 °C (1 h) and 1% DNS (1 mL) was added, followed by heating of the reaction mixture at 100 °C for 5 min. The Cx activity was assayed by noting the absorbance at 540 nm and expressed as mmol kg−1 s−1 on a protein basis. The PL assay mixture consisted of enzyme extract (300 μL), 0.05 M Tris-HCl buffer (500 μL), 4 mM calcium chloride (300 μL) and 1.9 mL distilled water. The chemical mixture was incubated at a temperature of 37 °C (30 min), followed by heating at 100 °C (2 min). The absorbance was noted at 232 nm and PL activity was quantified as mmol kg−1 s−1 on a protein basis. Enzymatic activity of PME was assayed following the protocol detailed by Cao et al. [28] and was quantified as mmol kg−1 s−1 on a protein basis. The protein content in each replicate was quantified following the procedure detailed by Bradford [29].
2.8. Cell Wall Polysaccharides
Pectin was determined following the procedure detailed by Shah et al. [30]. In brief, freeze-dried fruit samples (2 g) were heated twice in hot ethanol (20 mL) for 10 min followed by overnight placement of the dried residue in dimethyl sulfoxide: water solution (9:1 v/v). The sediment was then washed with acetone until complete whitening, followed by incubation of the pellets at 35 °C for 24 h. The obtained residue was designated as an alcohol-insoluble solid (AIS). The AIS (20 mg) was mixed with sulphuric acid (2 mL) and the total solution volume was made to 25 mL by addition of distilled water, whereby the obtained solution was collected as total pectin (TP). For water-soluble pectin (WSP) determination, 80 g of AIS was mixed with distilled water and then centrifuged (10,000× g, 10 min, 4 °C). The collected supernatant was designated as WSP. Chelate soluble pectin (CSP) and sodium carbonate (Na2CO3) soluble pectin (NSP) were calculated following the protocol detailed by Deng et al. [27], with some changes. The sediment from the WSP was suspended in sodium acetate buffer solution (50 mM) containing cyclohexane-1,2-diaminetetraacetic acid (CDTA), heated at 100 °C (20 min) and centrifuged at 10,000× g (10 min, 4 °C), whereby the supernatant was used for determination of CSP. For determination of NSP, AIS was resuspended in a 10 mL solution containing Na2CO3 (50 mM) and 2 M CDTA. This was followed by keeping the mixture in boiling water (100 °C) for 20 min, and centrifugation (10,000× g, 10 min, 4 °C). The collected supernatant was designated as NSP. The respective supernatants were used for the calculation of TP, WSP, CSP and NSP using 3-phenylphenol as an indicator [30] and were quantified as mg kg−1 on a dry weight basis using the galacturonic acid standard curve. Protopectin was quantified by subtracting the sum of WSP, NSP and CSP from TP.
For determining cellulose (CEL) content, a fruit pulp sample (1 g) was mixed with 10 mL sulphuric acid (1.25%) followed by heating at 100 °C for 30 min. The pellets were washed twice with water and 80% acetone, and then dried at 50 °C to a constant weight, and CEL was expressed as mg kg−1 FW basis [31].
2.9. Statistical Analysis
Data for both experiments were analysed independently by one−way analysis of variance using STATISTIX 8.1® software. For evaluating the significant differences among different maturity stages, Fisher’s least significant difference test (LSD) was employed. Principal component analysis (PCA) was conducted independently for both genotypes in order to assess the relationship among studied parameters at different fruit maturity stages using the R programme (R Studio 4.3.3).
3. Results
3.1. Physical Characteristics of Fruit, Seeds, and Bulbs
Fruit size (weight, length and breadth) increased with the progression of fruit maturation and ripening in both genotypes. Fruit weight (8.89 ± 0.34 kg, 9.24 ± 0.33 kg), length (40.30 ± 1.94 cm, 39.00 ± 0.58 cm) and breadth (24.93 ± 0.88 cm, 26.00 ± 0.06 cm) were significantly higher in Stage IV as compared to other maturity stages in ‘Accession 242’ and ‘Accession 341’, respectively (Figure 2, Figure 3 and Figure 4).
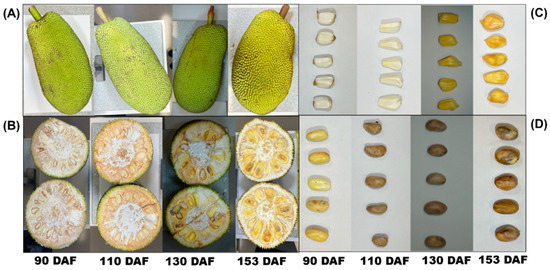
Figure 2.
Changes in size and colour of fruit (A) bulb (B) transverse section of fruit (C) and seeds (D) during fruit maturation and ripening of jackfruit ‘Accession 242’.
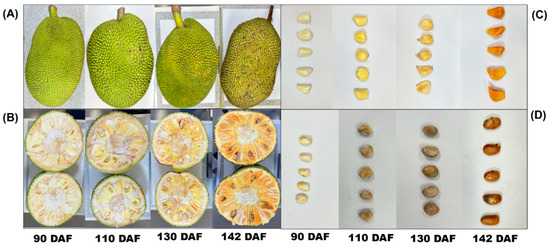
Figure 3.
Changes in size and colour of fruit (A) bulb (B) transverse section of fruit (C) and seeds (D) during fruit maturation and ripening of jackfruit ‘Accession 341’.
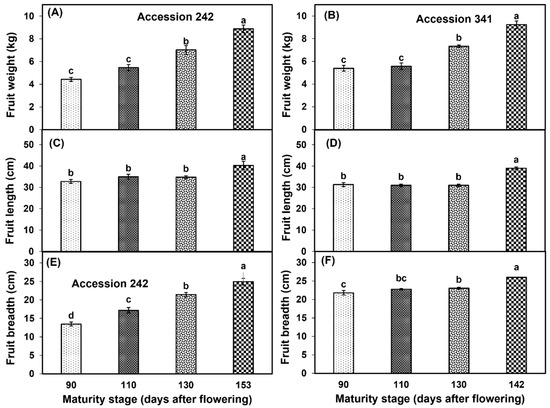
Figure 4.
Changes in fruit weight (A,B), fruit length (C,D) and fruit breadth (E,F) during fruit maturation and ripening of jackfruit ‘Accession 242’ and ‘Accession 341’. Vertical bars show the standard deviation of means (n = 3). Means with the same letters represent non−significant differences by LSD test (p > 0.05).
There was an increase in bulb weight with the progression of fruit maturity and ripening. Bulb weight was significantly higher at Stage IV as compared to other stages in ‘Accession 242’ (Figure 5A). In ‘Accession 341’, bulb weight increased with the progression of maturity and ripening of jackfruit. However, there were non−significant differences in bulb weight at Stages II, III and IV (Figure 2 and Figure 5B). In ‘Accession 242’, significantly higher bulb length was recorded in Stage IV, which was statistically comparable with bulb length at Stage III (Figure 5C), while non−significant differences were observed for bulb length during fruit maturation and ripening in ‘Accession 341’ (Figure 3 and Figure 5D). Bulb breadth was significantly higher at Stage IV as compared to all other stages in ‘Accession 242’ (Figure 5E). However, in ‘Accession 341’, there were non−significant differences for bulb breadth among all maturity stages (Figure 5F).
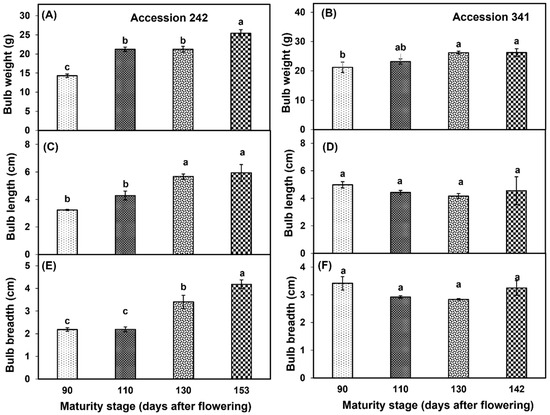
Figure 5.
Changes in bulb weight (A,B), bulb length (C,D) and bulb breadth (E,F) during fruit maturation and ripening of jackfruit ‘Accession 242’ and ‘Accession 341’. Vertical bars show the standard deviation of means (n = 3). Means with the same letters represent non−significant differences by LSD test (p > 0.05).
Seed weight increased with progression of maturity and ripening of jackfruit, with a significantly higher seed weight in fruit harvested at Stage IV as compared to other stages in both genotypes (Figure 6A,B). At all maturity stages, non−significant differences were observed for seed length in ‘Accession 242’ (Figure 2 and Figure 6C), whereas in ‘Accession 341’, fruit harvested at Stage IV exhibited significantly higher seed length than other maturity stages (Figure 2 and Figure 6D). In both genotypes, seed breadth was relatively higher at Stage IV as compared to other stages (Figure 6E,F).
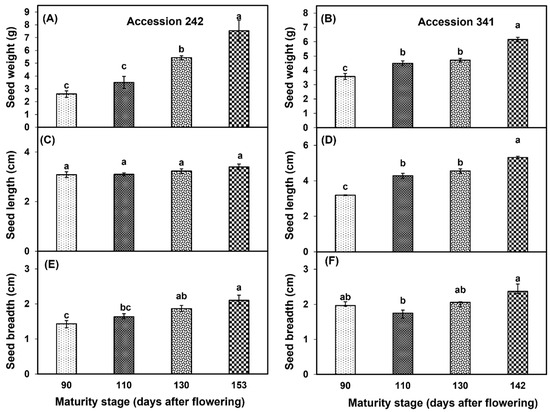
Figure 6.
Changes in seed weight (A,B), seed length (C,D) and seed breadth (E,F) with fruit maturation and ripening of jackfruit ‘Accession 242’ and ‘Accession 341’. Vertical bars show the standard deviation of means (n = 3). Means with the same letters represent non−significant differences by LSD test (p > 0.05). Seed weight, length and breadth were recorded on 10 seeds per replication and then averaged for each replication (n = 3).
3.2. Edible Portion, and Proportion of Core, Peel, Rag, Seed
A continuous increase in the edible portion was observed with the progression of fruit maturity and ripening in the fruit of both genotypes. In ‘Accession 242’, a significantly higher edible portion was observed in fruit harvested at Stage IV (Figure 7A). In ‘Accession 341’, the edible portion was significantly higher in fruit harvested at Stage IV than for all other maturity stages except Stage III (Figure 7B). In ‘Accession 242’, rag percentage exhibited a substantial decline after Stage II, with a significantly lower rag percentage in fruit harvested at Stage IV as compared to Stages I and II (Figure 7C). In ‘Accession 341’, rag percentage exhibited a steady decline over the four maturity stages. The fruit harvested at Stage IV exhibited a significantly lower rag percentage than at Stage I. However, non−significant differences were observed for rag percentage among the fruit harvested at Stages II, III and IV (Figure 7D). In ‘Accession 242’, the core percentage exhibited a fluctuating trend with decline at Stage II, followed by increase at Stage III and then final reduction at Stage IV. A significantly lower core percentage was observed in ripe fruit harvested at Stage IV as compared to other maturity stages (Figure 7E). Conversely, there was no significant effect of fruit maturation and ripening on core percentage in ‘Accession 341’ (Figure 7F). In ‘Accession 242’, peel percentage increased with progression of maturity and ripening, with significantly higher peel percentage in Stage IV as compared to all other maturity stages except Stage III (Figure 7G). On the contrary, in ‘Accession 341’ there was a decrease in the peel percentage with the progression of fruit maturity and ripening, with no significant differences among fruit maturity stages (Figure 7H). Seed percentage increased with the progression of fruit maturation and ripening in both genotypes. In ‘Accession 242’, a significantly lower seed percentage was recorded at Stage I (Figure 7I). However, fruit maturation and ripening exhibited non−significant differences for seed percentage in ‘Accession 341’ (Figure 7J).
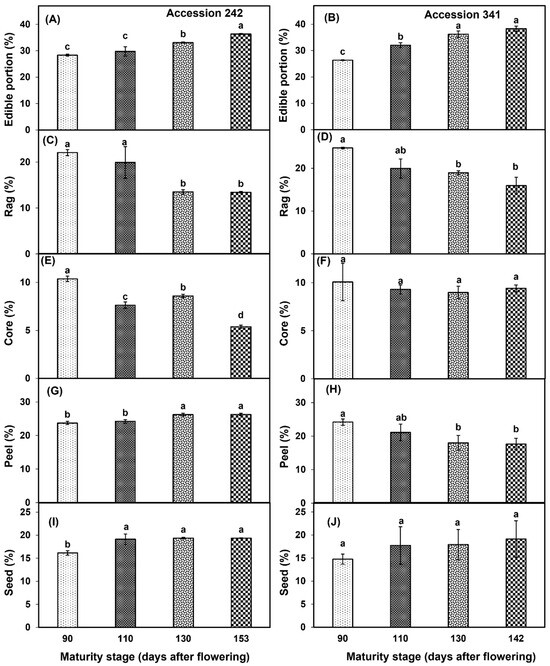
Figure 7.
Changes in edible portion (A,B), rag percentage (C,D), core percentage (E,F), peel percentage (G,H) and seed percentage (I,J) during fruit maturation and ripening of jackfruit ‘Accession 242’ and ‘Accession 341’. Vertical bars show the standard deviation of means (n = 3). Means with the same letters represent non−significant differences by LSD test (p > 0.05).
3.3. Bulb Colour
In both genotypes, bulb L* values declined with the progression of fruit maturity and ripening (Figure 8A,B). The fruit harvested at Stage IV had significantly lower bulb L* as compared to all other maturity stages in both ‘Accession 242’ and ‘Accession 341’ (Figure 8A,B). There was a progressive increase in bulb a* values in ‘Accession 242’ with a significantly higher value at Stage IV as compared to Stage I (Figure 8C). In ‘Accession 341’, a* value substantially increased with the progression of maturity and ripening of jackfruit. The fruit harvested at Stage IV had a significantly higher bulb a* value as compared to other maturity stages (Figure 8D). In ‘Accession 242’, fruit harvested at Stage IV had a significantly higher bulb b* value as compared to other maturity stages (Figure 8E). However, the fruit maturation and ripening did not exhibit a significant effect on the b* chromaticity value in the bulbs of ‘Accession 341’ (Figure 8F). C* values of bulbs increased with the progression of maturity and ripening in both genotypes. In ‘Accession 242’, significantly higher bulb C* values were recorded at Stage IV as compared to all other maturity stages (Figure 8G), while in ‘Accession 341’, fruit maturation and ripening did not have a significant effect on bulb C* value (Figure 8H). h° decreased with the progression of fruit maturation and ripening in both genotypes. In ‘Accession 242’, the fruit harvested at Stage IV had significantly lower bulb h° as compared to other maturity stages except Stage III. (Figure 8I). Similar results were observed in ‘Accession 341’, where fruit harvested at Stage IV had significantly lower bulb h° values as compared to all other maturity stages (Figure 8J).
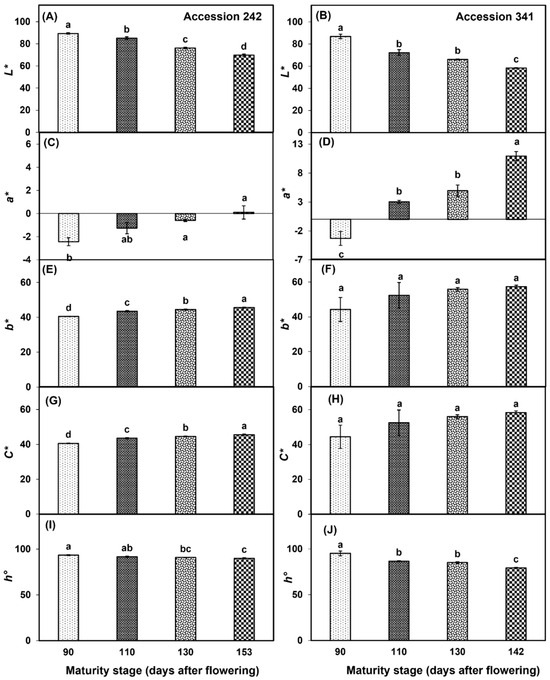
Figure 8.
Changes in bulb chromaticity values L* (A,B), a* (C,D), b* (E,F), C* (G,H), and h° (I,J) during maturation and ripening of jackfruit ‘Accession 242’ and ‘Accession 341’. Vertical bars show the standard deviation of means (n = 3). Means with the same letters represent non-significant differences by LSD test (p > 0.05). Bulb colour was recorded on three bulbs per replication and then the average was calculated for each replication (n = 3). L* = lightness; a* = ranging from green [-] to red [+]; b* = ranging from blue [-] to yellow [+]; C* = chroma; h° = hue angle.
3.4. Soluble Solids Content, Titratable Acidity, SSC: TA
A marked increase in SSC was observed with the progression of fruit maturation and ripening in both genotypes. SSC recorded in the bulbs of ‘Accession 242’ and ‘Accession 341’ at Stage IV was more than half of the SSC at maturity Stage I (Figure 9A,B). Fruit maturation and ripening had a significant effect on TA in both genotypes. In ‘Accession 242’, significantly lower TA content was observed in bulbs of the fruit harvested at Stage IV as compared to Stage I (Figure 9C,E). In ‘Accession 341’, significantly lower TA content was recorded in the bulbs of the fruit harvested at Stage IV as compared to all other stages except Stage III (Figure 9D,F). Fruit maturation and ripening had a significant impact on the SSC: TA ratio in both genotypes. The SSC: TA ratio of bulbs was significantly higher at Stage IV (83.50 ± 9.63, and 123.20 ± 4.33 in ‘Accession 242’ and ‘Accession 341’, respectively) as compared to other maturity stages (Figure 9G,H).
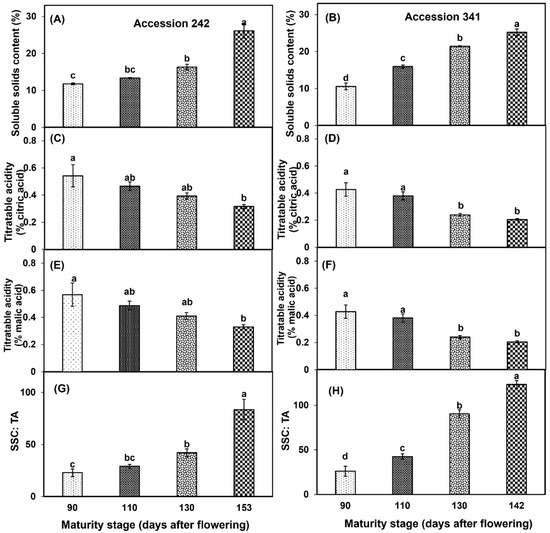
Figure 9.
Changes in soluble solids content (A,B), titratable acidity (C–F) and SCC: TA (G,H) during fruit maturation and ripening of jackfruit ‘Accession 242’ and ‘Accession 341’. Vertical bars show the standard deviation of means (n = 3). Means with the same letters represent non-significant differences by LSD test (p > 0.05).
3.5. Ascorbic Acid, Total Carotenoids, Phenolics, Flavonoids, DPPH Radical Scavenging Activity
AsA levels increased in the bulbs of both genotypes with the progression of fruit maturation and ripening. In ‘Accession 242’, AsA content was significantly higher in the bulbs of fruit harvested at Stage IV (26.44% higher than Stage I) as compared to all other maturity stages (Figure 10A). Similar results were observed in ‘Accession 341’, where AsA content was significantly higher at Stage IV as compared to all other stages except Stage III (Figure 10B). TCC increased in the bulbs of both genotypes with the increase in fruit maturity and ripening. In ‘Accession 242’, fruit harvested at Stage IV had significantly higher TCC, which was statistically comparable with TCC at Stage III (Figure 10C). In ‘Accession 341’, the fruit harvested at Stage IV had significantly higher TCC as compared to all other fruit maturity stages (Figure 10D). Fruit maturation and ripening had a significant effect on TPC in the bulbs of both jackfruit genotypes. Fruit harvested at Stage I exhibited significantly higher TPC as compared to Stage IV in both genotypes (Figure 10E,F). TFC increased with the progression of fruit maturation and ripening in ‘Accession 242’. Fruit harvested at Stage IV had significantly higher TFC in the bulbs as compared to all other maturity stages except Stage III (Figure 10G). In ‘Accession 341’, TFC initially increased up to Stage II, followed by a decline of 10.6% at Stage III, and a substantial increase at Stage IV (Figure 10H). TFC did not vary significantly among the first three maturity stages, while fruit harvested at Stage IV had significantly higher TFC than other maturity stages (Figure 10H). Fruit maturation and ripening stage exhibited a significant effect on DPPH radical scavenging activity in the bulbs of both genotypes. In ‘Accession 242’, DPPH radical scavenging activity in jackfruit bulbs declined from maturity Stage I to maturity Stage III, followed by an increase at Stage IV. DPPH radical scavenging activity was significantly higher in Stage IV, which was statistically comparable with Stage I (Figure 10I). In ‘Accession 341’, DPPH radical scavenging activity in jackfruit bulbs declined from Stage I to Stage II followed by an increase up to Stage IV. DPPH scavenging activity was significantly highest in Stage I, which was statistically comparable with Stage IV (Figure 10J).
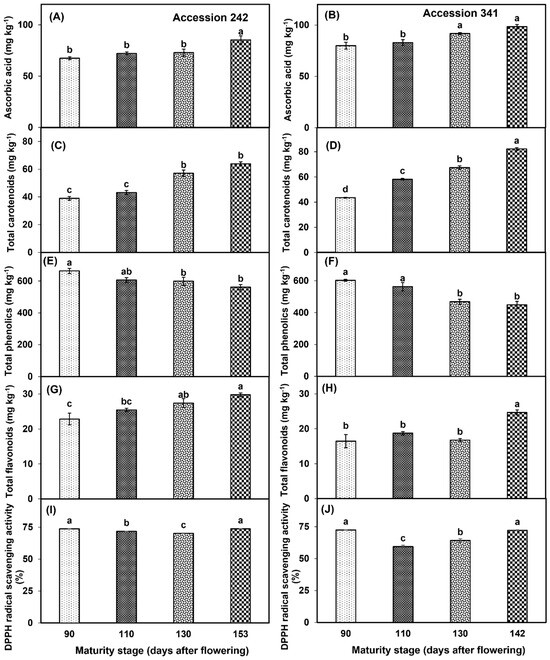
Figure 10.
Changes in the levels of ascorbic acid (A,B), total carotenoids (C,D), total phenolics (E,F), total flavonoids (G,H) and DPPH radical scavenging activity (I,J) during maturation and ripening of jackfruit ‘Accession 242’ and ‘Accession 341’. Vertical bars show the standard deviation of means (n = 3). Means with the same letters represent non−significant differences by LSD test (p > 0.05).
3.6. Bulb Firmness and Fruit Softening Enzymes
Fruit maturation and ripening had a significant effect on bulb firmness of both genotypes (Figure 11A,B). Bulb firmness was significantly higher in the fruit harvested at maturity Stage I with statistically comparable results to Stage II in both genotypes. Significantly lower bulb firmness was recorded in Stage IV as compared to all other maturity stages except Stage III (Figure 11A,B). Fruit maturation and ripening had a significant effect on the enzymatic activity of PG in both genotypes. In ‘Accession 242’, PG activity was significantly higher in the fruit harvested at Stage IV, which was statistically comparable with Stage III (Figure 11C). In ‘Accession 341’, PG activity was significantly higher at Stage IV as compared to all other fruit maturity stages (Figure 11D). PME activity increased with the progression of the fruit maturation and ripening in both genotypes. In ‘Accession 242’ and ‘Accession 341’, the fruit harvested at Stage IV exhibited significantly higher PME activity as compared to other maturity stages (Figure 11E,F). PL activity in the jackfruit bulbs was significantly influenced by the fruit maturation and ripening. In both genotypes, PL activity was significantly higher in the fruit harvested at Stage IV, whilst fruit harvested at Stage I had significantly lower PL activity as compared to all other maturity stages (Figure 11G,H). Cx activity increased with the progression of fruit maturation and ripening in both jackfruit genotypes. Fruit harvested at Stage IV exhibited significantly higher Cx activity as compared to other maturity stages in ‘Accession 242’ (1.67 ± 0.09 mmol kg−1 s−1) and ‘Accession 341’ (1.19 ± 0.03 mmol kg−1 s−1) (Figure 11I,J).
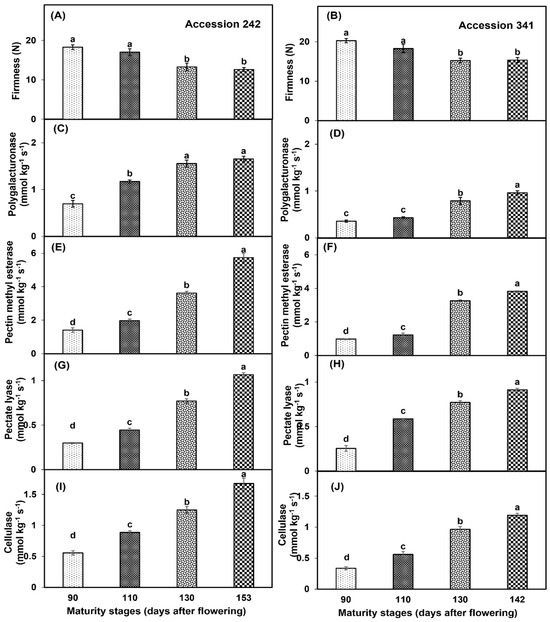
Figure 11.
Changes in bulb firmness (A,B), activities of polygalacturonase (C,D), pectin methyl esterase (E,F), pectate lyase (G,H) and cellulase (I,J) during maturation and ripening of jackfruit ‘Accession 242’ and ‘Accession 341’. Vertical bars show the standard deviation of means (n = 3). Means with the same letters represent non−significant differences by LSD test (p > 0.05). Bulb firmness was recorded on three bulbs per replication and then averaged for each replication (n = 3).
3.7. Cell Wall Polysaccharides
TP decreased with the progression of fruit maturity and ripening in both genotypes. In ‘Accession 242’, and ‘Accession 341’, TP was significantly higher at Stage I, while significantly lower TP was recorded at Stage IV as compared to all other maturity stages (Figure 12A,B). WSP increased with progression of maturity and ripening in both jackfruit genotypes. In ‘Accession 242’ and ‘Accession 341’, significantly higher WSP was recorded at Stage IV while the fruit harvested at Stage I exhibited significantly lower WSP in bulbs as compared to all other stages (Figure 12C,D). NSP was significantly higher at Stage I in bulbs of both genotypes followed by Stage II, whilst significantly lower NSP was recorded at Stage IV in comparison to all other maturity stages (Figure 12E,F). In ‘Accession 242’, CSP was significantly higher in the fruit harvested at Stage I, whilst fruit harvested at Stage III exhibited relatively lower CSP than for all other maturity stages (Figure 12G). In ‘Accession 341’, CSP decreased up to Stage III, followed by a minor increase at Stage IV. Fruit harvested at Stage I exhibited significantly higher CSP as compared to all other maturity stages (Figure 12H). PP decreased in both jackfruit genotypes with the progression of fruit maturity and ripening. In both genotypes, PP was significantly higher in the fruit harvested at Stage I followed by Stage II, whilst fruit harvested at Stage IV exhibited significantly lower PP as compared to other maturity stages (Figure 12I,J). CEL was significantly higher in the fruit harvested at Stage I in both genotypes, while significantly lower CEL was recorded at maturity Stage IV as compared to other harvest maturity stages (Figure 12K,L).
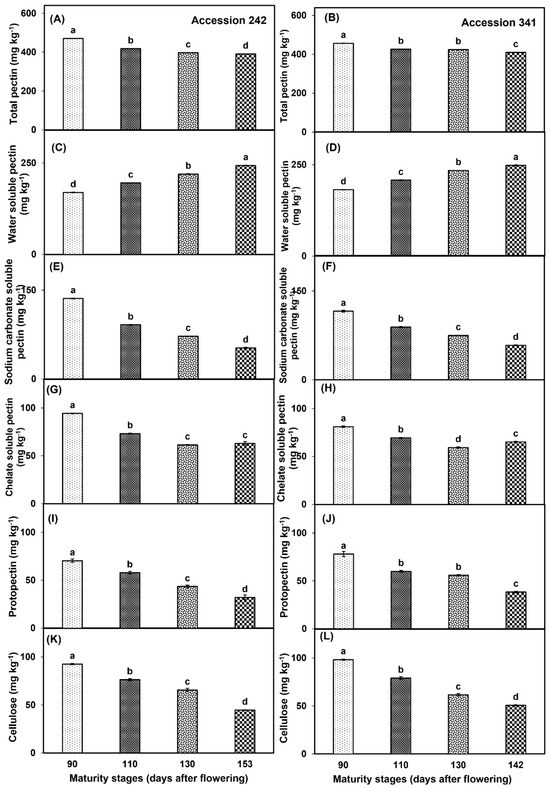
Figure 12.
Changes in the levels of total pectin (A,B), water−soluble pectin (C,D), sodium carbonate soluble pectin (E,F), chelate soluble pectin (G,H), protopectin (I,J) and cellulose (K,L) during maturation and ripening of jackfruit ‘Accession 242’ and ‘Accession 341’. Vertical bars show the standard deviation of means (n = 3). Means with the same letters represent non−significant differences by LSD test (p > 0.05).
3.8. Principal Component Analysis
PCA was conducted separately for textural attributes (firmness, fruit softening enzymes and cell wall polysaccharides) and other fruit physicochemical parameters in both genotypes to clearly understand the relationship between fruit quality attributes at different maturity stages.
In ‘Accession 242’, PCA demonstrated a strong positive correlation between AsA and TFC as well as TFC and DPPH, as revealed by an acute angle between corresponding vectors (Figure 13A). A negative correlation was noted between TPC and TCC (angle between vectors ~180°). There was a strong positive correlation (angle between vectors < 90°) between peel and seed percentage and both parameters were higher at Stage III of maturity. The right angle between vectors showed no correlation between rag and core percentage of fruit. Seed weight was higher in Stage IV of maturity and was highly positively correlated (acute angle between vectors) with seed length. Analysis of firmness-related parameters showed a strong positive correlation among PME, PL, Cx and WSP, where all these parameters were higher in Stage IV (Figure 13B). However, there was no correlation between PME and PG enzymes (right angle between vectors). The angle between vectors approaching 180° showed a negative correlation of PG with TP and CSP. TP, NSP, CSP and firmness were higher at Stage I of maturity and had a strong positive correlation (acute angle between vectors) among each other.
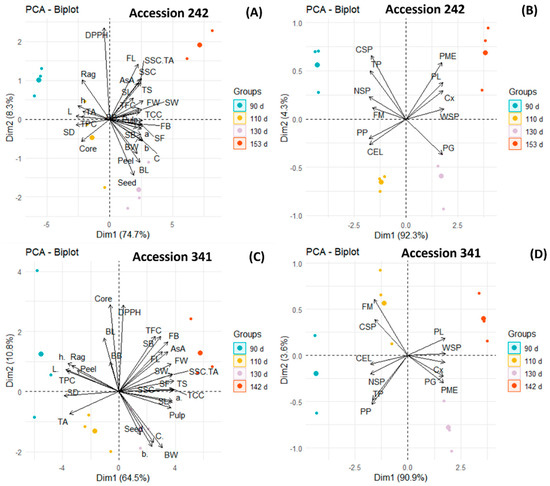
Figure 13.
Principal component biplots displaying the correlation between fruit physical attributes, biochemical parameters, antioxidants, activities of fruit softening enzymes and cell wall polysaccharides in bulbs during different stages of fruit maturation and ripening of jackfruit ‘Accession 242’ (A,B) and ‘Accession 341’ (C,D).
In ‘Accession 341’, the acute angle between vectors revealed a positive relationship between AsA and TCC, as well as fruit length and breadth, where all these parameters were higher at Stage IV of maturity (Figure 13C). DPPH radical scavenging activity exhibited a positive correlation with TFC. However, there was no correlation (angle between vectors ~90°) between TPC and TFC. The angle between vectors approaching 180° displayed a strong negative correlation between rag and pulp percentage. Correlation analysis of softening enzymes revealed a strong positive correlation (vectors with acute angles) among PL, Cx, PME and PG (Figure 13D). All softening enzymes were also positively correlated (angle between vectors < 90°) with WSP. There was a strong positive correlation between bulb firmness and CSP as well as TP and PP. However, CEL was negatively correlated (angle between vectors ~180°) with PL.
4. Discussion
Fruit size is an important physical attribute affecting fruit use, marketability and consumer acceptability [32]. In this study, fruit weight, length and breadth increased with the progression of maturity and ripening in both genotypes of jackfruit (Figure 4). An increase in fruit weight is associated with the natural process of cell division and elongation during fruit maturation and development, which also involves seed maturity and sugar accumulation in fruit pulp [33]. The increase in fruit dimensions during fruit maturity might be due to the increase in the size of individual bulbs (Figure 5) and seeds (Figure 6), which is ascribed to cell division and elongation [34]. The relative proportion of different parts of jackfruit is of considerable economic significance, as these parameters determine the potential use of the fruit for table or processing purposes. Our results show an increase in edible portion and seed percentage, and a decrease in rag and core percentage, with the progression of fruit maturity in ripe fruit of both genotypes (Figure 7). This might be attributed to the higher partitioning of photosynthates towards pulp and seed at advanced maturity stages. Similarly, Saha et al. [14] reported an increase in the edible portion of jackfruit with the increase in maturity from 100 to 130 days after fruit set in Bangladesh. Conversely, Rana et al. [12] observed a decline in the edible portion of jackfruit with the progression of fruit maturity in jackfruit grown in India. However, the number of days from flowering or fruit set was not specified in the latter study. The observed discrepancy in experimental results might be due to differences in genotypes, agronomic practices or climatic conditions of the growing region.
Fruit colour is one of the primary fruit quality indicators that determine the commercial value and consumer acceptability of fruit [33]. There was a gradual decrease in bulb L* values, while a*, b* and C* values increased with the progression of fruit maturation and ripening, indicating darker bulbs in the advanced maturity stages (Figure 8). An increase in a* values from negative in earlier stages to positive in later stages corresponds to the change in bulb colour from greenish to yellow and orange in ‘Accession 242’ and ‘Accession 341’, respectively. It may also be argued here that higher levels of carotenoids could have contributed to increased a* chromaticity values, as PCA displayed a strong positive correlation between TCC and a* in both genotypes (Figure 13). Lower L* values along with higher b* and C* in bulbs of fruit harvested at later maturity stages may also be attributed to the breakdown of chlorophyll and consequently the development of chromoplasts with carotenoids [18]. Lalel et al. [1] explained that the enzymes involved in fruit colour changes may not be fully activated during early maturity stages, resulting in lesser colour development. Previously, Janurianti et al. [35] reported similar results of a decrease in L* and increase in a* chromaticity values with the progression of fruit maturity in strawberry (Fragaria × ananassa Duch.) fruit. Contrary to our findings, they observed a decline in b* values, which might be attributed to differences in pigment synthesis and degradation between strawberry fruit and jackfruit.
SSC and TA are not only the primary components contributing to the sweet and sour taste of fruit, but they also serve as key indicators for assessing fruit maturity and evaluating fruit flavour during extended storage [36]. In both jackfruit genotypes, jackfruit bulbs had higher SSC and lower TA content at later stages of maturity as compared to earlier maturity stages (Figure 9). The higher SSC: TA ratio at Stage IV indicates that the fruit has reached its maximum maturity at this stage. Fruit harvested at earlier maturity stages exhibit reduced enzymatic activity associated with metabolism and the accumulation of soluble sugars, which explains the lower SSC in initial maturity stages [37]. The observed rise in SSC might also be attributed to the degradation of cell wall polysaccharides during ripening, thereby resulting in the release of simple sugars [38]. Previously, Ong et al. [16] hypothesised that the increase in SSC during maturation could be due to the breakdown of water−insoluble pectin to water−soluble forms by the action of fruit softening enzymes. It may also be argued here that higher SSC during later stages of maturity could be due to the conversion of complex carbohydrates, such as starch into simple sugars, and a decrease in organic acid content [13,33]. The decline in TA content in jackfruit during fruit maturation may be due to the consumption of organic acids during respiration and gluconeogenesis [18]. Similar results demonstrating higher SSC and lower TA with the progression of fruit maturity have been reported by Cetin and Saraçoğlu [39] in plum fruit (Prunus domestica L.).
AsA content increased with the progression of fruit maturation and ripening in both genotypes (Figure 10A,B). The production of ethylene during fruit ripening may increase the content of AsA, hence contributing to the observed increase in AsA levels [40]. Mannose and L−galactose serve as substrates for the biosynthesis of AsA in plants, whereby the breakdown of the cell wall during the ripening process may have resulted in the availability of both mannose and L−galactose, which lead to an increase in AsA levels, as postulated previously by Serry [41] in papaya (Carica papaya L.) fruit. TCC was higher at advanced maturity stages as compared to earlier stages in both genotypes (Figure 10C,D). Lower TCC in the initial maturity stages may be due to lower activity of chlorophyllase, resulting in a less noticeable loss of green colour as compared to fruit harvested at later stages of maturity [42]. This may also be due to reduced production and action of ethylene in fruit harvested at the early maturity stage, thus resulting in better colour development in the fruit harvested at advanced maturity stages [37]. Phenolics and flavonoids are secondary metabolites found in plants and can protect plant cells from oxidative damage and improve plant resistance. TPC was declined with the progression of fruit maturation and ripening (Figure 10E,F). It may be argued here that higher levels of phenolic compounds in earlier stages could be due to seed development in younger fruit [43]. Also, TPC decreases with the progression of fruit maturity due to the increased activity of polyphenol oxidase, resulting in the oxidation of polyphenolic compounds in the fruit [44]. Another potential explanation for this phenomenon may be the cessation of production of polyphenols during fruit maturity, resulting in a dilution effect as the fruit grows larger [45]. Nevertheless, Cetin and Saraçoğlu [39] reported higher TPC during advanced fruit maturation and ripening stages in plum fruit. This might be due to the differences in species−specific metabolism, environmental conditions, times of harvest or cultivation practices. TFC in jackfruit increased with the progression of fruit maturation and ripening in ‘Accession 242’, while in ‘Accession 341’, TFC increased by 13.6% in Stage II followed by a decrease at Stage III, and a final increase at Stage IV (Figure 10G,H). This variation could be attributed to differences in the genetic profile, resulting in varied metabolism of flavonoid biosynthesis or degradation in both genotypes. Previously, an increase in TFC during fruit maturity was reported in jackfruit [18], pomegranate (Punica granatum L.) [46] and papaya [47]. However, Zhao et al. [36] reported a decline in TFC with the progression of fruit maturity in winter jujube fruit (Ziziphus jujuba Mill.). In ‘Accession 242’, DPPH radical scavenging activity declined until Stage III, followed by an increase at Stage IV, whereas in ‘Accession 341’, it reduced until Stage II and then increased up to maturity Stage IV (Figure 10I,J). The initial decline in DPPH activity may be associated with lower TPC, while higher TFC at Stage IV could have contributed to an increase in DPPH radical scavenging activity in both genotypes. Principal component biplots also revealed a positive correlation between TFC and DPPH radical scavenging activity, confirming that higher TFC could be responsible for increased antioxidant activity at advanced maturity stages in both genotypes (Figure 13). A similar trend of initial reduction in antioxidant activity followed by an increase has been reported by Joshi et al. [48] in mango fruit (Mangifera indica L.).
Fruit harvested during later maturity stages had lower bulb firmness, and higher activities of cell wall hydrolases and WSP, in addition to lower TP, CSP, NSP, PP and CEL (Figure 11 and Figure 12). As fruit maturation and ripening progress, adhesion among cells declines, while the expansion pressure exerted by water molecules in the vacuole increases, thereby resulting in a decline in fruit firmness [49]. Pectin is an important polysaccharide in the primary cell wall and middle lamella of plant cells [50]. During fruit ripening, pectin polymers undergo significant structural changes which include depolymerisation, solubilisation and de-esterification, resulting in the conversion of insoluble pectin into soluble forms [13]. Degradation of the cell wall during fruit ripening is closely related to increased activities of fruit softening enzymes [51]. Due to the intricate structure of the primary cell wall, it is unlikely for a single enzyme to substantially impact fruit firmness. To bring about noticeable changes in texture, it is necessary for multiple enzymes to work together in a coordinated manner [51]. PME primarily functions by removing methyl groups from pectin, facilitating the transformation of protopectin to water-soluble pectin [28]. This breaks the calcium bonds between uronic acid chains in polysaccharides, resulting in the disintegration of cells. PME also accelerates hydrolytic activity of PG by breaking the 1,4-2-D-galactoside link along the polygalacturonic acid backbone, resulting in the formation of galacturonic acid or galacturonic acid oligomers [28]. PL has pectinolytic activity and catalyses the breakdown of glycosidic bonds between galacturonosyl residues [52]. Pectin breakdown is completed by the combined action of PG, PL and PME, resulting in cell wall degradation and fruit softening. CEL is a complex polysaccharide made up of long chains of D-glucose molecules and is found in cell walls as microfibrils [53]. Cx is a complex enzyme that breaks down the CEL network of the cell wall [54]. A negative correlation between Cx activity and CEL was recorded in both genotypes (Figure 13), showing that increased activity of the Cx enzyme might have contributed to the degradation of CEL with maturation. The concomitant increase in activities of PME, PG, PL and Cx demonstrates that cell wall-degrading enzymes work together and interact in a coordinated manner, thereby reducing the fruit firmness with the advancement of fruit maturity. Increase in the activities of cell wall hydrolases may be ascribed to higher ethylene production in advanced maturation and ripening stages, as reported previously by Paull and Chen [55] in papaya fruit. The synergistic action of PME, PG, PL and Cx could have led to reduction in the levels of TP, PP, CSP and NSP, along with increased levels of WSP, which may have ultimately contributed to reduced bulb firmness during later maturity stages. Similar results showing an increase in the activity of fruit softening enzymes and WSP, along with a decline in NSP, CSP and CEL, have been reported in carambola (Averrhoa carambola L.) [56] and strawberry fruit [57].
5. Conclusions
In conclusion, the fruit maturation and ripening have a significant impact on the physicochemical and textural attributes of jackfruit. Fruit harvested during earlier stages had higher TP, CSP, NSP, CEL, rag proportion, TA, TPC and L*, in addition to lower a*, b* and C* values. Conversely, fruit harvested during later stages had higher SSC, TFC, TCC, edible portion and fruit softening enzyme activities. Our results suggest an optimum harvest for the investigated genotypes and provide information about how fruit maturation and ripening impact the biochemical traits and cell wall dynamics of jackfruit, along with the potential mechanisms behind these variations. These findings establish a strong basis for future research on standardisation of jackfruit maturity, which remains a significant gap in the literature. Future studies are warranted to examine the impact of the fruit maturation and ripening on ethylene production, respiration rate and storage life of jackfruit across multiple genotypes.
Author Contributions
Conceptualization, Z.S. and J.K.; methodology, J.K. and H.M.S.S.; software, J.K.; validation, Z.S.; formal analysis, J.K.; investigation, J.K.; resources, Z.S.; data curation, J.K.; writing—original draft preparation, J.K.; writing—review and editing, Z.S., M.S.M., H.M.S.S. and A.W.; visualization, J.K.; supervision, Z.S., M.S.M. and A.W.; project administration, Z.S. and M.S.M.; funding acquisition, Z.S. All authors have read and agreed to the published version of the manuscript.
Funding
This research was funded by and Co-operative Research Centre for Developing Northern Australia under the project entitled “Evaluation of selected clones of jackfruit (Artocarpus heterophyllus Lam.) produced in different preharvest settings”, grant number G1005589.
Data Availability Statement
Data will be made available on request.
Acknowledgments
Jashanpreet Kaur is thankful to Edith Cowan University (ECU) and Co-operative Research Centre for Developing Northern Australia (CRCNA) for awarding ‘ECU—The Northern Territory of Australia, Department of Agriculture and Fisheries scholarship (DAF)’. The authors are thankful to Plant Industries (DAF) staff members Chelsea Moore, Upendra Shekhawat, Cliff Hansen, Dakshina Yadav, and Alan Niscioli for their support during research work. We acknowledge the support of Michael Stein, HDR Communication Adviser, ECU, for reviewing the manuscript.
Conflicts of Interest
The authors declare no conflicts of interest.
References
- Lalel, H.J.D.; Singh, Z.; Tan, S.C.; Agustí, M. Maturity stage at harvest affects fruit ripening, quality and biosynthesis of aroma volatile compounds in ‘Kensington Pride’ mango. J. Hortic. Sci. Biotechnol. 2003, 78, 225–233. [Google Scholar] [CrossRef]
- Batista-Silva, W.; Nascimento, V.L.; Medeiros, D.B.; Nunes-Nesi, A.; Ribeiro, D.M.; Zsögön, A.; Araújo, W.L. Modifications in organic acid profiles during fruit development and ripening: Correlation or causation? Front. Plant Sci. 2018, 9, 1689. [Google Scholar] [CrossRef] [PubMed]
- Šavikin, K.; Živković, J.; Zdunić, G.; Gođevac, D.; Đorđević, B.; Dojčinović, B.; Đorđević, N. Phenolic and mineral profiles of four Balkan indigenous apple cultivars monitored at two different maturity stages. J. Food Compos. Anal. 2014, 35, 101–111. [Google Scholar] [CrossRef]
- Mikulic-Petkovsek, M.; Rescic, J.; Schmitzer, V.; Stampar, F.; Slatnar, A.; Koron, D.; Veberic, R. Changes in fruit quality parameters of four Ribes species during ripening. Food Chem. 2015, 173, 363–374. [Google Scholar] [CrossRef] [PubMed]
- Prasanna, V.; Prabha, T.N.; Tharanathan, R.N. Fruit ripening phenomena—An overview. Crit. Rev. Food Sci. Nutr. 2007, 47, 1–19. [Google Scholar] [CrossRef]
- Chen, H.; Cao, S.; Fang, X.; Mu, H.; Yang, H.; Wang, X.; Xu, Q.; Gao, H. Changes in fruit firmness, cell wall composition and cell wall degrading enzymes in postharvest blueberries during storage. Sci. Hortic. 2015, 188, 44–48. [Google Scholar] [CrossRef]
- Grierson, D. Senescence in fruits. HortScience 1987, 22, 859–862. [Google Scholar] [CrossRef]
- Mijin, S.; Ding, P. Growth development and structural changes of Malaysian jackfruit cv. Tekam yellow syncarp. Sci. Hortic. 2020, 272, 109594. [Google Scholar] [CrossRef]
- Ranasinghe, R.A.S.N.; Maduwanthi, S.D.T.; Marapana, R.A.U.J. Nutritional and health benefits of jackfruit (Artocarpus heterophyllus Lam.): A review. Int. J. Food Sci. 2019, 2019, 4327183. [Google Scholar] [CrossRef]
- Tiwari, A.K.; Vidyarthi, A.S. Nutritional evaluation of various edible fruit parts of jackfruit (Artocarpus heterophyllus Lam.) at different maturity stages. J. Chem. Pharm. Rev. Res. 2015, 1, 21–26. [Google Scholar]
- Budnimath, S.; Babu, A.G.; Jagadeesh, S.L.; Prakash, B.G. Standardization of harvest maturity of jackfruit (Artocarpus heterophyllus Lam.) by morpho-physical investigation. Environ. Conserv. J. 2022, 23, 320–325. [Google Scholar] [CrossRef]
- Rana, S.S.; Pradhan, R.C.; Mishra, S. Variation in properties of tender jackfruit during different stages of maturity. J. Food Sci. Technol. 2018, 55, 2122–2129. [Google Scholar] [CrossRef]
- Ranasinghe, R.A.S.; Marapana, R.A.U.J. Effect of maturity stage on physicochemical properties of jackfruit (Artocarpus heterophyllus Lam.) flesh. World J. Dairy Food Sci. 2019, 14, 17–25. [Google Scholar] [CrossRef]
- Saha, M.G.; Islam, M.N.; Molla, M.M. Determination of harvest maturity of jackfruit. Bangladesh Soc. Hortic. Sci. 2016, 2, 23–36. [Google Scholar]
- Shamla, L.; Heeba, S.; Jose, N.; Nisha, P. Change in chemical composition during maturation of Artocarpus heterophyllus and its effect on acrylamide formation in deep-fried jackfruit chips. J. Food Process. Preserv. 2019, 43, e14099. [Google Scholar] [CrossRef]
- Ong, B.T.; Hamid, N.; Osman, A.; Quek, S.Y.; Voon, Y.Y.; Hashim, D.; Chew, P.M.; Kong, Y.W. Chemical and flavour changes in jackfruit (Artocarpus heterophyllus Lam.) cultivar J3 during ripening. Postharvest Biol. Technol. 2006, 40, 279–286. [Google Scholar] [CrossRef]
- Rahman, M.M.; Moniruzzaman, M.; Ahmad, M.R.; Sarker, B.C.; Alam, M.K. Maturity stages affect the postharvest quality and shelf-life of fruits of strawberry genotypes growing in subtropical regions. J. Saudi Soc. Agric. Sci. 2016, 15, 28–37. [Google Scholar] [CrossRef]
- Bureau of Meteorology. Climate Statistics for Australian Locations. 2024. Available online: https://www.bom.gov.au/climate/averages/tables/cw_014041.shtml (accessed on 15 July 2024).
- Mijin, S.; Ding, P.; Saari, N.; Ramlee, S.I. Effects of pollination techniques and harvesting stage on the physico-chemical characteristics of jackfruit. Sci. Hortic. 2021, 285, 110199. [Google Scholar] [CrossRef]
- Kaur, J.; Singh, Z.; Shah, H.M.S.; Mazhar, M.S.; Hasan, M.U.; Woodward, A. Insights into phytonutrient profile and postharvest quality management of jackfruit: A review. Crit. Rev. Food Sci. Nutr. 2023, 64, 6756–6782. [Google Scholar] [CrossRef]
- Kaur, J.; Singh, Z.; Mazhar, M.S.; Afrifa-Yamoah, E.; Sangha, K.K.; Woodward, A. Mineral profiling of diverse genotypes of jackfruit (Artocarpus heterophyllus Lam.) grown in Australia. J. Food Compos. Anal. 2024, 135, 106599. [Google Scholar] [CrossRef]
- Vithana, M.D.K.; Singh, Z.; Johnson, S.K. Cold storage temperatures and durations affect the concentrations of lupeol, mangiferin, phenolic acids and other health-promoting compounds in the pulp and peel of ripe mango fruit. Postharvest Biol. Technol. 2018, 139, 91–98. [Google Scholar] [CrossRef]
- Guo, X.; Liu, Q.; Du, J.; Guo, Y.; Hu, X.; Yu, J.; Bai, J.; Li, X.; Kou, L. X-rays irradiation affects flavonoid synthesis and delays reddening of winter jujube (Zizyphus jujuba Mill. cv. Dalidongzao) during cold storage. Postharvest Biol. Technol. 2022, 193, 112048. [Google Scholar] [CrossRef]
- Ainsworth, E.A.; Gillespie, K.M. Estimation of total phenolic content and other oxidation substrates in plant tissues using Folin–Ciocalteu reagent. Nat. Protoc. 2007, 2, 875–877. [Google Scholar] [CrossRef] [PubMed]
- Chang, C.C.; Yang, M.H.; Wen, H.M.; Chern, J.C. Estimation of total flavonoid content in propolis by two complementary colometric methods. J. Food Drug Anal. 2002, 10, 3. [Google Scholar] [CrossRef]
- Shah, H.M.S.; Singh, Z.; Hasan, M.U.; Kaur, J.; Afrifa-Yamoah, E.; Woodward, A. Melatonin application suppresses oxidative stress and maintains fruit quality of cold stored ‘Esperanza’ raspberries by regulating antioxidant system. Postharvest Biol. Technol. 2024, 207, 112597. [Google Scholar] [CrossRef]
- Deng, Y.; Wu, Y.; Li, Y. Changes in firmness, cell wall composition and cell wall hydrolases of grapes stored in high oxygen atmospheres. Food Res. Int. 2005, 38, 769–776. [Google Scholar] [CrossRef]
- Cao, S.; Qu, G.; Ma, C.; Ba, L.; Ji, N.; Meng, L.; Lei, J.; Wang, R. Effects of melatonin treatment on the physiological quality and cell wall metabolites in kiwifruit. Food Sci. Technol. 2021, 42, e85421. [Google Scholar] [CrossRef]
- Bradford, M.M. A rapid and sensitive method for the quantitation of microgram quantities of protein utilizing the principle of protein-dye binding. Anal. Biochem. 1976, 72, 248–254. [Google Scholar] [CrossRef]
- Shah, H.M.S.; Singh, Z.; Hasan, M.U.; Woodward, A.; Afrifa-Yamoah, E. Preharvest methyl jasmonate application delays cell wall degradation and upregulates phenolic metabolism and antioxidant activities in cold stored raspberries. Food Chem. 2025, 462, 141020. [Google Scholar] [CrossRef]
- Lv, J.; Han, X.; Bai, L.; Xu, D.; Ding, S.; Ge, Y.; Li, C.; Li, J. Effects of calcium chloride treatment on softening in red raspberry fruit during low-temperature storage. J. Food Biochem. 2020, 44, e13419. [Google Scholar] [CrossRef]
- Opara, L.U. Fruit growth measurement and analysis. Hortic. Rev. 2010, 24, 373–431. [Google Scholar]
- da Silva Ramos, C.A.; Soares, T.L.; Barroso, N.S.; Pelacani, C.R. Influence of maturity stage on physical and chemical characteristics of fruit and physiological quality of seeds of Physalis angulata L. Sci. Hortic. 2021, 284, 110124. [Google Scholar] [CrossRef]
- Zhang, C.; Tanabe, K.; Wang, S.; Tamura, F.; Yoshida, A.; Matsumoto, K. The impact of cell division and cell enlargement on the evolution of fruit size in Pyrus pyrifolia. Ann. Bot. 2006, 98, 537–543. [Google Scholar] [CrossRef] [PubMed]
- Janurianti, N.M.D.; Utama, I.M.S.; Gunam, I.B.W. Colour and quality of strawberry fruit (Fragaria x ananassa Duch.) at different levels of maturity. Sustain. Environ. Agric. Sci. 2021, 5, 22–28. [Google Scholar] [CrossRef]
- Zhao, Y.; Zhu, X.; Hou, Y.; Pan, Y.; Shi, L.; Li, X. Effects of harvest maturity stage on postharvest quality of winter jujube (Zizyphus jujuba Mill. cv. Dongzao) fruit during cold storage. Sci. Hortic. 2021, 277, 109778. [Google Scholar] [CrossRef]
- Balaguera-López, H.E.; Martínez-Cárdenas, C.A.; Herrera-Arévalo, A. Effect of the maturity stage on the postharvest behaviour of cape gooseberry (Physalis peruviana L.) fruits stored at room temperature. Bioagro 2016, 28, 117–124. [Google Scholar]
- Jan, I.; Rab, A.; Sajid, M. Storage performance of apple cultivars harvested at different stages of maturity. J. Anim. Plant Sci. 2012, 22, 438–444. [Google Scholar]
- Cetin, B.E.; Saraçoğlu, O. Effects of different maturity stages and fruit parts on quality traits of plum (Prunus domestica) fruits. Erwerbs-Obstbau 2023, 65, 1069–1077. [Google Scholar] [CrossRef]
- Ibarra-Garza, I.P.; Ramos-Parra, P.A.; Hernández-Brenes, C.; Jacobo-Velázquez, D.A. Effects of postharvest ripening on the nutraceutical and physicochemical properties of mango (Mangifera indica L. cv Keitt). Postharvest Biol. Technol. 2015, 103, 45–54. [Google Scholar] [CrossRef]
- Serry, N.K. Postharvest handling of Solo papaya fruits harvested at different maturity stages. Am.-Eurasian J. Agric. Environ. Sci. 2011, 11, 205–210. [Google Scholar]
- Hornero-Méndez, D.; Mínguez-Mosquera, M.I. Chlorophyll disappearance and chlorophyllase activity during ripening of Capsicum annuum L fruits. J. Sci. Food Agric. 2002, 82, 1564–1570. [Google Scholar] [CrossRef]
- Arena, M.E.; Postemsky, P.; Curvetto, N.R. Accumulation patterns of phenolic compounds during fruit growth and ripening of Berberis buxifolia, a native Patagonian species. N. Z. J. Bot. 2012, 50, 15–28. [Google Scholar] [CrossRef]
- Konsue, N.; Bunyameen, N.; Donlao, N. Utilization of young jackfruit (Artocarpus heterophyllus Lam.) as a plant-based food ingredient: Influence of maturity on chemical attributes and changes during in vitro digestion. LWT-Food Sci. Technol. 2023, 180, 114721. [Google Scholar] [CrossRef]
- Fawole, O.A.; Opara, U.L. Changes in physical properties, chemical and elemental composition and antioxidant capacity of pomegranate (cv. Ruby) fruit at five maturity stages. Sci. Hortic. 2013, 150, 37–46. [Google Scholar] [CrossRef]
- Mphahlele, R.R.; Stander, M.A.; Fawole, O.A.; Opara, U.L. Effect of fruit maturity and growing location on the postharvest contents of flavonoids, phenolic acids, vitamin C and antioxidant activity of pomegranate juice (cv. Wonderful). Sci. Hortic. 2014, 179, 36–45. [Google Scholar] [CrossRef]
- Addai, Z.; Abdullah, A.; Sahilah, A.M.; Musa, K.H.; Dauqan, E. Antioxidant activity and physicochemical properties of mature papaya Fruit (Carica papaya L. cv. Eksotika). Adv. J. Food Sci. Technol. 2013, 5, 859–865. [Google Scholar] [CrossRef]
- Joshi, H.; Kuna, A.; Lakshmi, M.N.; Shreedhar, M.; Kumar, A.K. Effect of stage of maturity, ripening and storage on antioxidant content and activity of Mangifera indica L. var. Manjira. Int. J. Food Sci. Nutr. 2017, 2, 1–9. [Google Scholar]
- Liu, J.; Zhao, Y.; Xu, H.; Zhao, X.; Tan, Y.; Li, P.; Li, D.; Tao, Y.; Liu, D. Fruit softening correlates with enzymatic activities and compositional changes in fruit cell wall during growing in Lycium barbarum L. Int. J. Food Sci. Technol. 2021, 56, 3044–3054. [Google Scholar] [CrossRef]
- Ding, S.; Wang, R.; Shan, Y.; Li, G.; Ou, S. Changes in pectin characteristics during the ripening of jujube fruit. J. Sci. Food Agric. 2017, 97, 4151–4159. [Google Scholar] [CrossRef]
- Ali, Z.; Chin, L.-H.; Lazan, H.A. Comparative study on wall degrading enzymes, pectin modifications and softening during ripening of selected tropical fruits. Plant Sci. 2004, 167, 317–327. [Google Scholar] [CrossRef]
- Chourasia, A.; Sane, V.A.; Nath, P. Differential expression of pectate lyase during ethylene-induced postharvest softening of mango (Mangifera indica var. Dashehari). Physiol. Plant. 2006, 128, 546–555. [Google Scholar] [CrossRef]
- Qu, G.; Ba, L.; Wang, R.; Li, J.; Ma, C.; Ji, N.; Cao, S. Effects of melatonin on blueberry fruit quality and cell wall metabolism during low temperature storage. Food Sci. Technol. 2022, 42, 11582. [Google Scholar] [CrossRef]
- Tang, Q.; Li, C.; Ge, Y.; Li, X.; Cheng, Y.; Hou, J.; Li, J. Exogenous application of melatonin maintains storage quality of jujubes by enhancing anti-oxidative ability and suppressing the activity of cell wall-degrading enzymes. LWT-Food Sci. Technol. 2020, 127, 109431. [Google Scholar] [CrossRef]
- Paull, R.E.; Chen, N.J. Postharvest variation in cell wall-degrading enzymes of papaya (Carica papaya L.) during fruit ripening. Plant Physiol. 1983, 72, 382–385. [Google Scholar] [CrossRef]
- Chin, L.H.; Ali, Z.M.; Lazan, H. Cell wall modifications, degrading enzymes and softening of carambola fruit during ripening. J. Exp. Bot. 1999, 50, 767–775. [Google Scholar] [CrossRef]
- Figueroa, C.R.; Rosli, H.G.; Civello, P.M.; Martínez, G.A.; Herrera, R.; Moya-León, M.A. Changes in cell wall polysaccharides and cell wall degrading enzymes during ripening of Fragaria chiloensis and Fragaria × ananassa fruits. Sci. Hortic. 2010, 124, 454–462. [Google Scholar] [CrossRef]
Disclaimer/Publisher’s Note: The statements, opinions and data contained in all publications are solely those of the individual author(s) and contributor(s) and not of MDPI and/or the editor(s). MDPI and/or the editor(s) disclaim responsibility for any injury to people or property resulting from any ideas, methods, instructions or products referred to in the content. |
© 2024 by the authors. Licensee MDPI, Basel, Switzerland. This article is an open access article distributed under the terms and conditions of the Creative Commons Attribution (CC BY) license (https://creativecommons.org/licenses/by/4.0/).