Article

Biochemical Profile and Antioxidant Activity of Dried Fruit Produced from Apricot Cultivars Grown in Latvia

1
Institute of Horticulture (LatHort), LV-3701 Dobele, Latvia
2
Research Laboratory of Biotechnology, Latvia University of Life Sciences and Technologies, LV-3004 Jelgava, Latvia
*
Author to whom correspondence should be addressed.
Horticulturae 2024, 10(3), 205; https://doi.org/10.3390/horticulturae10030205
Submission received: 2 February 2024 / Revised: 16 February 2024 / Accepted: 19 February 2024 / Published: 22 February 2024

Abstract

:
The present study focused on evaluating the biochemical profiles of four apricot cultivars (cv.) (Prunus armeniaca L.) grown in Latvia and demonstrating their processing to obtain the food product, dried candied fruit (DCF). The fingerprinting of apricot fruit approached by LC-MS and ultraviolet–visible spectroscopy revealed the abundance of bioactives responsible for the antioxidant activity. The outstanding composition of group compounds, i.e., phenolics, flavonoids, and vitamin C, was observed in the cv. ‘Dimaija’, followed by cv. ‘Gundega’ and cv. ‘Velta’. The lowest values were found in the cv. ‘Boriss’ and fruit from a market of Greek origin. However, the latter two contained the highest carotenoid levels due to a more pronounced maturity. Amongst the 13 individual phenolics detected, rutin, chlorogenic and neochlorogenic acids, catechin, and epicatechin prevailed. The concentrations observed were the highest in cv. ‘Dimaija’, followed by cv. ‘Velta’ and cv. ‘Gundega’. Osmotic dehydration and convective drying of apricot fruit variedly influenced the content of bioactives in DCF products. The most substantial decrease due to thermal lability was observed in the vitamin C content in DCF, accounting for a 95.3% loss for all cultivars. The content of total phenolics, flavonoids, and carotenoids in DCF, on average, was 62.7%, 49.6%, and 87.6% lower than that observed in the raw fruit, respectively. On average, the content of individual phenolics in DCF, such as rutin and chlorogenic acid, decreased by 63.8% and 20.8%, respectively. The decline in the content of bioactives was conditioned by the physical migration of the cell components to the hypertonic solution. However, the increase in the content of cell wall-bound phytochemicals, such as catechin and epicatechin, after osmotic dehydration and convective drying, was observed in DCF, corresponding to a 59.5% and 255.64% increase compared with the raw fruit, respectively. Panelists generally responded positively to the developed DCF; however, greater preference was given to products with a lower phenolic content, such as cv. ‘Boriss’ and those produced from the market fruit. It is believed that the high flavan-3-ols content, along with chlorogenic acid, contributed to the bitter taste of DCF. Overall, apricot fruits represent the abundance of bioactives retained in DCF after osmotic dehydration and convective drying. The findings observed in the current study allow to consider DCF as a functional food; however, given the high sugar content, their consumption should be in moderation.

Graphical Abstract

1. Introduction

Drying is one of the ancient, cost-effective, and commonly used techniques to hamper the decomposition of food and agricultural products. Drying is a process that reduces the moisture content of food to a low level and ensures a longer shelf life of the product [1]. Drying, as a type of preservation, makes it attainable to reduce packaging, storage, and transportation costs due to the lower volume and weight of the produce [2]. The preservation of fruit and vegetables is ensured by inhibiting spoilage-related bacteria, molds, yeast, and, to a lesser extent, native enzymes that cause irreversible changes and the loss of valuable nutrients [3,4]. Over the past few decades, myriad drying techniques have been developed for removing water from products, including convective, solar, freeze, vacuum, osmotic, microwave, forced-air, ultrasound, and spray drying [5]. However, the degree of drying efficiency and fruit and vegetable preservation capabilities are determined largely by the moisture content and the type and state of the product intended to be dried. Hot air drying at a temperature no higher than 60 °C as a type of preservation has proven to be efficient in removing water from the medicinal plant of cassumunar ginger (Zingiber montanum), minimally affecting the content of antioxidants such as curcumin [6]. These observations have further been reinforced by Veleșcu et al. [7], indicating that the optimal method for obtaining high-quality dried fruit such as apples and apricots is to dry them at 60 °C using convective drying. Superior preservation of nutrients and sensory quality of Japanese quince fruit was reported by Krasnova et al. [8], applying the combination of osmotic and convective drying. Along with preserving the structure of the product, this type of sample pre-treatment provides additional opportunities for removing water from cells by soaking the product in a hypertonic solution of sugar, during which there is a simultaneous counter-current mass transfer of water from the cytoplasm to the hypertonic solution and of solute from solution into the sample [9]. A similar drying technology was applied by Juhnevica et al. [10] during the development of the nutrient-dense candied sour cherry product, achieving a pleasant taste and preserving thermolabile biologically active compounds.
Apricots (Prunus armeniaca L.) are a nutrient-rich fruit which, along with essential minerals and vitamins such as potassium, zinc, copper, iron, manganese, and vitamins A, C and E [11], also contain a variety of bioactive phytochemicals, such as phenolic acids (gallic, chlorogenic, neochlorogenic, caffeic, ferulic, and p-coumaric acids), flavonoids (quercetin-3-O-rutinoside, myricetin, quercetin, kaempferol), and flavan-3-ols (catechin epicatechin, epigallocatechin gallate) [12]. Despite the health-promoting properties of the compounds mentioned, apricots, like other soft fruit, are considered highly perishable due to their high moisture content [13]. In addition, its climacteric nature triggers prompt ripening and softening processes, which take place immediately after harvesting [14]. High susceptibility to mechanical injuries makes apricots less resistant to pathogenic microorganisms’ invasion, affecting shelf life and transportation [15]. Proper harvesting and post-harvest handling are ensured to preserve the loss of nutrients and bioactives in apricots. According to the information available in the FAOSTAT 2023 [16] and Statistica 2023 [17] reports, the demand for both fresh and processed apricots is steadily growing, revealing a 16.9% (from 3.303 in 2010 to 3.863 Mt in 2022) and 39.35% (from 2.246 Mt in 2009/2010 to 3.130 Mt in 2022/2023) rise in production quantity. Given this data, additional preservation techniques would be needed to cover the consumers’ needs for highly nutritious and acceptable quality fruit.
Apricots are an ancient fruit crop that originated as a mountain species. Its biological characteristics have formed in areas with temperate, cool winters without sharp temperature fluctuations. The Latvian climate is challenging for apricot growers, as it is characterized by frequent temperature fluctuations in wintertime, low minimal temperatures, and relatively cool and humid summers. As a result of the long-term breeding program at the Institute of Horticulture (LatHort), several apricot cultivars have been obtained. The breeding of apricots in Dobele was started by Peteris Upitis in 1950. The initial breeding material was obtained from Central Asia and the Caucasus mountains. The selection of breeding material from the Caucasus mountains was based on comparable climate conditions, giving the hope that the plants could have a higher winter hardiness. However, breeding was much more complicated than expected, so registering the first cultivars took almost 50 years. After a long-term evaluation of extensive breeding material, in 1999, three cultivars were registered in Latvia. One of them is the cultivar ‘Velta’ [18]. In the early 2000s, in cooperation with Czech, Russian and Slovak breeders, the LatHort collections were expanded. Open-pollinated seeds were collected from the most valuable genotypes. In the following years, the most suitable and productive genotypes with good fruit quality were selected for the Latvian climate during the assessment and selection of seedlings. From this material, in 2022, the cultivars ‘Boriss’ and ‘Gundega’ and in 2023, ‘Dimaija’, were submitted for registration in Latvia. At the Institute of Horticulture, apricot selection continues to evaluate cultivars suitable for Latvian and Northern European conditions.
Due to certain limitations in the scientific literature regarding the biochemical profile of apricot fruit grown at northern latitudes and the lack of alternatives to dried apricots, the current study aimed to evaluate the profile of biactives and the antioxidant activity of Latvian cold-hardy apricot cultivars and demonstrate a possible way of processing them to obtain a new food product, such as dried candied fruit. It is hypothesized that North Europe’s apricot fruit grown under certain abiotic stress conditions are nutrient-denser than its counterparts grown in Southern regions.

2. Materials and Methods

2.1. Chemicals and Reagents

Commercial standards, i.e., caffeic acid (CA), trans-isomer of ferulic acid (t-FA), vanillic acid (VA), vanillin (VN), p-coumaric acid (p-CA), (−)-epicatechin (E-CTC), (±)-catechin (CT), gallic acid (GA), sinapic acid (SA), syringic acid (SIA), protocatechuic acid (PCA), neochlorogenic (NCGA), and chlorogenic acids (CGA), rutin (RT), kaempferol (KMP), isorhamnetin (ISR), luteolin-7-O-glucoside (LUT-7G), rhamnetin (RHM), quercetin (QCT), glucose (GLU), fructose (FRU), sucrose (SUC), sorbitol (SOR), inositol (INO), ribose (RIB), and 96% ethanol (EtOH) were purchased from Sigma-Aldrich Chemie Ltd., (Steinheim, Germany). Methanol (MeOH), acetonitrile (MeCN), and formic acid (HCOOH) (puriss p.a., ≥99.9%) of liquid chromatography-mass spectrometry (LC-MS) grade, were purchased from Merck KGaA (Darmstadt, Germany). HPLC grade petroleum ether (puriss. p.a., ≥99.9%, boiling point 50–70 °C) was purchased from Sigma-Aldrich Chemie Ltd., (St. Louis, MO, USA). Ultrapure water (UPW) was produced using the reverse osmosis PureLab Flex Elga water purification system (Veolia Water Technologies, Paris, France).

2.2. Plant Material

Apricot (Prunus armeniaca L.) cultivars (cv.), i.e., ‘Dimaija’, ‘Velta’, ‘Gundega’, and ‘Boriss’ (Table 1) grown in the orchard of the Institute of Horticulture (LatHort) were used as raw material for the preparation dried candied fruit (DCF) products. P. domestica L. grafted on seedlings of P. cerasifera was used as interstock. As a control, apricot fruit of Greek origin (40+ mm, 1 Class) were purchased from the local market to compare the results. Apricot fruit was collected from the Institute of Horticulture (Dobele, Latvia), GPS location: N: 56°36′35.0″; E: 23°17′58.7″ in 2023 on July 17 cv. ‘Boriss’, on 27–28 July cv. ‘Gundega’ and ‘Velta’, and on 3 August cv. ‘Dimaija’ at technical maturity (defined visually by color and firmness of hand–feel touch). About 1.7 ± 0.1 kg of each apricot cultivar were harvested and transported immediately (within 1 h) to the laboratory of the LatHort.

2.3. Preparation of Apricot Fruit for Osmotic Dehydration

For the preparation of the DCF and before convective drying, the collected fruit were sliced around the seam into halves, and the stones were manually removed. Afterwards, fruit were packed in 24 L high-density polyethylene (HDPE) boxes with a lid (dimensions L600 × W400 × H145 mm, Pryce, Słupsk, Poland) in one layer and deep frozen for 72 h in a freezer “PORKKA BF 710” (Porkka, Lahti, Finland) at −25 ± 1 °C. After deep freezing, the fruit were stored at −18 ± 1 °C until further processing and analysis, for a maximum of 10 wk.

2.4. Apricot Fruit Osmotic Dehydration

Before convective drying, the refrigerated apricot fruit were thawed to an ambient temperature of 20 ± 1 °C and immersed into Japanese quince (JQ) (Chaenomeles japonica) syrup used as a hypertonic solution with an average sugar concentration of 70 ± 2 Brix% and 5% organic acids. The three major sugar representatives in JQ syrup, i.e., sucrose (52.28 ± 1.47 g 100 g−1), fructose (5.02 ± 0.24 g 100 g−1), and glucose (4.86 ± 0.06 g 100 g−1) were detected chromatographically. Before fruit soaking, JQ syrup obtained as a byproduct after the production of dried candied JQ fruit was thermally processed at 100 ± 1 °C to eliminate native enzymes and microorganisms and was supplemented with additional sugar at the ratio of 50:50 (w/w). When the sugar completely dissolved, the syrup was cooled to 60 ± 2 °C and poured over apricots until the fruit were completely immersed. The fruit were soaked for 72 h in a cool place at 6 ± 2 °C. Finally, the JQ syrup was drained, and the fruit were placed on a wire rack for 2 h to remove the residual syrup.

2.5. Apricot Fruit Convective Drying

For drying the apricot fruit, the dryer “B. Master BM40” (Tauro Essiccatori, Vicenza, Italy) with warm air inflow, equipped with an automatic ventilation system for the electronic control of humid air discharge, was used. The soaked apricot halves were placed separately on dry, silk, non-stick sheets. The temperature in the dryer was adjusted to 50 ± 2 °C and the drying time was 48 h. The apricots were dried until the moisture content reached 30 ± 2%. The DCF were packed in polypropylene zip-lock bags (high-density polyethylene polymer, density 3 mm, Impak Co., Los Angeles, CA, USA) and stored in a dark, cold place at 10 ± 2 °C temperature until analysis.

2.6. Extraction of Free Phenolics and Flavonoids from Prunus armeniaca L. Fruit and Products for Spectrophotometric Analysis

Apricot fruit and products were evenly crushed in a knife mill “Grindomix GM 200” (Retsch GmbH, Haan, Germany). Then, 2–3 g of crushed sample was transferred into 50 mL conical tubes (Sarstedt AG & Co. KG, Nümbrecht, Germany), and 25 mL of 80% ethanol was added. The mixtures were intensively vortex mixed for 2 min with a “Vortex REAX top” (Heidolph, Schwabach, Germany), followed by ultrasonic treatment at 50 kHz with an output wattage of 360 W for 30 min at 25 ± 1 °C, using an “Ultrasons” ultrasonic bath (J.P. Selecta®, Barcelona, Spain). Afterwards, the mixture was centrifuged at 3200× g in an Eppendorf 5804 R centrifuge (Eppendorf AG, Hamburg, Germany) for 10 min at 20 °C and the top organic layer was filtered through a Whatman® Grade 6 filter (Cytiva, Marlborough, MA, USA). The clear filtrate was used for spectrophotometric studies to determine the phenolic (TPC) and flavonoid (TFC) content and the antiradical activity using DPPH and FRAP methods.

2.7. Extraction of Carotenoids from Prunus armeniaca L. Fruit and Products for Spectrophotometric Studies

Carotenoids were extracted according to the methodology described by Howard et al. [19], with minor modifications. Briefly, 2 g of the crushed sample was transferred into a test tube and mixed with 10 mL 96% EtOH. The mixture was then intensively vortex mixed for 2 min followed by adding 25 mL of petroleum ether. The release of carotenoids from the matrix was conducted by an ultrasound-assisted extraction at 50 kHz with an output wattage of 360 W for 30 min at 25 ± 1 °C. All manipulations were performed under yellow fluorescent light to avoid light-induced changes. After extraction, the sample was centrifuged at 3200× g for 15 min at 4 °C. Subsequently, the supernatant was collected, and the remaining residue was re-extracted using the same procedure until the residue was colorless. The collected top organic layer was filtered through the Whatman® Grade 6 filter.

2.8. Spectrophotometric Studies

2.8.1. Determination of Phenolic Content

The content of phenolics (TPC) was determined using the colorimetric Folin–Ciocalteu method [20]. Briefly, a 100 μL aliquot of each sample extract (1 mg mL−1) or the standard gallic acid (GA) was mixed with 5.0 mL of 10-fold diluted Folin–Ciocalteu reagent followed by the addition of 4.0 mL 7.5% Na2CO3 and 800 μL of UPW with the subsequent incubation for 30 min at room temperature (22 ± 1 °C). Finally, the absorbance was measured at wavelength 760 nm using a Shimadzu series visible spectrophotometer, “UV-1800” (Shimadzu Corp., Kyoto, Japan). The results were expressed as mg gallic acid equivalent per 100 g−1 on a dry weight basis (mg GAE 100 g−1 DW).

2.8.2. Determination of Flavonoids Content

The content of flavonoids (FC) was determined using the described methodology by Yang et al. [21] with minor modifications. Briefly, 1 mL of obtained extract was transferred into test tubes, and 2 mL of UPW and 0.3 mL of 5% NaNO2 were added. The mixture was thoroughly mixed and allowed to react for 5 min. Then, 0.3 mL of 10% AlCl3 was added, thoroughly mixed, and allowed to react for an additional 6 min. Finally, 2 mL of 1 N NaOH and 2.4 mL of UPW were added to adjust the total volume to 10 mL. Then, the absorbance was measured at a wavelength of 510 nm. The results were expressed as mg catechin equivalent per 100 g−1 on a dry weight basis (mg CE 100 g−1 DW).

2.8.3. Determination of Carotenoids Content

The content of carotenoids (CC) was determined following the protocol provided by Mallek-Ayadi [22]. As reported, the spectrophotometric method (method of mean) is robust, reproducible, sensitive, and has a strong correlation with the HPLC approach. The method is based on the mean absorption coefficients and mean absorption wavelength (Figure 1).
To determine the average carotenoid concentrations, the following equation was used:
T o t a l   c a r o t e n o i d s = A 450 × V × 10 6 A 1 % × 100 × G
where A450 being the mean absorbance maximum, V is the total volume of extract, A1% is the extinction coefficient at 2500 for a 1% mixture of carotenoids, and G is the weight of the sample (g).
A 0.1 g oil sample was diluted 10 times using petroleum ether followed by centrifugation at 3200× g for 10 min at 20 °C, and the top organic was taken for immediate absorbance measurement at 450 nm. The results were expressed as mg β-carotene equivalent per 100 g−1 on a dry weight basis (mg β-carotene 100 g−1 DW).

2.9. Antiradical Activity of Apricot Fruit and Candied Fruit Derived Extracts

2.9.1. DPPH Free Radical Scavenging Activity

The DPPH free radical scavenging activity was determined based on the methodology described by Radenkovs et al. [23] with slight modifications. Briefly, 100 μL of diluted of the above extract was mixed with 2.9 mL of DPPH-EtOH solution (0.039 g DPPH in 1 L methanol). The reaction proceeded at 22 ± 1 °C for 30 min in the dark. The absorbance of the extracts was measured at 0 and 30 min at wavelength 517 nm. The DPPH scavenging activity was expressed as millimole (mM) Trolox equivalent (TE) antioxidant capacity per 100 g−1 on a dry weight basis (mM TE 100 g−1 DW).

2.9.2. Ferric Reducing Antioxidant Power (FRAP)

The FRAP reducing antioxidant power was determined using the procedure of Radenkovs et al. [24]. The fresh FRAP reagent was prepared using 300 mL 0.3 M acetate buffer, TPTZ solution in 40 mM L−1 HCl, and FeCl3⋅6H2O (20 mM L−1). The 3 solutions were mixed at the ratio of 10:1:1 (v/v/v), respectively, and then heated to 37 °C. Extracts and standard (FeS-O4⋅7H2O) or UPW for blank (100 μL) were mixed with 3.6 mL of FRAP reagent, followed by incubation for 10 min in the dark at ambient temperature. The absorbance was measured at wavelength 593 nm. The FRAP values were expressed as mM TE antioxidant capacity per 100 g−1 on a dry weight basis (mM TE 100 g−1 DW).

2.10. Physical–Chemical Analysis of Apricot Fruit and Products

2.10.1. Apricot Fruit and Candied Fruit Moisture

The moisture content was measured gravimetrically at 103 ± 2 °C using the method of Ruiz [25].

2.10.2. Fruit and Candied Fruit Total Soluble Solids

The total soluble solids (TSS) content (expressed in Brix%) was determined using a digital electronic refractometer “type Pal-1” (Atago®, Tokyo, Japan) according to the standard method ISO 2173:2003 [26]. In total, ten unprocessed fruit without stone or 20 pieces of DCF were selected and ground into a puree with the hand blender “SwissLine” (Bamix®, Liechtenstein, Switzerland).

2.10.3. Apricot Fruit and Candied Fruit Titratable Acidity

Titratable acidity was determined using the standard method ISO 750:1998 [27] and quantified by titration of 1 mL of juice using automatic titrator “DL 21” (Mettler Toledo®, Greifensee, Switzerland) with 0.1 M NaOH to a pH of 8.1. The expended amount of NaOH was expressed in the percentage of malic acid equivalent on a dry weight basis (% MAE DW).

2.11. The HPLC-RID Conditions for Carbohydrate Analysis

A quantitative analysis of free mono- and disaccharides in apricot fruit and prepared DCF was conducted using a “Waters Alliance”, high-performance liquid chromatography (HPLC) system (Model No. e2695) coupled to a 2414 refractive index detector (RID) and a 2998 column heater (Waters Corporation, Milford, MA, USA) following the methodology described by Radenkovs et al. [28].

2.12. Determination of Vitamin C Content

The content of vitamin C (Vit C) was determined using the standard method EN 14130:2003 [29]. The results were expressed as mg ascorbic acid equivalent per 100 g−1 on a dry weight basis (mg AA 100 g−1 DW).

2.13. Solid-Phase Extraction of Free Phenolics from Prunus armeniaca L. Fruit and Products for Analysis by LC-ESI-TQ-MS/MS

A solid-phase extraction (SPE) technique, i.e., isolation and purification of bioactive compounds from apricot fruit and DCF matrix, ensured the following of the protocol provided by “Supelco” with minor modifications. Briefly, 1.0 g of finely ground and frozen fruit and DCF in triplicate was placed in 15 mL conical centrifuge tubes (Sarstedt AG & Co. KG, Nümbrecht, Germany), and 10 mL acidified 30% MeOH (MeOH:H2O:HCOOH at a ratio of 30:69:1 v/v/v) was introduced. Afterwards, the obtained mixture was subjected to 1 min intensive vortexing using the “ZX3” vortex mixer (Velp® Scientifica, Usmate Velate, Italy) followed by centrifugation at 10,000 rpm (10,280× g) for 10 min at 20.0 ± 1 °C in a “Hermle Z 36 HK” centrifuge (Hermle Labortechnik, GmbH, Wehingen, Germany). After centrifugation, the top organic layer was separated and filtered through a 0.20 µm hydrophilized polytetrafluoroethylene (H-PTFE) membrane filter (Macherey-Nagel GmbH & Co. KG, Dueren, Germany). The purification of phenolic compounds was taken with a SPE “Supel™-Swift HLB” (57492-U) (Supelco, Bellefonte, PA, USA) column packed with a hydrophilic modified, styrene-based sorbent (50–70 µm, 80–200 Å, 60 mg 3.0 mL) (Figure 2). A steady flow (1.0 ± 0.2 mL min−1) during analytes desorption was provided by a “Chromabond® SPE” (Düren, Germany) SPE vacuum manifold with an adjusted pressure of 3.38 × 10⁻³ Pa.
The conditioning/equilibration of the SPE column was conducted with a 1 bed volume (3.0 mL) of pure MeOH followed by a 1 bed volume of acidified UPW (1.0% HCOOH, v/v). The loaded extract (3.0 mL) was washed with 2 bed volumes of UPW. The flow-through fractions were collected for qualitative and quantitative chromatographic analysis of the presence of phenolic compounds and saccharides. The 1.0 mL acidified MeOH solution (MeOH:HCOOH at a ratio of 99:1 v/v) was used as an eluate to elute phenolic compounds from the polymer. The resulting fractions were collected and analyzed with an LC-ESI-TQ-MS/MS system.

2.14. The LC-ESI-TQ-MS/MS Analytical Conditions for Phenolics

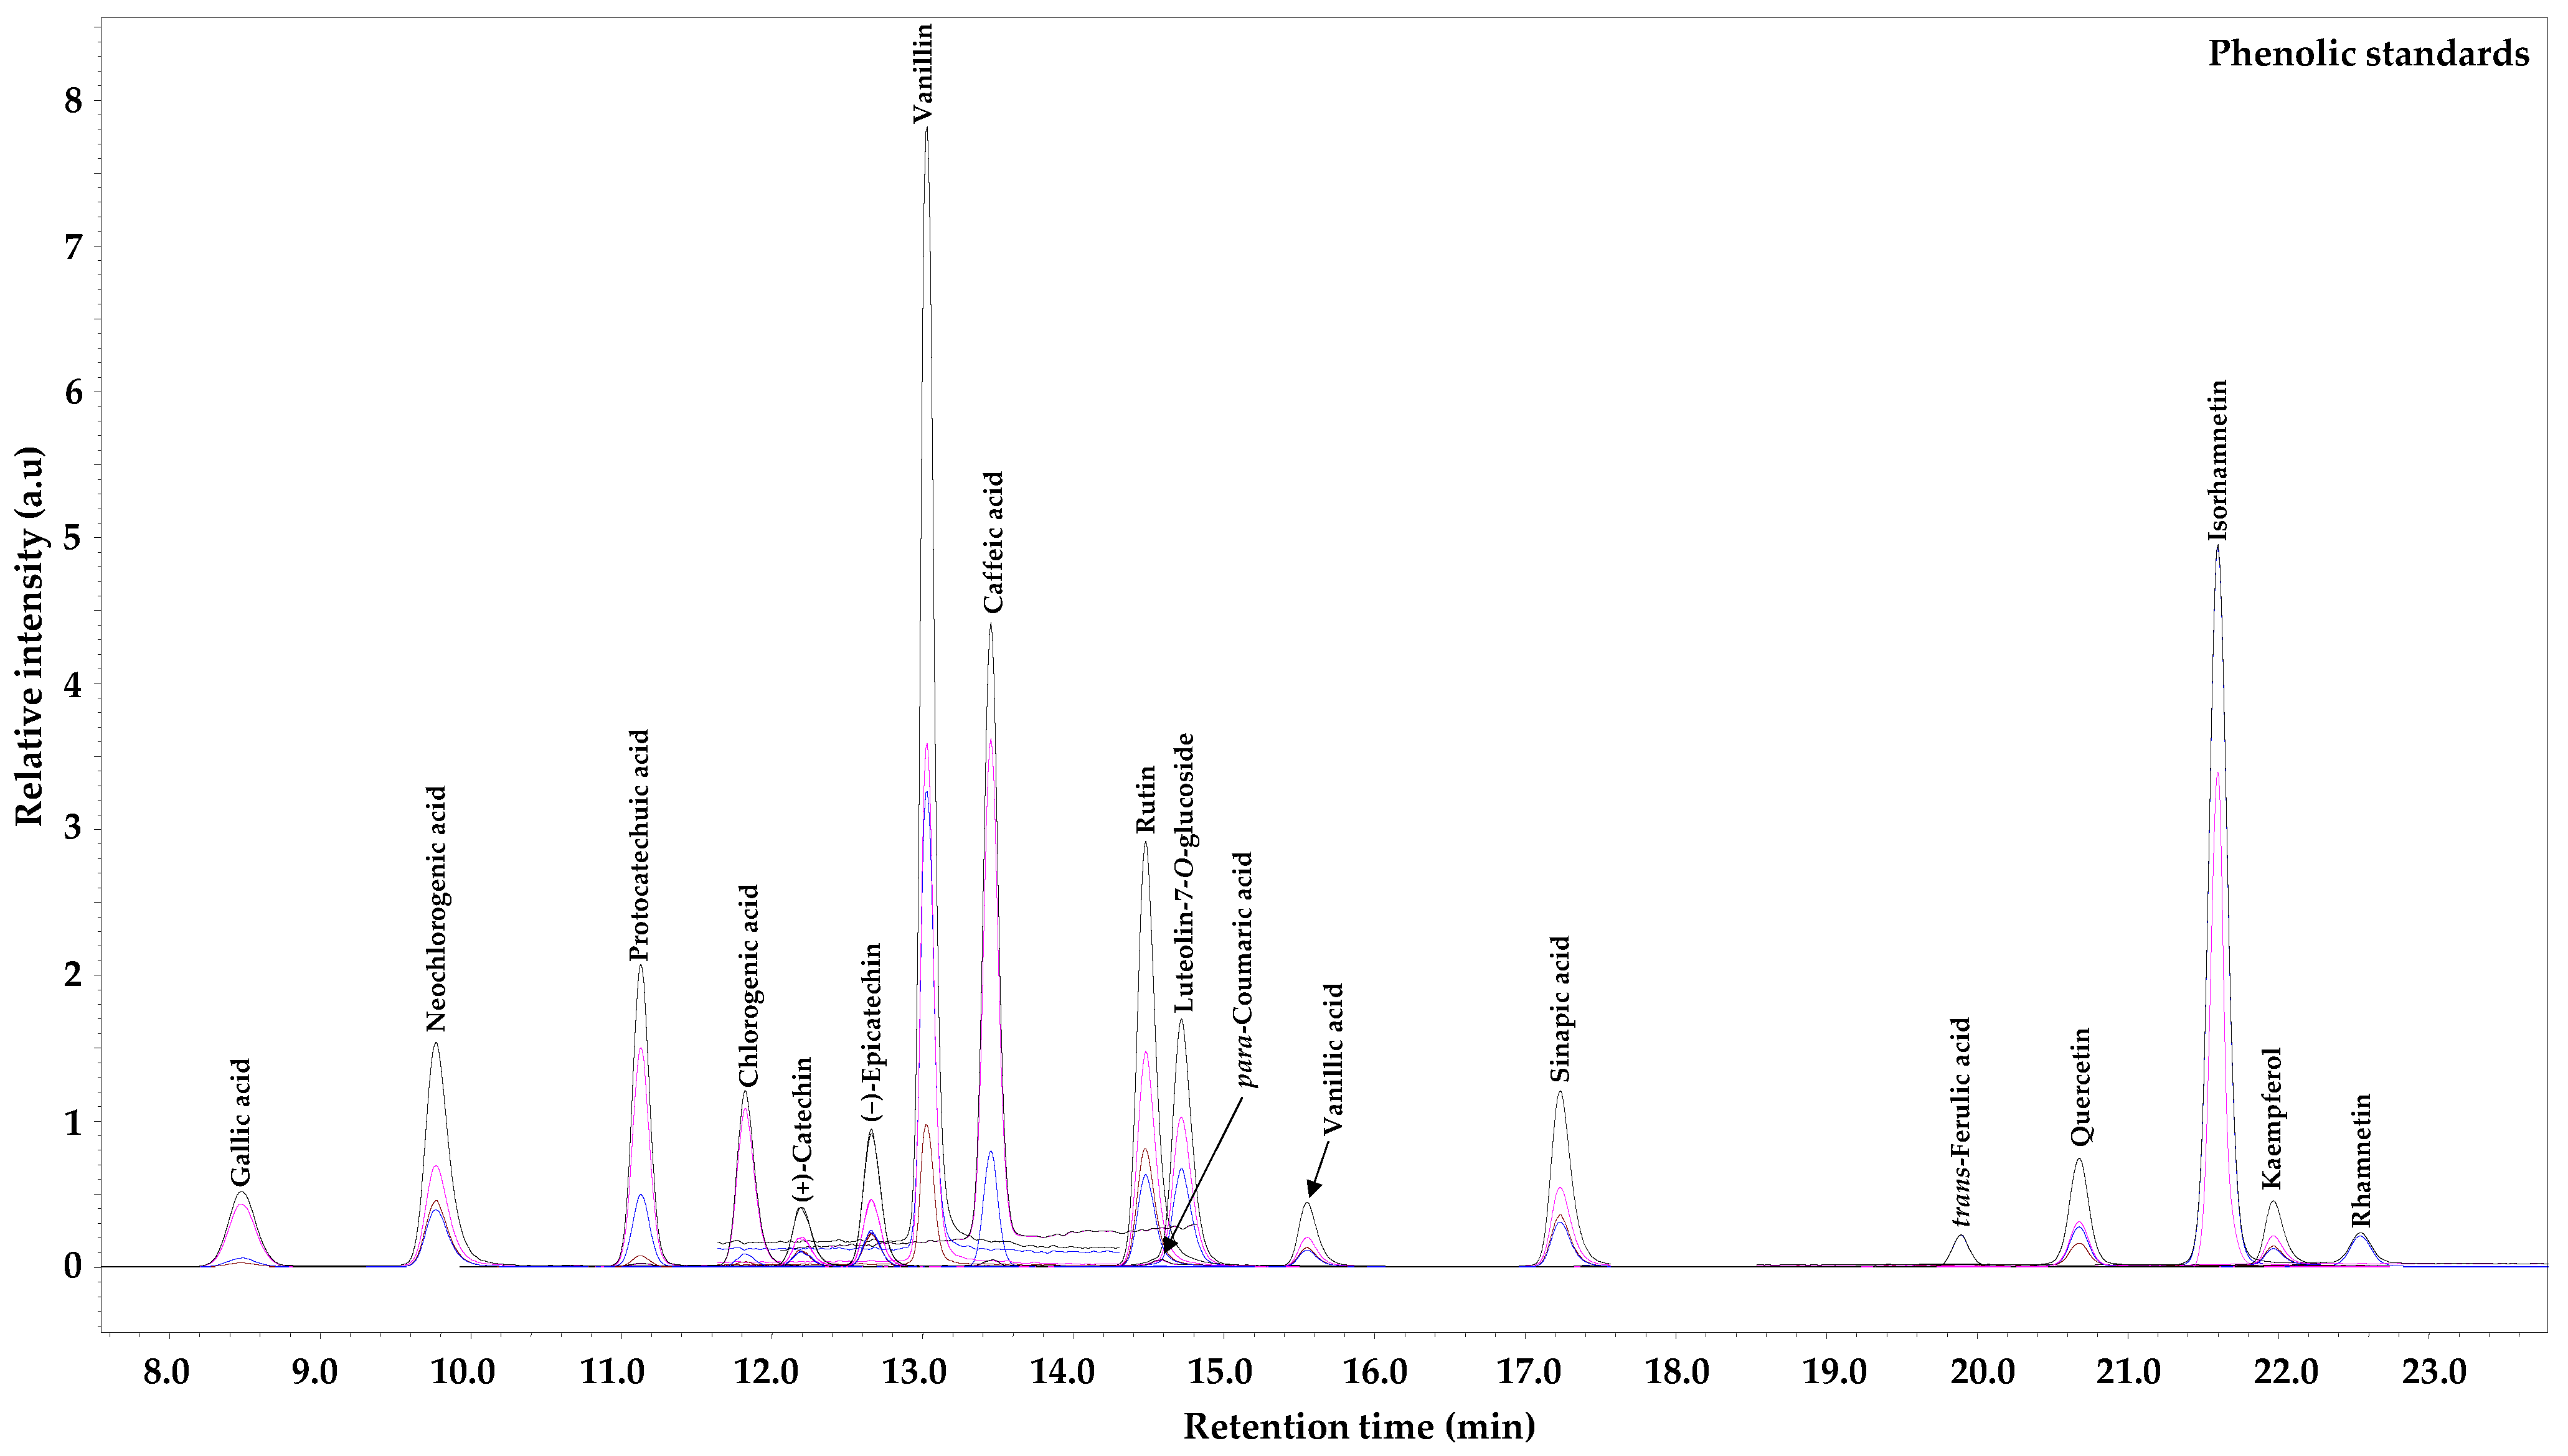
The analysis was approached by a Shimadzu series “Nexera UC” supercritical fluid extraction–supercritical fluid chromatography–mass spectrometry (SFE-SFC-MS) system (Tokyo, Japan) coupled to Shimadzu triple quadrupole (TQ) mass-selective detector (TQ-MS-8050) (Tokyo, Japan) with an electrospray ionization interface (ESI). The chromatographic separation of phenolic compounds was carried out using a reversed-phase (RP) “Shim-pack UC-RP” column (5.0 μm, 250 × 4.6 mm; Tokyo, Japan) operating at 45 °C and a flow rate of 1.0 mL min−1. The mobile phases used were acidified UPW (1.0% HCOOH, v/v) (A) and acidified MeOH (MeOH:HCOOH at a ratio of 99:1 v/v) (B). The compounds were separated using the stepwise gradient elution program: elution started with 5% B to obtain 10% B at 5 min, 60% B at 12–15 min, and 10% B at 18 min. Furthermore, MeOH injections were included as a blank run after each sample to avoid the carry-over effect. Data were acquired using “LabSolutions Insight” LC-MS software version 3.7 SP3 (workstation), which was also used for instrument control and processing. The ionization in both positive and negative ion polarity modes was applied in this study, while data were collected in profile and centroid modes, with a data storage threshold of 5000 absorbance for MS. The operating conditions were as follows: detector voltage 1.8 kV, conversion dynode voltage 10.0 kV, interface voltage 3.0 kV, interface temperature 300 °C, desolvation line temperature 250 °C, heat block temperature 400 °C, nebulizing gas argon (Ar, purity 99.9%,) at flow 3.0 L min−1, heating gas carbon dioxide (CO2, purity 99.0%,) at flow10.0 L min−1, and drying gas nitrogen (N2, separated from air using a nitrogen generator system from “Peak Scientific Instruments Ltd.” (Inchinnan, Scotland, UK), purity 99.0%) at flow 10.0 L min−1. All phenolics were observed in the programmed and optimized multiple reaction monitoring (MRM) mode (Supplementary Table S1). Representative chromatographic separation of 18 phenolic compounds is given in Figure 3.

2.15. Sensory Evaluation of Candied Apricot Fruit

Prepared samples of DCF were assessed according to sensory attributes. The quality of the products was assessed by descriptive analysis utilizing a 12-point line scale, where 12 denotes “like very much”, 6—“neither like nor dislike”, and 0—“dislike very much” according to the standard method ISO 13299:2016 [30]. The panelists considered such characteristics as color, appearance, taste, sweetness, and sourness. As a complement, the consumers’ preferences towards developed products were specified by applying a 5-point hedonic scale, where 1 denotes “dislike very much”, 2—“dislike slightly”, 3—“neither like nor dislike”, 4—“like slightly”, 5—“like very much”. In total, thirty trained panelists were involved in assessing the sensory attributes. Before sensory evaluation, all analyzed samples were coded and randomly served on a white tray with a glass of water.

2.16. Statistical Analysis

The results obtained are shown as means ± standard deviation of four replicates (n = 4) for primer groups of compounds (total phenolics, flavonoids carotenoids, vitamin C soluble solids and organic acids) and two replicates (n = 2) for individual sugars and phenolics. A p-value of ≤ 0.05 was used to indicate significant differences between mean values determined using one-way analysis of variance (ANOVA) and Duncan’s multiple range test performed using “IBM® SPSS® Statistics” version 20.0 (SPSS Inc., Chicago, IL, USA).

3. Results and Discussion

3.1. Physical–Chemical Characteristics of Apricot Fruit and Its Candied Products

The analysis of the physical–chemical characteristics of apricot fruit revealed relative fluctuations in total soluble solids content (TSS). The content of TSS ranged from 11.3 to 14.8 Brix%, with cv. ‘Boriss’ having the highest TSS and with cv. ‘Dimaija’ having the lowest (Table 2). In this instance, differences in TSS are primarily due to the genetic background of apricot cultivars and, to a lesser extent, the maturity stage. The content of TSS in selected apricot cultivars is substantially lower than that reported by Cirillo et al. [31] for apricot cultivars grown under Southern conditions and consistent with those of Rampáčková et al. [32] reported for apricot cultivars originating from Central Europe, Central Asia, and the USA. Analyzing the TSS of developed DCF products, a statistically higher (p < 0.05) amount was found in cv. ‘Velta’ followed by cv. ‘Gundega’ and ‘Dimaija’; the values corresponded to 78.6, 76.7, and 76.1 Brix%, respectively. Abu-Shama et al. [33] indicated a nearly similar TSS content for jelly candies made from red and yellow prickly pear fruit (Opuntia spp.) juice and sucrose. The observed TSS values indicate that apricot fruit, through synergistic processing, were saturated with a solution with a high sugar content during soaking in a hypertonic solution along with the loss of water from the cells by a counter-current mass transfer of water from the cytoplasm to hypertonic solution. A subsequent drying under convective conditions reduced the moisture average by 69.2%, thus additionally concentrating the dry matter content. Kuo et al. [34], under experimental and response surface model conditions, confirmed a reduction in moisture and an increase in dry matter by vacuum osmotic dehydration of watermelon rind by 31.0% and 32.0%, respectively. The importance of sucrose concentration and time of watermelon-rind immersion in the hypertonic solution has been highlighted by the authors. Veleșcu et al. [7] reported a similar drying kinetics, achieving 70.9% and 74.3% moisture loss after the convective drying of apricot fruit at 50 and 80 °C for 12.5 and 8 h, respectively.
The total acid content (TA) was found to be statistically higher (p < 0.05) in the apricot fruit of cv. ‘Velta’ followed by cv. ‘Dimaija’, the values corresponded to 35.9% and 24.0% malic acid equivalent (MAE DW), respectively. The lowest TA content was observed in apricot fruit from the market (of Greek origin used as a control) and the cv. ‘Boriss’, corresponding to 13.8% and 14.5% MAE DW, respectively. A relatively lower content of TA in the market and cv. ‘Boriss’ fruit indicates a more pronounced maturity stage than the other three apricot cultivars. This observation was supported by maturity index (MI) values calculated as proposed by Melgarejo et al. [35], showing the highest MI for cv. ‘Boriss’ apricot fruit and those obtained from the market. However, it should be noted that the TSS content in apricot fruit from the market was among the lowest, indicating a possible oxidative breakdown of sugars in respiration, which initiated the catabolic processes triggering the cleavage reaction of sugars [36]. The obtained TA results are in close agreement with data reported by Leccese et al. [37], who performed a study involving 18 apricot genotypes of the Italian and international germplasm. The authors noted substantial variation in the content of TA for fresh apricots from 0.6% to 2.2% MAE FW. The lowest TA values were found for apricot cultivars, those of late ripening of Greek origin. Additionally, the results can be supported by TA values reported by Melgarejo et al. [35], indicating the lowest TA value of 0.8% MAE FW for ‘Mirlo Blanco’ fruit with MI 13.1 and the highest of 2.4% MAE FW fruit with MI 5.5. The highest TA content with no statistically significant differences (p > 0.05) was found in DCF products developed from apricot cv. ‘Velta’, ‘Gundega’, and ‘Dimaija’, corresponding to 5.9%, 5.7%, and 5.5% MAE DW, respectively. The observed values are consistent with those reported by Madrau et al. [38] for apricot cv. ‘Pelese’ and cv. ‘Cafona’ of Italian origin. The loss of organic acids is due to migration from partially solubilized and disrupted cells of apricot fruit to the hypertonic solution of Japanese quince (JQ) (Chaenomeles japonica) syrup rather than degradation [39].

3.2. The Composition of Individual Sugars in Apricot Fruit and Its Candied Products

Quantitative analysis of free mono- and disaccharides in apricot fruit and prepared DCF is depicted in Table 3. Generally, four individual sugars were identified in apricot fruit, with sucrose as the most abundant sugar representative. The sucrose concentration in five apricot samples selected in this study fluctuated from 23.2 to 55.0 g 100 g−1 DW. The highest concentration was observed in the apricot fruit of cv. ‘Boriss’, whereas the lowest concentration was found in fruit from the market. The observed values are consistent with those reported by Drogoudi et al. [40], indicating a fluctuation from 28.4 to 47.1 g 100 g−1 DW among 29 apricot cultivars of Greek and American origin. The second prevalent monosaccharide of apricot fruit was glucose; the values ranged from 5.4 to 11.5 g 100 g−1 DW, with cv. ‘Boriss’ fruit having the highest value and with cv. ‘Velta’ having the lowest. Fructose, as the third sugar representative, was found in the range from 3.4 to 8.3 g 100 g−1 DW, with cv. ‘Gundega’ having the highest value and cv. ‘Velta’ having the lowest. Interestingly, the amount of fructose in apricot fruit obtained from the market was detected at a trace level below the limit of quantification (BLQ), which can indicate the overripening of these fruit and the gradual process of senescence causing the decrease in fructose and sucrose contents [41]. Sorbitol as a sugar alcohol representative was also observed in all five apricot samples ranging from 3.3 to 14.5 g 100 g−1 DW, with fruit from the market having the highest value and cv. ‘Dimaija’ having the lowest. It should be noted that the sorbitol content in the fruit obtained from the market was found to be 3.1 times higher than the content observed in apricot cultivars grown in Latvia. The presence of sorbitol in fruit at high concentrations might indicate that the fruit were subjected to stress conditions during growing or post-harvest that perhaps induced sorbitol transport genes or promoted sorbitol metabolism, ensuring cold tolerance and alleviating a chilling injury of the fruit [42]. This statement can be reinforced by an observation made by Reis et al. [43], emphasizing that one of the main functions of sorbitol is an osmotic adjustment in cell cytoplasm under various abiotic stresses, such as drought, chilling, and salinity. Inositol was the fifth sugar found exclusively in apricot fruit originating from Greece. The concentration of this sugar alcohol was close to that of sorbitol, corresponding to 23.6 g 100 g−1 DW. Farag et al. [44] reported the presence of inositol in apricot fruit and its kernels in the range from 0.02 to 0.17 g 100 g−1 FW. It is worth noting that the group from CEBAS-CSIC under the leadership of Martínez-Gómez applying nuclear magnetic resonance spectroscopy (1H-NMR) has successfully identified one of nine inositol stereoisomers myo-inositol in two apricot genotypes grown under Southern conditions [45]. The range of myo-inositol fluctuated from 0.029 to 0.046 g 100 g−1 FW. Due to technical limitations, the identification of inositol stereoisomers in this study was not possible. Drogoudi et al. [40] reported the presence of inositol in Greek and American apricots. Overall, the content of individual sugars identified in apricot cultivars grown in Latvia was similar to that reported by Schmitzer et al. [46] for 13 cultivars of apricots grown in Central Europe conditions. The highest content of total individual sugars was found in the apricot fruit of cv. ‘Boriss’, followed by fruit obtained from the market, corresponding to 78.7 and 71.1 g 100 g−1 DW, respectively. The lowest content was found in the apricot fruit of cv. ‘Dimaija’ and ‘Velta’, corresponding to 59.0 and 59.9 g 100 g−1 DW, respectively. The difference in sugars can be explained by the fruit’s degree of ripeness and the cultivar. As in the case of apricot fruit, sucrose also prevailed in DCF products and fluctuated from 18.4 to 31.4 g 100 g−1 DW, respectively, with a product made from market apricots having the highest value, with a product made from cv. ‘Gundega’ apricots having the lowest value. The content of glucose and fructose in developed DCF products was found in almost equivalent quantities, which is due to the inversion of sucrose presented in the JQ syrup caused by thermal processing to eliminate the presence of native microflora and enzymes before being applied as a hypertonic solution. A statistically higher glucose and fructose content was detected in DCF products from cv. ‘Gundega’ apricot fruit, corresponding to 25.5 and 25.8 g 100 g−1 DW, respectively. In all products developed from apricot fruit, glucose and fructose contributed up to 70% of the total sugar content on average. The highest concentration of total sugars was found in DCF produced from apricots of cv. ‘Gundega’, amounting to 69.7 g 100 g−1 DW. The lowest content of total sugars was found in DCF made from market apricots, corresponding to 55.5 g 100 g−1 DW.
Overall, the content of total individual sugars was similar to that reported by Naryal et al. [47], indicating a fluctuation from 31.4 to 59.8 g 100 g−1 DW among dried apricot fruit of 108 genotypes. The presence of natural sugars makes the developed products attractive as snacks, and consumers are expected to prefer them due to the absence of artificial sweeteners and health benefits.

3.3. The Content of Phenolics in Apricot Fruit and Its Candied Products

The data in Table 4 show that the highest phenolic content (TPC) was found in the apricot fruit of cv. ‘Dimaija’ followed by cv. ‘Gundega’, corresponding to 2795.3 and 1843.2 mg GAE 100 g−1 DW, respectively. The observed values align with those reported by Gómez-Martínez et al. [48], demonstrating a diverse fluctuation of TPC among 13 apricot genotypes of Spanish origin. The lowest TPC content was found in the apricot fruit of cv. ‘Boriss’ followed by fruit from the market; the values corresponded to 216.4 and 582.0 mg GAE 100 g−1 DW, respectively. The observed values are interconnected to data on the MI, which further reinforce the importance of the maturity stage on the TPC content. A significant decrease (p < 0.05) in TPC content was observed after applying osmotic dehydration, followed by convective drying. The TPC content in DCF ranged from 114.4 to 723.9 mg GAE 100 g−1 DW, which on average is 62.7% lower than that observed in raw material. By and large, the same trend in the content of TPC was observed in developed DCF products, with cv. ‘Gundega’ followed by cv. ‘Dimaija’ and cv. ‘Velta’ fruit having the highest TPC amounts, corresponding to 723.9, 702.1 and 639.2 mg GAE 100 g−1 DW, respectively. The significant fluctuations in the content of TPC were reported by Wani et al. [49], indicating the range of TPC losses from 26.9 to 37.3% after apricot drying by convection at 65 °C.
In the present study, the enzymatic oxidation of TPC caused by polyphenol oxidase (PPO) can be excluded since, before convective drying, the apricot fruit were soaked in a hypertonic solution derived from JQ with a pH close to two, which appears to be far from optimal for PPO as reported by Yang et al. [50]. However, the migration of phenolic compounds from the partially degraded fruit cells to the hypertonic solution may have occurred, as it was reported by Muñoz-Fariña et al. [51] and Kucner et al. [39] for Viburnum opulus L. and Ribes uva-crispa L. fruit, respectively.

3.4. The Content of Flavonoids in Apricot Fruit and Its Candied Products

The results of the flavonoid content (TFC) of fresh apricots and processed products developed by osmotic dehydration and convective drying are given in Table 4. According to the results, the fresh apricot contained from 122.2 to 2270.5 mg CE 100 g−1 DW of TFC, with cv. ‘Dimaija’ followed by cv. ‘Gundega’ fruit having the highest amounts and with fruit from the market and cv. ‘Boriss’ the lowest. The lowest TFC values indicate a later ripening stage corresponding to commercial maturity. The observed values are considerably higher than those reported by Bousselma et al. [52] for the apricot cv. ‘Rosé de Manaa’ grown in Algeria. The difference in TFC is primarily due to the geographical origin of the fruit, including meteorological conditions that affected the synthesis and accumulation of secondary metabolites during the vegetation period. This observation can be reinforced by relatively low values of TFC reported by Alajil et al. [11] for apricot genotypes grown under soft meteorological conditions in India. More severe weather conditions contribute to a more intense synthesis of secondary metabolites, which promote the resistance to abiotic stress [53]. The obtained results revealed a significant (p < 0.05) decrease in the content of TFC caused by osmotic dehydration coupled with convective drying. The TFC content in the DCF ranged from 64.7 to 674.6 mg CE 100 g−1 DW, with cv. ‘Dimaija’ followed by cv. ‘Gundega’ and cv. ‘Velta’ fruit having the highest amounts, corresponding to 674.6, 652.7, and 584.6 mg CE 100 g−1 DW, respectively. Substantially lower TFC values were reported by Čanadanović-Brunet et al. [54] for dried apricots originating from Serbia. The average decrease in TFC in the developed DCF products for all cultivars was 49.6%, 13.1% lower than the decrease observed for TPC. The report of Miletić et al. [55] emphasized no changes in the TFC content for cv. ‘Valjevka’ plums and only a slight increase in cv. ‘Mildora’ after convective drying at a 90 °C temperature. Interestingly, the most severe reduction in the content of TFC in the guava fruit was reported by Petal et al. [56], subjecting the fruit to osmotic dehydration, while a significantly lower reduction after oven drying at 54 °C and freeze drying corresponded to 63.4%, 48.0% and 52.5% loss, respectively. As in the case of TPC content, the lowest TFC values were found in DCF products made from the apricot cv. ‘Boriss’ and fruit from the market. The observed TFC values can additionally be supported by data reported by Srednicka-Tober et al. [12], highlighting the superiority of organically produced dried apricot fruit over conventional ones. However, the values found are significantly higher than those reported by Ouchemoukh et al. [57] for dried apricot fruit originating from Algeria.
Due to the relative abundance of biologically active compounds retained after osmotic dehydration and convective drying, including TPC and TFC, the developed DCF products can be treated as functional food; however, given the high sugar content, their consumption should be in moderation.

3.5. The Content of Vitamin C in Apricot Fruit and Its Candied Products

According to the literature, the Vit C in fresh apricot fruit varies from 2.5 to 20 mg 100 g−1 FW [58,59] or 20.6 to 96.8 mg 100 g−1 DW [60], depending on the extraction and analytical methods used. As shown in Table 4, the concentration of Vit C in apricot fruit varied from 75.3 to 148.3 mg AA 100 g−1 DW, with cv. ‘Dimaija’ and ‘Gundega’ having the highest amount, with market fruit and cv. ‘Boriss’ having the lowest. The substantially lower amount of Vit C after conversion FW values to DW was observed by Munzuroglu et al. [59] and by Fratianni et al. [61] in apricot varieties grown under southern conditions of Turkish and Italian regions, respectively. However, Karatas [62] reported almost equal Vit C levels (ascorbic acid) observed in wild apricot fruit grown in Turkey; the concentration varied from 167.8 to 215.2 DW or 18.4 to 23.6 mg 100 g−1 FW. The relative fluctuations in Vit C content are due to different analytical approaches used for estimation and, to a greater extent, geographic area, environment, and cultivation techniques, which influence the synthesis of secondary metabolites during the vegetation period [63]. After drying, the losses of Vit C due to heat treatment were the most noticeable in the DCF products of cv. ‘Velta’, ‘Dimaija’, and ‘Gundega’, corresponding to 98.7%, 97.0%, and 96.7% losses, respectively. The average decrease in Vit C in the developed DCF products for all cultivars was 95.3%, and the observed percentage losses are substantially higher than those reported by Vega-Gálvez et al. [64] in apricots dehydrated by convective drier at 40–50 °C than at 80 °C temperature. The authors indicated that longer drying time is the leading cause of the loss of this metabolite. A similar observation was made by Veleșcu et al. [7], highlighting a decrease in the content of Vit C by 76.10% after apricot fruit drying at a temperature of 80 °C. Interestingly, Sakooei-Vayghan et al. [65] observed a positive effect of synergistic drying, which has been ensured by the indirect transfer of heat energy using a water bath and osmotic dehydration by immersing coated with ascorbic and citric acids apricot fruit in a liquid sorbitol (35 Brix%) as an osmotic agent that allowed to preserve up to 46.50% of Vit C.

3.6. The Content of Carotenoids in Apricot Fruit and Its Candied Products

According to the results shown in Table 4, the concentration of carotenoids in apricot fruit varied from 13.0 to 30.4 mg β-carotene 100 g−1 DW. The observed values are in partial alignment with those reported by Deng et al. [66] and by Ali et al. [67], demonstrating average values of 22.4 and 14.7 mg β-carotene 100 g−1 DW for apricots originating from China and northern areas of Pakistan, respectively. Relative fluctuations in the content of individual carotenoids were reported by Dragovic-Uzelac et al. [68], emphasizing the highest content in apricot fruit with commercial maturity and the lowest in immature fruit. This observation can be reinforced by data obtained in the current research, revealing that fruit of cv. ‘Boriss’ and those from the market with MI 10.2 and 8.5 contained the highest carotenoid amount, and fruit with MI 3.2 (cv. ‘Velta’) and 4.7 (cv. ‘Dimaija’) contained the lowest. The importance of the fruit maturity stage has been highlighted by Pintea et al. [69], revealing the relationship between fruit color, maturity, and carotenoid content in 11 apricot cultivars originating from Romania. Dehydration using a hypertonic solution followed by convective drying decreased the carotenoid content in apricot products by an average of 87.6% for all cultivars. The carotenoid concentration varied from 1.9 to 3.4 mg β-carotene 100 g−1 DW, with cv. ‘Velta’ apricot fruit having the highest amount, with cv. ‘Dimaija’ and ‘Gundega’ the lowest. However, considering the content of carotenoids in developed products individually, it can be seen that in some cases, there was an 83.7% decrease, such as in the DCF product from cv. ‘Gundega’ fruit, whereas in some instances, there was an 89.9% decrease, such as in the product made from the market fruit. Up to 60% carotenoid loss was reported by Wani et al. [70] for apricot fruit subjected to convective drying for 60 h at 65 °C. The decrease in the content of carotenoids is conditioned by the nature of carotenoids, i.e., the susceptibility of specific carotenoid representatives to degradation [71] and the presence of other constituents responsible for antioxidant activity and the prevention of carotenoids from decomposition through enzymatic and non-enzymatic oxidation. This statement can be reinforced by early observations made by Pénicaud et al. [72] and Morais et al. [73], demonstrating a direct involvement of ascorbic acid in preventing these thermo- and light-labile molecules from oxidation. Moreover, due to vicinal diols in the B ring, representatives of flavan-3-ols, such as catechin and epicatechin, were reported to have the highest lipoxygenase inhibitory activity [74,75].

3.7. The Content of Individual Phenolic Compounds in Apricot Fruit and Its Candied Products

The non-specificity of the Folin–Ciocalteu method for the estimation of TPC has been tremendously reported by [76,77], indicating that such non-phenolic reducing constituents as amino acids or mono- and disaccharides can interact with Folin–Ciocalteu, skewing the results of TPC. Moreover, the results of TPC from the Folin–Ciocalteu method are usually interpreted as the total amount of phenolics, which is not entirely correct since most representatives of up to 50–95% in fruit and vegetable are presented in bound forms [78]; therefore, they need to be released from the matrix by either alkaline or acid hydrolysis before being extracted. According to the results indicated in Table 5, a total of 13 individual, free polyphenolic compounds were detected after the purification of apricot-derived extracts by taking advantage of the SPE technique using SPE “Supel™-Swift HLB” column packed with a hydrophilic modified, styrene-based sorbent. The SPE was applied as the sample matrix, rich in carbohydrates and other high-molecular-weight compounds greatly influencing the phenolic compounds’ recovery and correct quantification. The LC-ESI-TQ-MS/MS fingerprint of the apricot-derived extracts showed the presence of hydroxycinnamic and hydroxybenzoic acid derivatives, such as vanillin (VN), gallic acid (GA), neochlorogenic acid (NCGA), protocatechuic acid (PCA), chlorogenic acid (CGA), caffeic acid (CA), synaptic acid (SA), trans-ferulic acid (t-FA), flavonols, such as quercetin (QTC), rutin (RT), luteolin (LUT-7G), and flavan-3-ols, such as catechin (CT) and epicatechin (E-CTC). The concentration of individual phenolic compounds in apricot fruit and developed DCF products varied from 0.1 to 1249.4 µg g−1 DW and from 0.3 to 587.4 µg g−1 DW, respectively.
According to the results, the most prevailing compound identified in the apricot fruit is rutin (RT), varying in concentrations from 89.5 to 1249.4 µg g−1 DW, while cv. ‘Dimaija’ apricot fruit contained the highest amount and cv. ‘Boriss’ fruit contained the lowest (Table 5 and Supplementary Figure S1). The dominance of RT in four apricot cultivars and one wild genotype grown in the Iğdır region in Turkey was reported by Karaçelik [79], indicating the range from 24.7 to 696.5 µg g−1 DW. This observation is reinforced by data provided by Cirillo et al. [31], emphasizing the relative abundance of RT over other phenolic compounds in 12 apricot genotypes of Italian origin. Apricot dehydration through osmosis followed by convective drying resulted in a substantial reduction in the RT in apricot products by an average of 63.8% for all cultivars. Considering the content of RT in DCF products individually, it is seen that the highest decrease was observed in the DCF product made from cv. ‘Dimaija’, ‘Gundega’, and ‘Velta’ apricots, whereas the lowest in the DCF made from cv. ‘Boriss’ apricots, corresponding to a 77.5% and 26.5% loss on average, respectively. However, the observed RT values are close to those reported by Gundogdu et al. [80] for fresh fruit of Turkish origin, indicating the range from 57.86 to 426.57 µg g−1 DW. Comparing the effect of temperature on the biochemical profile of apricot fruit, Vega-Gálvez et al. [64] observed that drying at 50 °C is the most acceptable since an increase in the content of RT by 30.6% appeared, whereas a decrease of 11.13% at 60 °C occurred. The authors attributed the decrease to more prolonged exposure to temperature, which caused a gradual decomposition of thermolabile compounds.
The second prevailing bioactive compound identified in the apricot fruit is chlorogenic acid (CGA), varying in concentrations from 21.3 to 1129.1 µg g−1 DW, with cv. ‘Velta’ apricot fruit having the highest amount and cv. ‘Boriss’ having the lowest (Table 5). The observed values partially agree with those reported by Madrau et al. [38], indicating the range of CGA in two south apricots cv. ‘Pelese’ and cv. ‘Cafona’ of Italian origin, from 24.1 to 50.5 µg g−1 DW, respectively. Göttingerová et al. [81] reported the range of CGA from 7.30 to 209.10 µg g−1 FW within 15 apricot cultivars originating from Central Europe of the Czech Republic, which, after a conversion to dry weight, are very close to values observed in the present study. The highest concentration of CGA was found in cv. ‘Velta’ apricot fruit, followed by cv. ‘Dimaija’ and cv. ‘Gundega’. As in the case of group compounds, the lowest CGA value was observed in cv. ‘Boriss’ fruit and those from the market. Dehydration using a hypertonic solution followed by convective drying substantially reduced the content of CGA in apricot products by an average of 20.8% for all cultivars. The highest concentration of CGA was found in the produced DCF from apricot cv. ‘Velta’, followed by cv. ‘Dimaija’; the values corresponded to 587.4 and 147.1 µg g−1 DW, respectively (Supplementary Figure S2). Evaluating the content of CGA in the developed DCF products individually, it is seen that there was a 61.8% decrease in some cases, such as in the cv. ‘Dimaija’ product, while in some instances there was an 89.4% increase, such as in cv. ‘Boriss’ product. The increase in the content of CGA was due to moisture loss. The results of the current study are in complete agreement with those reported by Wani et al. [49], highlighting an increase of chlorogenic acid by 6.9% and 27.2% after apricot fruit freezing and canning and a decrease by 36.3% after convective drying at 65 °C, respectively. Madrau et al. [38] observed a decrease in CGA content, revealing a loss of 38.6% and 24.7% CGA after apricot drying in a tangential air-flow cabinet at 55 and 75 °C. The authors emphasize the activity of PPO as the leading cause of CGA loss, which is more apparent at lower temperatures. In both cases, the authors did not note the presence of caffeic acid (CA) or quinic acid, which are CGA’s decomposition products that appear after PPO action [82].
The third most abundant compound from apricot fruit isolated and successfully quantified, was neochlorogenic acid (NCGA). The concentration of NCGA varied from 1.0 to 550.2 µg g−1 DW. Among the five apricot samples investigated, the highest concentration of NCGA was observed in cv. ‘Dimaija’ fruit followed by cv. ‘Velta’ (Table 5). The observed concentrations of NCGA in cv. ‘Boriss’ and fruit obtained from the market are consistent with those reported by Roussos et al. [83], for cv. ‘Bebecou’ apricot fruit grown at southern latitudes of the Greek region, whereas observed values in the fruit of cv. ‘Dimaija’ and ‘Velta’ are many folds higher. Similar NCGA content was displayed in the work of Gómez-Martínez et al. [48], reporting a diverse fluctuation of NCGA among 13 apricot genotypes of Spanish origin. The influence of growing conditions on the accumulation of secondary metabolites can be additionally reinforced by the relatively lower value of NCGA reported by Jan et al. [84] for apricot fruit originating from India, in which the highest value of NCGA was only 197.9 µg g−1 DW (expressing 21.77 on a dry weight basis). After subjecting apricot fruit to osmotic dehydration and convective drying, the content of NCGA in certain DCF products was significantly increased and varied from 5.2 to 191.2 µg g−1 DW, with cv. ‘Velta’ product having the highest amount and with cv. ‘Boriss’ having the lowest. Comparing the NCGA content in DCF after drying with fresh fruit, it can be seen that, on average, it was increased by 87.1% with the cv. ‘Boriss’ product having the highest increase and cv. ‘Dimaija’ having the highest decrease. Minor changes in the content of NCGA due to drying conditions were reported by Wani et al. [49], indicating the loss as only 2.51%, 4.67%, and 2.47% for CITH-1, CITH-2, and New Castle apricot varieties, respectively. NCGA losses were also reported by Miletić et al. [55] for cv. ‘Valjevka’ and ‘Mildora’ plums subjected to convective drying at 90 °C, corresponding to 25.23% and 12.78% compared to the initial content, respectively. However, in the present study case, the average NCGA loss for three cv., i.e., ‘Dimaija’, ‘Velta’, and ‘Gunta’, was 64.2%. A credible explanation for obtaining a higher loss of NCGA and CGA has been given by Yu [85], confirming the physical migration of blueberry constituents to the hypertonic solution during osmotic dehydration.
Catechin (TC) and, to a lesser extent, epicatechin (E-CTC) were observed as the leading representatives of flavan-3-ols in the four apricot cultivars investigated, fluctuating from 3.5 to 373.3 µg g−1 DW and from 1.3 to 170.5 µg g−1 DW, respectively (Table 5). To a greater extent, the values observed are similar to those reported by Madrau et al. [38]. The highest value of CT was found in cv. ‘Dimaija’ apricot fruit and the lowest in the fruit of cv. ‘Boriss’ and those of Greek origin (market), corresponding to 373.3, 3.5, and 6.0 µg g−1 DW, respectively. In turn, the highest concentration of E-CTC was observed in cv. ‘Gundega’ fruit, whereas the lowest concentration was observed in market fruit and apricots of cv. ‘Boriss’ with no statistically significant differences (p > 0.05), corresponding to 170.5, 1.9, and 1.3 µg g−1 DW, respectively. An investigation conducted by Göttingerová et al. [81] revealed comparable E-CTC values after conversion of FW to DW for over 15 apricot cultivars originating from the South Moravian region of the Czech Republic. Drying by osmosis coupled with convection positively affected the content of both CT and E-CTC. The content of CT and E-CTC in DCF products increased by an average of 59.5% and 255.6%, respectively. The concentration of these compounds in DCF products fluctuated from 7.3 to 178.8 µg g−1 DW and from 6.1 to 269.6 µg g−1 DW. The outstanding biological value of cv. ‘Dimaja’ followed by cv. ‘Gundega’, and cv. ‘Velta’ apricot fruit can be highlighted regarding CT and E-CTC levels. The observed behavior of CT and E-CTC towards drying does not coincide with those of early findings of Madrau et al. [38], reporting a substantial reduction in these biactives after convective drying of apricot fruit at 55 and 75 °C. This is the first report highlighting the increase of bioactives, CT and E-CTC, in particular, observed after apricot fruit osmotic dehydration and convective drying. However, an increase in the concentration of individual bioactives as a result of convective drying was noted by many authors in fruit such as kiwi (Actinidia deliciosa), pepino (Solanum muricatum Aiton) [86], black rosehip (Rosa pimpinellifolia) fruit [87], as well as Xuan-Mugua (Chaenomelis Fructus) [88], and avocado (Persea americana Mill.) [89].
Along with the compounds mentioned above, other polyphenol representatives such as vanillin (VN), quercetin (QCT), protocatechuic (PCA) and caffeic (CA), trans-ferulic (t-FA) acids were also found in both raw materials and developed DCF products (Table 5), which are also underlined in other articles [83,90]. However, these compounds can only be considered minor due to their relatively low concentrations. The low flavonol values observed in the purified apricot extracts are due to weak solubility in water or aqueous MeOH solution (30%), which was used as a solvent during the extraction.
Overall, osmotic dehydration coupled with convective drying variedly influenced the content of biologically active compounds of DCF products. The decrease in the content of phytochemicals was primarily due to the physical migration of the intracellular components, such as CGA and NCGA, to the osmotic solution. An increase in cell wall-bound phytochemicals such as CT and E-CTC was caused by partial disruption of cell membranes, thus facilitating their release into extraction solvent during subsequent ultrasound-assisted extraction [49,64]. Applying a hypertonic solution derived from JQ with a pH close to two seems feasible as it eliminates the impact of PPO responsible for the oxidation of phenolic compounds during drying within 50–60 °C temperature [50].

3.8. The Antioxidant Activity of Apricot Fruit and Its Candied Products

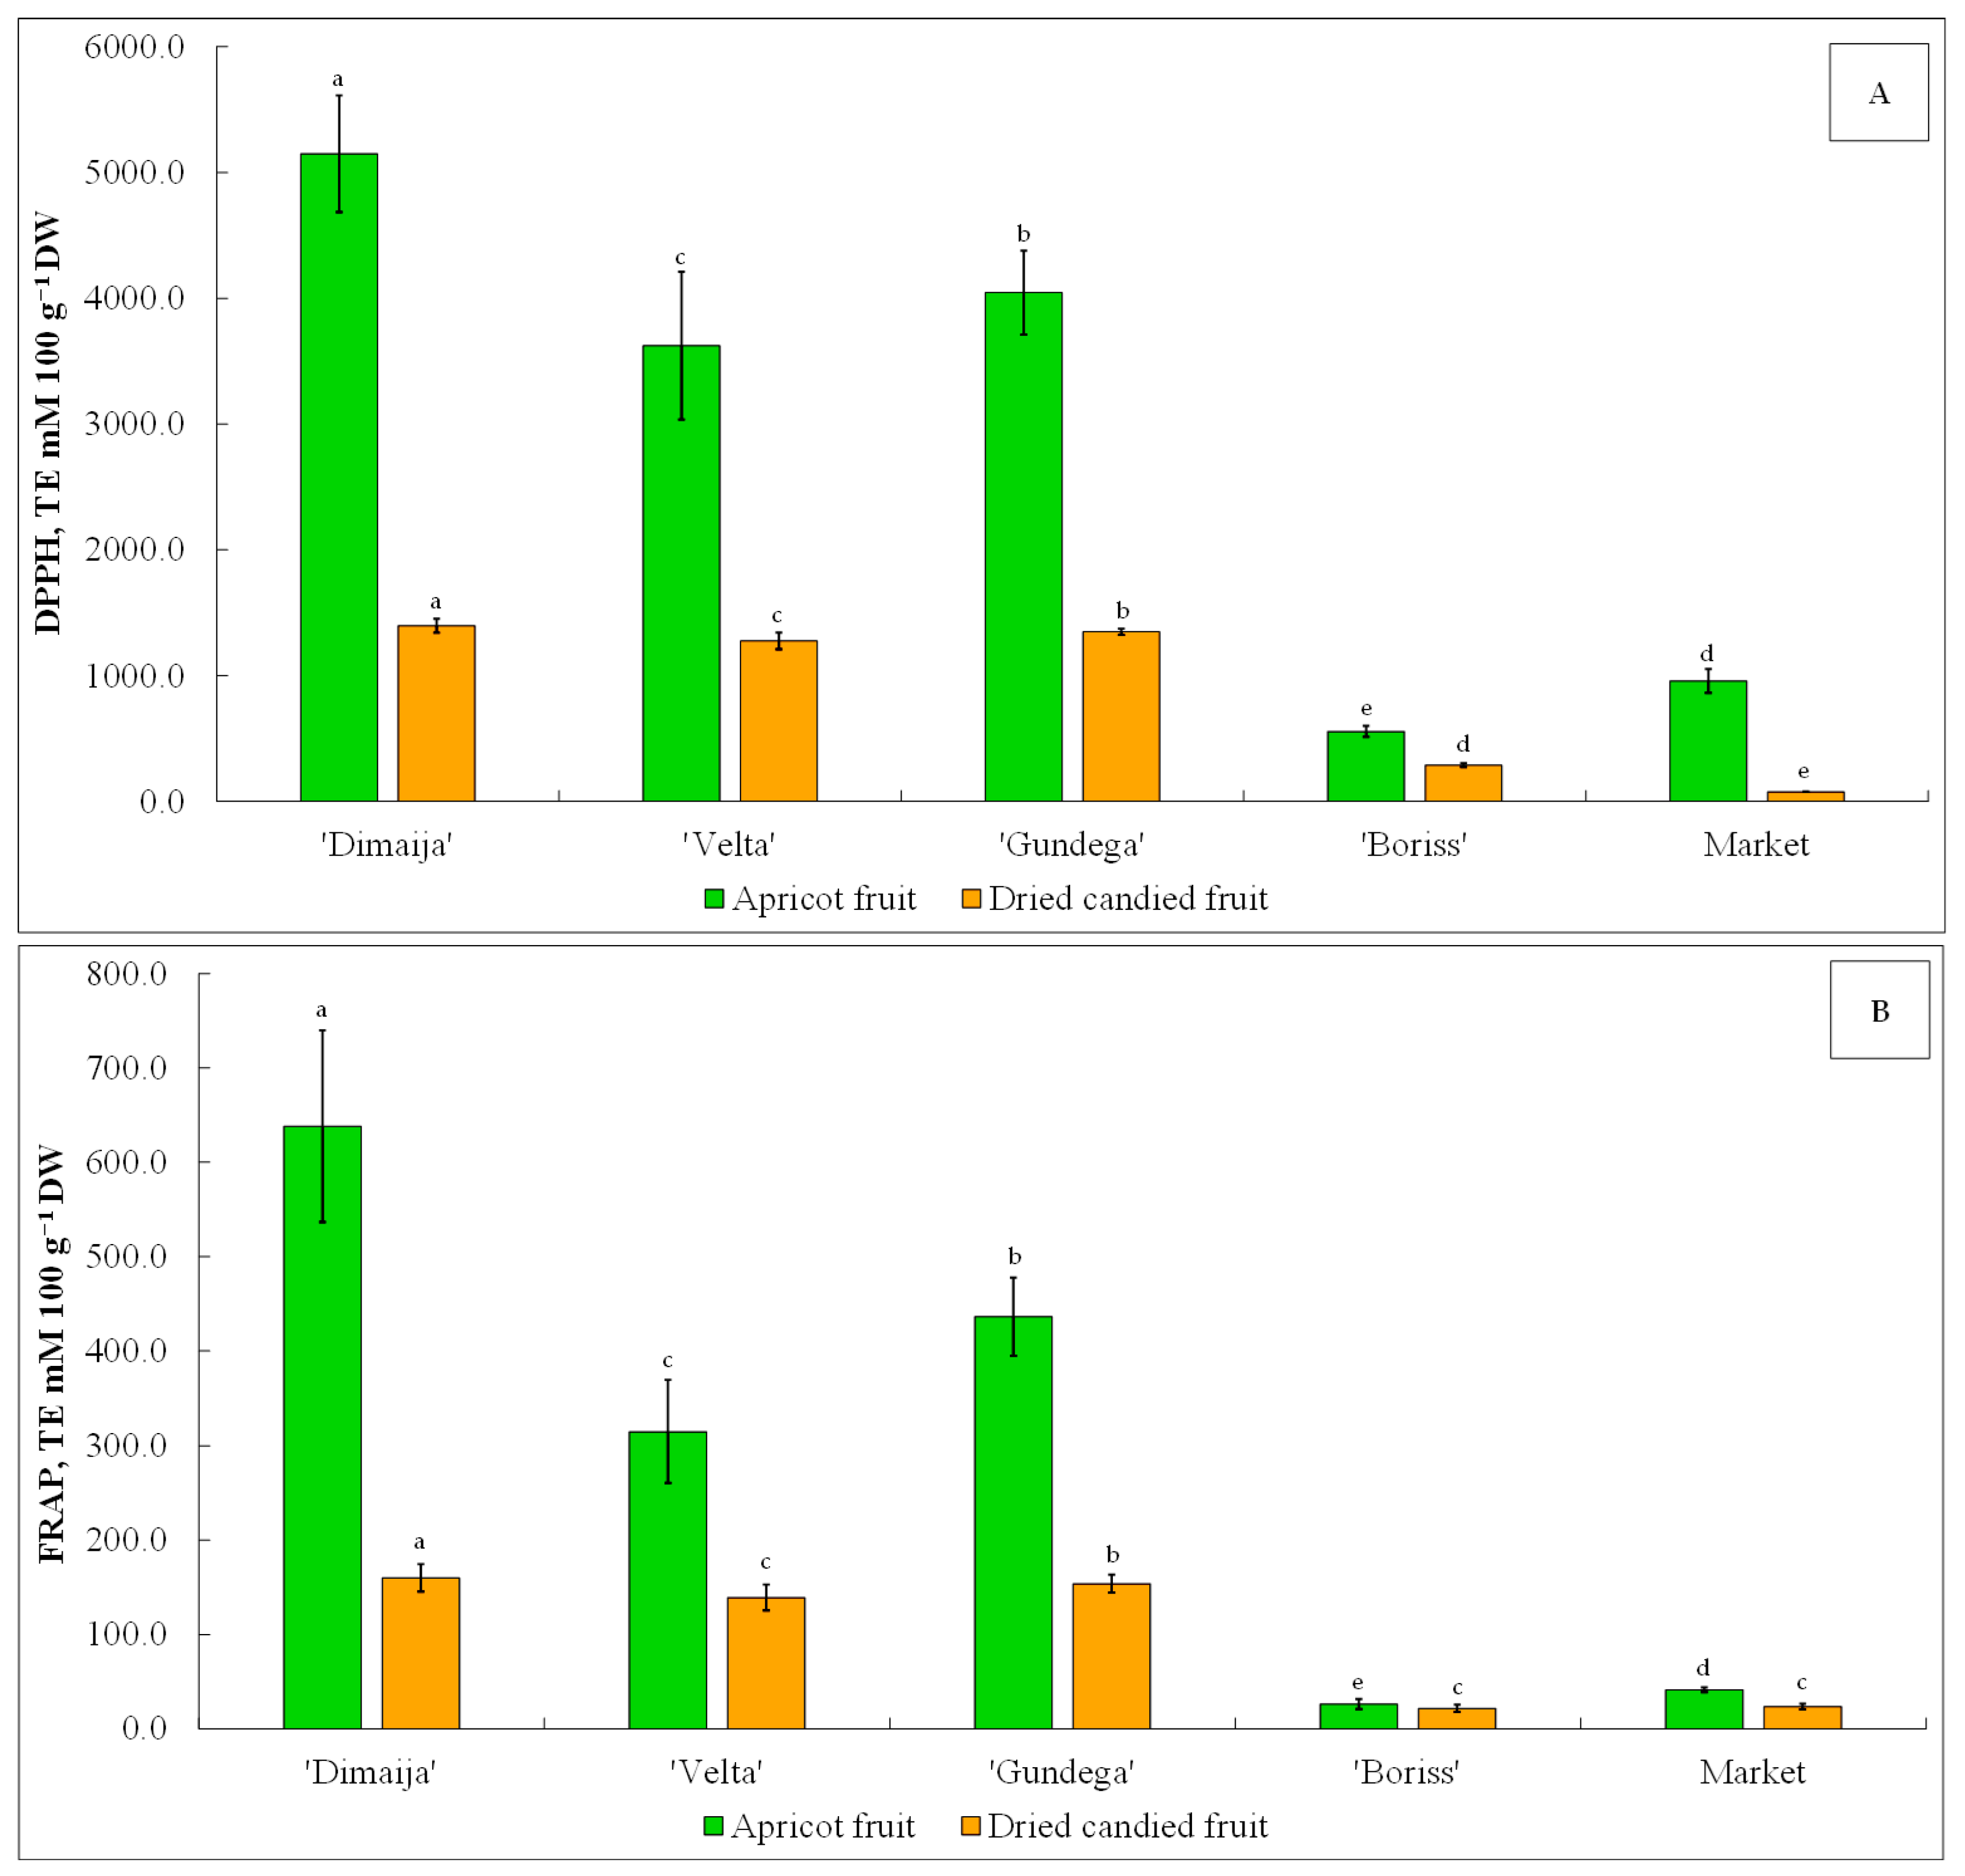
The DPPH radical scavenging activity of the apricot fruit showed values ranging between 556.4 and 5149.2 mM TE 100 g−1 DW, with cv. ‘Dimaija’ apricot fruit having the highest AOA, with cv. ‘Boriss’ apricot fruit having the lowest (Figure 4A). The observed values are inconsistent with those reported by Cirillo et al. [31] for 12 Vesuvian apricot accessions. The decrease in the content of hydrophilic and lipophilic antioxidants resulted in weak AOA of the elaborated DCF products. The DPPH radical scavenging activity of the DCF showed values ranging between 76.8 and 1396.8 mM TE 100 g−1 DW, with product from cv. ‘Dimaija’ apricot fruit having the highest AOA and product from market apricot fruit having the lowest. The results are inconsistent with those reported by Madrau et al. [38], highlighting a substantial increase in the AOA of dried apricot fruit compared with fresh fruit. The authors attributed the increase in AOA of dried apricots to the increase in phenolic compounds and the formation of Maillard reaction products, which are known to have remarkable antioxidant activity. However, the formation of these products at a temperature of 50 °C and pH 2 is unlikely due to the relatively low reactivity between the sugar and the amino group [91]. In a study by Vega-Gálvez et al. [64], a decrease in AOA was observed after subjecting apricot fruit to drying by convection in the range of 40–80 °C temperature, where the most severe decline in AOA was observed after 80 °C temperature exposure.
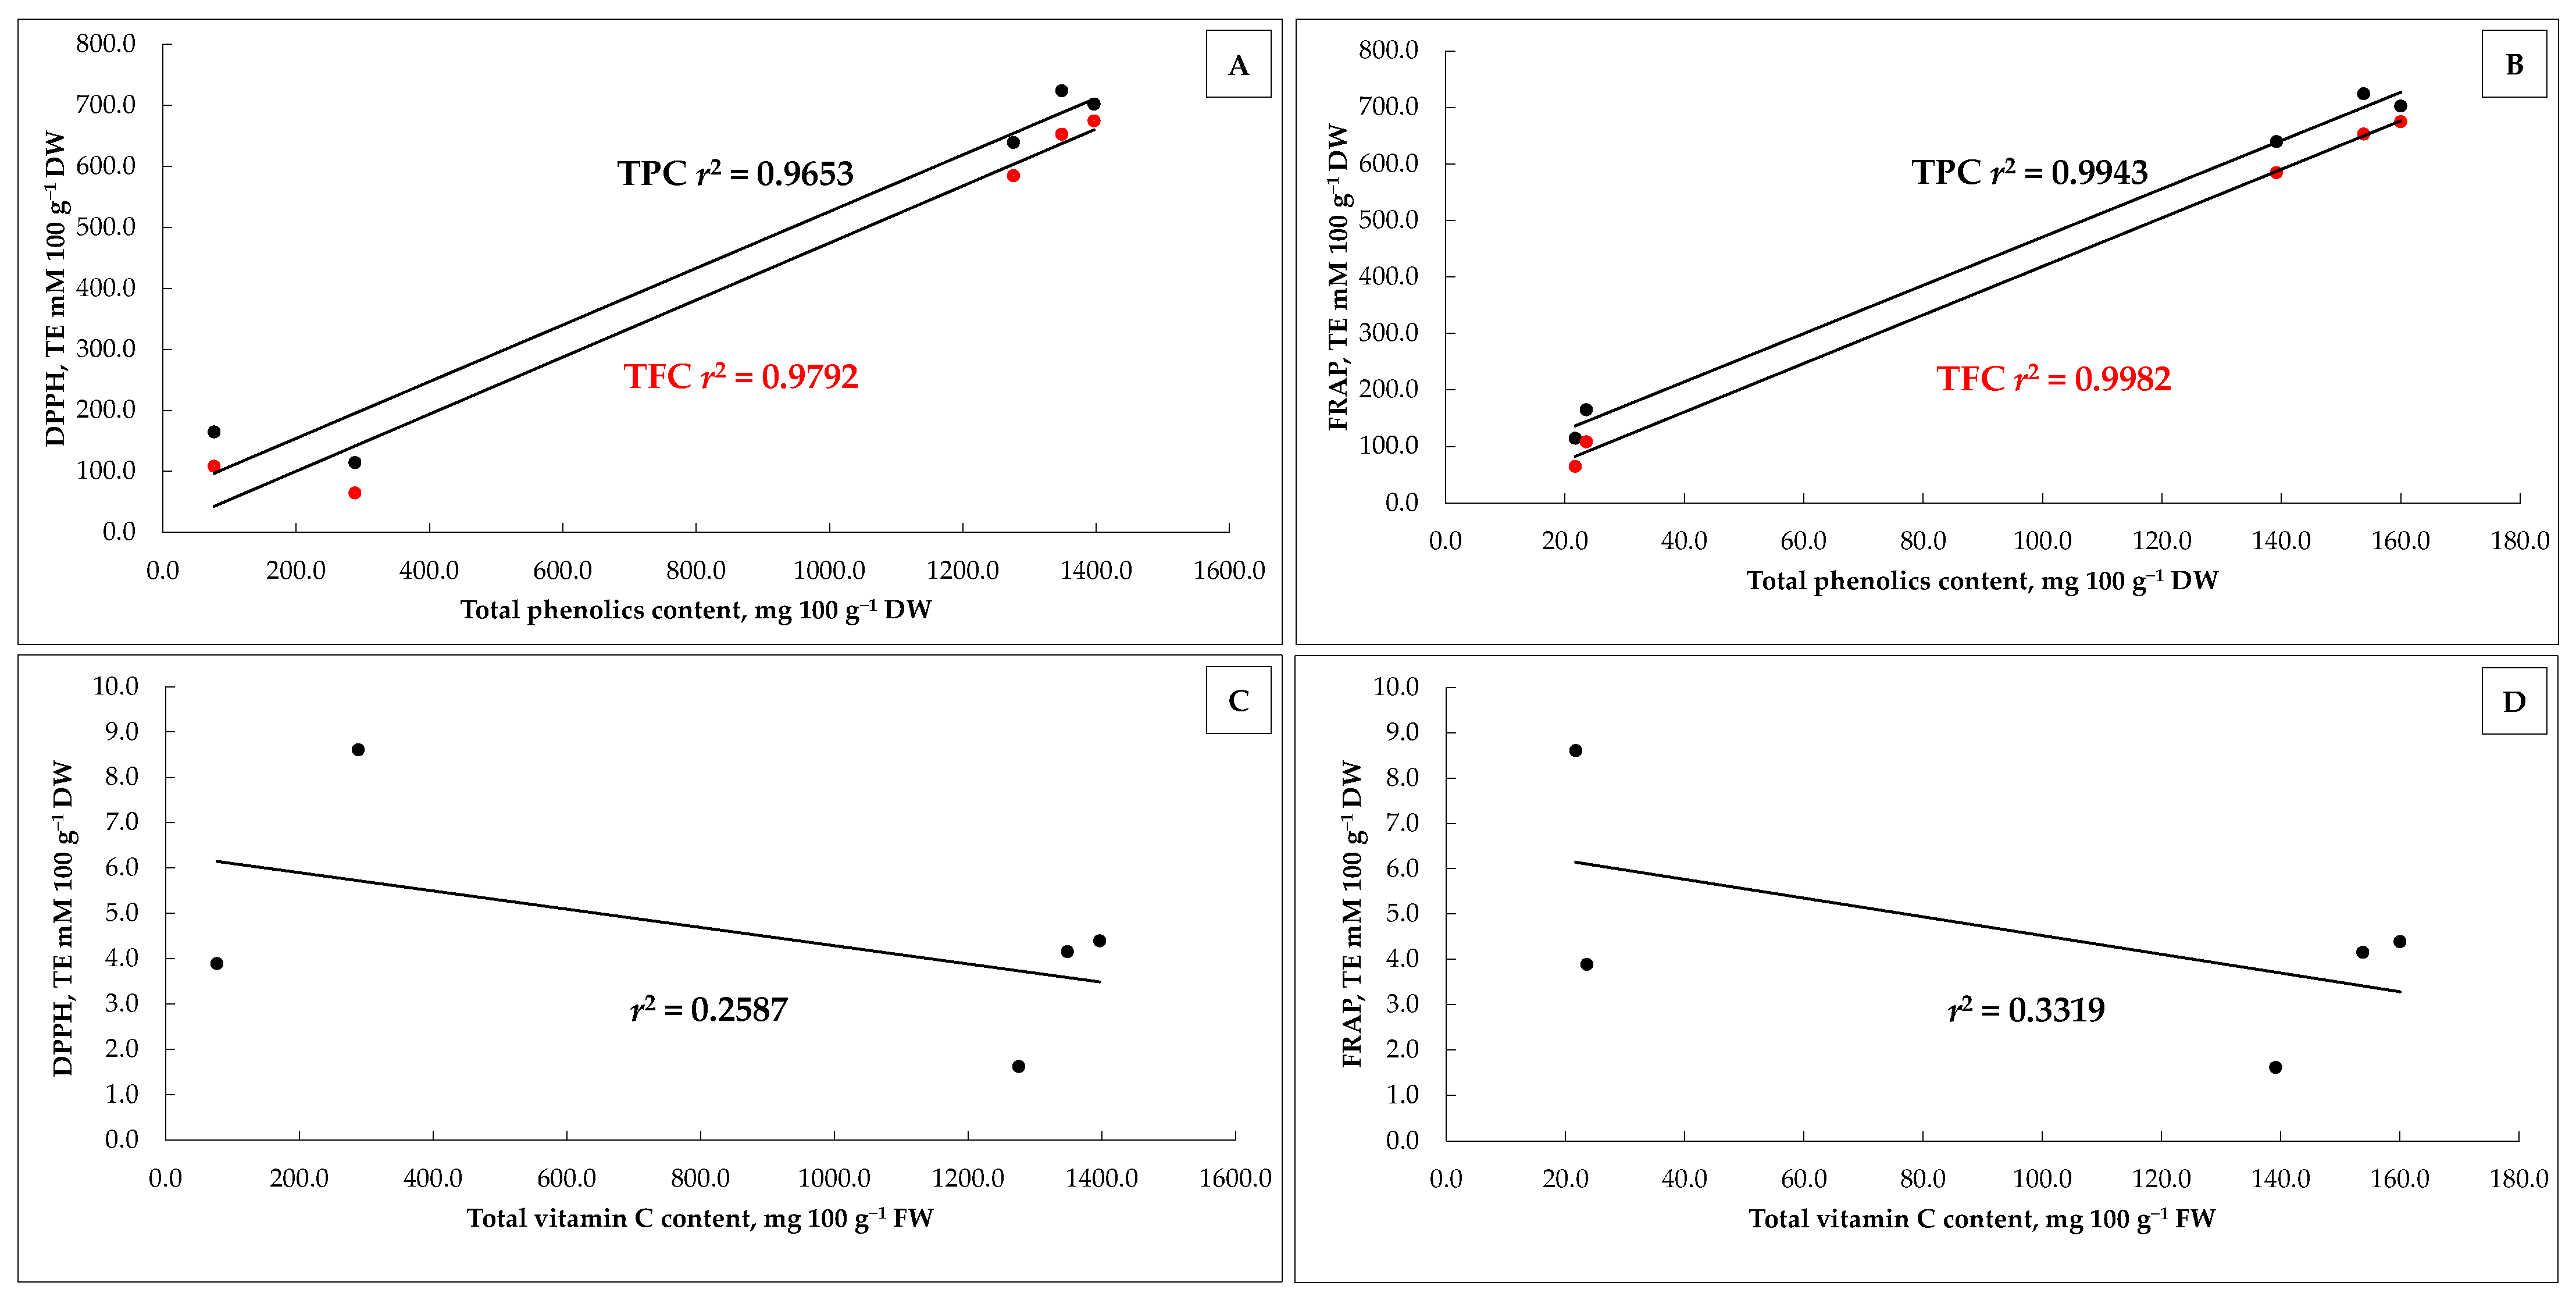
The results of DPPH values were shown to have a strong positive correlation with TPC and TFC of DCF products, corresponding to regression coefficients equal to r2 = 0.9653 and r2 = 0.9792, respectively (Figure 5A). The weakest negative correlation was observed between DPPH values and the content of Vit C in DCF products, corresponding to r2 = 0.2582 (Figure 5C). This observation is reinforced by an earlier report by Domínguez-Perles et al. [92], revealing a negative correlation between Vit C and DPPH values of broccoli byproducts and a strong positive correlation between DPPH values and those of phenolics obtained by chromatographic analysis.
When analyzing FRAP values, relatively lower but still significant AOA is observed. The AOA of the apricot fruit ranged between 26.2 and 638.2 mM TE 100 g−1 DW, with cv. ‘Dimaija’ fruit having the highest AOA and cv. ‘Boriss’ fruit having the lowest (Figure 4B). The observed FRAP values align with those reported by Davarynejad et al. [93] for nine apricot cultivars grown under soft meteorological conditions in Hungary. As in the case of DPPH, the AOA estimated that using the FRAP approach revealed a substantial negative effect of osmotic dehydration and convective drying on the AOA of apricot fruit. The AOA in developed DCF products varied from 21.7 to 160.0 mM TE 100 g−1 DW, with product from cv. ‘Dimaija’ fruit having the highest value and cv. ‘Boriss’ having the lowest. The observed AOA are substantially lower than that reported by Deng et al. [66] for apricots dried by hot air impingement dryer at 65 °C. The results of FRAP values additionally support the AOA acquired by the DPPH screening method, revealing a strong positive correlation between TPC and TFC of DCF products with FRAP values, corresponding to regression coefficients equal to r2 = 0.9943 and r2 = 0.9982, respectively (Figure 5B). The correlation between FRAP values and the content of Vit. C in DCF products similar to DPPH remains negative and weak, corresponding to r2 = 0.3319 (Figure 5D).

3.9. Sensory Evaluation of Candied Products

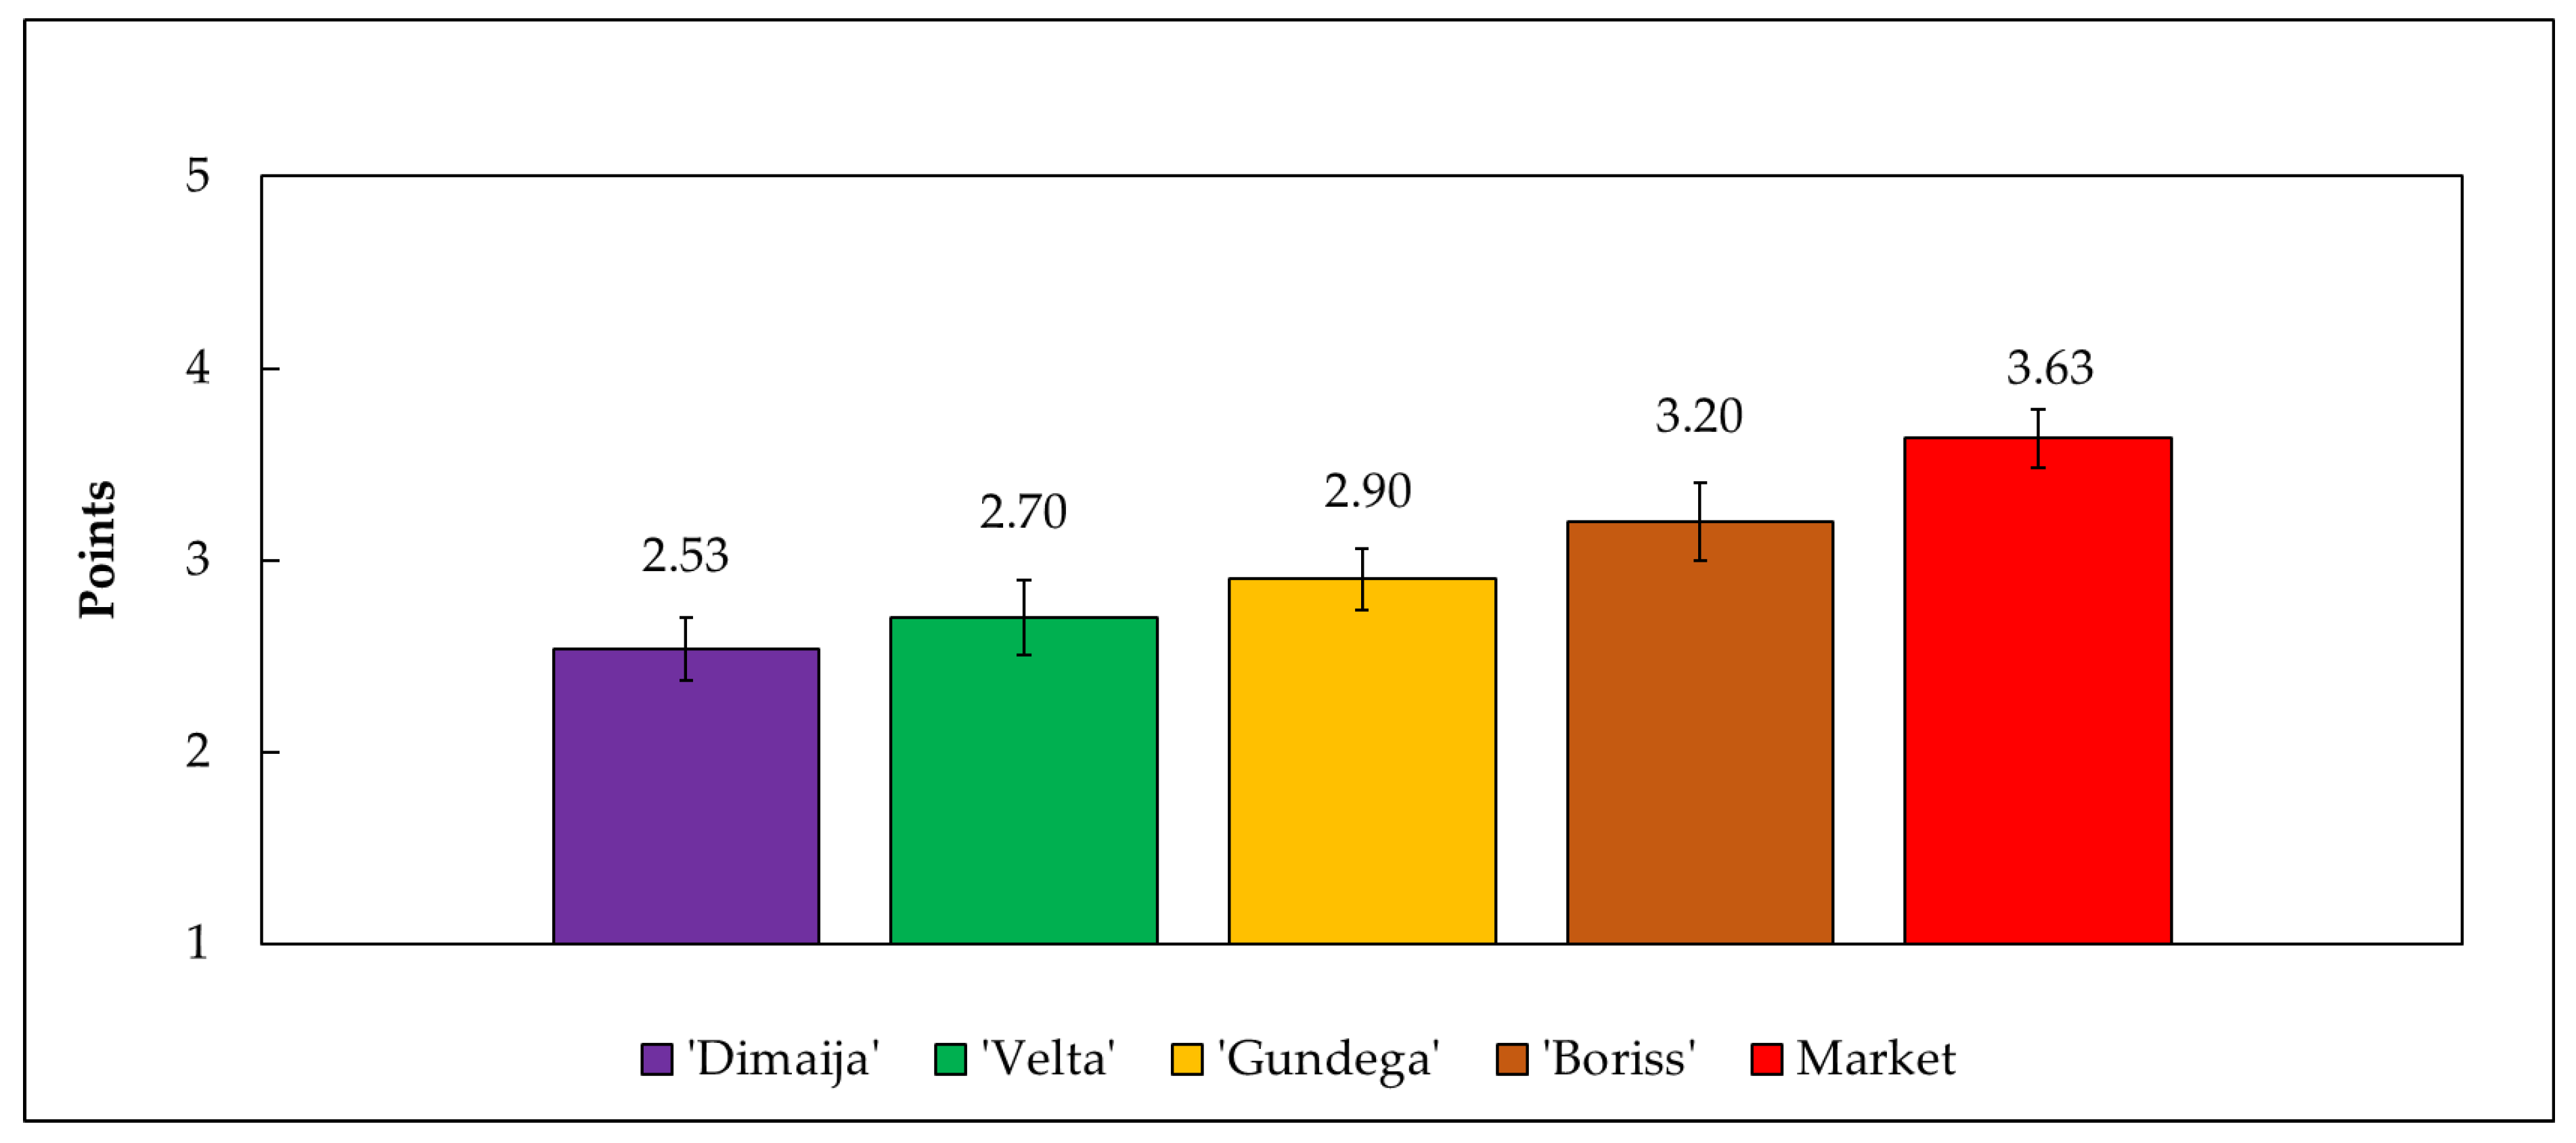
Sensory evaluation utilizing a 12-point line scale and a 5-point hedonic scale was performed to assess the color, appearance, taste, sweetness, sourness, texture, and overall acceptability of DCF developed by osmotic dehydration and convective drying. The 12-point line scale evaluation results are given in Figure 6, whereas overall acceptability is depicted in Figure 7. From the obtained results, it could be seen that all quality attributes of apricot product made from the market fruit and fruit of the cv. ‘Boriss’ except texture, received scores greater than 8, ranging from “neither like nor dislike” and “like very much”. The panelists highlighted that the DCF from the market had remarkable flavor with a distinctive honey taste and good texture, which is neither hard nor soft. In some cases, the predominance of taste brought from JQ, not the apricots themselves, was noted, conditioned by using JQ syrup as a hypertonic solution during osmotic dehydration. The panelists noted the rich color and overall appearance of this product. Positive feedback was also received regarding the DCF product from the cv. ‘Boriss’ fruit, with an average score of 8.6 points. The panelists indicated a good balance between sourness and sweetness, with a distinct taste. However, the hardness of the developed DCF product was marked in most cases. The panelists also recognized this product as attractive due to its intense color and distinctive taste. The DCF product made from the cv. ‘Gundega’ fruit received lower scores due to remarkable sourness, but it was 8.3 points on average. The panelists underlined remarkable color and appearance. In some cases, bitterness and sharpness were indicated. Astringency and bitterness are the taste properties most often associated with phenolic compounds [94,95]. In a more detailed chemosensory analysis of Soares et al. [96], the contribution of E-CTC among six polyphenol compounds towards the activation of three receptors, TAS2R4, TAS2R5, and TAS2R39, those responsible for the bitter taste in humans, has been highlighted. According to this statement and following the data obtained while profiling individual phenolic compounds, the bitter taste of DCF product made from the fruit of the cv. ‘Gundega’ might be assigned to E-CTC, which was found to be the most prevalent compound in both fruit and product.
The developed DCF product from the cv. ‘Dimaija’ fruit was highlighted for its remarkable color and appearance; however, such attributes as taste, sweetness, sourness, and texture received 6.5 points on average, corresponding to “neither like nor dislike”. The product lacks a fruity taste and aroma, and a bitter taste takes prevalence. Along with E-CTC, this product also contains high amounts of CGA and NCGA acids, which are also responsible for the bitter taste [97]. The DCF product developed from the cv. ‘Velta’ fruit was assessed similarly to a product made from cv. ‘Dimaija’ fruit, corresponding to 7.4 points on average. The panelists unanimously noted this product’s strong, distinctly sour taste with a spicy aftertaste. Moreover, it was also highlighted that the product resembles marmalade. In general, the panelists preferred the product developed from apricot fruit obtained from the market, followed by the fruit of cv. ‘Boriss’. The overall acceptability values corresponded to 3.6 and 3.2 points, respectively (Figure 7).
It should be admitted that the rated by panelists products from apricot fruit of cv. ‘Dimaija’, ‘Velta’, and ‘Gundega’ have the lowest scores due to distinctive bitterness and spice aftertaste attributed to bitter- and astringe-related compounds. These compounds are also responsible for outstanding radical scavenging activity, as reported by Radenkovs et al. [23], conducting an on-line HPLC-DPPH analysis of individual polyphenolic compounds.

4. Conclusions

The analysis of the physical–chemical characteristics of apricot fruit revealed relative fluctuations in total soluble solids and acids content. According to the determined maturity index, the apricot fruit of the cv. ‘Boriss’ and those obtained from the market of Greek origin were the most mature compared to the cv. ‘Velta’ and cv. ‘Dimaija’. Osmotic dehydration and convective drying caused the substantial depletion of organic acid in dried candied fruit products (DCF), primarily due to migration from partially solubilized and disrupted cells of fruit to the hypertonic solution of Japanese quince syrup. The abundance of sucrose and, to a lesser extent, glucose, fructose, and sorbitol in apricot fruit and developed DCF was confirmed. The highest content of total sugars was found in DCF made from apricots of cv. ‘Gundega’ and the lowest content was found in cv. ‘Boriss’ fruit. The remarkable composition of group compounds, i.e., phenolics, flavonoids, and vitamin C, was observed in the cv. ‘Dimaija’, followed by ‘Gundega’ and ‘Velta’ grown in Latvia, whereas the lowest values were found in cv. ‘Boriss’ and fruit from the market. Apricot drying resulted in the loss of phytochemicals, especially those susceptible to decomposition under thermal exposure. The most considerable loss was observed for vitamin C and total carotenoids, corresponding to 95.3% and 87.6%, respectively. Amongst the 13 individual phenolics detected, the catechin and epicatechin content due to osmotic and convective drying increased by 59.5% and 255.64% compared with the raw fruit, respectively. In turn, the content of rutin and chlorogenic acid decreased by 63.8% and 20.8%, respectively, on average. The decrease in the content of hydrophilic and lipophilic compounds confirmed by total phenolics, flavonoids, and carotenoids values resulted in weak antioxidant activity of the elaborated DCF products. The decline in the content of phytochemicals was also conditioned by the physical migration of the cell components to the hypertonic solution. Overall, panelists responded positively to the main quality attributes of the developed dried candied fruit. However, the outstanding quality has been highlighted for DCF made from the market fruit, followed by the fruit of the cv. ‘Boriss’ and ‘Gundega’. The distinctive bitterness of DCF made from apricot fruit of cv. ‘Dimaija’ and ‘Velta’ was emphasized by panelists. Given the results obtained, one can conclude that the elaborated products can be regarded as functional food; however, due to the high sugar content, their consumption should be in moderation. The continuation of this study is needed to address the impact of meteorological conditions on the content of phytochemicals in apricot fruit. Moreover, the influence of hypertonic solutions with different compositions for fruit dehydration must be elucidated.

Supplementary Materials

The following supporting information can be downloaded at: https://www.mdpi.com/article/10.3390/horticulturae10030205/s1, Figure S1: Extracted ion chromatogram (EIC) in multiple reaction monitoring (MRM) mode represents the profile of major phenolic compounds detected in raw apricot fruit of cultivar ‘Dimaija’; Figure S2: Extracted ion chromatogram (EIC) in multiple reaction monitoring (MRM mode represents the profile of major phenolic compounds detected in dried candied apricot product of cultivar ‘Velta’; Table S1: Multiple reaction monitoring (MRM) transitions, collision energy, Q1, Q3 and dwell time for investigated phenolic compounds.

Author Contributions

Conceptualization, K.J.-R. and V.R.; data curation, D.S., E.K. and V.R.; formal analysis, K.J-R., I.K. and V.R.; investigation, K.J.-R., I.K. and V.R.; methodology, K.J-R., I.K. and V.R.; resources, I.G., A.V. and V.R.; software, V.R.; visualization, K.J-R. and V.R.; writing—original draft, V.R.; writing—review and editing, K.J.-R., D.S., E.K., I.G. and V.R. All authors have read and agreed to the published version of the manuscript.

Funding

This study was supported by The Ministry of Agriculture of the Republic of Latvia No. 10.9.1-11/23/1654-e “Horticultural crop breeding program for the development of breeding material to support the conventional, integrated and organic agricultural crop production technologies”.

Institutional Review Board Statement

Not applicable.

Informed Consent Statement

Not applicable.

Data Availability Statement

Data are contained within the article.

Conflicts of Interest

Authors declare that the research was conducted in the absence of any commercial or financial relationships that could be construed as a potential conflict of interest.

References

  1. Domínguez, J.M. Drying. In Comprehensive Biotechnology, 2nd ed.; Moo-Young, M., Ed.; Elsevier Inc.: Amsterdam, The Netherlands, 2011; Volume 2, pp. 727–735. ISBN 9780080885049. [Google Scholar]
  2. Calín-Sánchez, Á.; Lipan, L.; Cano-Lamadrid, M.; Kharaghani, A.; Masztalerz, K.; Carbonell-Barrachina, A.; Figiel, A. Comparison of traditional and novel drying techniques and its effect on quality of fruits, vegetables and aromatic herbs. Foods 2020, 9, 1261. [Google Scholar] [CrossRef] [PubMed]
  3. Alegbeleye, O.; Odeyemi, O.A.; Strateva, M.; Stratev, D. Microbial spoilage of vegetables, fruits and cereals. Appl. Food Res. 2022, 2, 100122. [Google Scholar] [CrossRef]
  4. Kumar, S.; Kumar, R.; Pal, A.; SinghChopra, D. Enzymes. In Postharvest Physiology and Biochemistry of Fruits and Vegetables; Yahia, E., Ed.; Elsevier Inc.: Amsterdam, The Netherlands, 2018; pp. 335–358. ISBN 9780128132784. [Google Scholar]
  5. Petikirige, J.; Karim, A.; Millar, G. Effect of drying techniques on quality and sensory properties of tropical fruits. Int. J. Food Sci. Technol. 2022, 57, 6963–6979. [Google Scholar] [CrossRef]
  6. Mahayothee, B.; Thamsala, T.; Khuwijitjaru, P.; Janjai, S. Effect of drying temperature and drying method on drying rate and bioactive compounds in cassumunar ginger (Zingiber montanum). J. Appl. Res. Med. Aromat. Plants 2020, 18, 100262. [Google Scholar] [CrossRef]
  7. Veleșcu, I.; Rațu, R.; Arsenoaia, V.-N.; Roșca, R.; Cârlescu, P.; Țenu, I. Research on the process of convective drying of apples and apricots using an original drying installation. Agriculture 2023, 13, 820. [Google Scholar] [CrossRef]
  8. Krasnova, I.; Seglina, D.; Pole, V. The effect of pre-treatment methods on the quality of dehydrated candied Japanese quince fruits during storage. J. Food Sci. Technol. 2018, 55, 4468–4476. [Google Scholar] [CrossRef]
  9. Yadav, A.K.; Singh, S.V. Osmotic dehydration of fruits and vegetables: A review. J. Food Sci. Technol. 2014, 51, 1654–1673. [Google Scholar] [CrossRef] [PubMed]
  10. Juhnevica, K.; Ruisa, S.; Seglina, D.; Krasnova, I. Evaluation of sour cherry cultivars grown in Latvia for production of candied fruits. In Proceedings of the 6th Baltic Conference on Food Science and Technology: Innovations for Food Science and Production, FOODBALT-2011—Conference Proceedings, Jelgava, Latvia, 5–6 May 2011; pp. 19–22. [Google Scholar]
  11. Alajil, O.; Sagar, V.R.; Kaur, C.; Rudra, S.G.; Sharma, R.R.; Kaushik, R.; Verma, M.K.; Tomar, M.; Kumar, M.; Mekhemar, M. Nutritional and phytochemical traits of apricots (Prunus armeniaca L.) for application in nutraceutical and health industry. Foods 2021, 10, 1344. [Google Scholar] [CrossRef]
  12. Srednicka-Tober, D.; Kazimierczak, R.; Ponder, A.; Hallmann, E. Biologically active compounds in selected organic and conventionally produced dried fruits. Foods 2020, 9, 1005. [Google Scholar] [CrossRef]
  13. Sakooei-Vayghan, R.; Peighambardoust, S.H.; Hesari, J.; Soltanzadeh, M.; Peressini, D. Properties of dried apricots pretreated by ultrasound-assisted osmotic dehydration and application of active coatings. Food Technol. Biotechnol. 2020, 58, 249–259. [Google Scholar] [CrossRef]
  14. Jing, Y.; Ma, X.; Jin, P.; Zhu, X. Effects of harvest maturity on chilling injury and storage quality of apricots. J. Food Qual. 2018, 2018, 4954931. [Google Scholar] [CrossRef]
  15. Mozaffari, M.; Sadeghi, S.; Asefi, N. Prediction of the quality properties and maturity of apricot by laser light backscattering imaging. Postharvest Biol. Technol. 2022, 186, 111842. [Google Scholar] [CrossRef]
  16. FAOSTAT. Global Crops Production Quantity of Apricots. Available online: https://www.fao.org/faostat/en/#data/QCL (accessed on 18 January 2024).
  17. Dried Fruit: Production Estimates for 2022/2023. Available online: https://www.mundus-agri.eu/news/dried-fruit-production-estimates-20222023.n28617.html (accessed on 18 January 2024).
  18. Kaufmane, E.; Lacis, G. Studies on selection of apricots and peaches with good fruit quality and winterhardiness in Latvia. J. Fruit Ornam. Plant Res. 2004, 12, 321–329. [Google Scholar]
  19. Howard, L.R.; Braswell, D.D.; Aselage, J. Chemical composition and color of strained carrots as affected by processing. J. Food Sci. 1996, 61, 327–330. [Google Scholar] [CrossRef]
  20. Singleton, V.; Orthofer, R.; Maluela-Raventos, R. Analysis of total phenols and other oxidation substrates and antioxidants by means of Folin–Ciocalteu reagent. Methods Enzymol. 1999, 299, 152–178. [Google Scholar] [CrossRef]
  21. Yang, H.; Kim, Y.J.; Shin, Y. Influence of ripening stage and cultivar on physicochemical properties and antioxidant compositions of aronia grown in South Korea. Foods 2019, 8, 598. [Google Scholar] [CrossRef] [PubMed]
  22. Mallek-Ayadi, S.; Bahloul, N.; Baklouti, S.; Kechaou, N. Bioactive compounds from Cucumis melo L. fruits as potential nutraceutical food ingredients and juice processing using membrane technology. Food Sci. Nutr. 2022, 10, 2922–2934. [Google Scholar] [CrossRef]
  23. Radenkovs, V.; Püssa, T.; Juhnevica-Radenkova, K.; Kviesis, J.; Salar, F.J.; Moreno, D.A.; Drudze, I. Wild apple (Malus spp.) by-products as a source of phenolic compounds and vitamin C for food applications. Food Biosci. 2020, 38, 100744. [Google Scholar] [CrossRef]
  24. Radenkovs, V.; Kviesis, J.; Juhnevica-Radenkova, K.; Valdovska, A.; Püssa, T.; Klavins, M.; Drudze, I. Valorization of wild apple (Malus spp.) by-products as a source of essential fatty acids, tocopherols and phytosterols with antimicrobial activity. Plants 2018, 7, 90. [Google Scholar] [CrossRef] [PubMed]
  25. Ruiz, R.P. Gravimetric Measurements of Water. In Handbook of Food Analytical Chemistry, Water, Proteins, Enzymes, Lipids, and Carbohydrates; Wrolstad, R.E., Acree, T.E., Decker, E.A., Penner, M.H., Reid, D.S., Schwartz, S.J., Shoemaker, C.F., Smith, D., Sporns, P., Eds.; John Wiley and Sons Inc.: Hoboken, NJ, USA, 2005; pp. 5–33. ISBN 9780471709084. [Google Scholar]
  26. ISO 2173:2003; Fruit and Vegetable Products, Determination of Soluble Solids, Refractometric Method. International Standardization Organization: Geneva, Switzerland. Available online: https://www.iso.org/standard/35851.html (accessed on 10 January 2024).
  27. ISO 750:1998; Fruit and Vegetable Products, Determination of Titratable Acidity. International Standardization Organization: Geneva, Switzerland. Available online: https://www.iso.org/standard/22569.html (accessed on 10 January 2024).
  28. Radenkovs, V.; Juhnevica-Radenkova, K.; Kviesis, J.; Lazdina, D.; Valdovska, A.; Vallejo, F.; Lacis, G. Lignocellulose-degrading enzymes: A biotechnology platform for ferulic acid production from agro-industrial side streams. Foods 2021, 10, 3056. [Google Scholar] [CrossRef] [PubMed]
  29. EN 14130:2003; Foodstuffs—Determination of Vitamin C by HPLC. European Standard: Brussels, Belgium. Available online: https://standards.iteh.ai/catalog/standards/cen/15d21027-d891-4ab0-aaea-5d87c7cc39b7/en-14130-2003 (accessed on 1 January 2024).
  30. ISO 13299:2016; Sensory Analysis Methodology, General Guidance for Establishing a Sensory Profile. International Standardization Organization: Geneva, Switzerland. Available online: https://www.iso.org/standard/58042.html (accessed on 10 January 2024).
  31. Cirillo, A.; De Luca, L.; Izzo, L.; Cepparulo, M.; Graziani, G.; Ritieni, A.; Romano, R.; Di Vaio, C. Biochemical and nutraceutical characterization of different accessions of the apricot (Prunus armeniaca L.). Horticulturae 2023, 9, 546. [Google Scholar] [CrossRef]
  32. Rampáčková, E.; Mrázová, M.; Čížková, J.; Nečas, T. Pomological traits and genome size of Prunus armeniaca L. Considering to geographical origin. Horticulturae 2022, 8, 199. [Google Scholar] [CrossRef]
  33. Abu-shama, H.S.; Ahmed, F.A.; Abd El-magied, H.E. Assessment of jelly candy manufactured from prickly pear fruits (Opuntia Spp.). World J. Adv. Res. Rev. 2022, 16, 767–783. [Google Scholar] [CrossRef]
  34. Kuo, C.H.; Lin, J.; Huang, C.Y.; Hsieh, S.L.; Li, S.; Kuo, J.M.; Shieh, C.J. Predicting sugar content of candied watermelon rind during osmotic dehydration. Food Sci. Technol. 2018, 38, 228–235. [Google Scholar] [CrossRef]
  35. Melgarejo, P.; Calín-Sánchez, Á.; Carbonell-Barrachina, Á.A.; Martínez-Nicolás, J.J.; Legua, P.; Martínez, R.; Hernández, F. Antioxidant activity, volatile composition and sensory profile of four new very-early apricots (Prunus armeniaca L.). J. Sci. Food Agric. 2014, 94, 85–94. [Google Scholar] [CrossRef]
  36. Radenkovs, V.; Kaufmane, E.; Rubauskis, E.; Segliņa, D. Preliminary results on the effect of 1-methylcyclopropene on quality of plums grown in Latvia. Proc. Latv. Acad. Sci. Sect. B Nat. Exact Appl. Sci. 2016, 70, 21–28. [Google Scholar] [CrossRef]
  37. Leccese, A.; Bartolini, S.; Viti, R. From genotype to apricot fruit quality: The Antioxidant properties contribution. Plant Foods Hum. Nutr. 2012, 67, 317–325. [Google Scholar] [CrossRef]
  38. Madrau, M.A.; Piscopo, A.; Sanguinetti, A.M.; Del Caro, A.; Poiana, M.; Romeo, F.V.; Piga, A. Effect of drying temperature on polyphenolic content and antioxidant activity of apricots. Eur. Food Res. Technol. 2009, 228, 441–448. [Google Scholar] [CrossRef]
  39. Kucner, A.; Klewicki, R.; Sójka, M.; Klewicka, E. Osmotic concentration of gooseberry fruits—The influence of temperature, time and pretreatment methods on mass transfer and total polyphenol and organic acid content. Food Technol. Biotechnol. 2014, 52, 411–419. [Google Scholar] [CrossRef]
  40. Drogoudi, P.D.; Vemmos, S.; Pantelidis, G.; Petri, E.; Tzoutzoukou, C.; Karayiannis, I. Physical characters and antioxidant, sugar, and mineral nutrient contents in fruit from 29 apricot (Prunus armeniaca L.) cultivars and hybrids. J. Agric. Food Chem. 2008, 56, 10754–10760. [Google Scholar] [CrossRef]
  41. Chen, T.; Zhang, Z.; Li, B.; Qin, G.; Tian, S. Molecular basis for optimizing sugar metabolism and transport during fruit development. aBIOTECH 2021, 2, 330–340. [Google Scholar] [CrossRef]
  42. Zhou, H.; Su, M.; Du, J.; Zhang, X.; Li, X.; Zhang, M.; Hu, Y.; Huan, C.; Ye, Z. Crucial roles of sorbitol metabolism and energy status in the chilling tolerance of yellow peach. Plant Physiol. Biochem. 2023, 204, 108092. [Google Scholar] [CrossRef]
  43. dos Reis, S.P.; Lima, A.M.; de Souza, C.R.B. Recent molecular advances on downstream plant responses to abiotic stress. Int. J. Mol. Sci. 2012, 13, 8628–8647. [Google Scholar] [CrossRef] [PubMed]
  44. Farag, M.A.; Ramadan, N.S.; Shorbagi, M.; Farag, N.; Gad, H.A. Profiling of primary metabolites and volatiles in apricot (Prunus armeniaca L.) seed kernels and fruits in the context of its different cultivars and soil type as analyzed using chemometric tools. Foods 2022, 11, 1339. [Google Scholar] [CrossRef] [PubMed]
  45. García-Gómez, B.E.; Ruiz, D.; Salazar, J.A.; Rubio, M.; Martínez-García, P.J.; Martínez-Gómez, P. Analysis of metabolites and gene expression changes relative to apricot (Prunus armeniaca L.) fruit quality during development and ripening. Front. Plant Sci. 2020, 11, 1269. [Google Scholar] [CrossRef] [PubMed]
  46. Schmitzer, V.; Slatnar, A.; Mikulic-Petkovsek, M.; Veberic, R.; Krska, B.; Stampar, F. Comparative study of primary and secondary metabolites in apricot (Prunus armeniaca L.) cultivars. J. Sci. Food Agric. 2011, 91, 860–866. [Google Scholar] [CrossRef]
  47. Naryal, A.; Acharya, S.; Kumar Bhardwaj, A.; Kant, A.; Chaurasia, O.P.; Stobdan, T. Altitudinal effect on sugar contents and sugar profiles in dried apricot (Prunus armeniaca L.) fruit. J. Food Compos. Anal. 2019, 76, 27–32. [Google Scholar] [CrossRef]
  48. Gómez-Martínez, H.; Bermejo, A.; Zuriaga, E.; Badenes, M.L. Polyphenol content in apricot fruits. Sci. Hortic. 2021, 277, 109828. [Google Scholar] [CrossRef]
  49. Wani, S.M.; Masoodi, F.A.; Haq, E.; Ahmad, M.; Ganai, S.A. Influence of processing methods and storage on phenolic compounds and carotenoids of apricots. Lwt 2020, 132, 109846. [Google Scholar] [CrossRef]
  50. Yang, C.P.; Fujita, S.; Ashrafuzzaman, M.D.; Nakamura, N.; Hayashi, N. Purification and characterization of polyphenol oxidase from banana (Musa sapientum L.) pulp. J. Agric. Food Chem. 2000, 48, 2732–2735. [Google Scholar] [CrossRef]
  51. Muñoz-Fariña, O.; López-Casanova, V.; García-Figueroa, O.; Roman-Benn, A.; Ah-Hen, K.; Bastias-Montes, J.M.; Quevedo-León, R.; Ravanal-Espinosa, M.C. Bioaccessibility of phenolic compounds in fresh and dehydrated blueberries (Vaccinium corymbosum L.). Food Chem. Adv. 2023, 2, 100171. [Google Scholar] [CrossRef]
  52. Bousselma, A.; Abdessemed, D.; Tahraoui, H.; Zedame, F.; Amrane, A. Polyphenols and flavonoids contents of fresh and dried apricots extracted by cold soaking and ultrasound-assisted extraction. Kem. Ind. 2023, 72, 160–168. [Google Scholar] [CrossRef]
  53. Gómez-Martínez, H.; Gil-Muñoz, F.; Bermejo, A.; Zuriaga, E.; Badenes, M.L. Insights of phenolic pathway in fruits: Transcriptional and metabolic profiling in apricot (Prunus Armeniaca). Int. J. Mol. Sci. 2021, 22, 3411. [Google Scholar] [CrossRef]
  54. Čanadanović-Brunet, J.M.; Vulić, J.J.; Ćetković, G.S.; Djilas, S.M.; Šaponjac, V.T.T. Bioactive compounds and antioxidant properties of dried apricot. Acta Period. Technol. 2013, 44, 193–205. [Google Scholar] [CrossRef]
  55. Miletić, N.; Mitrović, O.; Popović, B.; Nedović, V.; Zlatković, B.; Kandić, M. Polyphenolic content and antioxidant capacity in fruits of plum (Prunus domestica L.) cultivars “Valjevka” and “Mildora” as influenced by air drying. J. Food Qual. 2013, 36, 229–237. [Google Scholar] [CrossRef]
  56. Patel, P.; Sunkara, R.; Walker, L.T.; Verghese, M. Effect of drying techniques on antioxidant capacity of guava fruit. Food Nutr. Sci. 2016, 7, 544–554. [Google Scholar] [CrossRef]
  57. Ouchemoukh, S.; Hachoud, S.; Boudraham, H.; Mokrani, A.; Louaileche, H. Antioxidant activities of some dried fruits consumed in Algeria. Lwt 2012, 49, 329–332. [Google Scholar] [CrossRef]
  58. Rasanu, N.; Magearu, V.; Matei, N.; Soceanu, A. Determination of vitamin C in different stages of fruits growing. Chimie 2005, 1–2, 167–172. [Google Scholar]
  59. Munzuroglu, O.; Karatas, F.; Geckil, H. The vitamin and selenium contents of apricot fruit of different varieties cultivated in different geographical regions. Food Chem. 2003, 83, 205–212. [Google Scholar] [CrossRef]
  60. Akin, E.B.; Karabulut, I.; Topcu, A. Some compositional properties of main Malatya apricot (Prunus armeniaca L.) varieties. Food Chem. 2008, 107, 939–948. [Google Scholar] [CrossRef]
  61. Fratianni, F.; D’acierno, A.; Albanese, D.; Di Matteo, M.; Coppola, R.; Nazzaro, F. Biochemical characterization of traditional varieties of apricots (Prunus armeniaca L.) of the Campania region, Southern Italy. Foods 2022, 11, 100. [Google Scholar] [CrossRef]
  62. Karatas, N. Evaluation of nutritional content in wild apricot fruits for sustainable apricot production. Sustainability 2022, 14, 1063. [Google Scholar] [CrossRef]
  63. Susanna, B.; Annamaria, L. Quality and antioxidant properties of apricot fruits at ready-to-eat: Influence of the weather conditions under Mediterranean coastal area. J. Food Process Technol. 2016, 7, 538. [Google Scholar] [CrossRef]
  64. Vega-Gálvez, A.; Quispe-Fuentes, I.; Uribe, E.; Martinez-Monzo, J.; Pasten, A.; Lemus-Mondaca, R. Bioactive compounds and physicochemical characterization of dried apricot (Prunus armeniaca L.) as affected by different drying temperatures. CYTA—J. Food 2019, 17, 297–306. [Google Scholar] [CrossRef]
  65. Sakooei-Vayghan, R.; Peighambardoust, S.H.; Hesari, J.; Peressini, D. Effects of osmotic dehydration (with and without sonication) and pectin-based coating pretreatments on functional properties and color of hot-air dried apricot cubes. Food Chem. 2020, 311, 125978. [Google Scholar] [CrossRef] [PubMed]
  66. Deng, L.Z.; Xiong, C.H.; Pei, Y.P.; Zhu, Z.Q.; Zheng, X.; Zhang, Y.; Yang, X.H.; Liu, Z.L.; Xiao, H.W. Effects of various storage conditions on total phenolic, carotenoids, antioxidant capacity, and color of dried apricots. Food Control 2022, 136, 108846. [Google Scholar] [CrossRef]
  67. Ali, S.; Masud, T.; Abbasi, K.S. Physico-chemical characteristics of apricot (Prunus armeniaca L.) grown in Northern areas of Pakistan. Sci. Hortic. 2011, 130, 386–392. [Google Scholar] [CrossRef]
  68. Dragovic-Uzelac, V.; Levaj, B.; Mrkic, V.; Bursac, D.; Boras, M. The content of polyphenols and carotenoids in three apricot cultivars depending on stage of maturity and geographical region. Food Chem. 2007, 102, 966–975. [Google Scholar] [CrossRef]
  69. Pintea, A.; Dulf, F.V.; Bunea, A.; Socaci, S.A.; Pop, E.A.; Opriță, V.A.; Giuffrida, D.; Cacciola, F.; Bartolomeo, G.; Mondello, L. Carotenoids, fatty acids, and volatile compounds in apricot cultivars from Romania—A chemometric approach. Antioxidants 2020, 9, 562. [Google Scholar] [CrossRef]
  70. Wani, S.M.; Masoodi, F.A.; Ahmad, M.; Mir, S.A. Processing and storage of apricots: Effect on physicochemical and antioxidant properties. J. Food Sci. Technol. 2018, 55, 4505–4514. [Google Scholar] [CrossRef]
  71. Souza, C.S.; Daood, H.G.; Duah, S.A.; Vinogradov, S.; Palotás, G.; Neményi, A.; Helyes, L.; Pék, Z. Stability of carotenoids, carotenoid esters, tocopherols and capsaicinoids in new chili pepper hybrids during natural and thermal drying. Lwt 2022, 163, 113520. [Google Scholar] [CrossRef]
  72. Pénicaud, C.; Achir, N.; Dhuique-Mayer, C.; Dornier, M.; Bohuon, P. Degradation of β-carotene during fruit and vegetable processing or storage: Reaction mechanisms and kinetic aspects: A review. Fruits 2011, 66, 417–440. [Google Scholar] [CrossRef]
  73. Morais, H.; Rodrigues, P.; Ramos, C.; Forgács, E.; Cserháti, T.; Oliveira, J. Effect of ascorbic acid on the stability of β-carotene and capsanthin in paprika (Capsicum annuum) powder. Nahrung—Food 2002, 46, 308–310. [Google Scholar] [CrossRef]
  74. Oszmianski, J.; Lee, C.Y. Inhibitory effect of phenolics on carotene bleaching in vegetables. J. Agric. Food Chem. 1990, 38, 688–690. [Google Scholar] [CrossRef]
  75. Shahidi, F.; Ambigaipalan, P. Phenolics and polyphenolics in foods, beverages and spices: Antioxidant activity and health effects—A review. J. Funct. Foods 2015, 18, 820–897. [Google Scholar] [CrossRef]
  76. Pérez, M.; Dominguez-López, I.; Lamuela-Raventós, R.M. The Chemistry behind the Folin–Ciocalteu method for the estimation of (poly)phenol content in food: Total phenolic intake in a Mediterranean dietary pattern. J. Agric. Food Chem. 2023, 71, 17543–17553. [Google Scholar] [CrossRef] [PubMed]
  77. Brglez Mojzer, E.; Knez Hrnčič, M.; Škerget, M.; Knez, Ž.; Bren, U. Polyphenols: Extraction methods, antioxidative action, bioavailability and anticarcinogenic effects. Molecules 2016, 21, 901. [Google Scholar] [CrossRef] [PubMed]
  78. Yang, Y.; Li, W.; Xian, W.; Huang, W.; Yang, R. Free and bound phenolic profiles of Rosa roxburghii Tratt leaves and their antioxidant and inhibitory effects on α-clucosidase. Front. Nutr. 2022, 9, 922496. [Google Scholar] [CrossRef]
  79. Karaçelik, A.A. Phytochemical profiling, antioxidant activities and in vitro/in silico enzyme inhibitory potentials of apricot cultivars grown in Iğdır/Turkey. South African J. Bot. 2023, 156, 257–267. [Google Scholar] [CrossRef]
  80. Gundogdu, M.; Ercisli, S.; Berk, S.; Kan, T.; Canan, I.; Gecer, M.K. Diversity on color and phenolic compounds in apricot fruits. J. Food Meas. Charact. 2017, 11, 2087–2093. [Google Scholar] [CrossRef]
  81. Göttingerová, M.; Kumšta, M.; Rampáčková, E.; Kiss, T.; Nečas, T. Analysis of phenolic compounds and some important analytical properties in selected apricot genotypes. HortScience 2021, 56, 1446–1452. [Google Scholar] [CrossRef]
  82. Tilley, A.; McHenry, M.P.; McHenry, J.A.; Solah, V.; Bayliss, K. Enzymatic browning: The role of substrates in polyphenol oxidase mediated browning: Mechanisms of enzymatic browning. Curr. Res. Food Sci. 2023, 7, 100623. [Google Scholar] [CrossRef]
  83. Roussos, P.A.; Sefferou, V.; Denaxa, N.K.; Tsantili, E.; Stathis, V. Apricot (Prunus armeniaca L.) fruit quality attributes and phytochemicals under different crop load. Sci. Hortic. 2011, 129, 472–478. [Google Scholar] [CrossRef]
  84. Jan, N.; Anjum, S.; Wani, S.M.; Mir, S.A.; Malik, A.R.; Wani, S.A.; Hussein, D.S.; Rasheed, R.A.; Gatasheh, M.K. Influence of canning and storage on physicochemical properties, antioxidant properties, and bioactive compounds of apricot (Prunus armeniaca L.) wholes, halves, and pulp. Front. Nutr. 2022, 9, 850730. [Google Scholar] [CrossRef] [PubMed]
  85. Yu, Y.; Jin, T.Z.; Fan, X.; Wu, J. Biochemical degradation and physical migration of polyphenolic compounds in osmotic dehydrated blueberries with pulsed electric field and thermal pretreatments. Food Chem. 2018, 239, 1219–1225. [Google Scholar] [CrossRef]
  86. Özcan, M.M.; Al Juhaimi, F.; Ahmed, I.A.M.; Uslu, N.; Babiker, E.E.; Ghafoor, K. Effect of microwave and oven drying processes on antioxidant activity, total phenol and phenolic compounds of kiwi and pepino fruits. J. Food Sci. Technol. 2020, 57, 233–242. [Google Scholar] [CrossRef] [PubMed]
  87. Pashazadeh, H.; Ali Redha, A.; Koca, I. Effect of convective drying on phenolic acid, flavonoid and anthocyanin content, texture and microstructure of black rosehip fruit. J. Food Compos. Anal. 2024, 125, 105738. [Google Scholar] [CrossRef]
  88. Chen, J.P.; Wang, Y.; Zhang, X.Y.; Sun, P.; Wu, Z.F.; Shang, Y.F.; Yang, S.H.; Ma, Y.L.; Wei, Z.J. Effect of air drying temperature on the phenolics and antioxidant activity of Xuan-Mugua fruit. Food Sci. Technol. 2022, 42, e45322. [Google Scholar] [CrossRef]
  89. Babiker, E.E.; Mohamed Ahmed, I.A.; Uslu, N.; Özcan, M.M.; Al Juhaimi, F.; Ghafoor, K.; Almusallam, I.A. Influence of drying methods on bioactive properties, fatty acids and phenolic compounds of different parts of ripe and unripe avocado fruits. J. Oleo Sci. 2021, 70, 589–598. [Google Scholar] [CrossRef] [PubMed]
  90. Sochor, J.; Zitka, O.; Skutkova, H.; Pavlik, D.; Babula, P.; Krska, B.; Horna, A.; Adam, V.; Provaznik, I.; Kizek, R. Content of phenolic compounds and antioxidant capacity in fruits of apricot genotypes. Molecules 2010, 15, 6285–6305. [Google Scholar] [CrossRef]
  91. Martins, S.I.F.S.; Jongen, W.M.F.; Boekel, M.A.J.S. Van A review of Maillard reaction in food and implications to kinetic modelling. Trends Food Sci. Technol. 2001, 11, 364–373. [Google Scholar] [CrossRef]
  92. Domínguez-Perles, R.; Martínez-Ballesta, M.C.; Carvajal, M.; García-Viguera, C.; Moreno, D.A. Broccoli-derived by-products—A promising source of bioactive ingredients. J. Food Sci. 2010, 75, C383–C392. [Google Scholar] [CrossRef]
  93. Davarynejad, G.; Khorshidi, S.; Nyéki, J.; Szabó, Z.; Gal-Remennyik, J. Antioxidant capacity, chemical composition and physical properties of some apricot (Prunus armeniaca L.) cultivars. Hortic. Environ. Biotechnol. 2010, 51, 477–482. [Google Scholar]
  94. Gloess, A.N.; Schönbächler, B.; Klopprogge, B.; D’Ambrosio, L.; Chatelain, K.; Bongartz, A.; Strittmatter, A.; Rast, M.; Yeretzian, C. Comparison of nine common coffee extraction methods: Instrumental and sensory analysis. Eur. Food Res. Technol. 2013, 236, 607–627. [Google Scholar] [CrossRef]
  95. Ley, J.P. Masking bitter taste by Molecules. Chemosens. Percept. 2008, 1, 58–77. [Google Scholar] [CrossRef]
  96. Soares, S.; Kohl, S.; Thalmann, S.; Mateus, N.; Meyerhof, W.; De Freitas, V. Different phenolic compounds activate distinct human bitter taste receptors. J. Agric. Food Chem. 2013, 61, 1525–1533. [Google Scholar] [CrossRef]
  97. Nagel, C.W.; Herrick, I.W.; Graber, W.R. Is Chlorogenic Acid Bitter? J. Food Sci. 1987, 52, 213. [Google Scholar] [CrossRef]
Figure 1. The typical UV-VIS spectrum of carotenoid interference between 400 and 500 nm.
Horticulturae 10 00205 g001
Figure 2. A schematic representation of simplified solid-phase extraction clean-up procedure for phenolic compounds of apricot fruit and candied apricot products.
Horticulturae 10 00205 g002
Figure 3. Extracted ion chromatogram (EIC) in multiple reaction monitoring (MRM) mode represents the profile of 18 phenolic standards at the concentration of 1 μg mL−1.
Horticulturae 10 00205 g003
Figure 4. Antioxidant activity of Prunus armeniaca L. fruit and candied fruit methanolic extracts according to the determination method, i.e., DPPH (A) and FRAP (B). Note: Values are means ± SD of quadruplicates (n = 4). Means within the same antioxidant activity screening method with different superscript letters (a–e) are significantly different at p < 0.05. DW—the antioxidant activity expressed on a dry weight basis.
Horticulturae 10 00205 g004
Figure 5. Correlation plots between FRAP (A,C) and DPPH (B,D) mM Trolox 100 g−1 values and total phenolic (TPC), flavonoid (TFC), and vitamin C (C,D) contents in developed candied apricot products.
Horticulturae 10 00205 g005
Figure 6. Average scores of dried candied apricot fruit sensory attributes according to a 12-point line scale evaluation.
Horticulturae 10 00205 g006
Figure 7. Overall acceptability of dried candied apricot fruit according to a 5-point hedonic scale evaluation.
Horticulturae 10 00205 g007
Table 1. Brief description of new apricot cultivars developed by the Institute of Horticulture.
CultivarDescription
FruitRipening Time and Productivity
‘Dimaija’Horticulturae 10 00205 i001The fruit are round, light orange, slightly matte, handsome, large, and uniform. The taste of the fruit is good, and the flesh is yellow, medium firm, fine-grained, and aromatic. The peel is smooth and thin. Stone is medium and separates very well from the flesh.The ripening time is the end of July—1st or 2nd week of August. The fruit ripen relatively evenly. The cultivar is productive, but since the flower buds are sensitive to severe spring frosts, can be produced irregularly.
‘Velta’Horticulturae 10 00205 i002The fruit are large, round, flattened, and have a slight sharpness at the end of the fruit, orange with pronounced redness, with a deep abdominal seam—very attractive. The fruit are aromatic, with a good taste. The flesh is orange, with a medium-firm, fine-grained consistency; the peel is slightly uneven and medium-thick; therefore, the fruit are transportable. Compared to the flesh, the stone is large, elongated in shape, and separates perfectly from the flesh.The cultivar only produces occasionally but very well in some years. Its ripening time is medium (depending on the year—the last week of July to the second week of August). As the flowers are relatively sensitive to spring frosts, the cultivar does not produce regularly, but very well in some years.
‘Gundega’Horticulturae 10 00205 i003The fruit are round and orange, with distinct pinkish, small dots which merge to form a blush, slightly matt, very good-looking, large, uniform. The abdominal suture is deep. The taste of the fruit is delicious; the flesh is yellow, medium firm, fine-grained, and aromatic. Peel is smooth and thin—hence, high taste properties. The stone is small and separates very well from the flesh.The ripening time is the second half or the end of July (rarely the early beginning of August). The fruit ripen relatively evenly, usually in 2 (rarely 3) picking times. The cultivar is productive and produces regularly and abundantly.
‘Boriss’Horticulturae 10 00205 i004The fruit are large, round, yellow–orange, with pronounced redness, shiny, excellent appearance, and uniform. The abdominal suture is deep. The taste of the fruit is delicious; the flesh is yellow, medium firm, fine-grained, and aromatic. Peel is smooth and thin—hence, high taste properties. The stone is small and separates very well from the flesh.The production time for this cultivar is one of the longest (depending on the year, second–third week of July). The fruit ripen relatively evenly, usually collected in 2 (rarely 3) picking times. The cultivar is productive and produces regularly and abundantly.
Table 2. Physical–chemical characteristics of apricot fruit (raw material) and developed candied fruit, DW.
IndicatorRaw MaterialDried Candied Fruit
‘Dimaija’‘Velta’‘Gundega’‘Boriss’Market (Greece)‘Dimaija’‘Velta’‘Gundega’‘Boriss’Market (Greece)
TSS, Brix%11.3 ± 0.1 c11.5 ± 0.1 c13.6 ± 0.1 b14.8 ± 0.1 a11.8 ± 0.2 c76.1 ± 0.7 b78.6 ± 1.6 a76.7 ± 0.1 b69.6 ± 0.7 c76.4 ± 0.8 b
TA, %24.0 ± 3.0 b35.9 ± 4.5 a20.0 ± 2.0 b14.5 ± 1.5 c13.8 ± 1.6 c5.5 ± 0.1 a5.9 ± 0.1 a5.7 ± 0.1 a3.9 ± 0.1 b4.2 ± 0.1 b
Moisture, %89.0 ± 1.3 a89.1 ± 1.3 a87.4 ± 1.3 b87.4 ± 1.3 b89.3 ± 1.3 a30.2 ± 1.3 b25.2 ± 1.3 c32.9 ± 0.1 a21.8 ± 1.3 d25.8 ± 1.3 c
MI4.7 ± 0.63.2 ± 0.26.8 ± 0.610.2 ± 0.18.5 ± 0.4-----
Note: Values are means ± SD of quadruplicates (n = 4). DW—the concentration expressed on a dry weight basis; TSS—total soluble solids; TA—titratable acidity; MI—maturity index. Means within the same indicator, separately for raw and candied fruit, with different superscript letters (a–c) are significantly different at p < 0.05. Maturity index was calculated as the TSS/TA ratio as proposed by Melgarejo et al. [35].
Table 3. The concentration of free mono- and disaccharides in apricot fruit (raw material) and developed candied fruit, g 100 g−1 DW.
SaccharideRaw MaterialDried Candied Fruit
‘Dimaija’‘Velta’‘Gundega’‘Boriss’Market (Greece)‘Dimaija’‘Velta’‘Gundega’‘Boriss’Market
(Greece)
RiboseBLQn.d.BLQn.d.n.d.n.d.n.d.n.d.n.d.n.d.
Fructose6.5 ± 0.3 b3.4 ± 0.0 d8.3 ± 1.0 a5.8 ± 0.1 cBLQ23.1 ± 0.3 c24.7 ± 0.1 b25.5 ± 0.4 a12.6 ± 0.6 d9.8 ± 0.2 e
Glucose9.8 ± 0.4 b5.4 ± 0.2 c9.5 ± 3.0 b11.5 ± 0.0 a9.7 ± 0.3 b22.1 ± 0.3 c23.7 ± 1.0 b25.8 ± 0.9 a13.5 ± 0.9 d9.9 ± 0.1 e
Sorbitol3.3 ± 0.1 d4.2 ± 0.4 c5.9 ± 0.4 b5.2 ± 0.3 b14.5 ± 0.3 an.d.n.d.n.d.n.d.4.1 ± 0.1
Sucrose39.3 ± 2.9 c46.9 ± 0.0 b41.0 ± 0.5 c55.0 ± 1.7 a23.2 ± 1.2 d20.1 ± 0.3 c20.1 ± 0.5 c18.4 ± 0.9 d27.5 ± 1.1 b31.4 ± 1.6 a
Inositoln.d.n.d.BLQn.d.23.6 ± 0.9n.d.n.d.n.d.n.d.n.d.
Unknownn.d.n.d.n.d.1.3 ± 0.0BLQn.d.n.d.n.d.n.d.n.d.
Sugars59.0 ± 3.6 d59.9 ± 0.5 d64.7 ± 4.9 c78.7 ± 2.1 a71.1 ± 2.7 b65.3 ± 1.0 c68.4 ± 1.6 b69.7 ± 2.2 a53.6 ± 2.7 e55.5 ± 2.0 d
Note: Values are means ± SD of quadruplicates (n = 4). BLQ—observed concentration is below limit of quantification; DW—the concentration expressed on a dry weight basis; n.d.—not detected. Means within the same saccharide, separately for raw and candied fruit, with different superscript letters (a–e) are significantly different at p < 0.05.
Table 4. The concentration of biologically active compounds in apricot fruit (raw material) and developed candied fruit, mg 100 g−1 DW.
CompoundRaw MaterialDried Candied Fruit
‘Dimaija’‘Velta’‘Gundega’‘Boriss’Market
(Greece)
‘Dimaija’‘Velta’‘Gundega’‘Boriss’Market
(Greece)
TPC2795.3 ± 285.7 a1566.3 ± 237.1 c1843.2 ± 156.7 b216.4 ± 26.1 e582.0 ± 63.1 d702.1 ± 35.9 b639.2 ± 19.7 c723.9 ± 39.7 a114.4 ± 10.6 e164.8 ± 13.0 d
TFC2270.5 ± 231.5 a1197.4 ± 149.0 c1536.0 ± 246.7 b122.2 ± 5.7 e138.8 ± 22.5 d674.6 ± 36.2 a584.6 ± 30.2 c652.7 ± 26.1 b64.7 ± 4.2 e108.3 ± 2.9 d
Vit C148.3 ± 25.7 a120.4 ± 13.6 c126.4 ± 20.1 b75.3 ± 14.1 e85.5 ± 9.2 d4.4 ± 0.5 b1.6 ± 0.0 c4.2 ± 0.1 b8.6 ± 0.23 a3.9 ± 0.2 b
Carotenoids16.8 ± 1.8 c24.4 ± 3.0 b13.0 ± 1.3 d28.7 ± 1.4 a30.4 ± 4.0 a1.9 ± 0.2 b3.4 ± 0.0 a2.1 ± 0.0 b3.0 ± 0.4 a3.1 ± 0.1 a
Note: Values are means ± SD of quadruplicates (n = 4). TPC—the content of phenolics; TFC—the content of flavonoids; Vit C—the content of vitamin C; DW—the concentration expressed on a dry weight basis. Means within the same compound, separately for raw and candied fruit, with different superscript letters (a–e) are significantly different at p < 0.05.
Table 5. The concentration of individual phenolic compounds in apricot fruit (raw material) and developed candied fruit, µg g−1 DW.
Phenolic CompoundRaw MaterialDried Candied Fruit
‘Dimaija’‘Velta’‘Gundega’‘Boriss’Market
(Greece)
‘Dimaija’‘Velta’‘Gundega’‘Boriss’Market
(Greece)
VN0.9 ± 0.0 c1.9 ± 0.0 b0.8 ± 0.0 c10.8 ± 0.4 a0.9 ± 0.1 c1.7 ± 0.4 b3.8 ± 0.3 a1.1 ± 0.2 bc0.8 ± 0.0 c1.1 ± 0.2 bc
QCT2.5 ± 0.3 bc1.5 ± 0.0 c1.7 ± 0.1 bc26.7 ± 1.1 a1.4 ± 0.1 c6.5 ± 0.0 a6.0 ± 0.9 a2.4 ± 0.7 b2.0 ± 0.2 bBLQ
NCGA550.2 ± 8.4 a463.9 ± 3.5 b84.9 ± 4.1 c1.0 ± 0.0 e2.1 ± 0.0 d136.6 ± 2.7 b191.2 ± 10.2 a35.1 ± 1.0 c5.2 ± 0.2 e6.9 ± 0.8 d
PCA0.4 ± 0.0 a0.6 ± 0.1 a0.3 ± 0.0 a0.3 ± 0.0 a0.1 ± 0.0 a0.7 ± 0.2 a0.4 ± 0.0 a0.3 ± 0.0 a0.3 ± 0.0 aBLQ
CGA384.8 ± 7.7 b1129.1 ± 10.4 a159.8 ± 7.9 c21.3 ± 1.3 e41.9 ± 3.1 d147.1 ± 4.6 b587.4 ± 20.6 a93.1 ± 1.2 c40.4 ± 0.1 d24.3 ± 2.5 e
CT373.3 ± 15.4 a10.0 ± 2.5 c94.6 ± 14.8 b3.5 ± 0.1 e6.0 ± 0.4 d178.8 ± 4.4 a18.9 ± 0.1 c102.4 ± 2.9 b11.5 ± 0.9 d7.3 ± 0.4 e
E-CTC31.3 ± 3.7 c38.8 ± 3.3 b170.5 ± 6.5 a1.3 ± 0.0 d1.9 ± 0. 3 d59.2 ± 1.2 c86.0 ± 1.0 b269.6 ± 2.2 a12.0 ± 0.7 d6.1 ± 0.3 e
CA1.3 ± 0.0BLQBLQn.d.n.d.4.0 ± 0.5 a4.0 ± 0.3 aBLQ1.4 ± 0.2 bn.d.
SAn.d.BLQBLQBLQBLQn.d.BLQBLQBLQBLQ
RT1249.4 ± 15.0 a771.4 ± 7.6 b300.5 ± 4.1 c89.5 ± 0.8 e140.0 ± 4.2 d260.3 ± 4.4 a184.9 ± 4.8 b68.3 ± 0.5 c65.8 ± 1.4 d55.8 ± 0.0 e
t-FA1.8 ± 0.4 c2.0 ± 0.2 bc3.0 ± 0.0 ab3.4 ± 0.1 a1.4 ± 0.00 c3.2 ± 0.1 a3.3 ± 0.2 ab4.0 ± 0.1 a3.9 ± 0.2 ab0.9 ± 0.0 c
LUT-7G0.8 ± 0.0 aBLQ1.0 ± 0.0 aBLQn.d.n.d.BLQ1.2 ± 0.0BLQBLQ
RHMn.d.BLQBLQn.d.BLQn.d.BLQBLQn.d.BLQ
Total2596.9 ± 51.0 a2419.2 ± 27.6 b817.0 ± 37.6 c157.9 ± 3.9 e195.7 ± 8.2 d798.0 ± 18.6 b1085.9 ± 38.5 a577.2 ± 9.0 c143.2 ± 3.9 d102.3 ± 4.3 e
Note: Values are means ± SD of duplicates (n = 2). BLQ—observed concentration is below limit of quantification; DW—the concentration expressed on a dry weight basis; n.d.—not detected; Means within the same phenolic compound, separately for raw and candied fruit, with different superscript letters (a–e) are significantly different at p < 0.05; VN—vanillin; QCT—quercetin; NCGA—neochlorogenic acid; PCA—protocatechuic acid; CGA—chlorogenic acid; CT—(±)-catechin; E-CTC—(−)-epicatechin; CA—caffeic acid; SA—sinapic acid; RT—rutin; t-FA—trans-isomer of ferulic acid; LUT-7G—luteolin-7-O-glucoside; RHM—rhamnetin.
Disclaimer/Publisher’s Note: The statements, opinions and data contained in all publications are solely those of the individual author(s) and contributor(s) and not of MDPI and/or the editor(s). MDPI and/or the editor(s) disclaim responsibility for any injury to people or property resulting from any ideas, methods, instructions or products referred to in the content.