Abstract
Prostrate hairs are one of the anatomic barriers for grapevine resistance to pests and diseases, as well as in environmental adaptability, making them valuable for breeding programs. This study investigates the genetic determinants underlying prostrate hair density in grapevine, a key trait associated with resistance to pests and pathogens. Using an F1 hybrid population derived from Vitis vinifera L. ‘Cabernet Sauvignon cv.’ and V. pseudoreticulata W.T.Wang ‘Huadong1058’, we performed a combination of quantitative trait locus (QTL) mapping and genome-wide association study (GWAS) to identify the genomic regions influencing the density of prostrate hair. We identified a major locus on 9.56–10.54 Mbp of chromosome 17, designated as ‘LH2’, which accounts for 43% of the phenotypic variation. This locus was delineated with high precision, and 92 candidate genes were identified within the region. Functional enrichment analysis suggested that these genes are potentially involved in binding, catalytic activity, and various cellular processes. In particular, the SNP markers ‘chr17_10130288’ and ‘chr17_10428273’ were significantly associated with prostrate hair density, providing valuable information for marker-assisted selection. These findings offer a reliable target for analyzing the hair development mechanism of grapevine leaves and breeding new cultivars rich in prostrate hair on the back of the leaves.
1. Introduction
Grapevine (Vitis vinifera L.), a member of the Vitaceae family, is one of the most economically significant fruit crops worldwide, valued for its extensive cultivation, rich nutritional content, and diverse uses [1]. Trichomes, which are hairlike structures found on leaf and green shoot surfaces, are a key feature used for species identification within the Vitis genus [2,3,4]. The trichomes of grapevine can be divided into prostrate and erect trichomes [4]. These trichomes occur in various plant organs and contribute to plant defense by deterring pest activity, repelling water, and providing a physical barrier against pests and pathogens [5]. Although trichomes may negatively affect the efficacy of pesticides, under the current premise of reducing pesticide use, their morphological characteristics that resist pest and pathogen attack have made them an important consideration for breeders aiming to develop plants with durable resistance [6].
The resistance characteristics of trichomes have been extensively studied in several crops, including Brassica, Phaseolus, and soybean (Glycine max) [7,8]. In cotton (Gossypium arboreum L.), studies have shown that glabrous mutants exhibit a reduced suitability for whiteflies, and they are more susceptible to the larvae of white butterflies and cabbage flies in Arabidopsis halleri [9,10]. In Arabidopsis, the genetic regulatory networks involved in the formation have been well documented, involving key genes such as GLABRA1 (GL1), MYB23, GLABRA3 (GL3), their homologs, and TRANSPARENT TESTA GLABRA1 (TTG1) [11].
Unlike typical resistance genes (for example, NBS-LRR), grapevine trichomes serve as a physical barrier that prevents pathogen invasion, providing resistance against downy mildew (DM). The downy mildew pathogen (Plasmopara viticola) requires water to infect grapevines, and trichomes repel water, thereby enhancing defense [12]. The trichome is the structure involved in the defense of grapevines against downy mildew, and it is typically denser at the tips of shoots and in expanding leaves compared to fully expanded leaves. The wild grapevine species resistant to DM have dense prostrate hairs on the abaxial leaf surface, and it has been observed that the removal of these hairs increased susceptibility in some species [13]. Previous studies also found that species with dense pubescence on the lower leaf surface, including V. vinifera (variety with dense hair), and wild species such as V. cinerea, V. davidii, V. girdiana, V. doaniana, V. labrusca, and M. rotundifolia, demonstrated better resistance to DM due to the water-repellent properties of trichomes [14,15].
In grapevine, Barba et al. identified quantitative trait loci (QTL) related to trichome density on chromosomes 1 and 15 using a hybrid grape population derived from “Horizon” and Illinois 547-1 [16], and they proposed several candidate genes, including GL1, GLABROUS INFLORESCENCE STEMS2 (GIS2), Zinc Finger Protein 8 (ZFP8), and REPRESSOR of GA1-3 (RGA13). However, the identified QTL spanned a large genomic region (3 to 8 Mbp), making the precise identification of candidate genes challenging.
As an essential defense structure against pests and pathogens, trichomes have become a promising target for breeders seeking to enhance plant resistance. In this study, we investigated the density of prostrate hairs (a type of trichome) in a hybrid population Vitis vinifera L. ‘Cabernet Sauvignon cv.’ × V. pseudoreticulata W.T.Wang ‘Huadong 1058’, performing QTL mapping and genome-wide association studies (GWAS) to identify the relevant genomic regions. QTL analysis identified a major locus controlling prostrate hair density on chromosome 17, explaining 43% of the observed phenotypic variation. The GWAS analysis also emphasized the significance of this locus in determining the density of prostrate hair on the abaxial leaf surface. By integrating QTL and GWAS results, we precisely defined the locus region and named it LH2, annotating 92 genes within this region and identifying potential candidate genes involved in regulating prostrate hair density.
2. Materials and Methods
2.1. Plant Material
A total of 133 individual vines were used in QTL mapping, including Vitis vinifera L. ‘Cabernet Sauvignon cv.’, Vitis pseudoreticulata W.T.Wang ‘Huadong1058’, and 131 progenies obtained from the cross between them. Furthermore, 47 varieties/accessions were used in the genetic relationship and population structure analysis (Table S1). All vines were planted in the Center for Viticulture and Enology, Shanghai Jiao Tong University (Minhang District, Shanghai City, China).
2.2. DNA Extraction
Genomic DNA was isolated from young grapevine leaves using the CTAB method, following the protocol described by Yang et al. [17]. The quality of the extracted DNA was evaluated by 1% agarose gel electrophoresis using a λ-DNA ladder as a reference, while the DNA concentration was measured with a NanoDrop 2000 spectrophotometer (Thermo Fisher Scientific, Waltham, MA, USA).
2.3. Target Site Selection for GBTS and Probe Design
The target sites were selected based on the Illumina 20 K chip data and previously reported GBS sequencing results [18,19,20]. In total, 20,597 sites were chosen according to the following criteria: minor allele frequency (MAF) > 0.1, missing data proportion <5%, and even genomic distribution. For each target, a 110 bp probe was designed using GenoBaits Probe Designer (MolBreeding Biotechnology Co., Ltd., Shijiazhuang, Hebei, China).
2.4. Library Construction, Probe Hybridization, and Sequencing
GBTS library construction and probe hybridization were performed according to Sun et al. [21]. In brief, the library preparation involved the following four key steps: (1) DNA fragmentation using sonication; (2) end-repair of fragments and addition of an A tail; (3) Ligation of adapters containing barcode sequences to the A-tailed fragments; and (4) PCR amplification of the library. After library preparation, probe hybridization involved library mixing, hybridization, target capture, library amplification, purification, and quality control. All procedures were automated to enhance efficiency and save time.
Library quality was evaluated using the Qubit 2.0 Fluorometer (Thermo Fisher Scientific, CA, USA). Samples that met the quality criteria were sequenced using paired-end 150 bp (PE150) on the MGISEQ-2000 platform (MGI, Shenzhen, China). To optimize data usage, multiple SNPs (mSNPs) were detected from each amplicon, including the target SNPs and surrounding regions, according to the mSNP development method reported by Sun et al. [21].
2.5. Phenotyping of Prostrate Hair Density
At the beginning of the flowering stage (E-L 19/BBCH 60) [22], five young shoot tips or the young leaf abaxial surfaces were investigated for each individual to evaluate the density of prostrate hairs. The evaluation criteria of young shoot tips were in accordance with the OIV (International Organization of Vine and Wine) descriptor ‘OIV 004’ [23]. The evaluation criteria of the prostrate hairs between main veins of the 4th young leaves were in accordance with the OIV descriptor ‘OIV 053’ [23]. The evaluation was repeated in 2015 and 2020.
2.6. Map Construction and QTL Mapping
The genetic map used in this study was broadly based on previous work. The main construction methods are as follows. The mSNP markers identified from the two parental lines were categorized into eight segregation types as follows: ‘aa × bb’, ‘ab × cc’, ‘cc × ab’, ‘ab × cd’, ‘ef × eg’, ‘hk × hk’, ‘lm × ll’, and ‘nn × np’. Heterozygous markers from both parents were used to construct the genetic map. Then, mSNPs with an integrity score greater than 0.9 were retained for further analysis. Since mSNPs contain chromosome information, markers of the same chromosome were grouped together to simplify computational complexity in JointMap 4.0 software. A LOD (logarithm of odds) score of 6 was set as the threshold for determining marker linkage. Markers that significantly altered marker order within linkage groups were excluded.
To refine the analysis, the ‘Individual genot freq’ function was employed to filter out individuals with excessive missing genotypes, and the ‘locus genot. Freq.’ function was used to remove markers showing segregation distortion (p < 0.05) or abnormal segregation patterns. Markers with complete similarity (similarity = 1) were also discarded using the ‘similarity of Loci’ function. The marker order was established using the ‘regression mapping’ function, and the distances between markers were calculated based on Kosambi’s function. Finally, the genetic map was visualized using MapChart software 2.2.
The QTL mapping analysis was conducted using MapQTL 6.0 software, where the phenotypic (.qua), map (.map), and loci (.loc) files were imported. An interval mapping (IM) with a step size of 0.5 centimorgan (cM) was used to identify potential loci associated with flower sex. The LOD threshold (α = 0.05) was determined based on the results of 1000 permutation tests.
2.7. GWAS Analysis
The GWAS analysis utilized the BLINK (Bayesian-information and Linkage-disequilibrium Iteratively Nested Keyway) algorithms within the Gapit (version 3) on RStudio [24]. The performance of the GWAS algorithm was assessed using QQ (quantile–quantile) plots. A stringent threshold for determining SNP significance was determined using Bonferroni correction with a type I error rate of 0.05.
2.8. Genetic Relationship Data Analysis
The phylogenetic tree was constructed using MEGA X software through the adjacency method (Model: P-distance; bootstrap: 1000) construct; The kinship heat map was analyzed and drawn by GCTA V1.2.2 software. Cross validation (CV) was calculated using Admix V1.3 software, assuming that the number of clusters (K value) ranged from 1 to 15. Genetic composition histograms were plotted using Pophelper V2.2.7 software.
3. Results
3.1. Phenotypic Analysis
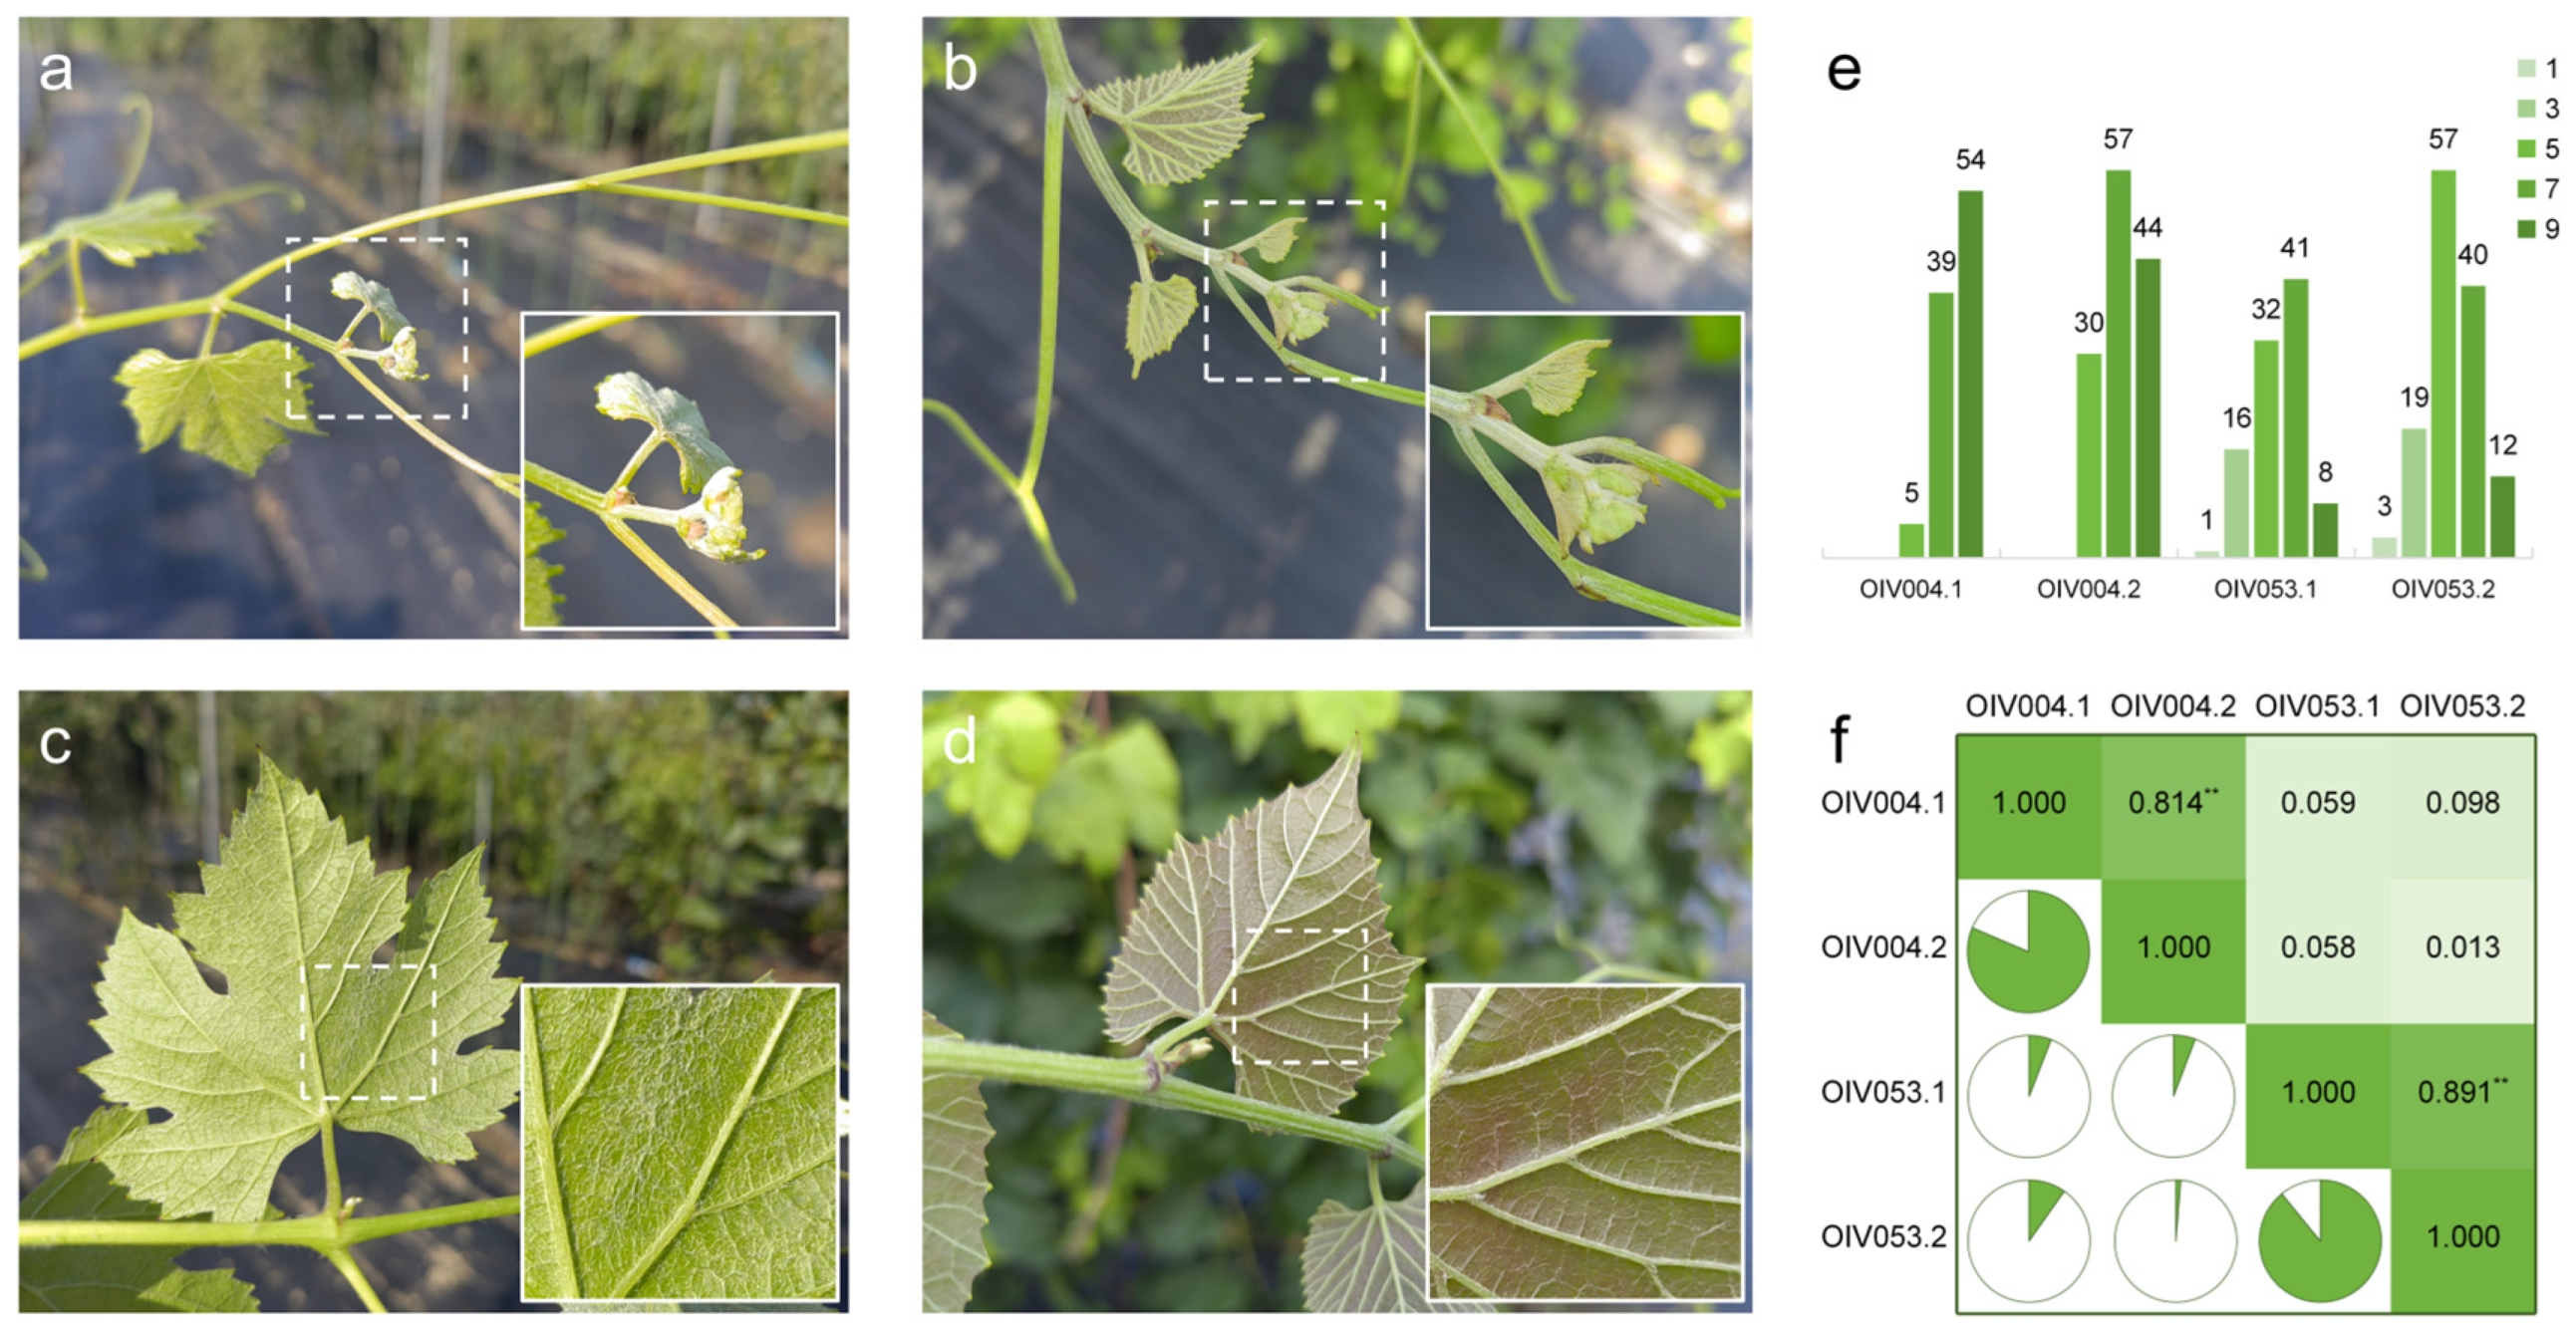
The density phenotypes of prostrate hairs were divided into the tip of the young shoot (OIV004) and young leaf abaxial surface (OIV053), respectively. The phenotype of the two types of prostrate hairs was significantly different between the parent vines. The shoot tips and the young leaves’ abaxial surface of female parent V. vinifera ‘Cabernet Sauvignon’ are covered with dense prostrate hairs (Figure 1a,c). The male parent vine V. pseudoreticulata ‘Huadong1058’, in contrast, only has a few prostrate hairs on the young shoot tips and no prostrate hairs on the young leaves’ abaxial surface (Figure 1b,d).
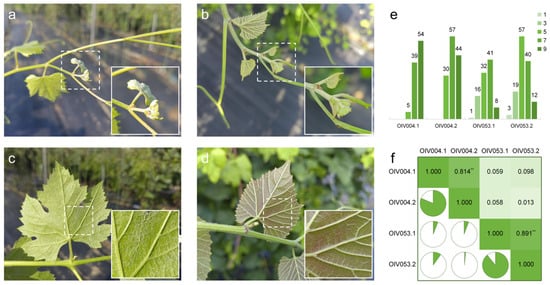
Figure 1.
Characterization of prostrate hair density phenotype. Prostrate hairs on the shoot tips of ‘Cabernet Sauvignon’ (a) and ‘Huadong1058’ (b); Prostrate hairs between main veins on the 4th young leaves of ‘Cabernet Sauvignon’ (c) and ‘Huadong1058’ (d); (e) Phenotypic distribution of prostrate hairs for F1 population from ‘Cabernet Sauvignon’ × ‘Huadong1058’. The Y-axis indicates the number of vines. (f) Pearson correlation coefficient between evaluations. ** p < 0.01 in two-sided t test.
The two phenotypes of prostrate hair density of the progeny exhibited continuous variation and followed a quantitative trait distribution (Figure 1e). Some vines were too small at the time of the first survey to allow the extraction of meaningful data. In the two independent assessments of ‘OIV004’, the scores ranged from ‘5’ to ‘9’, and the most numerous scores were ‘9’ in ‘OIV004.1’ and ‘7’ in ‘OIV004.2’, respectively. In the two assessments of ‘OIV053’, the scores ranged from ‘1’ to ‘9’, and the most numerous scores were ‘7’ in ‘OIV053.1’ and ‘5’ in ‘OIV053.2’. Pearson’s coefficient could reflect the correlation between phenotypic assessments (Figure 1f), which indicated a significant correlation between the two assessments of prostrate hair density phenotypes at the same parts of vines (‘0.814’ in ‘OIV004.1-OIV004.2’, ‘0.891’ in ‘OIV053.1-OIV053.2’), with low correlation between different parts of vines (no higher than ‘0.098’).
3.2. QTL Mapping
As a prerequisite for QTL mapping, the genetic map of the ‘Cabernet Sauvignon’ × ‘Huadong1058’ F1 population was constructed from previous research [25]. The map has 19 linkage groups spanning 2351.71 cM, with 16–30 mSNPs per group and an average inter-SNP distance of 5.57 cM (Figure S1, Table S2).
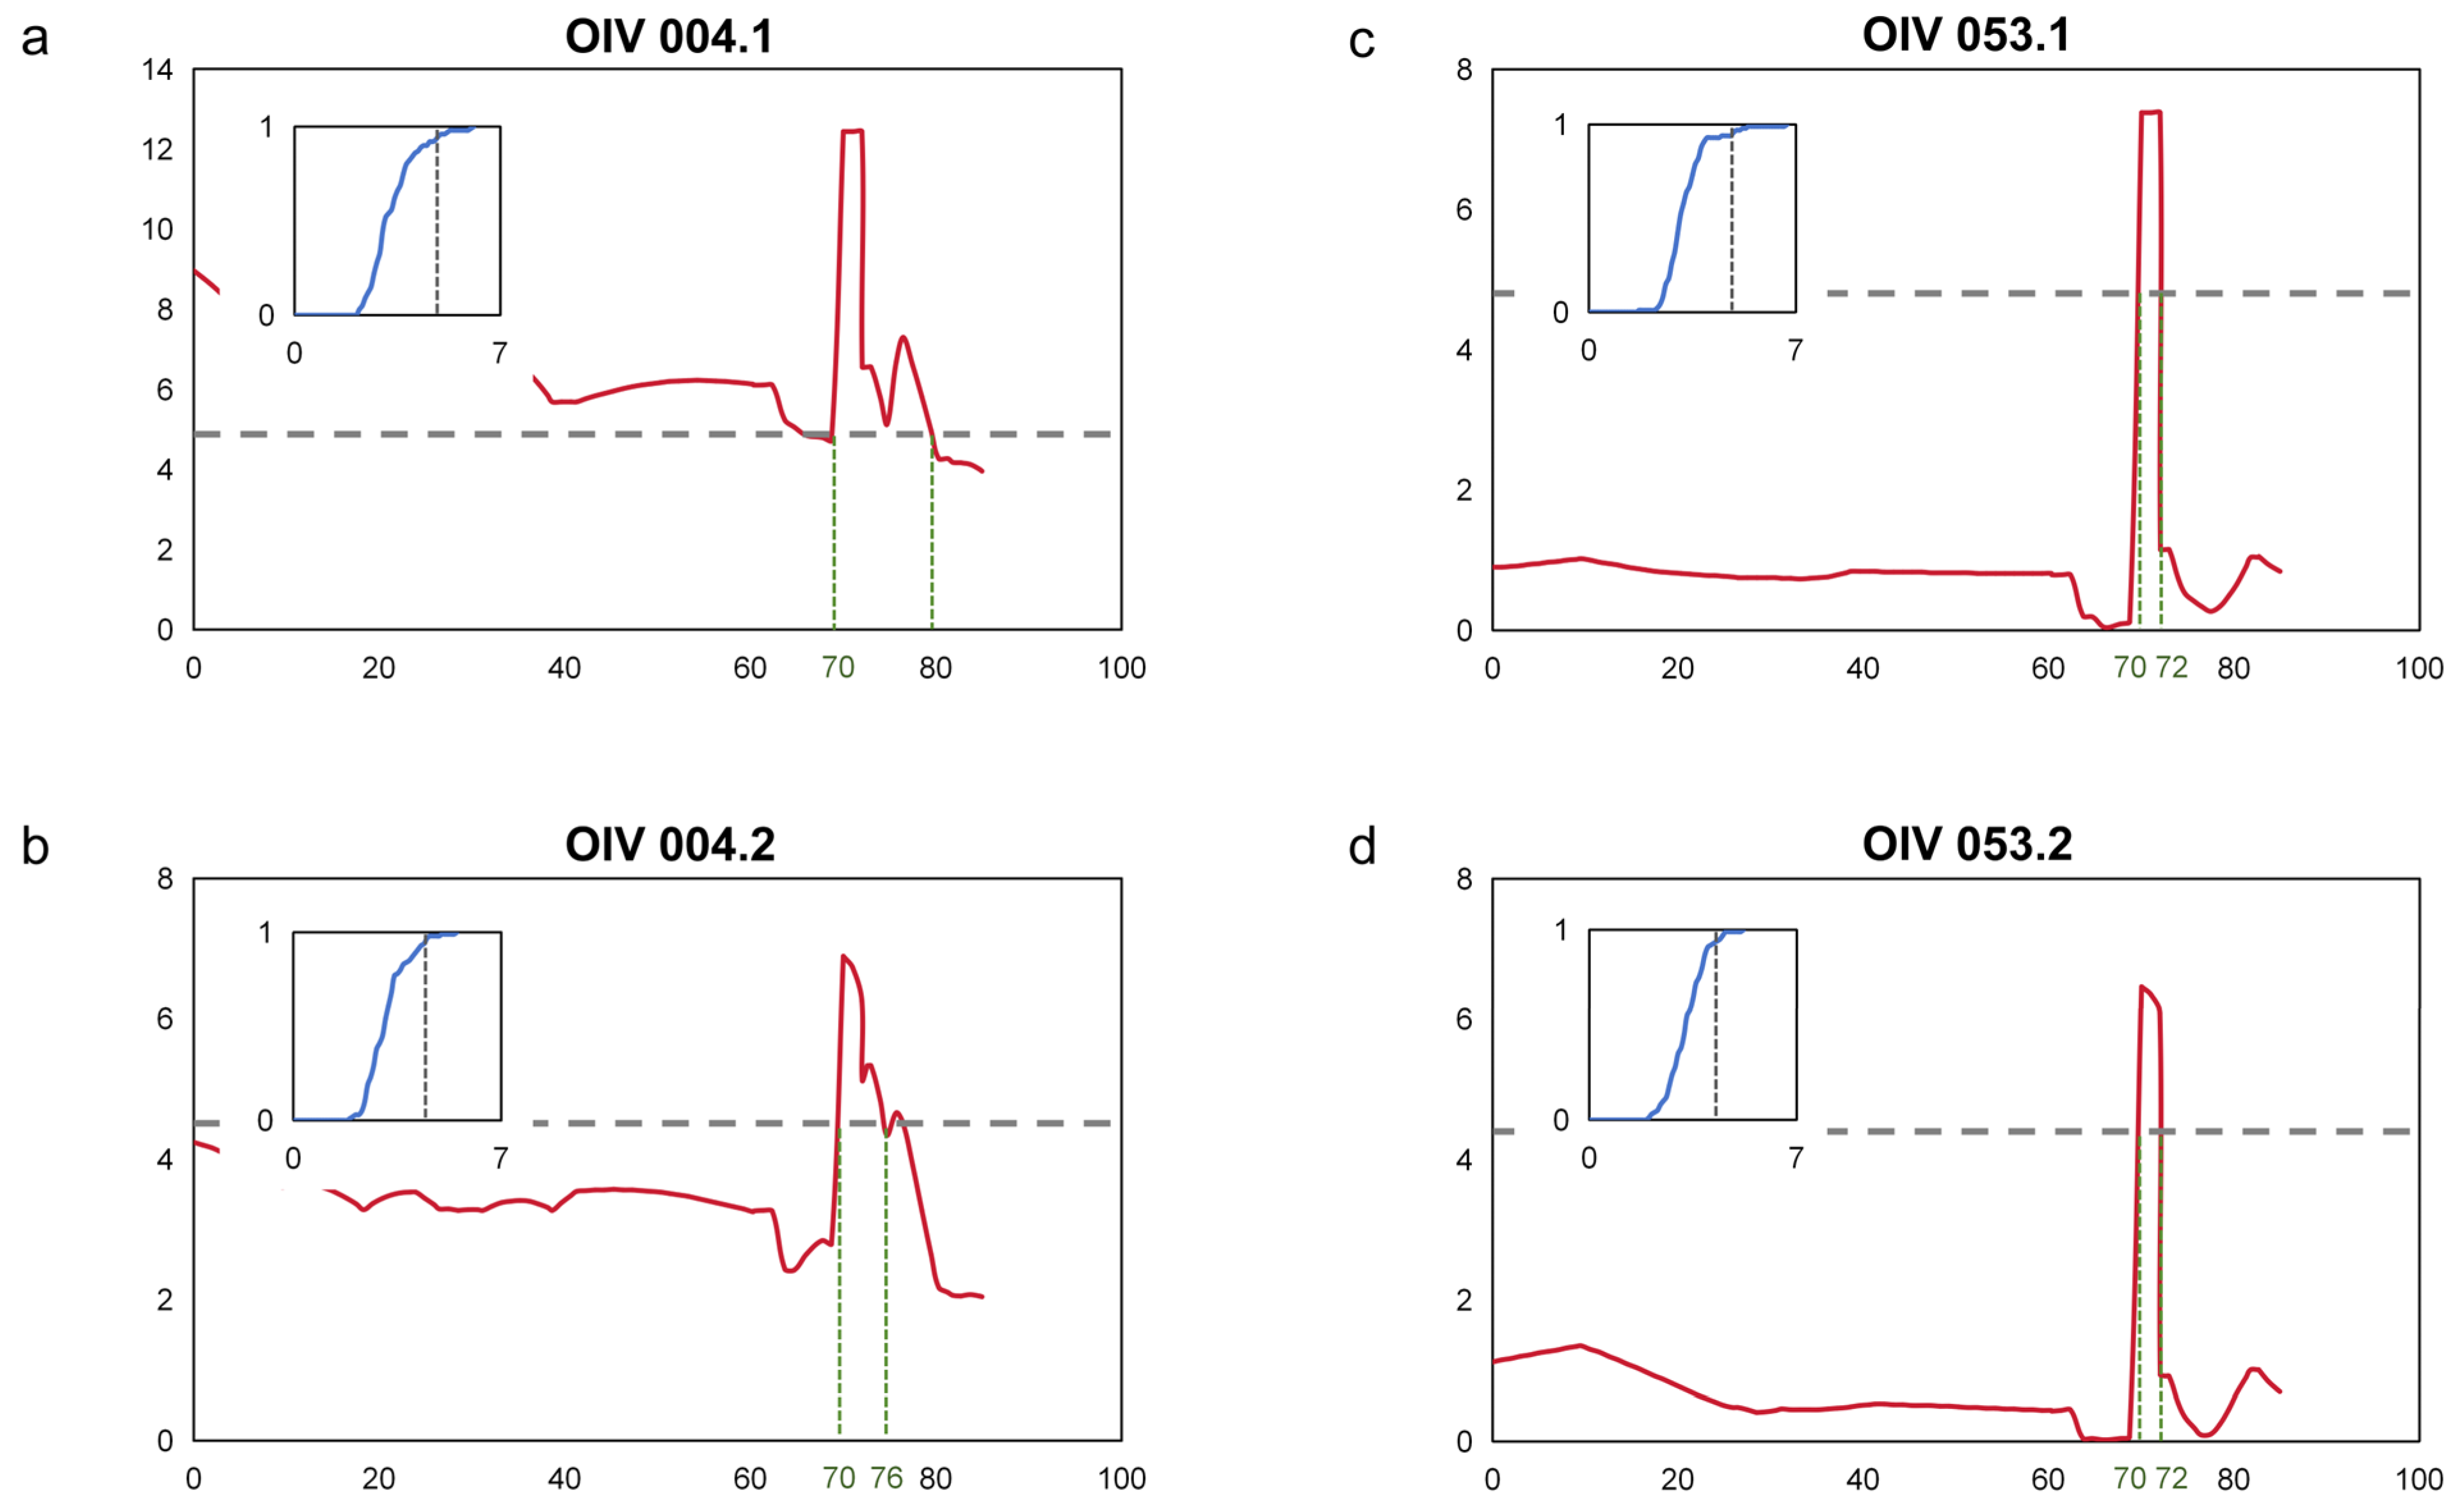
Based on the two assessments of the prostrate hair density phenotypes on the shoot tips and the young leaves’ abaxial surface, interval mapping was used to locate the major QTL. The thresholds of QTL were determined by the permutation test at the rel. cum. count of 0.9500. From the results, the major loci of the two prostrate hair density phenotypes were located in the same position, and there was obvious consistency (Figure 2a–d). This QTL was located at chr17, with a range from 70 to 80 cM for OIV004 and 70 to 72 cM for OIV053. According to the nearest SNP, the start of the locus was located at 9.56–9.93 Mbp, and the end was located at 10.13–10.53 Mbp, with the PVE (phenotypic variance explained) up to 43.0% (Table 1).
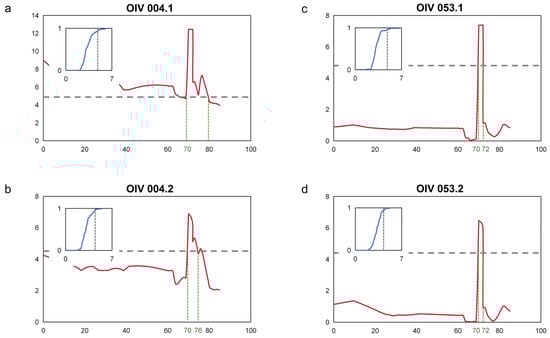
Figure 2.
Mapping of prostrate hair density locus. (a,b) Interval mapping of prostrate hair density on the shoot tips on chr17; (c,d) Interval mapping of prostrate hair density between main veins on the 4th young leaves on chr17. The Y-axis indicates the LOD, and the X-axis the genetic distance (cM). The gray horizontal dashed line indicates the QTL threshold. The green dashed line indicates the boundary of each QTL. The diagram inside represents the permutation test for the QTL threshold. The green vertical dashed line indicates the boundary of the QTL. The X-axis indicates the LOD value and the Y-axis indicates the relative cumulative count. The vertical black dashed line indicates the LOD value at a rel. cum. count of 0.9500.

Table 1.
Details of QTL mapping and GWAS for prostrate hair density.
3.3. GWAS Analysis
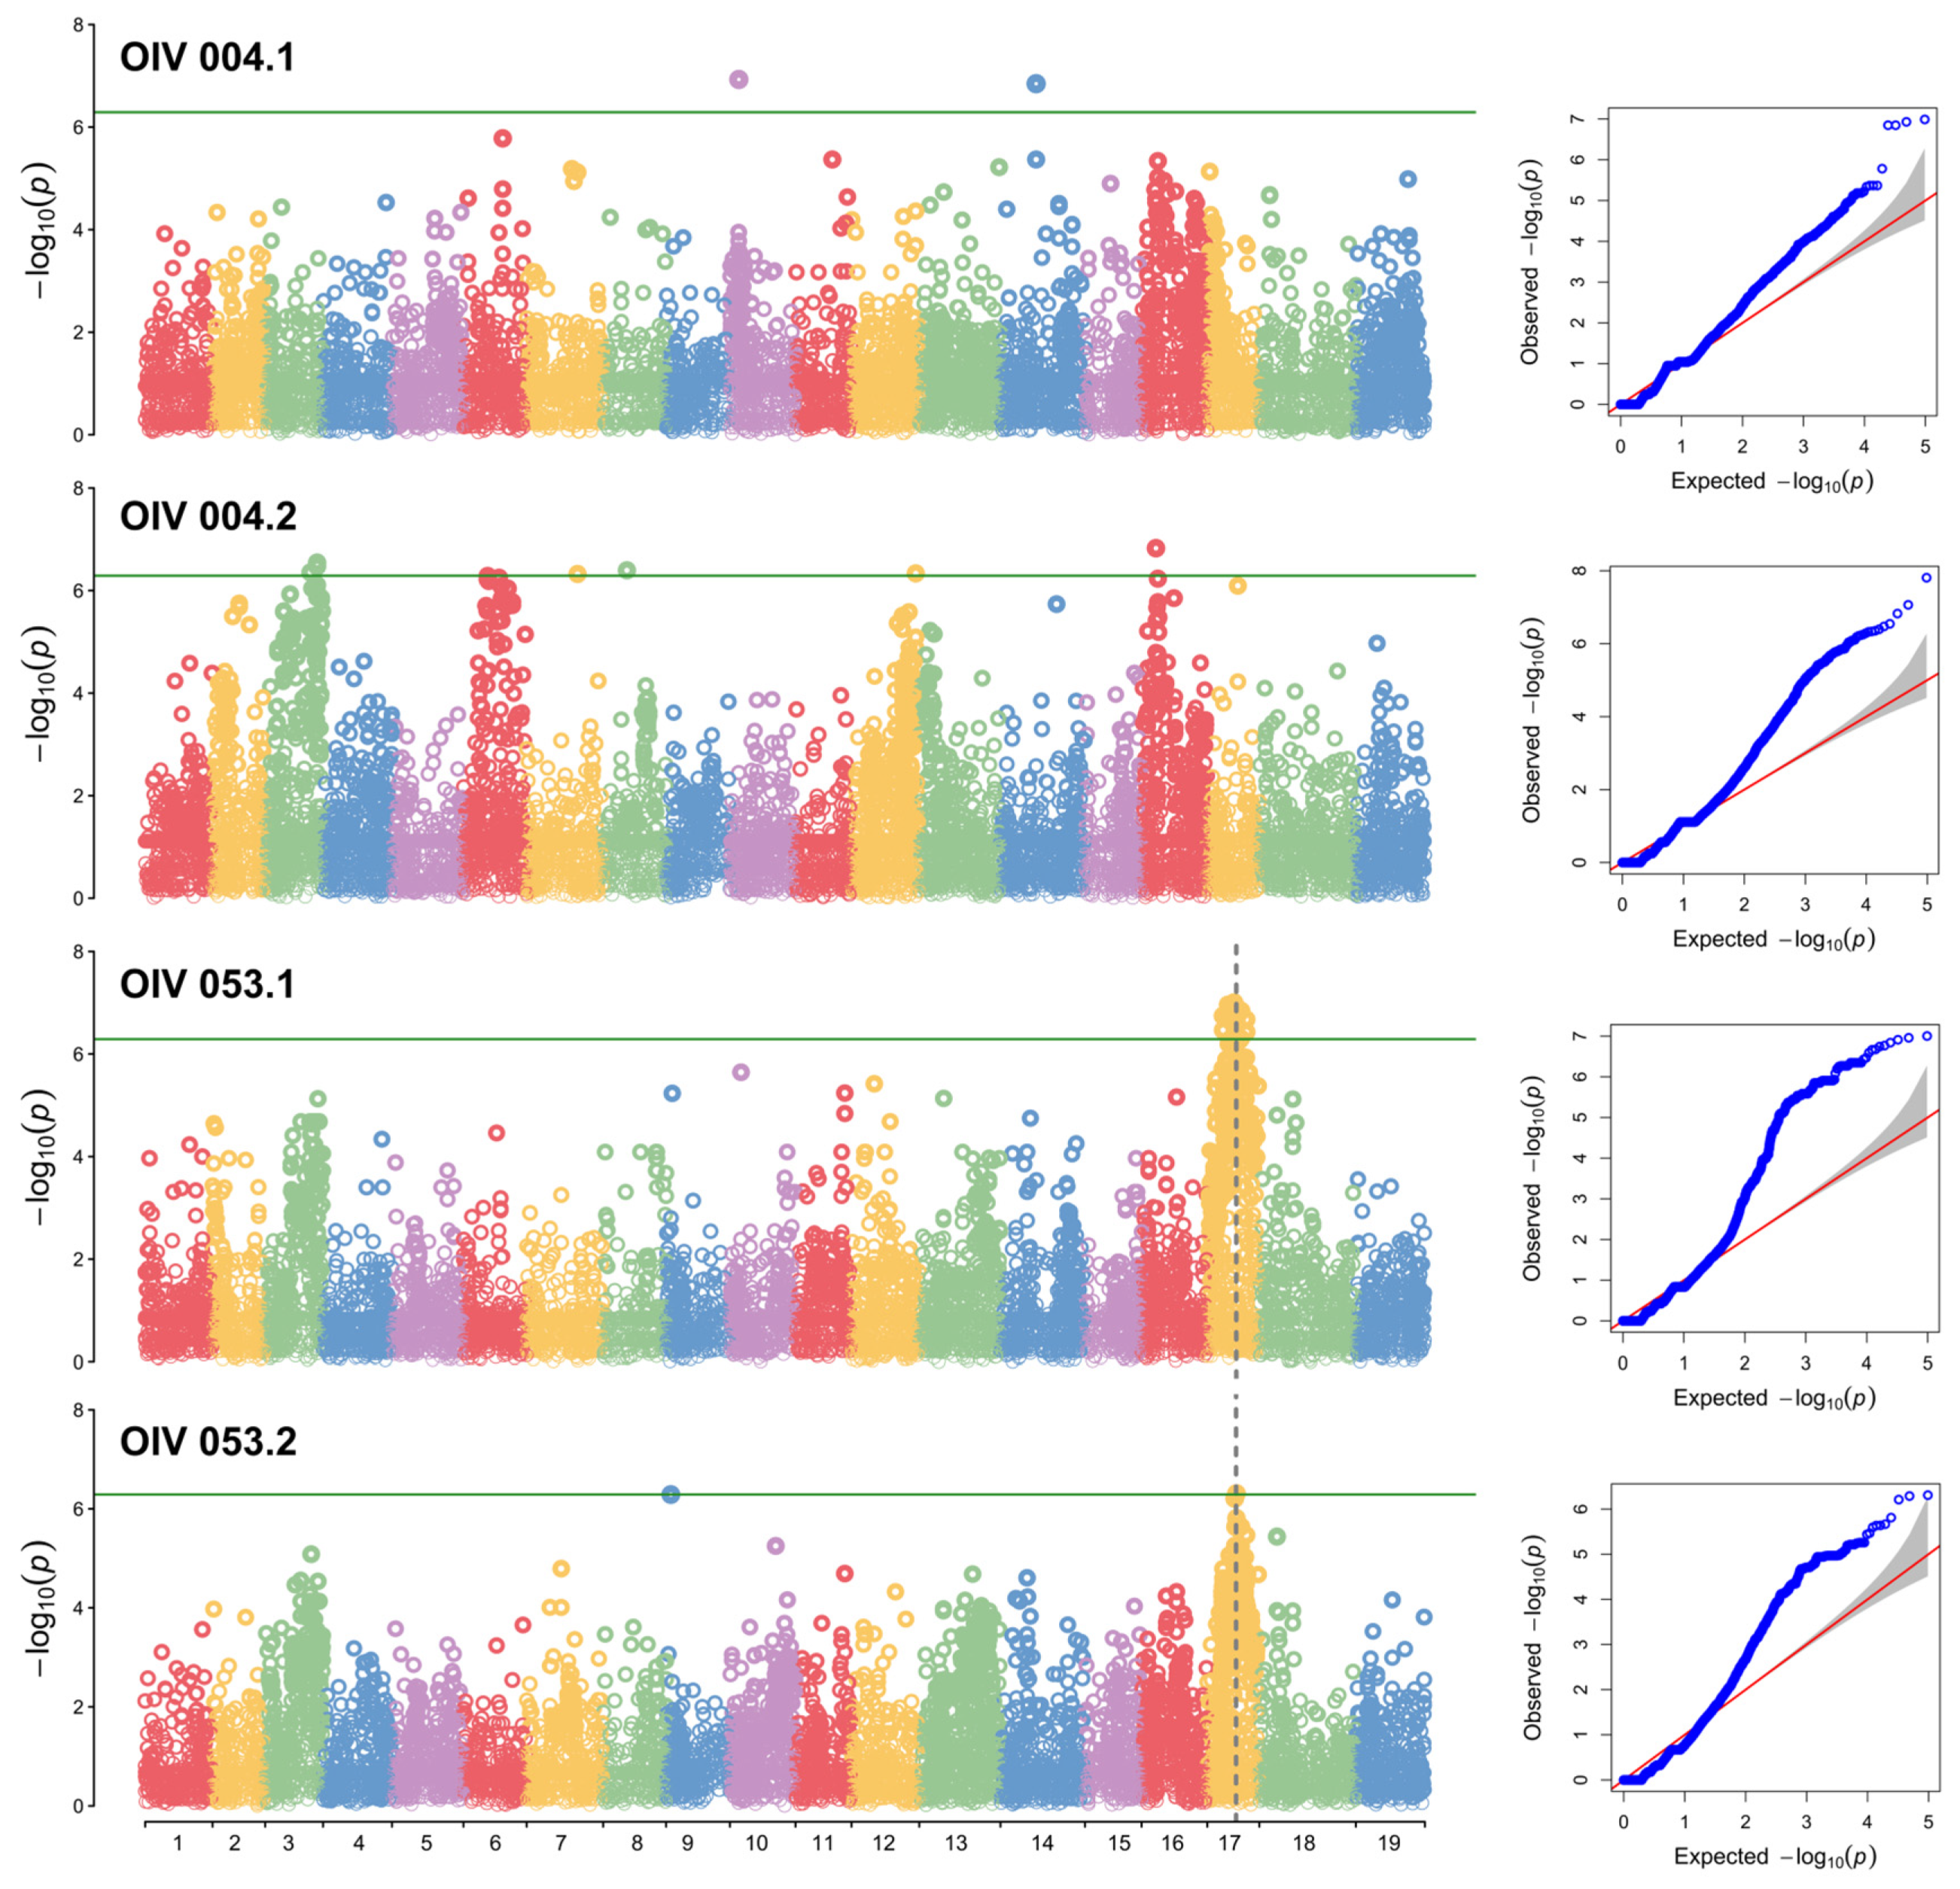
GWAS analysis was performed using GAPIT with the Blink model, and Manhattan plots and QQ (quantile–quantile) plots were generated. A conservative threshold was established to assess the significance of single nucleotide polymorphisms (SNP), applying the Bonferroni correction to control the type I error rate at 0.05.
In the results of the two OIV004 analyses, although there were many SNPs that exceeded the threshold, they were not repeatable. These SNPs lack sufficient confidence to be loci. However, in the analysis of OIV053, the results showed a significant peak on chr17 (Figure 3). According to the SNPs closest to the peak, the LODmax is located at 10.43 Mbp, and the locus ranges from 9.56 to 10.54 Mbp (‘OIV053.1’) (Table 1). The QQ plot for each Manhattan plot revealed the presence of significant markers that deviated from random effects and were strongly associated with the phenotype in each group.
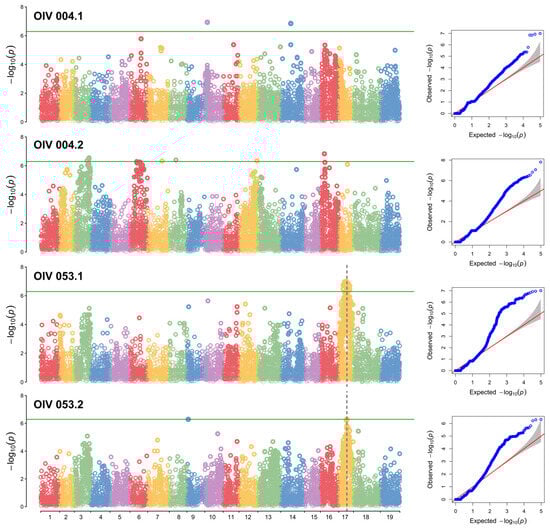
Figure 3.
GWAS analysis of the prostrate hair density locus. Manhattan plots and QQ plots were drawn based on the Blink model. The Y-axis of the Manhattan plot indicates the −log10(p) of each marker. The X-axis of the Manhattan plot indicates the chromosomes. The green line is the threshold of highly related markers. The red line indicates the normal distribution, and the shadow area indicates the random effects distribution. Dots that are not red and shaded indicate that the SNP deviates from random effects.
3.4. Joint Analysis and Gene Clustering
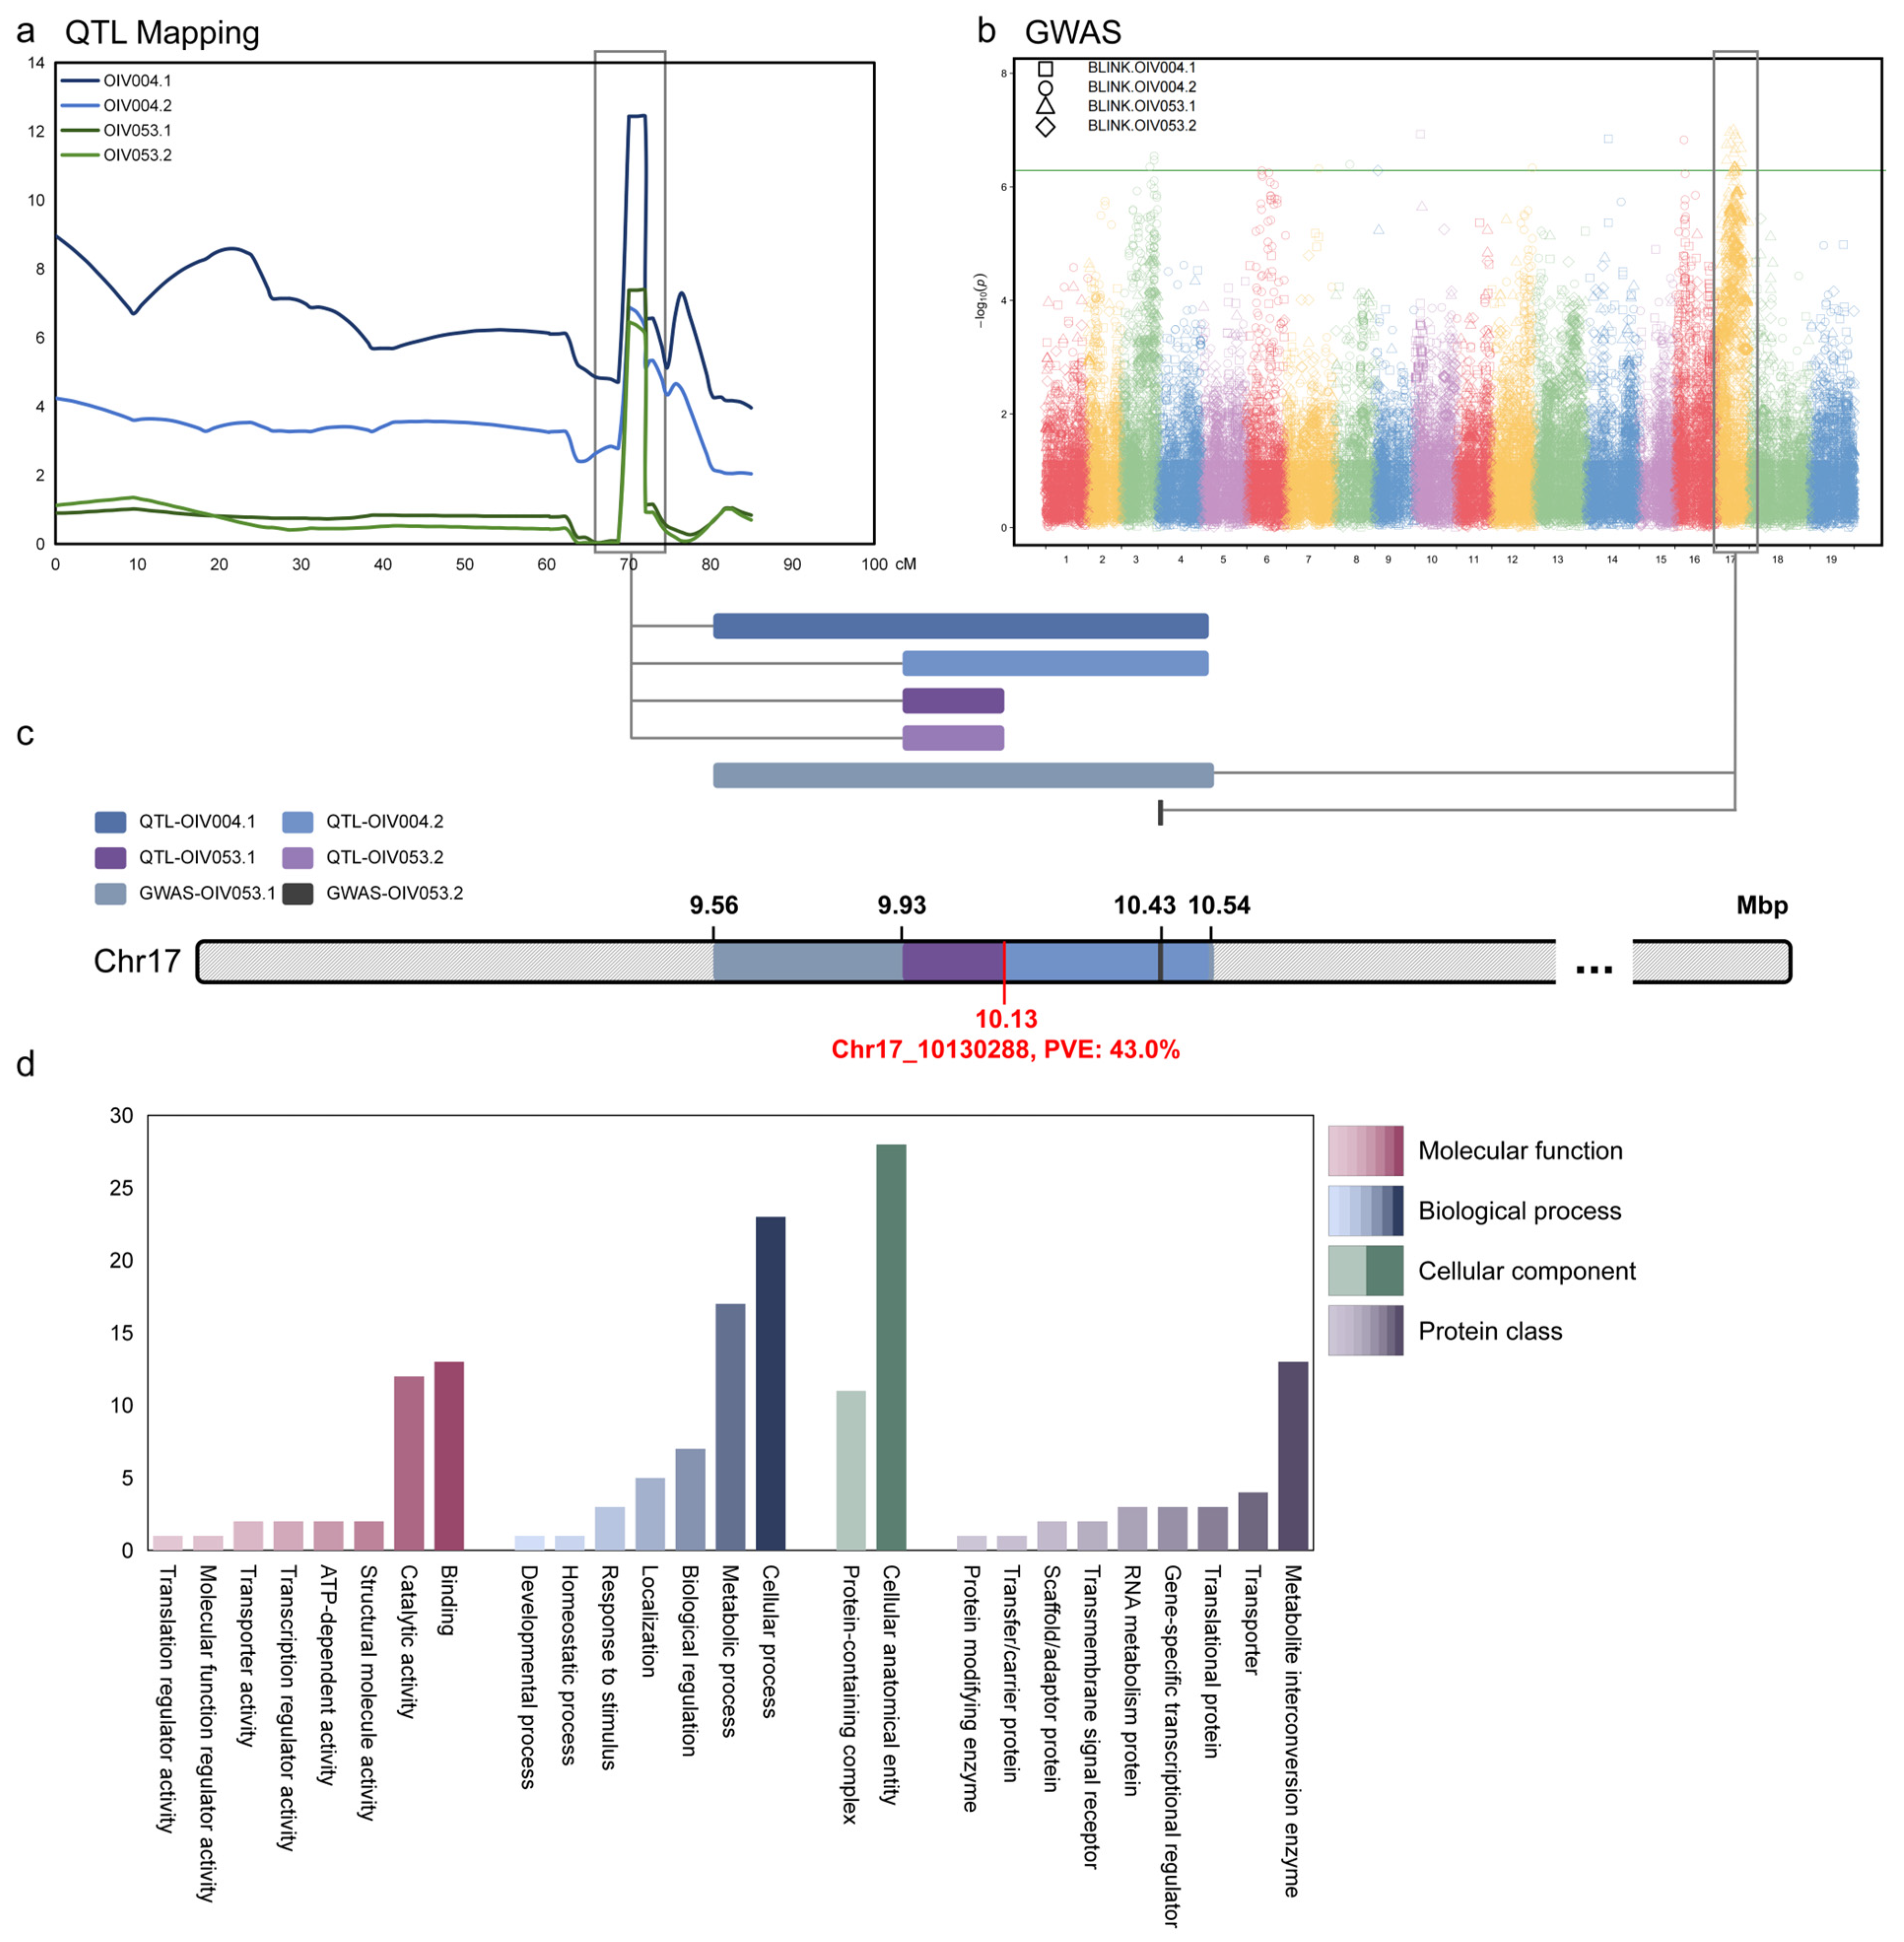
In order to screen candidate genes in this locus as comprehensively as possible, we jointly analyzed the results of QTL mapping and GWAS on chr17 and determined the boundary range of this locus between 9.56 and 10.54 Mbp (Figure 4a–c). The locus was named ‘LH2’ (leaf hair 2).
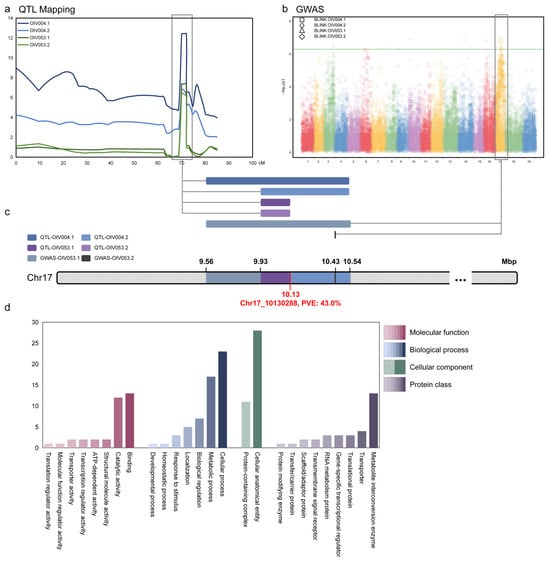
Figure 4.
Joint and GO analysis of mapping results. (a) Symphysic interval mapping on chr17; (b) Symphysic Manhattan plots of GWAS. The Y-axis of the Manhattan plot indicates the −log10(p) of each marker. The X-axis of the Manhattan plot indicates the chromosomes. The green line is the threshold of highly related markers; (c) The overlap region on chr17 is based on the union of interval mapping and GWAS; (d) Gene Ontology and protein class of genes within the locus. The Y-axis indicates the number of genes.
According to the annotation of the grapevine reference genome (VCost. v3), there were a total of 92 annotated genes in this locus. Panther database (https://pantherdb.org/, accessed on 1 September 2024) was used for GO (Gene Ontology) annotation and protein classification prediction of these genes (Figure 4d). In the GO enrichment analysis, genes were classified according to MF (Molecular function), BP (Biological process), and CC (Cellular component). In MF, a total of 35 genes have been enriched, with the most numerous classes being ‘binding’ (13 annotated genes) and ‘catalytic activity’ (12 annotated genes). In BP, a total of 57 genes were enriched, with the ‘cellular process’ and ‘metabolic process’ categories having the highest number of genes, 23 and 17, respectively. The density phenotype of prostrate hair that we focused on might be related to numerous factors. Apart from varieties, climate and the position of the shoot or leaf play important roles. Disparities in these factors can influence the development process of grapevine, thus BP deserves attention. In CC, a total of 39 genes were enriched and divided into two classes, 11 in a ‘protein-containing complex’ and 28 in a ‘cellular anatomical entity’. In addition, if the dominant gene is a non-transcriptional regulatory gene, the protein classification is also noteworthy. A total of nine protein functional classes were enriched, with the number of genes in each ranging from 1 to 13. These enrichment analyses can be used as a basis for the future screening of candidate major genes.
3.5. Correlation Between Prostrate Hair Density and the Linkage SNPs
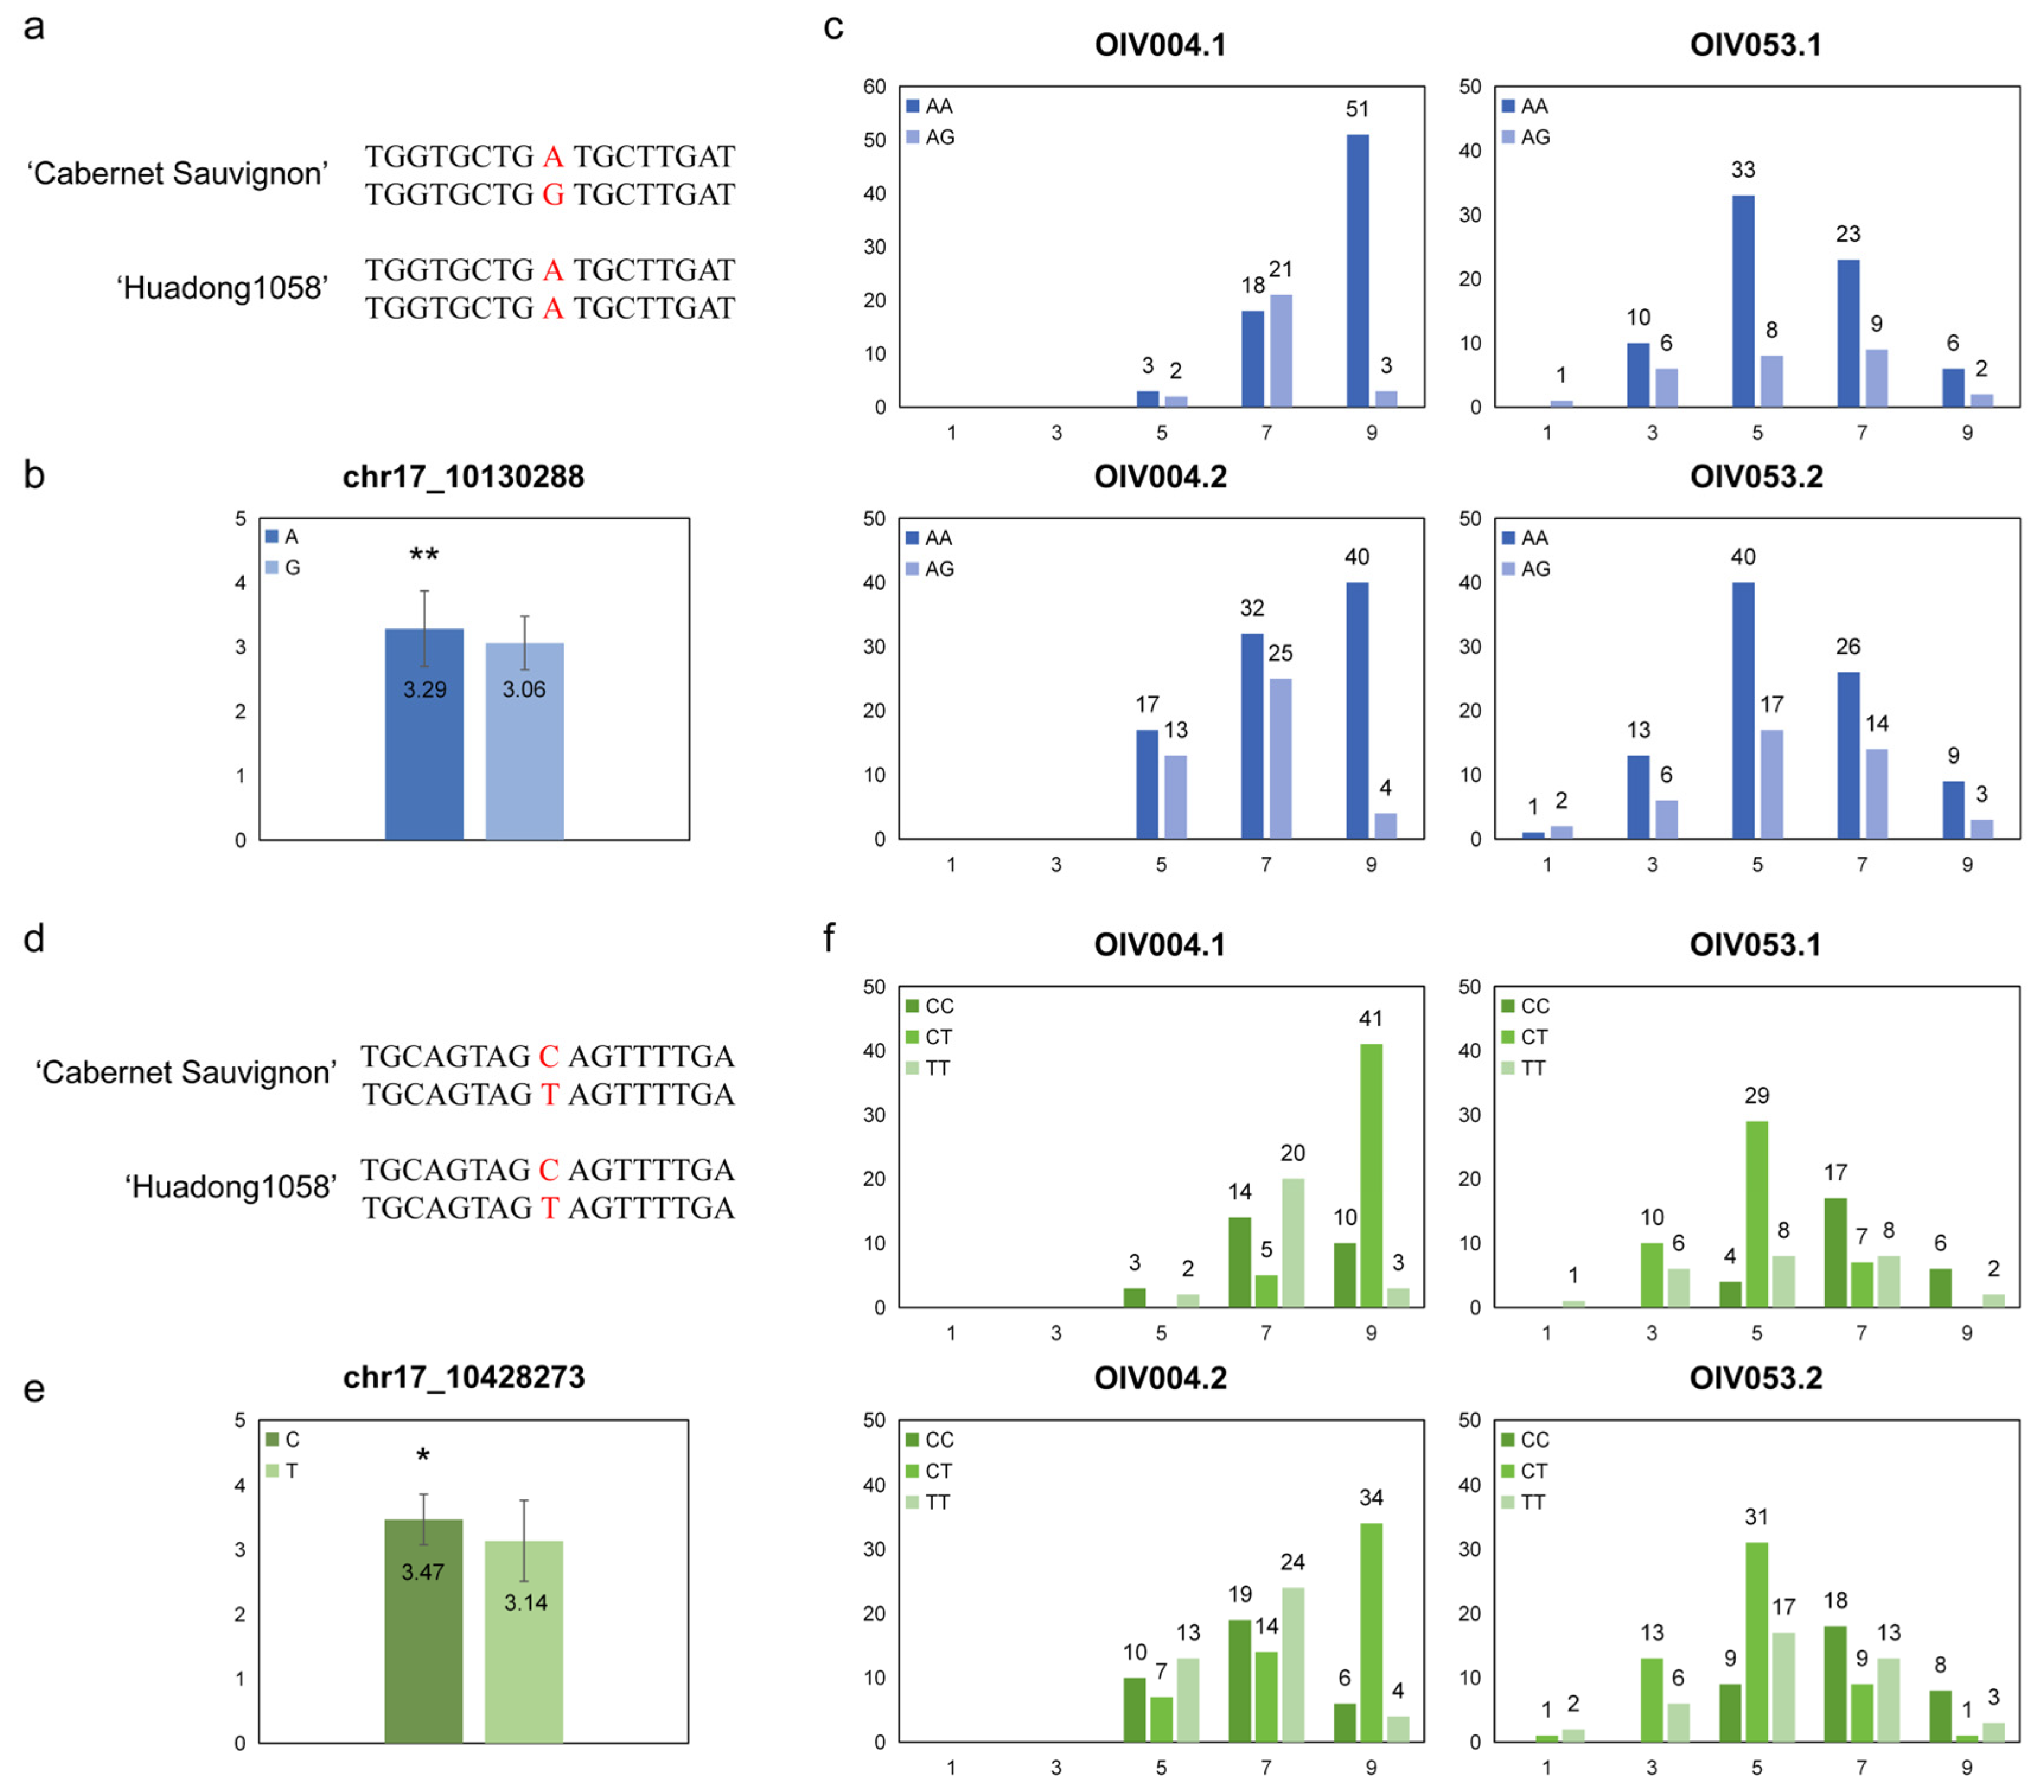
In QTL mapping and GWAS, there were two SNPs at the peak point (‘-log10(p)max’ and ‘LODmax’) which were ‘chr17_10130288’ in QTL mapping and ‘chr17_10428273’ in GWAS. These two SNPs were considered to have the highest correlation with the prostrate hair density phenotype.
The genotypes of these two markers in the two haplotypes of the parental genome were determined based on the flanking sequences; the ‘chr17_10130288’ were ‘AG’ in ‘Cabernet Sauvignon’ and ‘AA’ in ‘Huadong1058’ (Figure 5a), and the ‘chr17_10428273’ were both ‘CT’ in the parental genome (Figure 5d). The average phenotype score was calculated for the base type of the SNPs in F1 individuals. ‘A’ was significantly higher than ‘G’ on ‘chr17_10130288’ (Figure 5b), and ‘C’ was significantly higher than ‘T’ on ‘chr17_10428273’ (Figure 5e).
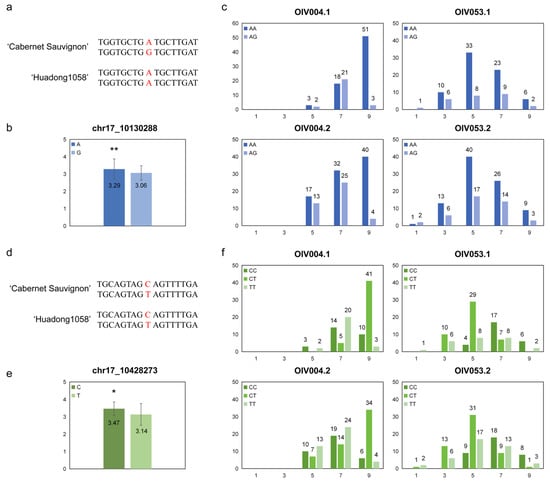
Figure 5.
Analysis of the highest correlation SNPs for prostrate hair density. (a,d) Base information of ‘chr17_10130288’ and ‘chr17_10428273’ alleles and their flanking sequence; (b,e) The mean phenotype levels of each base type, * p < 0.05 and ** p < 0.01 in two-sided t test; (c,f) Distribution of prostrate hair density levels among the hybrids were separated by genotype.
We counted the number of different genotypes for each phenotype score (Figure 5c,f). The ‘chr17_10130288’ genotype had a greater proportion of ‘AA’ when it had a high score. However, the ‘chr17_10428273’ genotype showed a significant difference only in ‘OIV053’, with a greater proportion of ‘CC’ but not in ‘OIV004’. This may be due to the fact that the locus was only mapped in the phenotypic assessment of ‘OIV053’, and the ‘chr17_10428273’ genotype is the peak marker for this locus.
4. Discussion
The key finding of this study was the identification of a major QTL, LH2, associated with the density of prostrate hairs on the tips of young shoots and young leaf abaxial surfaces. Our results showed that the position of this QTL on chromosome 17 was consistent in the two independent phenotypic assessments, supporting the hypothesis that leaf hair density follows a quantitative trait distribution. Previous grapevine studies have reported that leaf hairs contribute to quantitative resistance to pests and diseases. For example, some studies have demonstrated that leaf hairs act as a preexisting structural defense mechanism against downy mildew (DM) in various grapevine cultivars [15,26]. In addition, leaf size was also associated with DM resistance, with bigger leaves increasing sensitivity. The grapevine cultivar with dense hairs, such as ‘Concord’, exhibit durable foliar resistance to downy mildew (DM), suggesting that selecting dense prostrate hairs could enhance resistance to various biotic stresses [27]. Furthermore, breeding ‘hairy’ grapevines offers a sustainable alternative to R gene-mediated resistance, which is often compromised by aggressive pathogen isolates within a few years [28]. In our study, two SNPs, ‘chr17_10130288’ and ‘chr17_10428273’, were found to be significantly associated with the prostrate hair density phenotype, highlighting their potential utility in marker-assisted selection for breeding programs. Furthermore, the identification of the LH2 locus presents additional opportunities for improving durable resistance. Integrating traits such as prostrate hair density with gene pyramiding strategies could facilitate the development of cultivars with long-lasting resistance, reducing the need for chemical interventions and promoting sustainable viticulture practices.
In the case of ‘OIV004’ and ‘OIV053’, we observed a significant difference in the correlation between shoot tip and young leaf hair densities, with a higher correlation observed in young leaves. Trichome density in grape leaves is influenced by leaf shape [29], developmental stage [30], leaf position [31], and genetic factors [6]. Furthermore, the presence of hairs has been associated with increased predatory mite abundance and reduced DM severity in hybrid grape populations [16,32].
Phenotypic analysis revealed significant differences in prostrate hair density between the parental grapevine varieties, ‘Cabernet Sauvignon’ and ‘Huadong 1058’. The progeny exhibited continuous variation, reflecting the complex inheritance pattern of this trait. As a characteristic with less attention, the difference in leaf hair density can be used for identification among grapevine cultivars [33], which is neglected in previous studies. Additionally, dense leaf hair provides quantitative resistance, such as the resistance conferred by the LH1 locus [34]. These findings suggest that prostrate hair density on grapevine leaves may be influenced by multiple genetic factors, and the LH2 locus may be a potential target for breeding resistant cultivars. Through a combined analysis of QTL mapping and GWAS, we identified the boundary range of the LH2 locus on chromosome 17 to be between 9.56 and 10.54 Mbp. Within this range, we identified 92 candidate genes, and GO enrichment analysis revealed that these genes are involved in various biological processes, including cellular and metabolic processes. The candidate gene analysis further highlighted the involvement of transcription factors, such as NAC and MYB, which have previously been implicated in trichome formation and resistance to disease in other plant species [35,36]. The identification of these candidate genes provides a foundation for further studies to determine their roles in the development of prostrate hairs and their potential contribution to resistance against pests and pathogens.
In addition, we explored the application potential of the GBTS technology used in this study for analyzing genetic relationships and population structure (Figure 6). Using GBTS sequencing data, we constructed a phylogenetic tree and analyzed the genetic relationships of 47 grapevine varieties/strains with different genetic backgrounds from the resource garden. The results showed that most of the East Asian grape populations were clearly clustered together, while the Eurasian and American grape populations clustered with most of the Eurasian–American hybrids. This clustering was consistent with the classification based on the origin of grapevines. Further analysis using a kinship heatmap revealed that ‘Huadong 1058’ and ‘Huadong-GX’, both belonging to the East Asian population, were most closely related, while ‘Cabernet Sauvignon’ and ‘Cabernet Franc’ also showed a close genetic relationship which was well reflected in the heatmap. Additionally, cross-validation analysis predicted that the optimal number of clusters for these 47 grapevines was 3 or 4, indicating that these grapevines could be classified into different subpopulations based on their genetic background. The results of the population structure analysis were also consistent with the current classification of the three major populations based on grapevine origin.
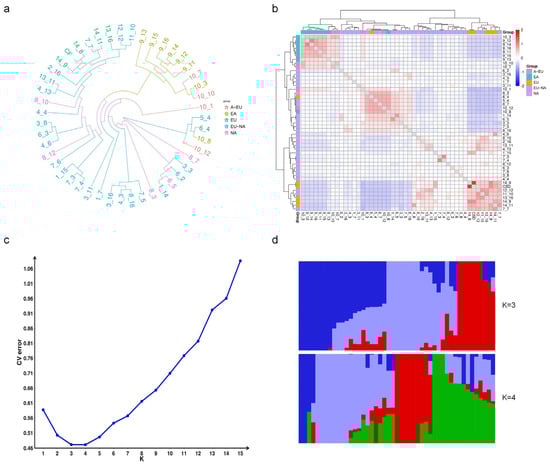
Figure 6.
Genetic relationship and population structure of grapevines. (a) Phylogenetic tree; (b) Kinship analysis heatmap. EA: East Asian grape, A-EU: Interspecific crossing from East Asian grape and Eurasian grape, EU: Eurasian grape, EU-NA: Interspecific crossing from Eurasian grape and American grape, NA: American grape. (c) Population structure analysis; (d) Histogram of the genetic composition analysis. Different colors indicate different presumed genetic origins.
5. Conclusions
Prostrate hairs are important for resistance to pests and diseases as well as environmental adaptability, making them of significant value in breeding programs. In this study, we conducted a phenotypic analysis of prostrate hairs in an F1 population derived from the cross between V. vinifera L. ‘Cabernet Sauvignon cv.’ and V. pseudoreticulata W.T.Wang ‘Huadong1058’. By combining QTL mapping, GWAS, and candidate gene analysis, we identified a locus on chromosome 17, named ‘LH2’, which is associated with the density of prostrate hairs. Phenotypic analysis revealed significant differences in prostrate hair density between parent vines, with the progeny showing continuous variation, indicating quantitative inheritance. QTL mapping and GWAS analysis identified the locus within the range from 9.56 to 10.54 Mbp on chr17, containing 92 genes. The enrichment analysis indicated that these genes are related to binding, catalytic activity, and cellular processes, suggesting their potential involvement in hair development. Specific SNP markers (e.g., ‘chr17_10130288’ and ‘chr17_10428273’) were significantly associated with prostrate hair density, providing a genetic basis for understanding hair development in grapevines and highlighting key candidate genes and markers for breeding improvement.
Supplementary Materials
The following supporting information can be downloaded at: https://www.mdpi.com/article/10.3390/horticulturae10121309/s1, Table S1: The 47 varieties/accessions used in the genetic relationship and population structure analysis; Table S2: Characteristics of genetic map of F1 population crosses from ‘Cabernet Sauvignon’ × ‘Huadong1058’; Figure S1: Genetic map of hybrid population crosses from Vitis vinifera ‘Cabernet Sauvignon’ × Vitis pseudoreticulata ‘Huadong1058’.
Author Contributions
Conceptualization, J.L. (Jiang Lu), P.F. and B.Y.; methodology, J.L. (Jiaqi Liu); software, X.Y.; validation, Z.X. and X.Y.; investigation, B.Y.; resources, P.F.; data curation, M.X. and Q.G.; writing—original draft preparation, B.Y.; writing—review and editing, B.Y. and Q.G., J.L. (Jiang Lu) and P.F.; visualization, J.L. (Jianxian Liang); supervision, J.L. (Jiang Lu); project administration, J.L. (Jiang Lu) and P.F.; funding acquisition, J.L. (Jiang Lu) and P.F. All authors have read and agreed to the published version of the manuscript.
Funding
This research was funded by the Science and Technology Department of Xinjiang Uygur Autonomous Region (grant no. 2022B02045-1-2), the Science and Technology Department of Guangxi Zhuang Autonomous Region (grant no. Gui Ke AB24010121), and the National Natural Science Foundation of China (grant no. 32272652).
Data Availability Statement
The original contributions presented in this study are included in the article/Supplementary Materials. Further inquiries can be directed to the corresponding authors.
Conflicts of Interest
The authors declare no conflicts of interest.
References
- Yang, B.H.; He, S.; Liu, Y.; Liu, B.C.; Ju, Y.L.; Kang, D.Z.; Sun, X.; Fang, Y. Transcriptomics integrated with metabolomics reveals the effect of regulated deficit irrigation on anthocyanin biosynthesis in Cabernet Sauvignon grape berries. Food Chem. 2020, 314, 126170. [Google Scholar] [CrossRef] [PubMed]
- Cheng, D.W.; Jiang, J.F.; Fan, X.C.; Zhang, Y.; Zhang, G.H.; Liu, C.H. Diversity analysis of Chinese wild grape species. J. Plant Genet. Resour. 2013, 14, 996–1012. [Google Scholar]
- Ma, Z.Y.; Wen, J.; Ickert-Bond, S.M.; Chen, L.Q.; Liu, X.Q. Morphology, structure, and ontogeny of trichomes of the grape genus (Vitis, Vitaceae). Front. Plant Sci. 2016, 7, 704. [Google Scholar] [CrossRef] [PubMed]
- Gago, P.; Conejero, G.; Martinez, M.C.; Boso, S.; This, P.; Verdeil, J.L. Microanatomy of leaf trichomes: Opportunities for improved ampelographic discrimination of grapevine (Vitis vinifera L.) cultivars. Aust. J. Grape Wine Res. 2016, 22, 494–503. [Google Scholar] [CrossRef]
- Schmidt, R.A. Leaf structures affect predatory mites (Acari: Phytoseiidae) and biological control: A review. Exp. Appl. Acarol. 2013, 62, 1–17. [Google Scholar] [CrossRef]
- Yin, L.; Karn, A.; Cadle-Davidson, L.; Zou, C.; Underhill, A.; Atkins, P.; Treiber, E.; Voytas, D.; Clark, M. Fine mapping of leaf trichome density revealed a 747-kb region on chromosome 1 in cold-hardy hybrid wine grape populations. Front. Plant Sci. 2021, 12, 587640. [Google Scholar] [CrossRef]
- Levin, D.A. The role of trichomes in plant defense. Q. Rev. Biol. 1973, 48, 3–15. [Google Scholar] [CrossRef]
- Ågren, J.; Schemske, D. Artificial selection on trichome number in Brassica rapa. Theor. Appl. Genet. 1992, 83, 673–678. [Google Scholar] [CrossRef]
- Grover, G.; Kaur, B.; Pathak, D.; Kumar, V. Genetic variation for leaf trichome density and its association with sucking insect-pests incidence in Asiatic cotton. Indian J. Genet. Plant Breed 2016, 76, 365–368. [Google Scholar] [CrossRef]
- Sato, Y.; Kudoh, H. Tests of associational defence provided by hairy plants for glabrous plants of Arabidopsis halleri subsp. gemmifera against insect herbivores. Ecol. Entomol. 2015, 40, 269–279. [Google Scholar] [CrossRef]
- Grebe, M. The patterning of epidermal hairs in Arabidopsis—Updated. Curr. Opin. Plant Biol. 2012, 15, 31–37. [Google Scholar] [CrossRef] [PubMed]
- Kono, A.; Shimizu, T. Leaf trichomes as an effective structure for disease resistance: The case of grapevine downy mildew. Jpn. Agric. Res. Q. 2020, 54, 293–298. [Google Scholar] [CrossRef]
- Staudt, G.; Kassemeyer, H. Evaluation of downy mildew resistance in various accessions of wild Vitis species. Vitis 1995, 34, 225–228. [Google Scholar]
- Kortekamp, A.; Wind, R.; Zyprian, E. The role of hairs on the wettability of grapevine (Vitis spp.) leaves. Vitis 1999, 38, 101–106. [Google Scholar]
- Kortekamp, A.; Zyprian, E. Leaf hairs as a basic protective barrier against downy mildew of grape. J. Phytopathol. 2008, 147, 453–459. [Google Scholar] [CrossRef]
- Barba, P.; Loughner, R.; Wentworth, K.; Nyrop, J.P.; Loeb, G.M.; Reisch, B.I. A QTL associated with leaf trichome traits has a major influence on the abundance of the predatory mite Typhlodromus pyri in a hybrid grapevine population. Hortic. Res. 2019, 6, 87. [Google Scholar] [CrossRef]
- Yang, L.; Li, M.; Shen, M.; Bu, S.; Zhu, B.; He, F.; Zhang, X.; Gao, X.; Xiao, J. Chromosome-level genome assembly and annotation of the native Chinese wild blueberry Vaccinium bracteatum. Fruit Res. 2022, 2, 8. [Google Scholar] [CrossRef]
- Fu, P.N.; Wu, W.; Lai, G.T.; Li, R.F.; Peng, Y.C.; Yang, B.H.; Wang, B.; Yin, L.; Qu, J.; Song, S.; et al. Identifying Plasmopara viticola resistance Loci in grapevine (Vitis amurensis) via genotyping-by-sequencing-based QTL mapping. Plant Physiol. Biochem. 2020, 154, 75–84. [Google Scholar] [CrossRef]
- Fu, P.N.; Tian, Q.Y.; Lai, G.T.; Li, R.F.; Song, S.R.; Lu, J. Cgr1, a ripe rot resistance QTL in Vitis amurensis ‘Shuang Hong’ grapevine. Hortic. Res. 2019, 6, 67. [Google Scholar] [CrossRef]
- Plant and Fungi Data Integration. GrapeReSeq_Illumina_20K. 2018. Available online: https://urgi.versailles.inra.fr/Species/Vitis/GrapeReSeq_Illumina_20K (accessed on 10 September 2020).
- Sun, Y.; Yang, B.H.; Li, M.M.; Liu, C.J.; Yin, Y.G.; Jia, N.; Wang, X.Y.; Zeng, Q.M.; Guo, Y.; Wang, Y.J.; et al. Rpv34: The noval Plasmopara viticola resistance locus in ‘Moldova’. Fruit Res. 2024, 4, e024. [Google Scholar] [CrossRef]
- Coombe, B.G. Adoption of a system for identifying grapevine growth stages. Aust. J. Grape Wine Res. 1995, 1, 104–110. [Google Scholar] [CrossRef]
- OIV. Descriptor List for Grape Varieties and Vitis Species, 2nd ed.; International Organization of Vine and Wine: Paris, France, 2009. [Google Scholar]
- Wang, J.B.; Zhang, Z.W. GAPIT Version 3: Boosting Power and Accuracy for Genomic Association and Prediction. Genom. Proteom. Bioinform. 2021, 19, 629–640. [Google Scholar] [CrossRef]
- Yang, B.H.; Wu, W.; Lv, J.L.; Li, J.Y.; Xu, Y.F.; Yin, L.; Lu, J.; Fu, P. Identification of sex determination locus and development of marker combination in Vitis based on genotyping by target sequencing. Fruit Res. 2023, 3, 31. [Google Scholar] [CrossRef]
- Divilov, K.; Barba, P.; Cadle-Davidson, L.; Reisch, B.I. Single and multiple phenotype QTL analyses of downy mildew resistance in interspecific grapevines. Theor. Appl. Genet. 2018, 131, 1133–1143. [Google Scholar] [CrossRef]
- Cadle-Davidson, L. Variation within and between Vitis spp. for foliar resistance to the downy mildew pathogen Plasmopara viticola. Plant Dis. 2008, 92, 1577–1584. [Google Scholar] [CrossRef] [PubMed]
- Peressotti, E.; Wiedemann-Merdinoglu, S.; Delmotte, F.; Bellin, D.; Gaspero, G.; Testolin, R.; Merdinoglu, D.; Mestre, P. Breakdown of resistance to grapevine downy mildew upon limited deployment of a resistant variety. BMC Plant Biol. 2010, 10, 147. [Google Scholar] [CrossRef] [PubMed]
- Chitwood, D.H.; Ranjan, A.; Martinez, C.C.; Headland, L.R.; Thiem, T.; Kumar, R.; Covington, M.F.; Hatcher, T.; Naylor, D.T.; Zimmerman, S.; et al. A modern ampelography: A genetic basis for leaf shape and venation patterning in grape. Plant Physiol. 2013, 164, 259–272. [Google Scholar] [CrossRef]
- Karabourniotis, G.; Liakopoulos, G.; Nikolopoulos, D.; Bresta, P. Protective and defensive roles of non-glandular trichomes against multiple stresses: Structure–function coordination. J. For. Res. 2020, 31, 1–12. [Google Scholar] [CrossRef]
- Wang, X.J.; Shen, C.; Meng, P.H.; Tan, G.F.; Lv, L.T. Analysis and review of trichomes in plants. BMC Plant Biol. 2021, 21, 70. [Google Scholar] [CrossRef]
- Kono, A.; Ban, Y.; Mitani, N.; Fujii, H.; Sato, S.; Suzaki, K.; Azuma, A.; Onoue, N.; Sato, A. Development of SSR markers linked to QTL reducing leaf hair density and grapevine downy mildew resistance in Vitis vinifera. Mol. Breed. 2018, 38, 138. [Google Scholar] [CrossRef]
- Gerrath, J.; Posluszny, U.; Melville, L. Taming the Wild Grape: Botany and Horticulture in the Vitaceae; Springer: Berlin/Heidelberg, Germany, 2015. [Google Scholar]
- Poland, J.A.; Balint-Kurti, P.J.; Wisser, R.J.; Pratt, R.C.; Nelson, R.J. Shades of gray: The world of quantitative disease resistance. Trends Plant Sci. 2009, 14, 21–29. [Google Scholar] [CrossRef] [PubMed]
- Payne, T.; Clement, J.; Arnold, D.; Lloyd, A. Heterologous myb genes distinct from GL1 enhance trichome production when overexpressed in Nicotiana tabacum. Development 1999, 126, 671–682. [Google Scholar] [CrossRef] [PubMed]
- Liu, X.W.; Wang, T.; Bartholomew, E.; Black, K.; Dong, M.M.; Zhang, Y.; Yang, S.; Cai, Y.; Xue, S.; Weng, Q.; et al. Comprehensive analysis of NAC transcription factors and their expression during fruit spine development in cucumber (Cucumis sativus L.). Hortic. Res. 2018, 5, 31. [Google Scholar] [CrossRef] [PubMed]

Disclaimer/Publisher’s Note: The statements, opinions and data contained in all publications are solely those of the individual author(s) and contributor(s) and not of MDPI and/or the editor(s). MDPI and/or the editor(s) disclaim responsibility for any injury to people or property resulting from any ideas, methods, instructions or products referred to in the content. |
© 2024 by the authors. Licensee MDPI, Basel, Switzerland. This article is an open access article distributed under the terms and conditions of the Creative Commons Attribution (CC BY) license (https://creativecommons.org/licenses/by/4.0/).