Article

Genome-Wide Identification and Expression Analysis of Fifteen Gene Families Involved in Anthocyanin Synthesis in Pear

1
College of Horticulture, State Key Laboratory of Crop Genetics & Germplasm Enhancement and Utilization, Nanjing Agricultural University, Nanjing 210095, China
2
Zhongshan Biological Breeding Laboratory, No. 50 Zhongling Street, Nanjing 210014, China
3
Academy for Advanced Interdisciplinary Studies, Nanjing Agricultural University, Nanjing 210095, China
*
Author to whom correspondence should be addressed.
These authors contributed equally to this work.
Horticulturae 2024, 10(4), 335; https://doi.org/10.3390/horticulturae10040335
Submission received: 11 March 2024 / Revised: 25 March 2024 / Accepted: 25 March 2024 / Published: 28 March 2024

Abstract

:
Anthocyanins play a crucial role in imparting red coloration to pear fruits. However, the specific number and expression patterns of each member within the anthocyanin biosynthesis-related gene families in pears require systematic exploration. In this study, based on the pear genome we identified 15 gene families involved in the anthocyanin biosynthesis pathway using the BLASTP and Hidden Markov Model search methods, comprising a total of 94 enzyme genes. Through phylogenetic analysis, conserved domains, motif, and gene structure analysis, these gene families were further categorized into eight distinct lineages. Subsequent collinearity analysis revealed that the expansion of anthocyanin synthesis-related gene families primarily originated from segmental duplications. Analysis of cis-element in the promoter regions of genes related to anthocyanin synthesis unveiled the presence of light-responsive elements and various hormone-responsive elements. This suggests that changes in light stimulation and hormone levels may influence anthocyanin synthesis. RNA-Seq and qRT-PCR analyses indicated differential expression of anthocyanin biosynthesis-related genes between the peel and flesh tissues. During the accumulation of anthocyanins in red-fleshed pears, upstream genes in the anthocyanin biosynthesis pathway such as PbrPAL2, PbrC4H2, PbrC4H3, Pbr4CL2, Pbr4CL17, PbrF3H5, and PbrF3H6 exhibited high expression levels, likely contributing significantly to the red coloration of pear flesh. In summary, we have identified the number of gene family members involved in pear anthocyanin biosynthesis and analyzed the expression patterns of the genes related to pear anthocyanin biosynthesis. These findings provide a solid foundation for further research on the regulatory mechanisms underlying pear anthocyanin biosynthesis and the breeding of red pear varieties.

1. Introduction

Pear (Pyrus spp.), one of the most economically significant temperate fruit tree species, belongs to the subtribe Malinae of the Amygdaloideae subfamily within Rosaceae [1]. Fruit color serves as a crucial aesthetic quality of pears [2], and in recent years, the rare red pear has increasing gained favor among consumers [3]. Presently, red European pears enjoy global acceptance and cultivation, while green/yellow Asian pears continue to dominate the market in terms of production [4]. Unlike European pears, which readily redden, Asian pears pose challenges in attaining red hues, particularly in warmer regions of China [5]. Consequently, understanding the coloring mechanism of pear fruit has emerged as a pivotal aspect in breeding endeavors.
The reddening of pear fruit is attributed to the accumulation of anthocyanins [6]. Anthocyanins represent a significant secondary metabolite within the flavonoid metabolism pathway [7]. They facilitate the dispersal of plant pollen and seeds [8,9], while also serving vital roles in plant disease resistance and protection against ultraviolet radiation [10,11,12]. Additionally, the antioxidant properties of anthocyanins enable them to prevent human cardiovascular diseases, thus promoting human health [13,14,15,16]. The anthocyanin biosynthesis pathway initiates from the phenylpropanoid pathway and progresses through the flavonoid pathway [17,18,19] (Figure 1). The phenylpropanoid pathway mainly includes the following processes: phenylalanine is catalyzed by phenylalanine ammonia-lyase (PAL), cinnamic acid 4-hydroxylase (C4H), and 4-coumaroyl-CoA ligase (4CL) to generate p-coumaroyl-CoA. In the flavonoid biosynthetic pathway, two types of related structural genes are distinguished: early biosynthetic genes (EBGs) and late biosynthetic genes (LBGs) [20]. EBGs, including chalcone synthase (CHS), chalcone isomerase (CHI), flavonoid 3-hydroxylase (F3H), flavonoid 3′-hydroxylase (F3′H), and flavonoid 3′,5′-hydroxylase (F3′5′H), catalyze the conversion of acetyl-CoA and p-coumaroyl-CoA into dihydrokaempferol, dihydroquercetin, and dihydromyricetin. LBGs comprising dihydroflavonol 4-reductase (DFR), anthocyanidin synthase/leucoanthocyanidin dioxygenase (ANS/LDOX), and UDP-glucose flavonoid glucosyltransferase (UFGT) further convert these compounds into anthocyanins. The phenylpropanoid pathway genes and EBGs are upstream genes, while LBGs are downstream genes in the anthocyanin biosynthetic pathway [20,21]. Moreover, the three dihydroflavonols can be transformed into three flavonols (kaempferol, quercetin, and myricetin) by flavonol synthase (FLS). Leucoanthocyanidins undergo catalysis by leucoanthocyanidin reductase (LAR) to yield catechins, whereas anthocyanidin reductase (ANR) can catalyze anthocyanidins to produce epicatechins. The combination of catechin and epicatechin results in the formation of proanthocyanidins [22].
Anthocyanins synthesis is predominantly regulated by two classes of genes: structural genes involved in anthocyanin biosynthesis, and regulatory genes [23]. Recent research highlights MdNAC1’s role in promoting anthocyanin synthesis in apple (Malus domestica) by enhancing gene expression by directly binding to the MdUFGT promoter [24]. Similarly, in pear (Pyrus communis), PcERF5 can activate the transcription of flavonoid biosynthetic genes (PcDFR, PcANS, and PcUFGT), along with two key transcription factors, PcMYB10 and PcMYB114 [25]. Transcriptional repressors also play a role in the regulation of anthocyanin synthesis. In tomato (Solanum lycopersicum L.), SlMYB7 has been identified to suppress the expression of SlANS [26]. In pear (Pyrus spp.), PpERF9 can directly inhibit the expression of the MYB transcription factor PpMYB114 by binding to its promoter, thereby inhibiting anthocyanin synthesis [27]. Alterations in the expression levels of structural genes implicated in anthocyanin biosynthesis directly impact anthocyanin content. Hence, a methodical exploration of genes associated with anthocyanin biosynthesis bears considerable significance.
Figure 1. The anthocyanin biosynthesis pathway in Chinese white pear. The construction of the anthocyanin biosynthesis pathway diagram in pears references prior reports [28,29], with further refinement for clarity. The purple box represents enzyme genes upstream of the anthocyanin biosynthesis pathway; the green box represents enzyme genes downstream of the anthocyanin biosynthesis pathway; the gray box represents other enzyme genes in the anthocyanin biosynthesis pathway; yellow boxes represent proanthocyanidins; blue boxes represent flavonoids; red boxes represent anthocyanins. The enzyme names were abbreviated as follows: PAL, phenylalanine ammonia lyase; C4H, cinnamic acid 4-hydroxylase; 4CL, 4-coumarate: CoA ligase; CHS, chalcone synthase; CHI, chalcone isomerase; F3H, flavanone 3-hydroxylase; F3′H, flavonoid 3′-hydroxylase; F3′5′H, flavanone 3′,5′-hydroxylase; FLS, flavonol synthase; DFR, dihydroflavonol 4-reductase; ANS, anthocyanidin synthase; LDOX, leucoanthocyanidin dioxygenase; LAR, leucoanthocyanidin reductase; ANR, anthocyanidin reductase; UFGT, UDP-glucose flavonoid 3-O-glucosyltransferase.
Horticulturae 10 00335 g001
Previous studies have revealed the pear PAL and 4CL gene families [30,31], while other researchers have utilized cDNA end rapid amplification of cDNA end (RACE) technology to clone the pear genes associated with anthocyanin biosynthesis, such as PpPAL2, PpCHS2, PpCHS3, PpCHS4, PpCHI2, PpDFR2, and PpUFGT2 [32]. However, the exact number of genes involved in the pear anthocyanin biosynthesis pathway remains unclear, significantly impeding understanding of the anthocyanin biosynthesis mechanism. Hence, a systematic investigation of the structural genes implicated in anthocyanin biosynthesis is imperative. Fortunately, the genome of Chinese white pear has been fully sequenced [33], offering an opportunity for a comprehensive analysis of pear anthocyanin biosynthesis-related genes. We conducted an in-depth examination of these genes, encompassing genome-wide identification, phylogenetic relationships, chromosome distribution, genomic structure, and expression patterns. Our research holds promise for enhancing comprehension of the molecular mechanisms governing anthocyanin synthesis and regulation in pears, thereby laying the groundwork for the breeding of red pear varieties.

2. Materials and Methods

2.1. Whole-Genome Identification of the Anthocyanin Biosynthesis-Related Genes

The genome of ‘Dangshansuli’ (Pyrus bretschneideri Rehd.) was obtained from the Pear Genome Project (http://peargenome.njau.edu.cn/, accessed on 13 September 2023) [33], and the Arabidopsis-related protein sequences were retrieved from the TAIR10 database (https://www.arabidopsis.org/, accessed on 13 September 2023). Given that the F3′5′H and LAR genes are unavailable in Arabidopsis thaliana [34], the sequences of Glycine max GmF3′5′H, GmLAR1, and GmLAR2 were downloaded from the National Center for Biotechnology Information database (https://www.ncbi.nlm.nih.gov/, accessed on 13 September 2023). Anthocyanin biosynthesis-related genes proteins of Malus domestica, including MdPAL, MdC4H, Md4CL, MdCHS, MdCHI, MdF3H, MdF3′H, MdF3′5′H, MdFLS, MdDFR, MdLAR, MdANR, MdLDOX, MdANS, and MdUFGT were obtained from the Phytozome v13 database (https://phytozome-next.jgi.doe.gov/, accessed on 13 September 2023). To identify the genes of the anthocyanin biosynthesis pathway-related gene family, two different methods were employed. Initially, all pear protein sequences underwent BLASTP (version 2.14.0+) [35] scanning using Arabidopsis anthocyanin biosynthesis pathway-related protein sequences as queries. Subsequently, a Hidden Markov Model search (HMM search) software (version 3.3.2) [36] was conducted for the pear protein database using the HMM profile with the anthocyanin biosynthesis pathway-related protein domain. The overlapping results obtained from both methods were utilized for further analysis The HMM protein file was downloaded from InterProScan (https://www.ebi.ac.uk/interpro/search/text/, accessed on 13 September 2023). To ensure the completeness of the anthocyanin biosynthesis pathway-related protein domain and conduct functional analysis of the corresponding protein sequence, we utilized the CDD tool (https://www.ncbi.nlm.nih.gov/cdd/, accessed on 13 September 2023), SMART tool (http://smart.emblheidelberg.de/, accessed on 13 September 2023), and InterProScan tool (http://www.ebi.ac.uk/Tools/pfa/iprscan/, accessed on 13 September 2023). Furthermore, protein molecular weights (Mw) and isoelectric points (PI) for the anthocyanin biosynthesis pathway-related proteins were predicted using the Expasy tool (https://www.expasy.org/, accessed on 13 September 2023). Subcellular localizations were determined through the WoLFPSORT server (https://wolfpsort.hgc.jp/, accessed on 13 September 2023).

2.2. Multiple-Sequence Alignment and Phylogenetic Tree Analysis

The amino acid sequences of anthocyanin biosynthesis pathway-related proteins from Pyrus bretschneideri, Arabidopsis thaliana and Malus domestica were utilized to construct a phylogenetic tree. Initially, all sequences underwent alignment using the multiple alignment tool, MAFFT software (version 7.520) [37]. Subsequently, the MAFFT software output was submitted to the IQ-TREE (version 1.6.12) webserver [38] to estimate the phylogenetic relationships of the anthocyanin biosynthesis pathway-related proteins employing the maximum likelihood (ML) method with 1000 bootstrap replicates. Finally, the phylogenetic tree of the anthocyanin biosynthesis pathway-related proteins was generated using the interactive tree of life (iTOL version 5) tool [39].

2.3. Analysis of the Gene Structure, Conserved Motifs, and Conserved Domain of Anthocyanin Biosynthesis-Related Family Proteins

The gene structural information for anthocyanin biosynthesis-related genes was obtained from the pear genome database (http://peargenome.njau.edu.cn/, accessed on 13 September 2023) [33]. The conservation of structural domains was analyzed using the CDD search function of NCBI (https://www.ncbi.nlm.nih.gov/cdd/, accessed on 19 September 2023). The MEME tool (Multiple Em for Motif Elicitation) (https://meme-suite.org/meme/tools/meme/, accessed on 23 September 2023) was employed to identify conserved motifs, with parameters set as follows: distribution, any number; number of different motifs, 20; minimum motif width, 6; and maximum motif width, 100. Subsequently, the gene structure, conserved motifs, and conserved domain were visualized using the Gene Structure View (Advanced) function in TBtools software (version 1.098) [40].

2.4. Chromosomal Location and Synteny Analysis

The duplication events of pear anthocyanin biosynthesis-related genes were analyzed using the MCScanX software (version 1.1.11) [41]. The synteny analysis and visualization of genes related to anthocyanin biosynthesis pathways in Pyrus bretschneideri, as well as two representative species, Arabidopsis thaliana and Malus domestica, were conducted using TBtools software. Additionally, the chromosomal localization information for genes related to the pear anthocyanin biosynthesis pathway was visualized using TBtools software.

2.5. Cis-Regulatory Element Analysis of Putative Promoters

First, we utilized the ‘Gtf/Gff3 Sequences Extract’ function in TBtools to extract a 2000 bp sequence upstream of the transcription start site for all genes related to the anthocyanin biosynthesis pathway, considering them as putative promoter regions. Subsequently, we employed PlantCARE (https://bioinformatics.psb.ugent.be/webtools/plantcare/html/, accessed on 8 October 2023) to predict the cis-regulatory elements within the promoter region of the anthocyanin biosynthesis pathway-related genes. Finally, we visualized the extracted sequences using TBtools software’s ‘Simple BioSequence Viewer’ function.

2.6. Expression Analysis Based on RNA-Seq

Transcriptome data for both bagged and unbagged stages of the Chinese sand pear variety ‘Yunhongyihao’ [42], as well as transcriptome data for red-fleshed and white-fleshed pears were downloaded [25]. For the ‘Yunhongyihao’, variety. Young fruits were covered with double-layer yellow–black paper bags after 35 days of flowering for the bagging treatment. Ten days prior to commercial maturity, 30 fruits were randomly selected for bag removal and exposure to sunlight, while the remaining fruits continued to be bagged. Peel samples were collected on the fourth (D1), eighth (D2), and tenth (D3) days after bag removal. Bagged fruits (B1, B2, and B3) were sampled at corresponding times. Approximately 5–6 pear fruits were collected for each time point and treatment. To analyze the expression levels of the pathway-related genes, the RPKM value (Reads Per Kilobase Per Million Mapped Reads) was calculated, and log2(RPKM + 1) values were obtained. Subsequently, a heatmap was generated using the “pheatmap” function in R to visualize the expression patterns of these genes.

2.7. Quantitative Real-Time PCR Analysis (qRT-PCR)

For quantitative reverse-transcription PCR (qRT-PCR) analysis, fruit peel tissue samples were collected from bagged (B1, B2, B3) and unbagged (D1, D2, D3) ‘Yunhongyihao’ pears, as well as from six different varieties of red-skinned and green-skinned pears. The RNA was extracted and reverse-transcribed to synthesize cDNA (TransGen Biotech Co. Ltd., Beijing, China); primers were designed using the NCBI website (https://www.ncbi.nlm.nih.gov/tools/primer-blast/index.cgi, accessed on 10 October 2023) (Table S1). SYBR Green I Mastermix (Roche, Madison, WI, USA) was utilized for qRT-PCR analysis. The composition of the PCR reaction system was as follows: 1 μL (10 μmol L−1) of each primer, 10 μL of 480 SYBR GREEN I Master, 1 μL of cDNA template, and 7 μL of RNase-free water. The qRT-PCR protocol consisted of an initial denaturation step at 95 °C for 10 min, followed by denaturation at 95 °C for 3 s, annealing at 60 °C for 10 s, and extension at 72 °C for 30 s, repeated for 45 cycles. A final extension step at 72 °C for 30 s concluded the amplification process. The 2−∆∆Ct method was employed to calculate the relative gene expression levels in different samples [43], selecting the sample with the highest Ct value in each group as the reference and comparing other samples to it. The pear gene PbrGAPDH (Table S1) was used as an internal control [44].

3. Results

3.1. Identification and Characterization Anthocyanin Biosynthesis Pathway Genes in Chinese White Pear

In this study, we identified a total of 94 genes associated with anthocyanin biosynthesis in the Chinese pear genome (Table 1 and Table S2). These 94 genes are categorized into 15 gene families, comprising 2 PAL, 3 C4H, 18 4CL, 14 CHS, 8 CHI, 9 F3H, 6 F3′H, 2 F3′5′H, 4 FLS, 8 DFR, 4 ANS, 3 ANR, 2 LAR, 3 LDOX, and 8 UFGT. To distinguish members of the anthocyanin biosynthesis-related gene families, we have renamed all relevant genes based on the chromosomal locations. These 94 genes are unevenly distributed across all 17 chromosomes of the pear, with some genes also present on unanchored scaffolds. The number of genes on each chromosome ranges from 1 to 12. Notably, chromosome 15 harbors the highest number of genes (12), followed by chromosome 7 (9), whereas chromosomes 8, 12, and 16 each contain only 1 gene (Figure S1, Table S3).
In this study, the basic information of 94 anthocyanins biosynthesis-related genes was analyzed, including protein sequence lengths, relative molecular weights (MW), and isoelectric point (pI). The length of the anthocyanin biosynthesis-related protein sequences ranged from 219 to 1016 amino acids, while the protein mass ranged from 23.35 kDa to 110.42 kDa. Additionally, the protein pIs ranged from 4.99 to 9.36 (Table 1 and Table S3). Subcellular localization prediction results indicated that the majority of genes were localized in the chloroplast (30/94) and cytoplasm (30/94), followed by the cytoskeleton (10/94). Additionally, nine genes were localized in the peroxisome, eight in the plasma membrane, three in the cell nucleus, and two in the vacuole. Genes localized in the endoplasmic reticulum and mitochondria had the fewest representatives, with only one gene each.

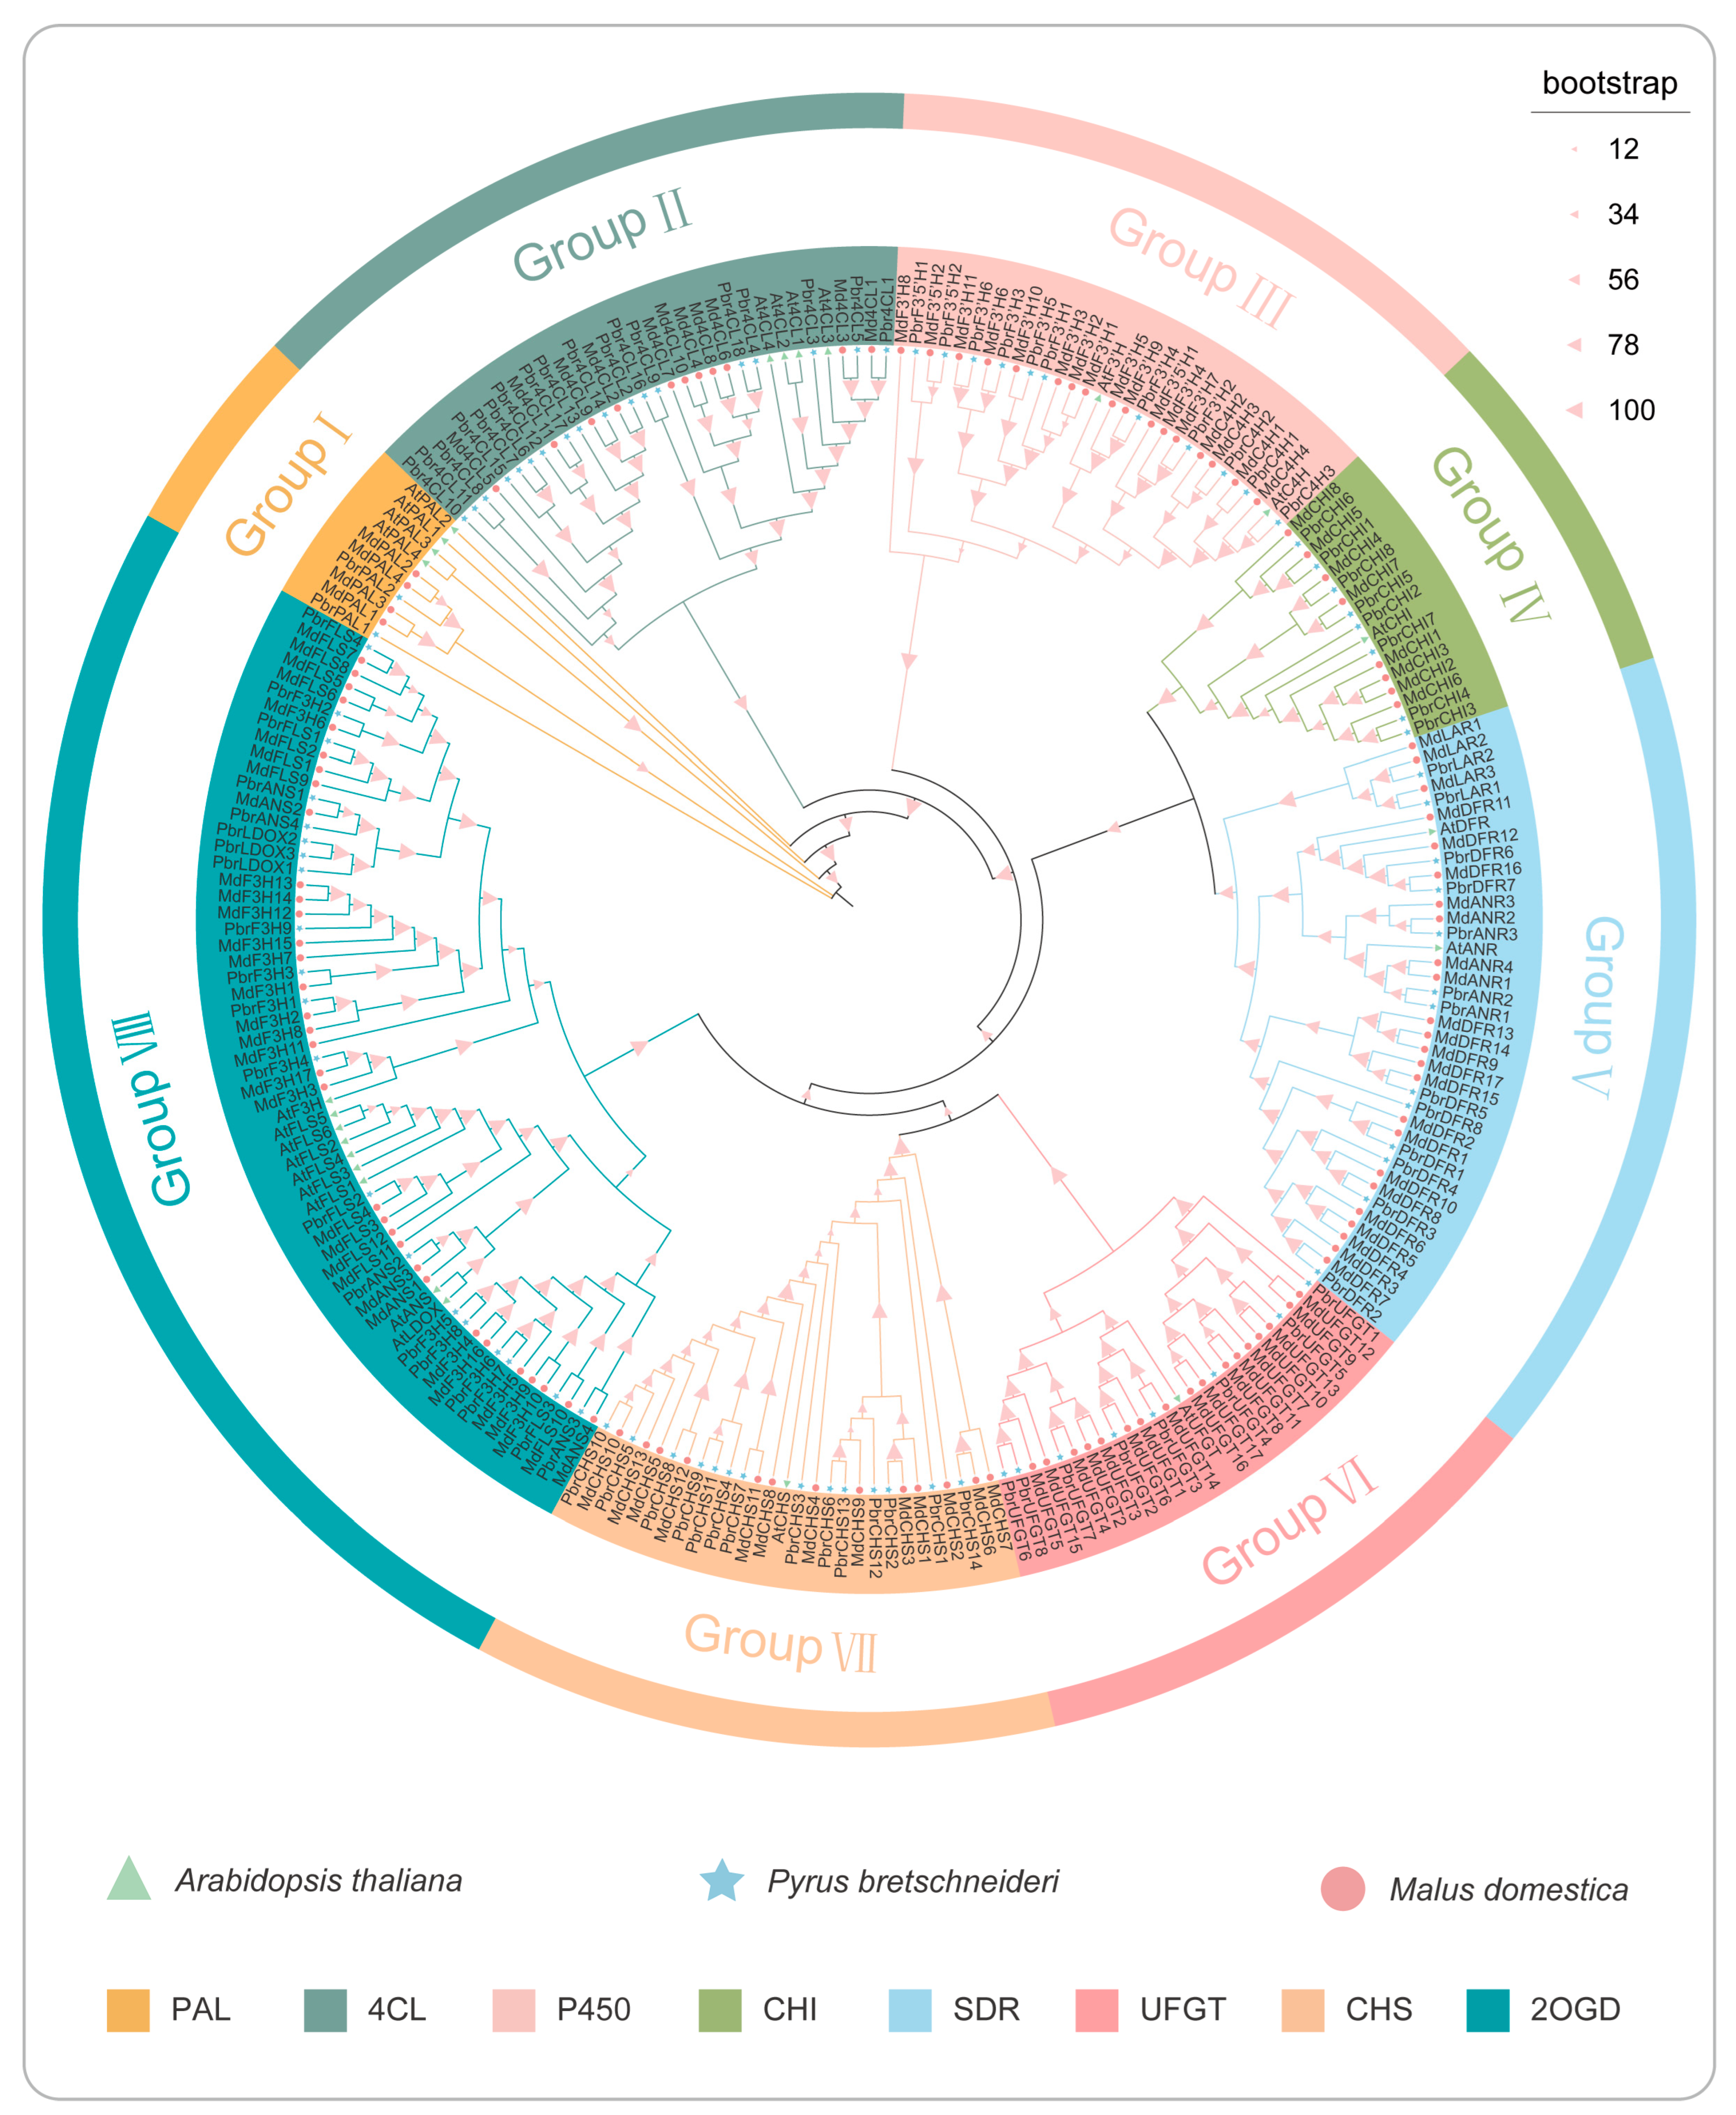
3.2. Phylogenetic Analysis of Anthocyanin Biosynthesis-Related Gene Family in Pear and Other Species

To better elucidate the evolutionary relationships of the anthocyanin biosynthesis-related gene family, a phylogenetic three was constructed for 245 members of this family across three different species: Arabidopsis thaliana (24), Malus domestica (127), and Pyrus bretschneideri (94) (Figure 2). According to the phylogenetic tree, anthocyanin biosynthesis-related gene family members can be classified into eight groups. The number of genes varies unevenly among different groups, with group Ⅷ containing the highest number, totaling 62 genes. Within this group there are 9 PbrF3H, 4 PbrFLS, 4 PbrANS, 3 PbrLDOX, 17 MdF3H, 12 MdFLS, 4 MdANS, 1 AtF3H, 6 AtFLS, 1 AtANS, and 1 AtLDOX gene. Conversely, group Ⅰ comprises the fewest number of genes, totaling 10 genes. This group includes 2 PbrPAL, 4 MdPAL, and 4 AtPAL genes. It is noteworthy that PbrPAL1, AtPAL1, and AtPAL2 form separate branches, suggesting potential divergence during evolution, indicating differences in gene structure or function compared to the other seven genes. Observing the clustering results, we note that the PAL gene, 4CL gene, CHS gene, CHI gene, and UFGT gene each form individual clusters. Similarly, the F3H, FLS, LDOX, and ANS genes, as well as C4H, F3′H, and F3′5′H, and DFR, ANR, and LAR genes, each form separate lineage groups.

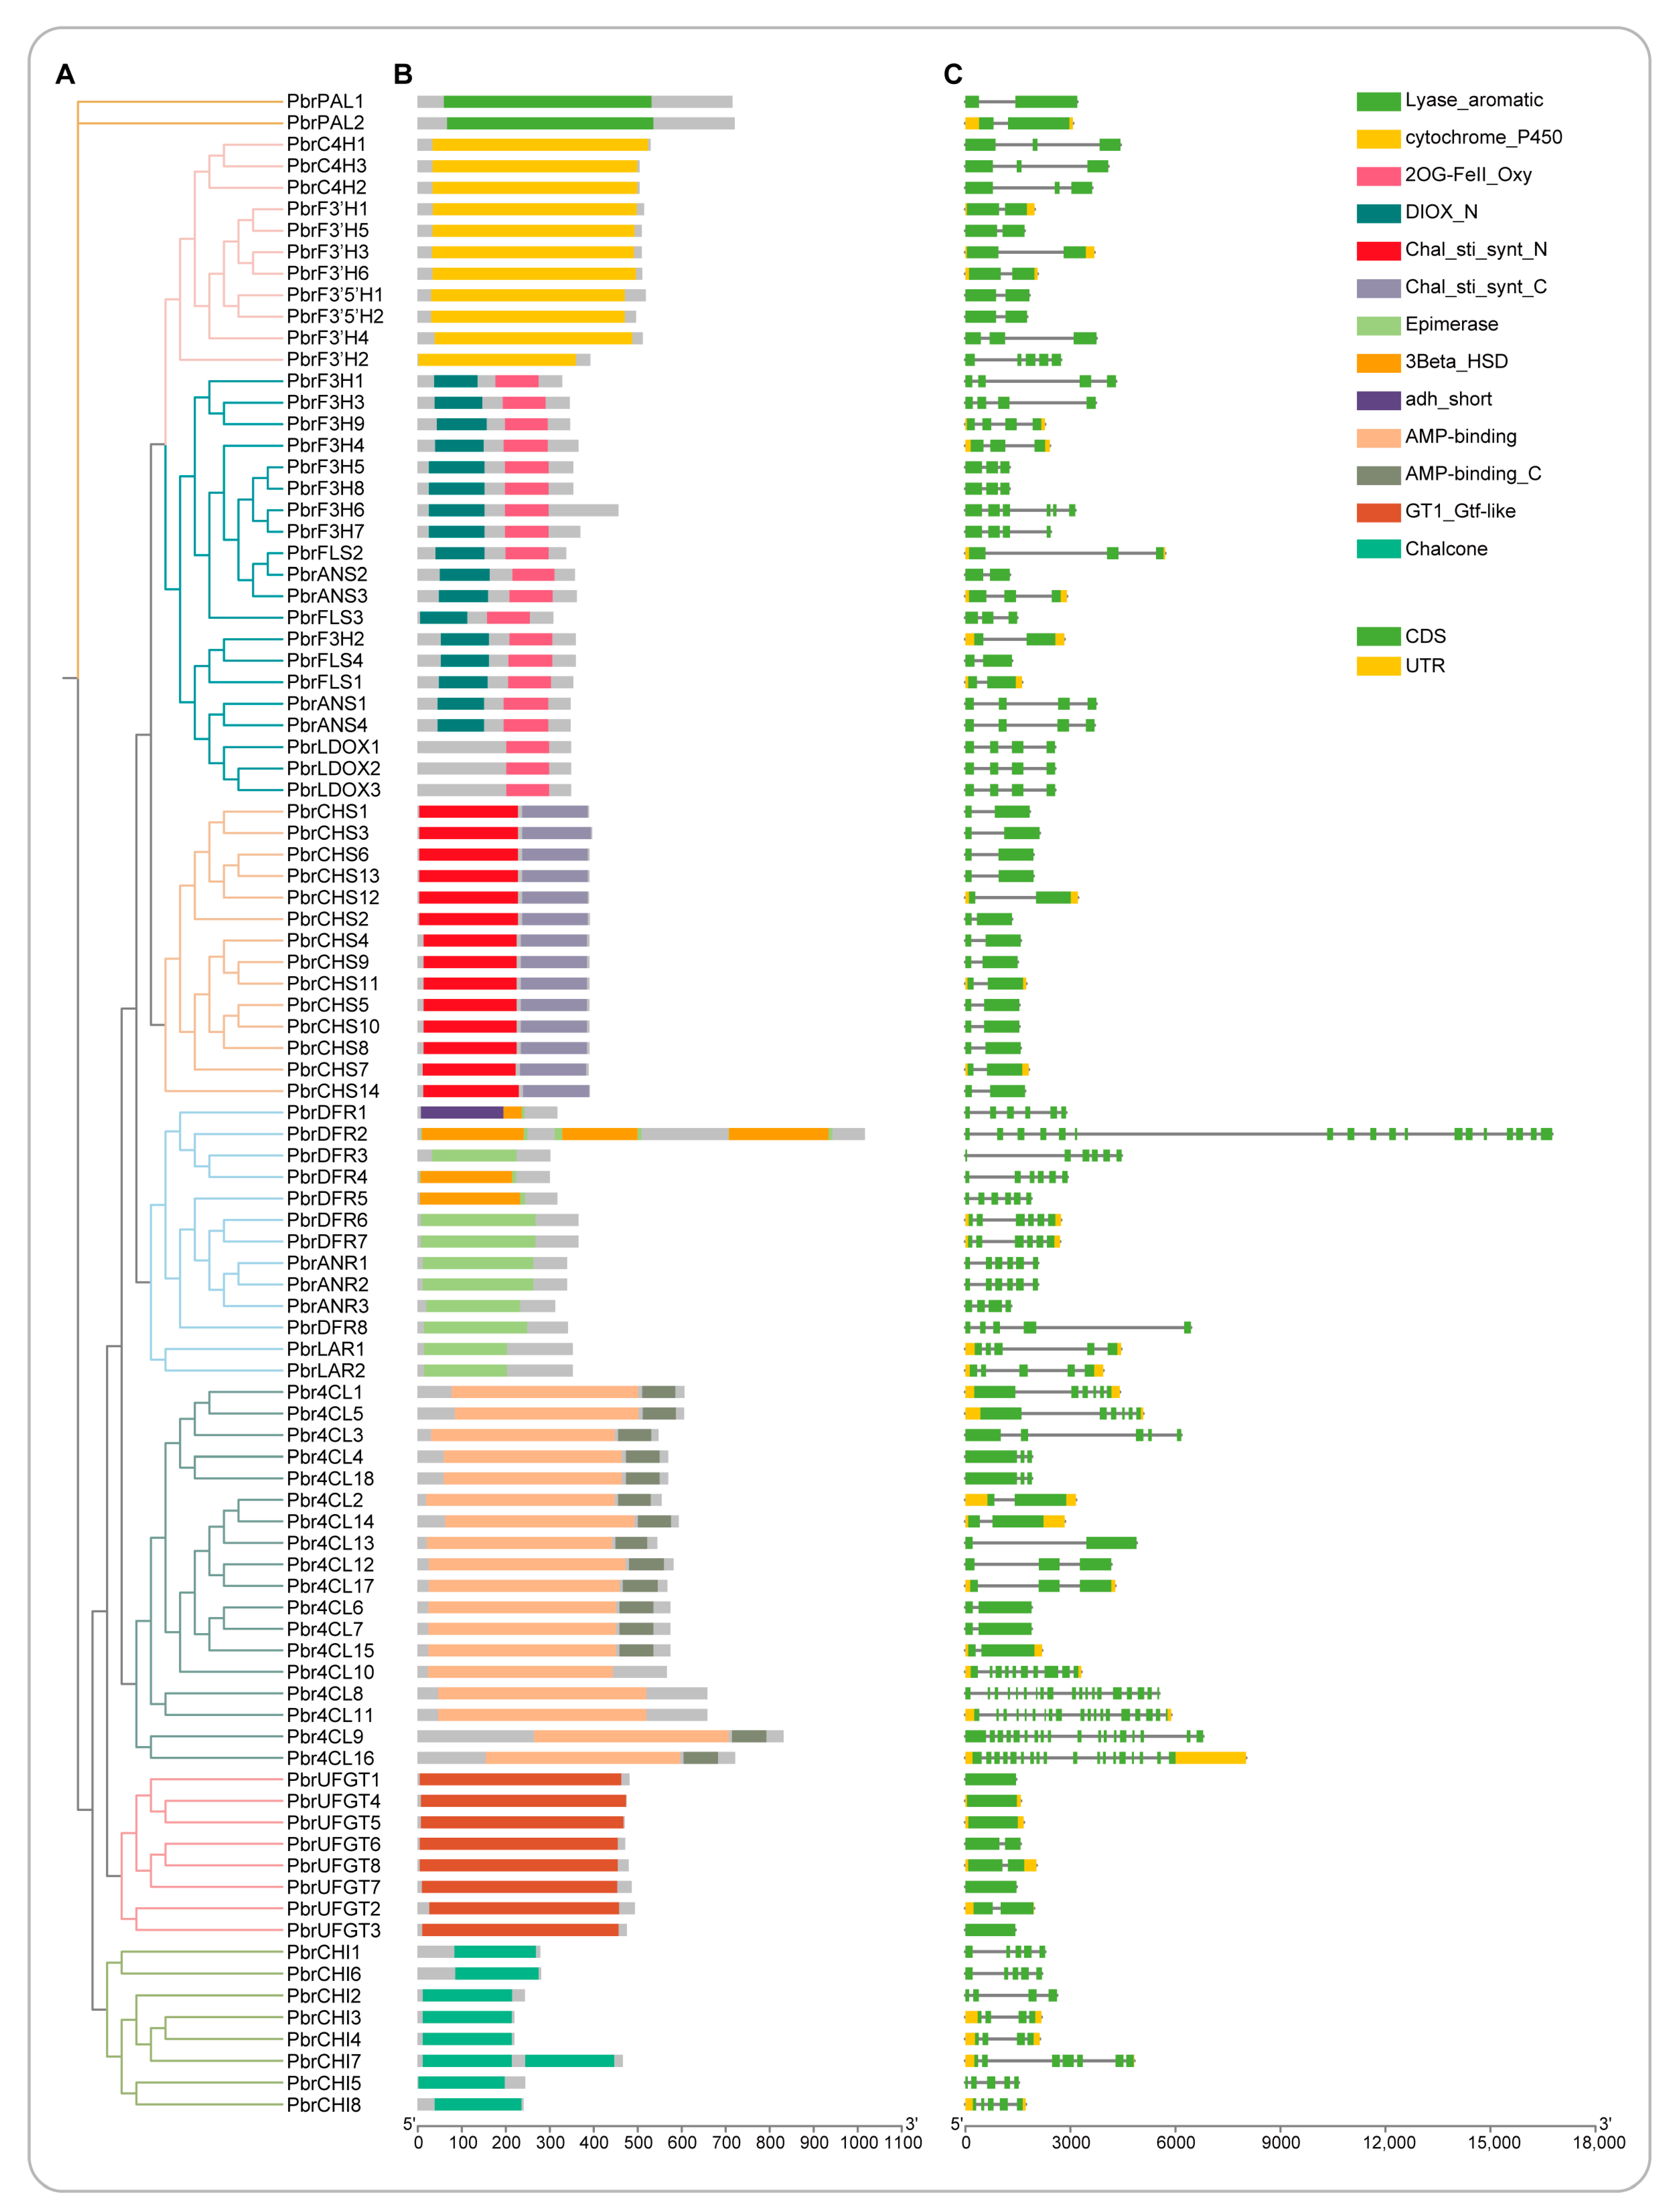
3.3. Conserved Domains and Motif and Gene Structure Analysis of Anthocyanin Biosynthesis-Related Genes

The gene structures and motif compositions were found to be highly conserved within the same lineages, although some variations were observed in the number and length of gene structures and motif composition in certain cases. Domains, which represent independent stable structural regions composed of various secondary structures and super secondary structures in proteins, serve as functional units of proteins, with different domains often associated with different functions. In our study of conserved functional domains of anthocyanin biosynthesis-related genes (Figure 3), the PAL gene possesses the Lyase_aromatic domain, while the AMP-binding or AMP-binding_C domains are conserved in 4CL genes. The Chal_sti_synt_N and Chal_sti_synt_C domains are present in all CHS genes, and the chalcone and GT1_Gtf-like conserved domains were identified in the CHI and UFGT genes, respectively. Additionally, some structural domains are not specific to any particular family. For example, the CHS, F3′H, and F3′5′H genes all contain the cytochrome_P450 domain, belonging to the cytochrome P450-dependent monooxygenase (CYP450) superfamily. Similarly, the F3H, FLS, LDOX, and ANS genes contain the 2OG-FeII_Oxy or DIOX_N domain, belonging to the 2-oxoglutarate-dependent dioxygenase (2-ODD) superfamily. The adh_short or Epimerase or 3Beta_HSD domains were present in the DFR, ANR, and LAR genes, all of which are part of the short-chain dehydrogenase/reductase (SDR) superfamily. Regarding the exon and intron arrangement within the same gene family, it was generally observed to be similar and relatively conserved, although some differences were noted. For instance, two PAL genes exhibited structural similarity, each containing two exons and one intron. However, PbrPAL2 had two untranslated regions (UTR) at both ends, differing from the others. These findings indicate that gene structures within the same lineage are highly conserved.
Based on evolutionary analysis and conserved structural domains, we classified the 94 genes related to anthocyanin biosynthesis into eight groups. Using the MEME tool, we identified 10 conserved motifs for each group, ensuring that each gene contains at least one conserved motif (Figure S2). Genes sharing a common conserved domain exhibit significant similarities in their gene architecture and motif composition. For instance, in the 2OGD gene family, F3H, FLS, ANS, and LDOX all contain motif1, motif2, and motif4, while only the genes PbrF3H5, PbrF3H6, PbrF3H7, and PbrF3H8 have motif9. Similarly, all 18 4CL genes share two common motifs: motif2 and motif4. Within the SDR family, PbrDFR2 possesses repeated motifs including motif5, motif1, motif6, motif2, motif4, and motif7, consistent with the structural domain analysis results. Among the 14 CHS genes, all contain motif2, motif3, and motif4. The variation lies in motif3 and motif4; specifically, PbrCHS1, PbrCHS2, PbrCHS3, PbrCHS12, and PbrCHS13 contain motif7, while PbrCHS4, PbrCHS5, PbrCHS7, PbrCHS8, PbrCHS9, PbrCHS10, and PbrCHS14 have motif5. In the P450 gene family, F3′H, F3′5′H, and CHS all contain motif2, motif4, and motif5, whereas only the CHS gene has motifs 6 and 9. Similarly, the eight CHI genes share motif1 and motif3 as common motifs. In contrast to PbrPAL1, PbrPAL2 has two additional motifs: motif10. Among the eight UFGT genes, shared motifs include motif1, motif2, and motif6, with only PbrUFGT3 lacking motif5. These differences in motifs within the same gene family may contribute to functional variations among the genes.

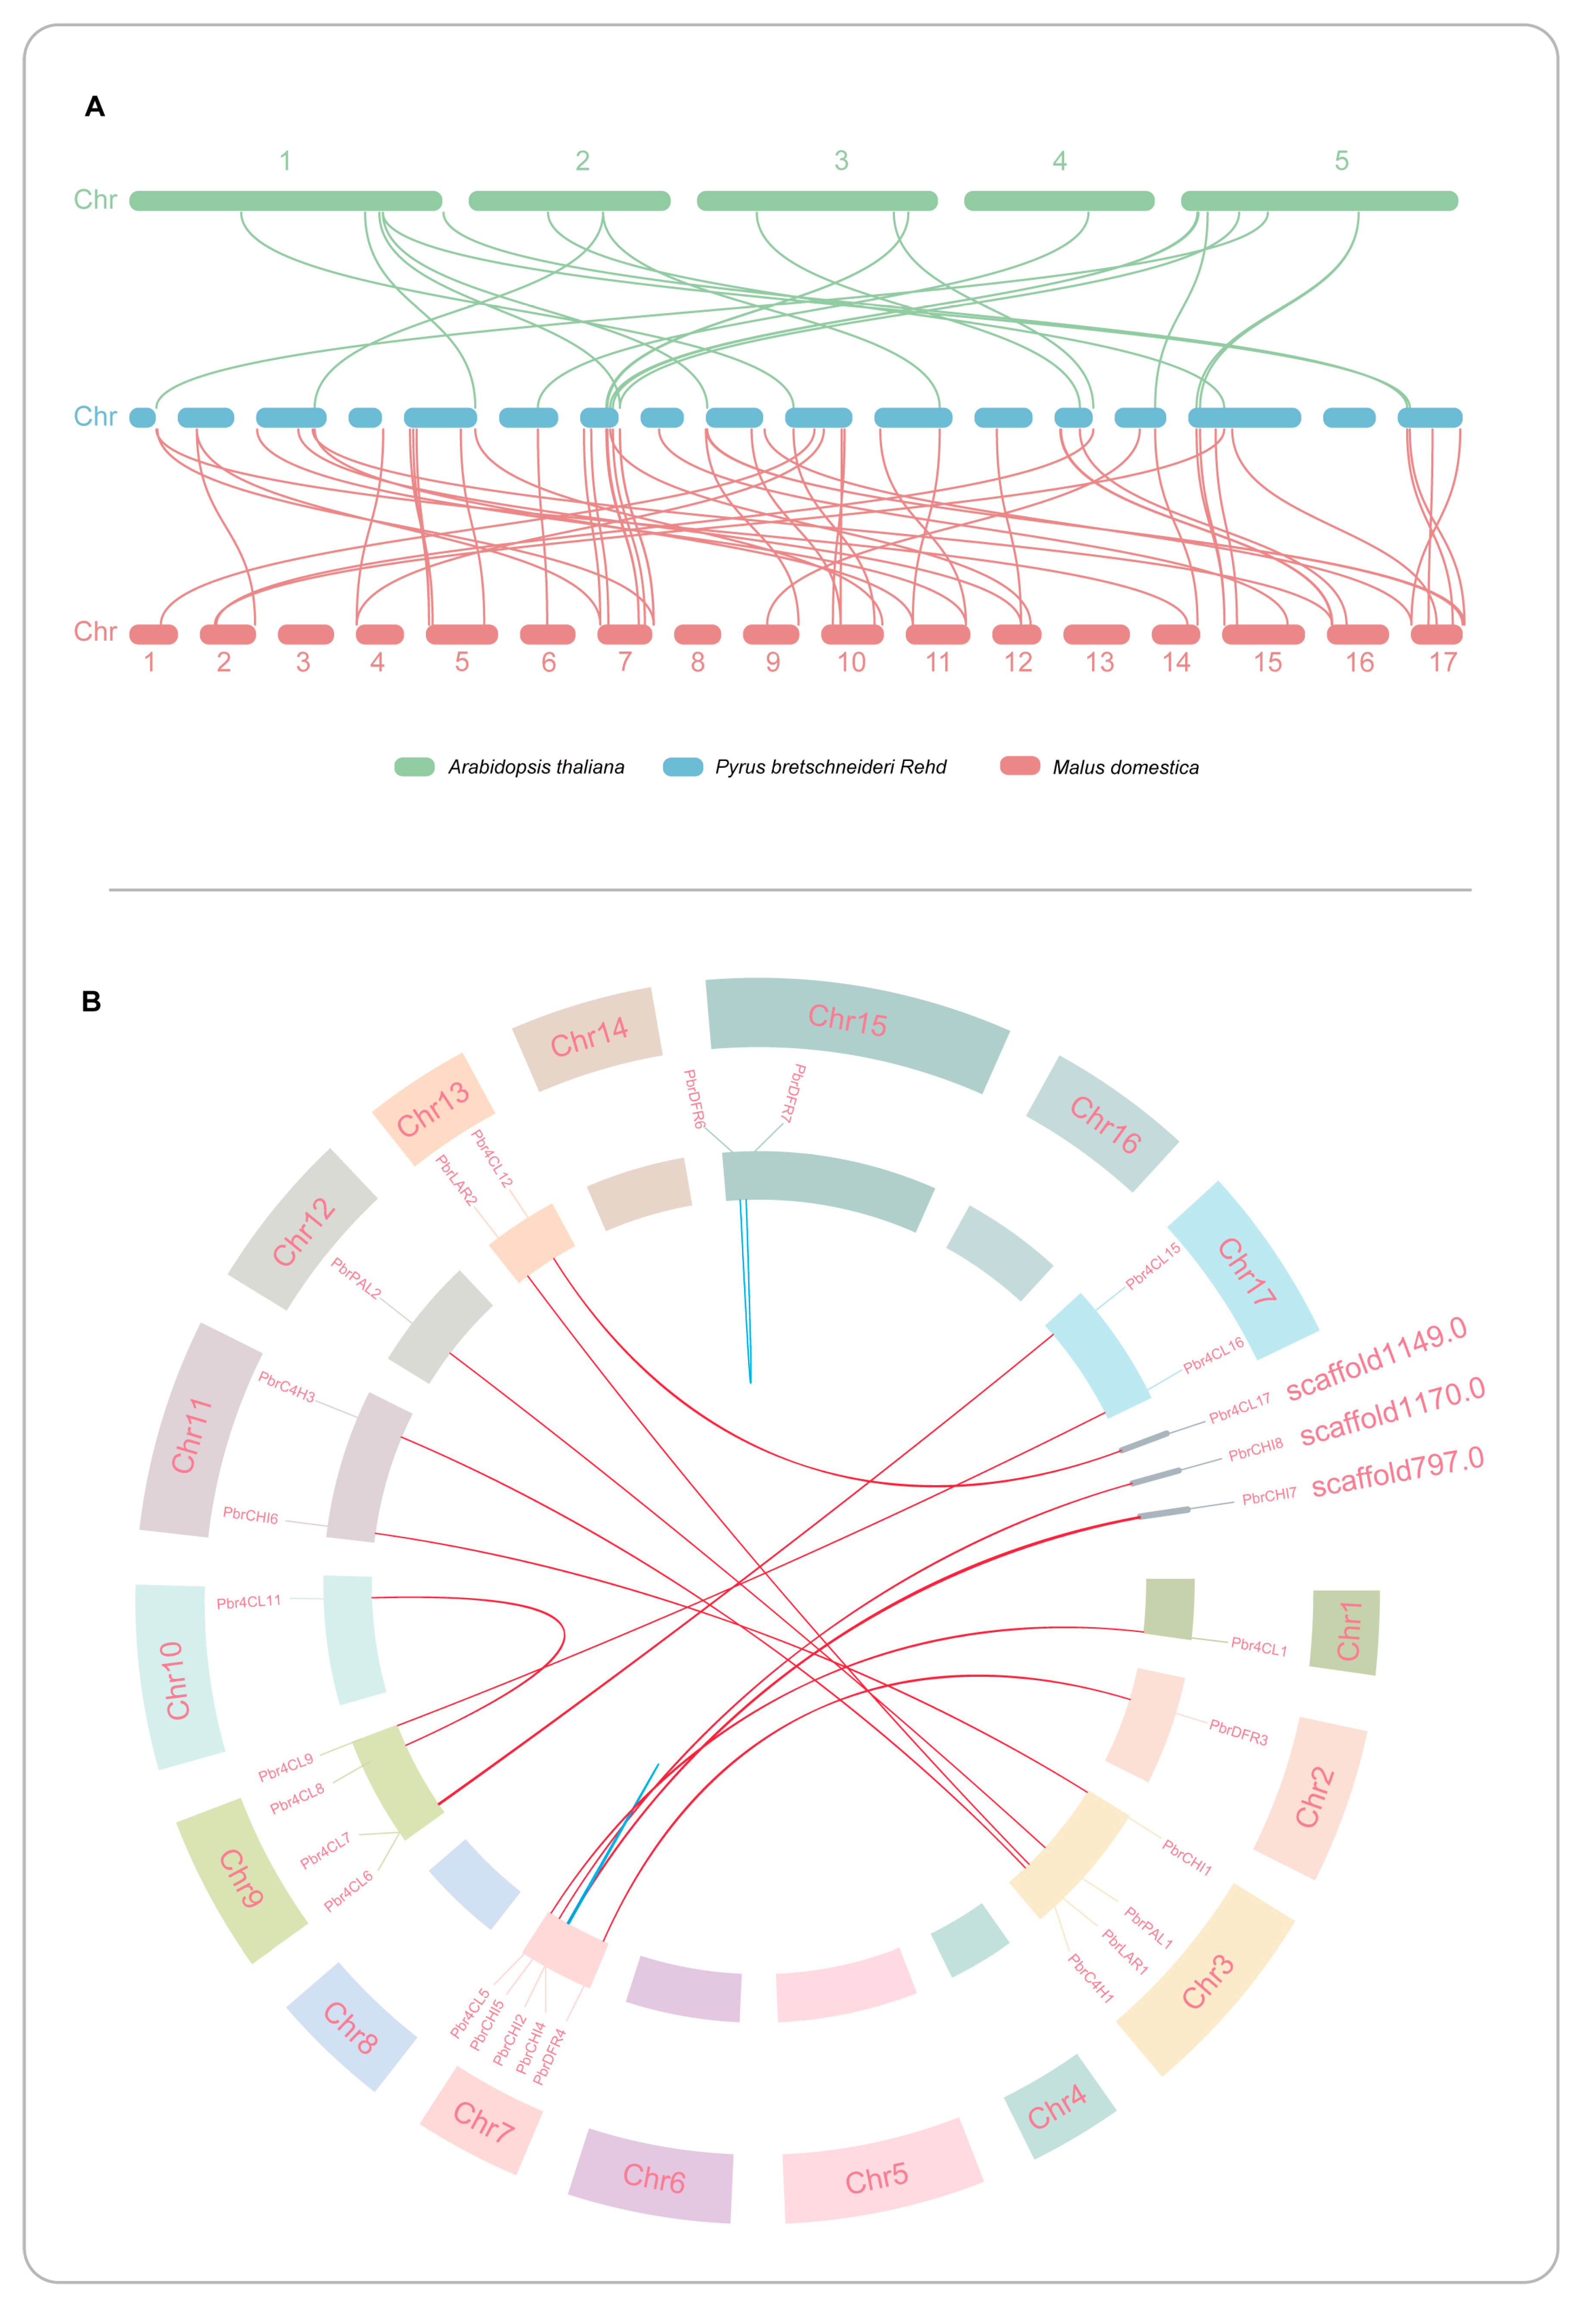
3.4. Synteny Analysis of Anthocyanin Biosynthesis-Related Genes in Pear and Other Species

We conducted synteny analysis on Pyrus bretschneideri, Arabidopsis thaliana, and Malus domestica (Figure 4A). Our results revealed 23 pairs of collinear genes between pear and Arabidopsis. These genes are distributed across pear chromosomes 1, 3, 5, 6, 7, 9, 10, 11, 13, 14, 15, and 17, with the highest number of genes (6) found on chromosome 7 (Pbr4CL5, PbrCHI2, PbrCHI4, PbrCHI5, PbrANS3, PbrUFGT2). Chromosomes 1, 3, 5, 6, 9, 10, 11, and 14 each have one collinear gene (PbrF3H1), 3 (PbrC4H1), 5 (PbrANR1), 6 (PbrANS2), 9 (Pbr4CL7), 10 (Pbr4CL10), 11 (PbrC4H3), and 14 (PbrF3′H4, respectively). Pear and apple exhibit 56 pairs of collinear genes, distributed unevenly across pear chromosomes 1, 2, 3, 4, 5, 6, 7, 8, 9, 10, 11, 12, 13, 14, 15, and 17. Among them, chromosome 7 contains the highest number of collinear genes (8), including Pbr4CL4, Pbr4CL5, PbrCHI2, PbrCHI4, PbrCHI5, PbrDFR4, PbrANS3, and PbrUFGT2. Chromosomes 4, 6, and 8 each have only one collinear gene (PbrCHS1, PbrANS2, and PbrFLS2, respectively). In the collinearity analysis between these three species, we observed that pear and apple share a greater number of collinear genes, indicating a closer genetic relationship between pear and apple.
Through collinearity analysis of Chinese white pear, we identified a total of 16 duplicated events among 94 genes associated with anthocyanin biosynthesis. Out of these, 14 pairs resulted from segmental duplications, while 2 pairs arose from tandem duplications (Figure 4B). Furthermore, these duplicated events were found exclusively within six gene families (PAL, 4CL, C4H, CHI, DFR, LAR). Among them, the 4CL gene family has six pairs (Pbr4CL1-Pbr4CL5, Pbr4CL11-Pbr4CL8, Pbr4CL12-Pbr4CL17, Pbr4CL15-Pbr4CL6, Pbr4CL15-Pbr4CL7, Pbr4CL16-Pbr4CL9) of segmental duplications; the CHI gene family had four pairs (PbrCHI2-PbrCHI7, PbrCHI4-PbrCHI7, PbrCHI5-PbrCHI8, PbrCHI6-PbrCHI1) of segmental duplications and one pair (PbrCHI2-PbrCHI4) of tandem duplications; while the PAL, C4H, and LAR gene families each possessed one pair (PbrPAL2-PbrPAL1, PbrC4H3-PbrC4H1, PbrLAR2-PbrLAR1) of segmental duplications; and the DFR gene family had one pair (PbrDFR3-PbrDFR4) of segmental duplications and one pair (PbrDFR6-PbrDFR7) of tandem duplications. These findings indicate notable variation in both the quality and kinds of duplication patterns within gene families associated with anthocyanin biosynthesis. Such diversity may suggest distinct expansion mechanisms for these genes throughout long-term evolutionary processes.

3.5. Cis-Element Analysis of Anthocyanin Biosynthesis-Related Genes

Various types of cis-regulatory elements exert influence on gene function and expression. Exploring cis-regulatory elements serves as an effective strategy for predicting gene function. Therefore, to comprehend the involvement of genes associated with the anthocyanin pathway in pear anthocyanin synthesis, we extracted cis-regulatory elements from the upstream 2000 bp sequences of the genes related to the anthocyanin pathway. This enabled us to investigate the potential functions of different genes within the anthocyanin synthesis pathway. We identified a total of 15,164 cis-acting elements within the promoters of 94 anthocyanin biosynthesis-related genes promoters in the Chinese white pear. Among these, we specifically selected and grouped 13 significant cis-acting elements for further analysis (Figure 5): cis-acting regulatory elements involved in MeJA-responsiveness (282), abscisic acid responsiveness (305), salicylic acid responsiveness (51), gibberellin-responsiveness (16), gibberellin-responsive elements (72), auxin-responsive elements (39), cis-acting regulatory element involved in auxin responsiveness (11), segments of light-responsive element (413), light-responsive element (165), MYBHv1 binding sites (44), MYB binding sites involved in light responsiveness (42), MYB binding sites involved in flavonoid biosynthetic genes regulation (7), and MYB binding sites involved in drought-inducibility (80). Moreover, these various cis-regulatory elements demonstrate discrepancies in their distribution across different gene families. For instance, all 15 gene families contain cis-acting elements involved in abscisic acid responsiveness, segments of light-responsive elements, light-responsive elements, and MYB binding sites involved in drought inducibility. However, auxin-responsive elements are present in only six gene families (4CL, ANR, CHS, DFR, LAR, UFGT), while MYB binding sites involved in flavonoid biosynthetic genes regulations are present in six gene families (PAL, C4H, CHI, CHS, DFR, F3′H) as well.

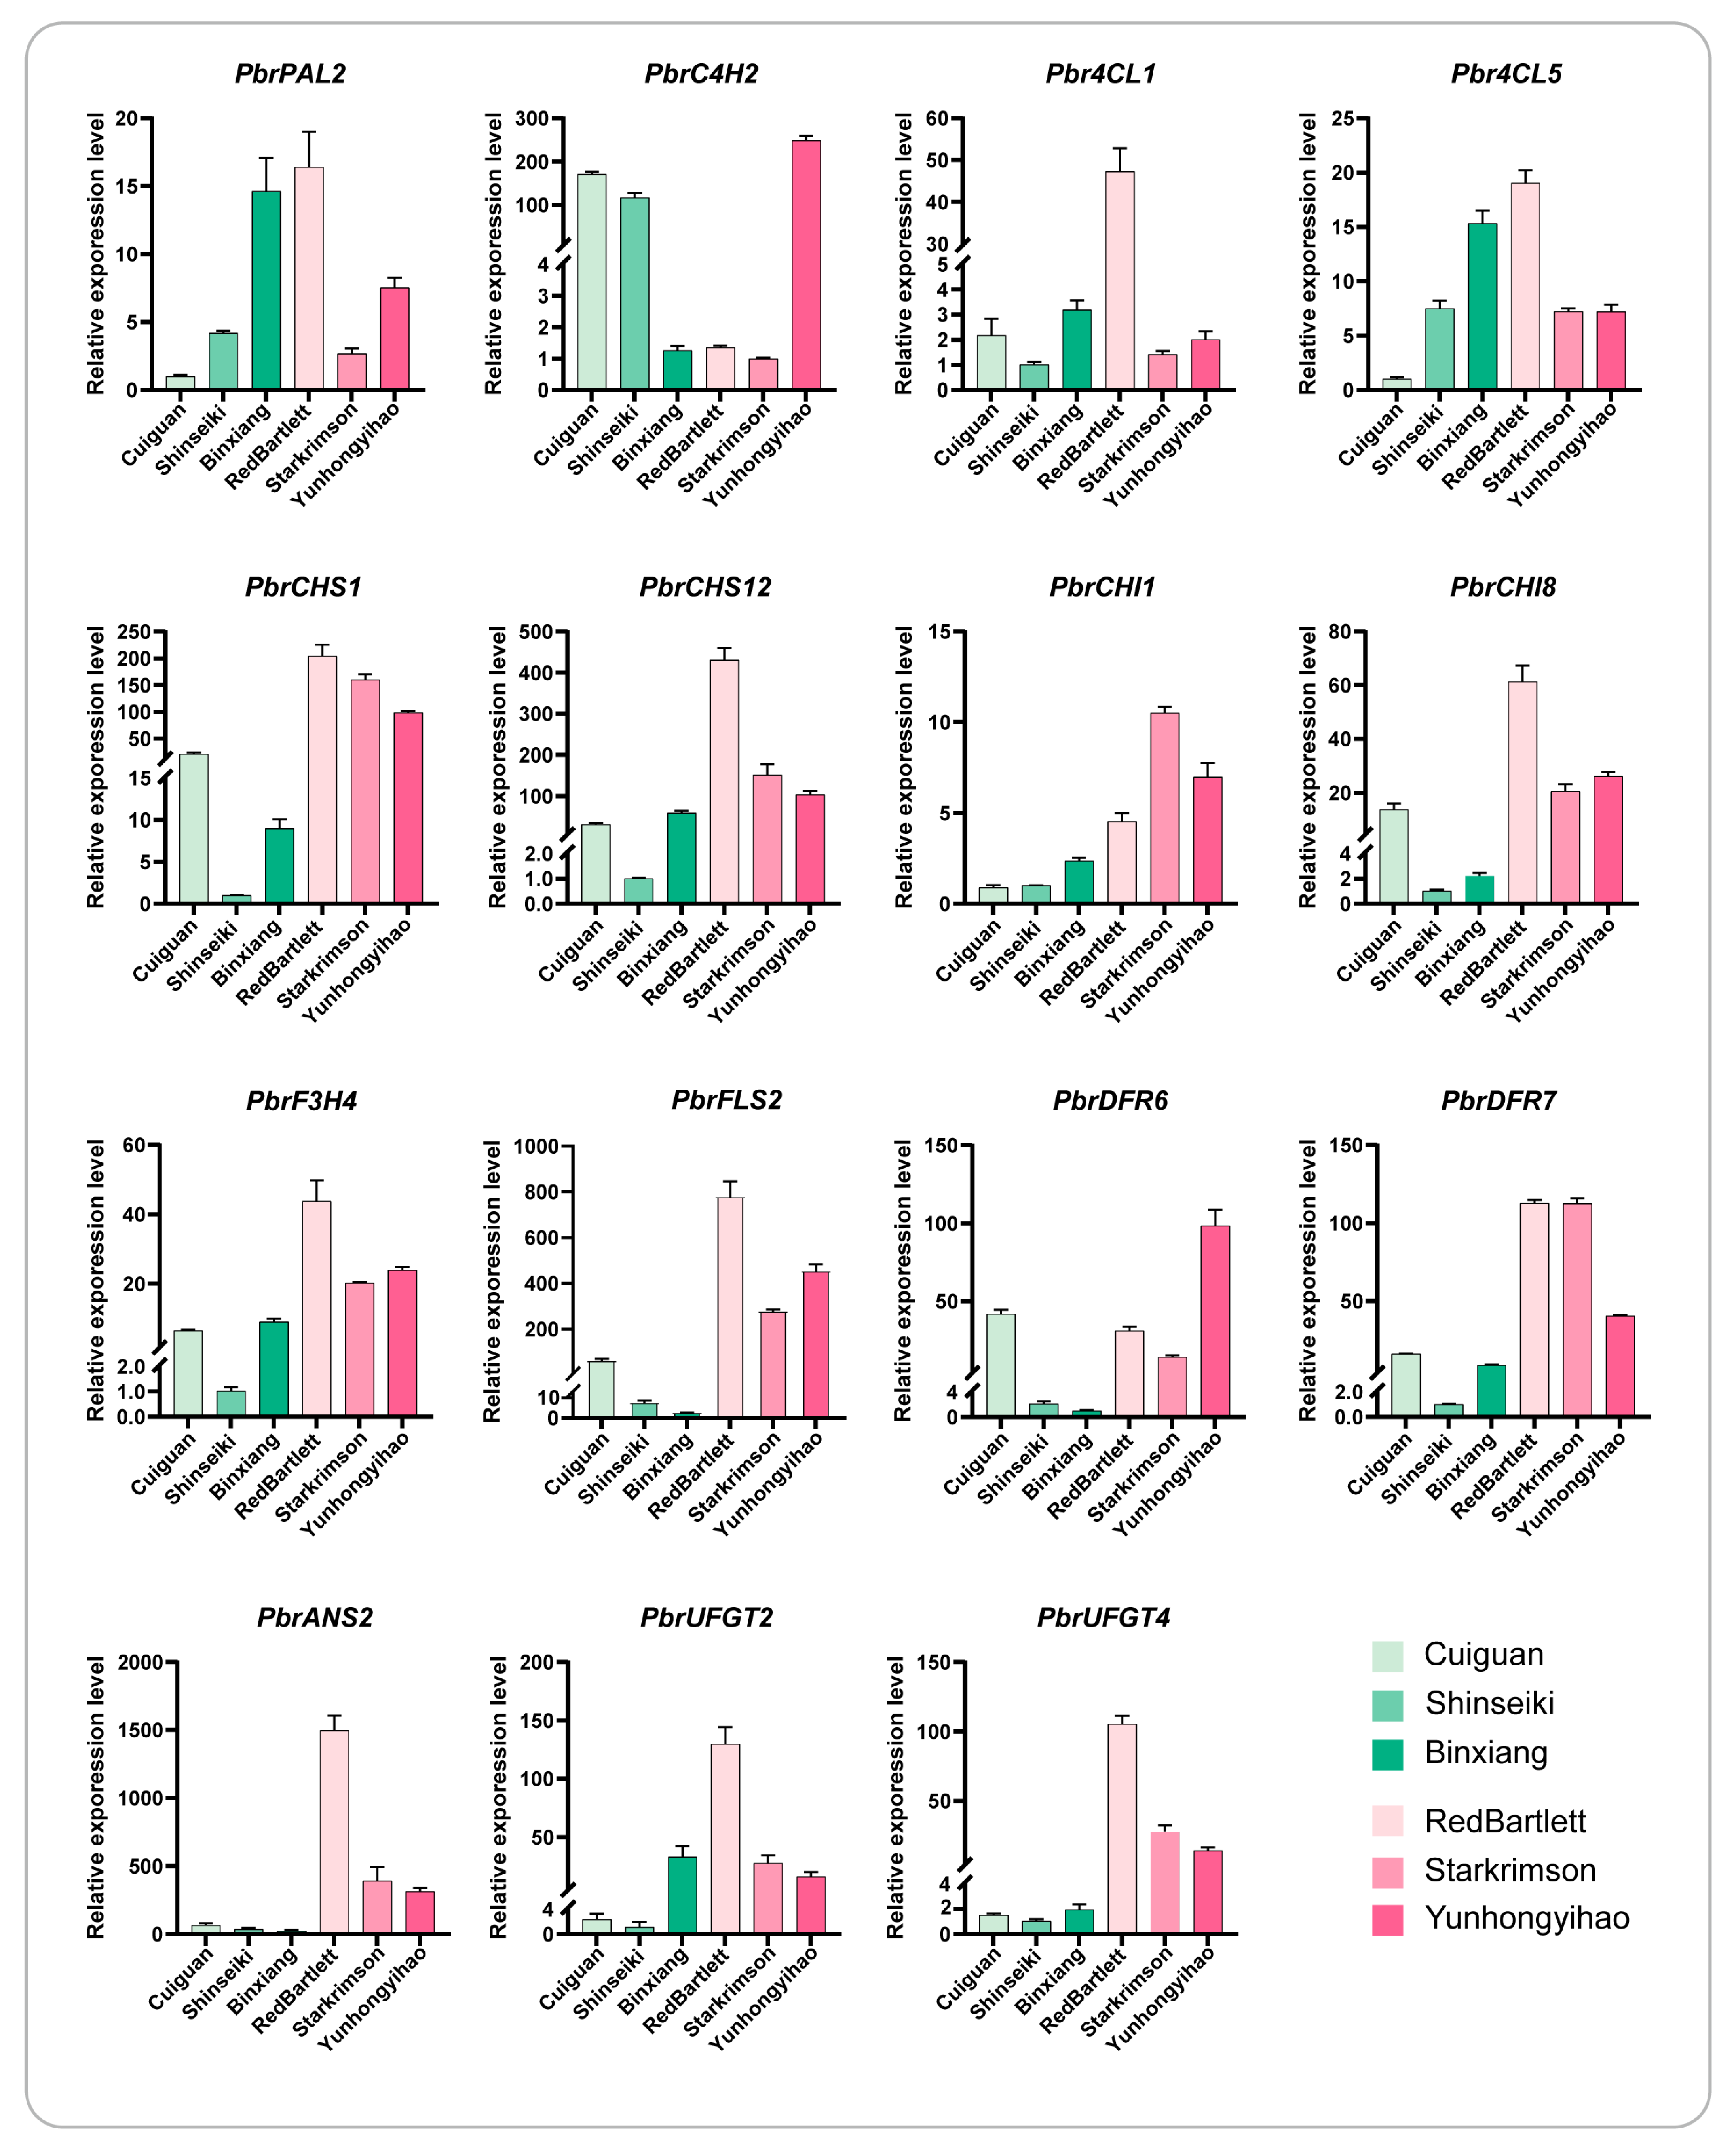
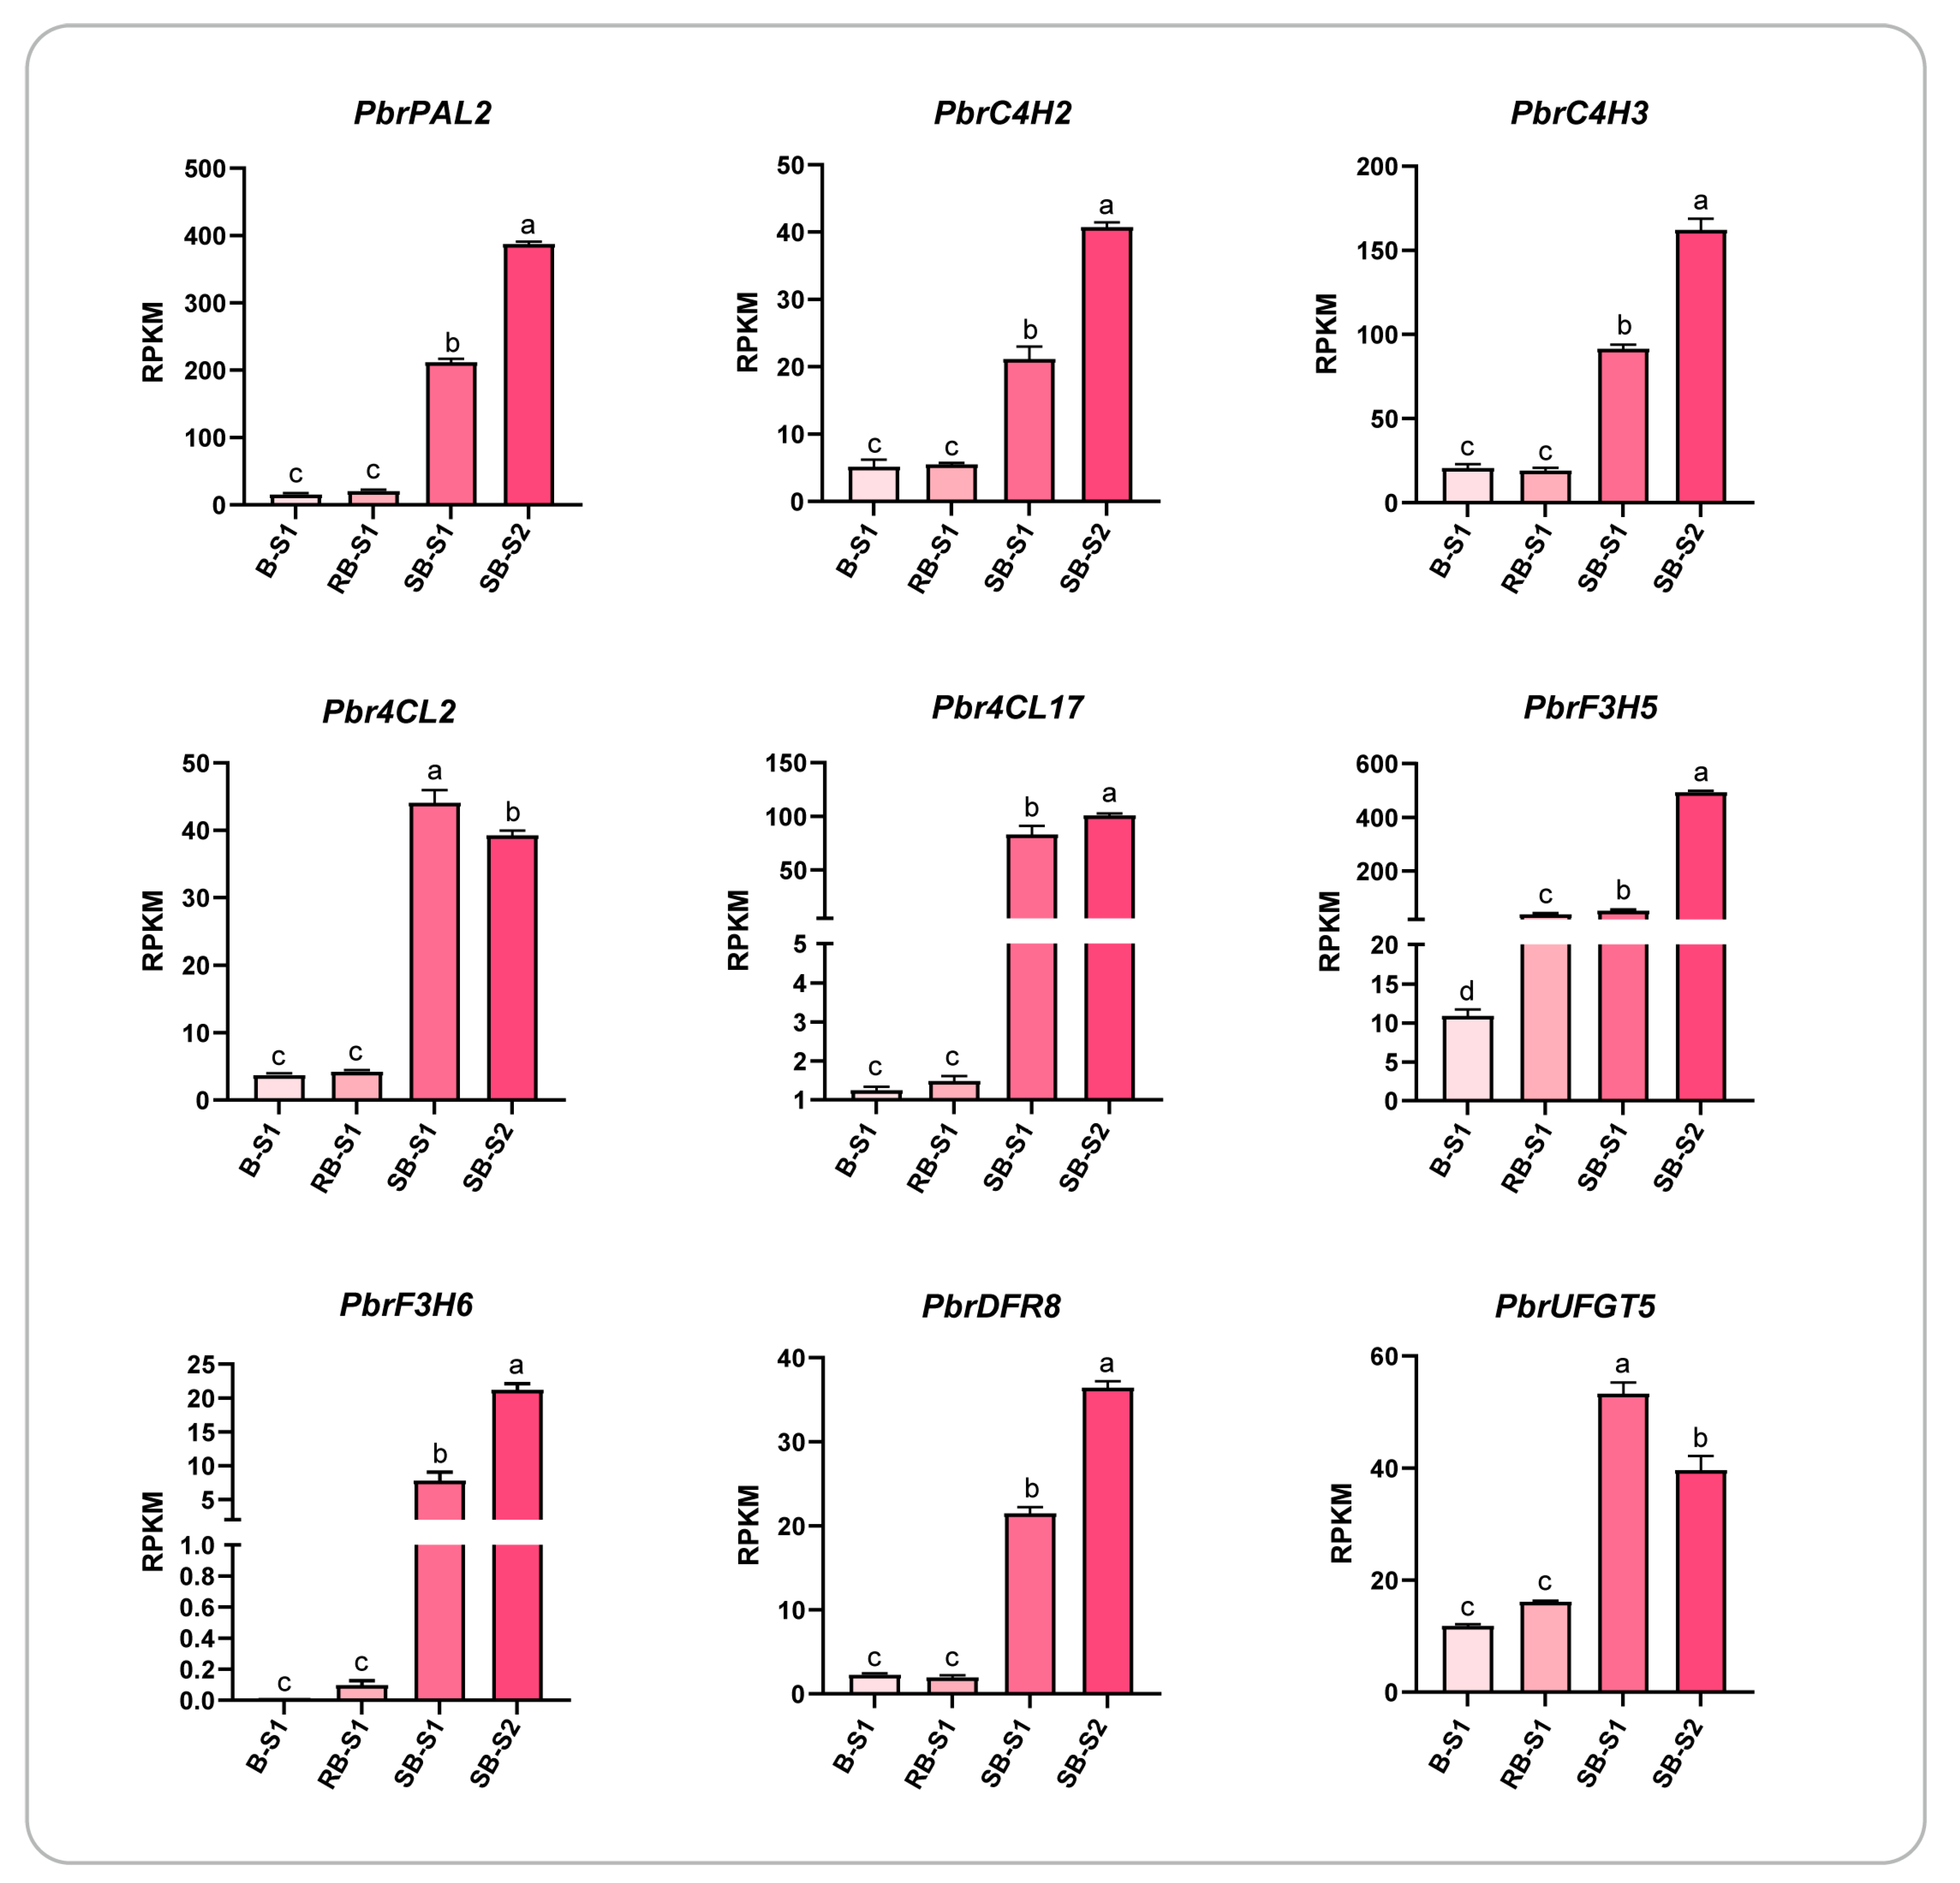
3.6. Expression Analysis of Anthocyanin Biosynthesis-Related Genes in Different Pear Varieties

For exploring the expression of genes related to anthocyanin biosynthesis in the skin of various pear varieties, we conducted further analysis on the expression levels of these genes in three green-skinned varieties (‘Cuiguan’, ‘Shinseiki’, ‘Binxiang’) and three red-skinned varieties (‘RedBartlett’, ‘Starkrimson’, ‘Yunhongyihao’) using qRT-PCR. The results (Figure 6) revealed that nine genes (PbrCHS1, PbrCHS12, PbrCHI1, PbrCHI8, PbrF3H4, PbrFLS2, PbrDFR7, PbrANS2, and PbrUFGT4) exhibited higher expression levels in red-skinned varieties compared to green-skinned varieties, indicating their potential crucial roles in the anthocyanin synthesis process. Moreover, it is notable that the expression level of PbrC4H2 was significantly elevated in the three sand pears (‘Cuiguan’, ‘Shinseiki’, ‘Yunhongyihao’) compared to the three European pears (‘Binxiang’, ‘RedBartlett’, ‘Starkrimson’).
To explore the expression patterns of the genes associated with anthocyanin biosynthesis in the flesh of various pear varieties, we conducted transcriptome analysis on two white-fleshed varieties ‘Bartlett’ (B) and ‘RedBartlett’ (RB) and one red-fleshed variety ‘Summer Blood Birne’ (SB). Our observations revealed that, with the exception of eight genes that showed no expression across any sample (Figure S3), the majority of genes were expressed in all samples. Among them, significant differences in expression levels were observed for genes such as PbrPAL2, PbrC4H2, PbrC4H3, Pbr4CL2, Pbr4CL17, PbrF3H5, PbrF3H6, PbrDFR8, and PbrUFGT5 between white-fleshed and red-fleshed samples (Figure 7). For instance, at the same time point, the expression level of Pbr4CL17 in red-fleshed samples was 66.5 times higher than in the white-fleshed sample ‘Bartlett’ (B-S1), and 55.7 times higher than in the white-fleshed sample ‘Red Bartlett’ (RB-S1).

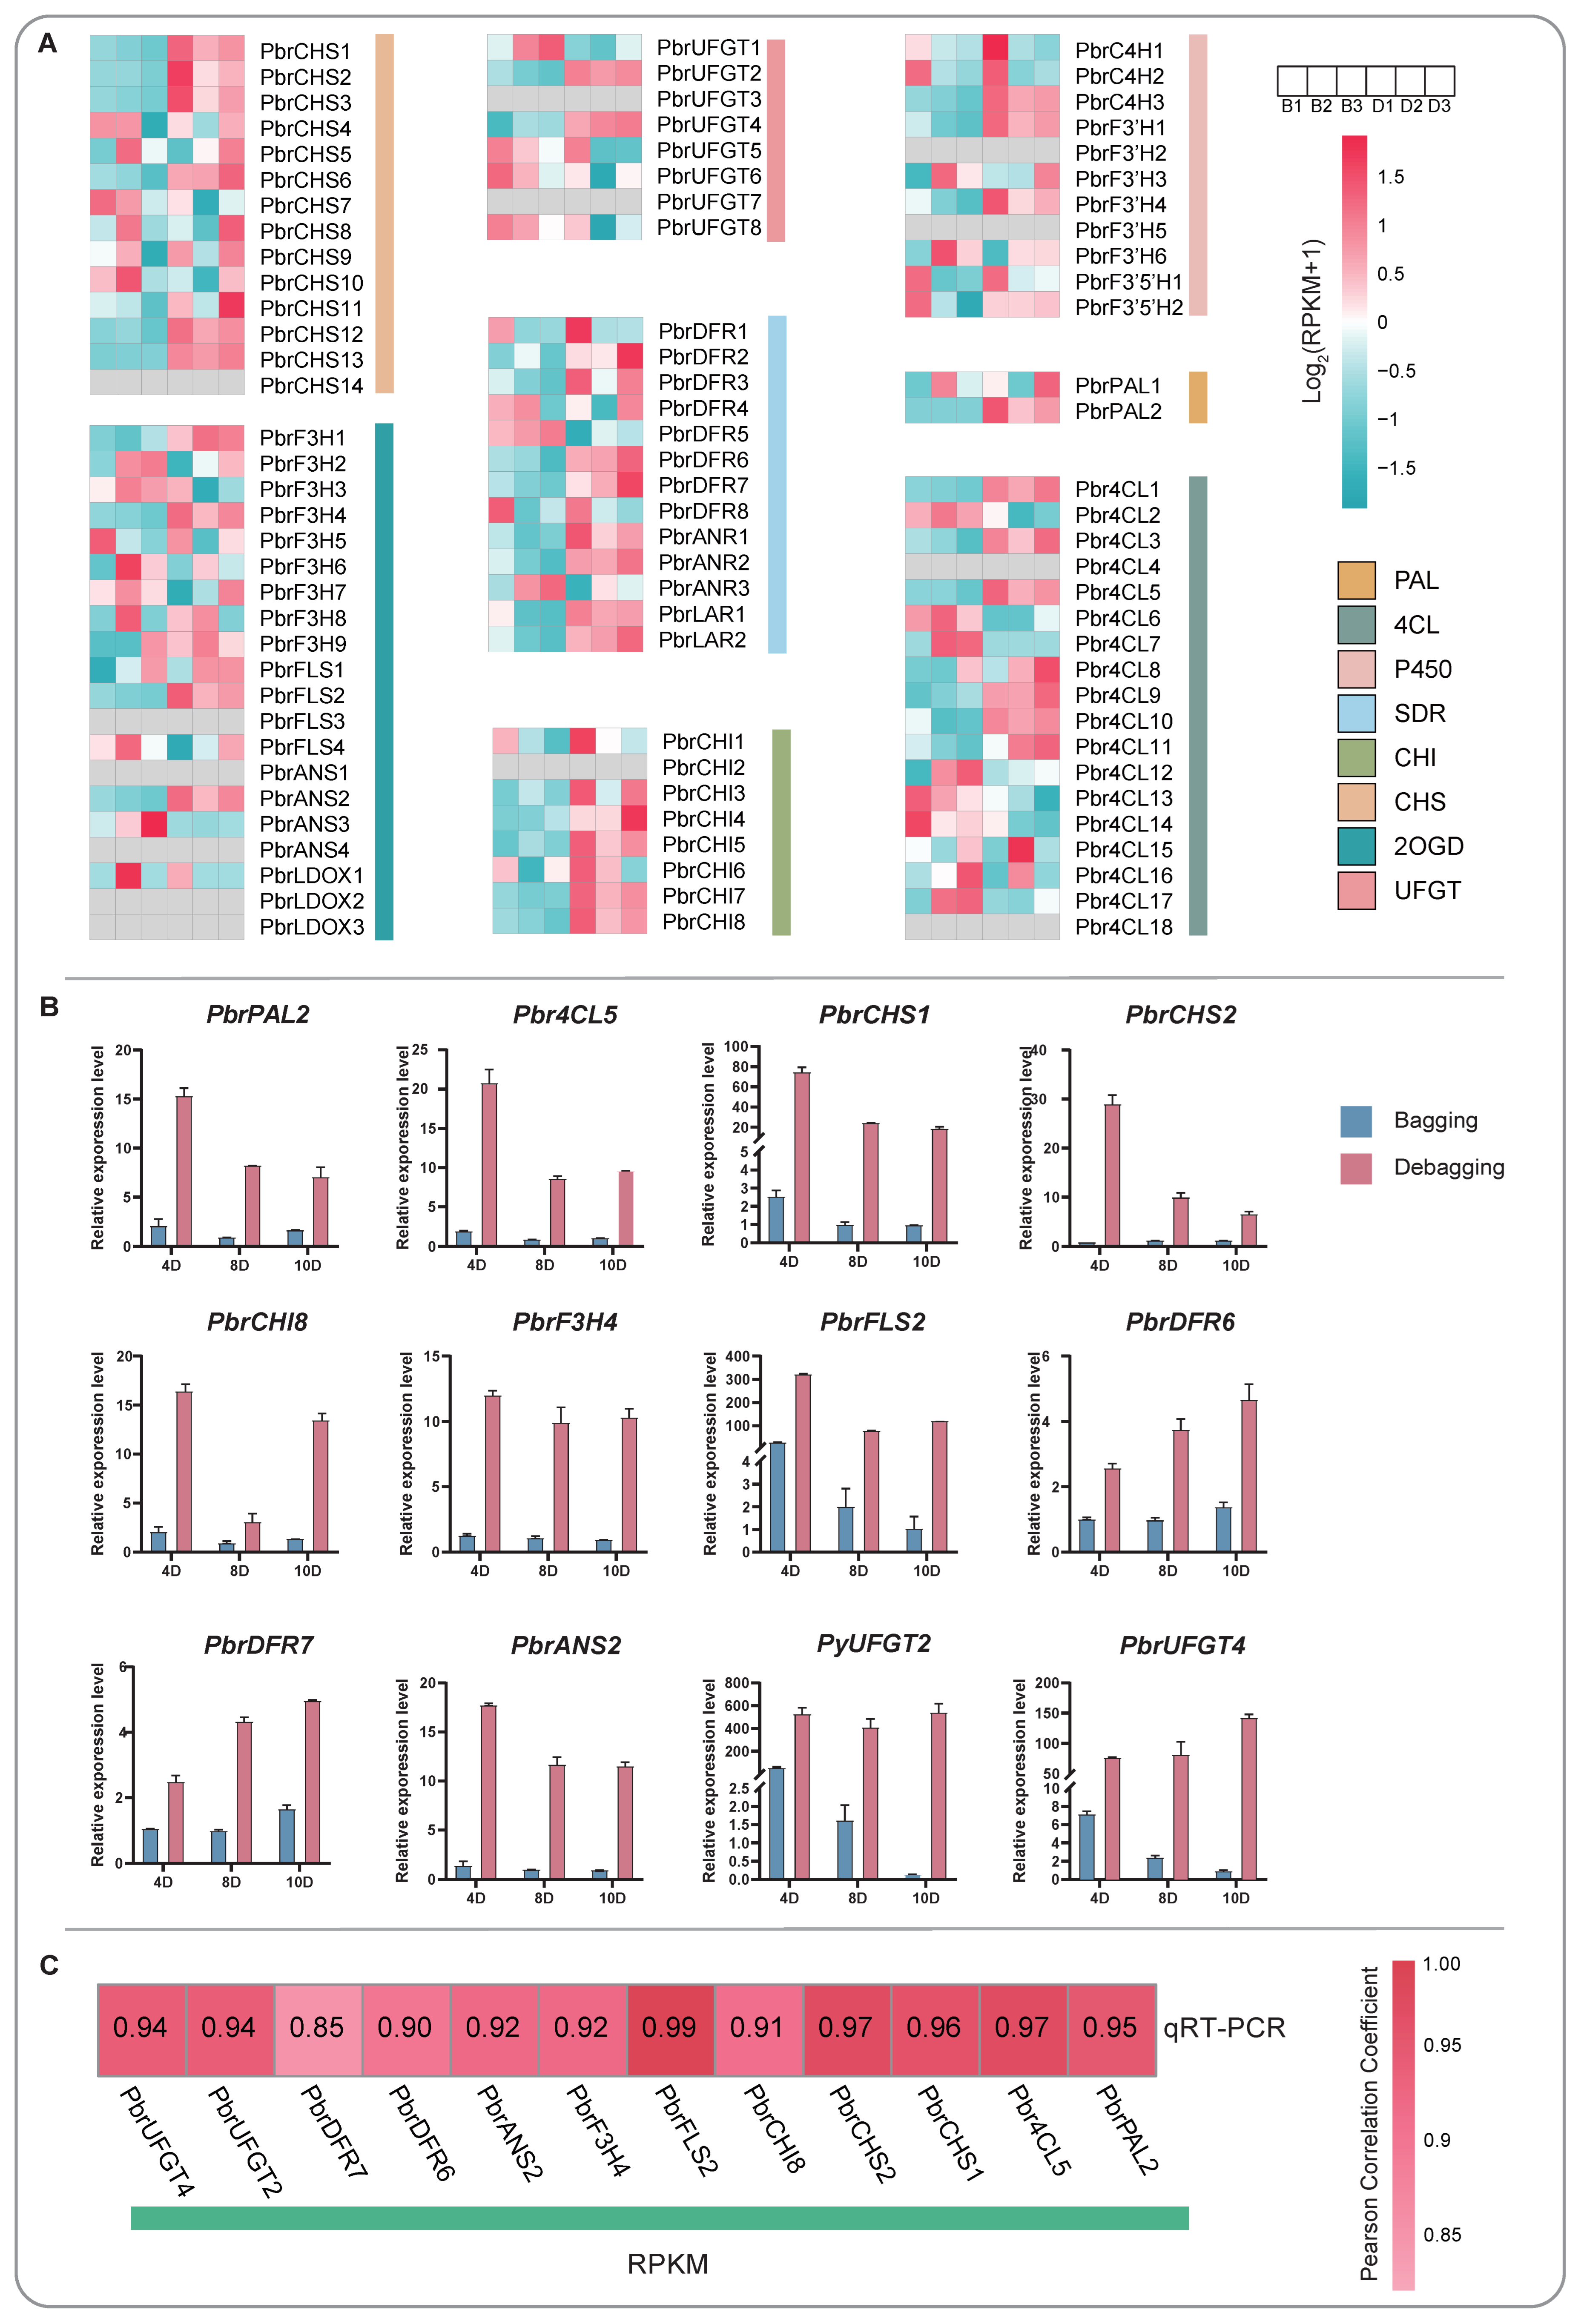
3.7. Expression Analysis of Anthocyanin Biosynthesis-Related Genes in Pears under Dark and Light Conditions

Prior research has highlighted the significance of light as a crucial environmental factor influencing anthocyanin synthesis. Therefore, we utilized previous transcriptome data from the bagging/debagging Sand pear variety ‘Yunhongyihao’ to scrutinize the expression patterns of genes associated with anthocyanin synthesis [42]. Analysis of the transcriptome data revealed that, out of the 94 anthocyanins biosynthesis-related genes, only 13 were not expressed (Figure 8A). Subsequently, we conducted differential analysis on the remaining 81 expressed genes within the anthocyanin biosynthesis pathway. Twelve genes, displaying varying expression levels across three time points, were selected for qRT-PCR analysis (Figure 8B). The results unveiled that, at identical time points, the expression levels of all genes in the debagging group were significantly higher compared to those in the bagging group, underscoring the crucial role of these genes in the anthocyanin biosynthesis process. Nonetheless, there were divergences in the expression patterns among different genes. For instance, while the expression levels of PbrDFR6 and PbrDFR7 exhibited a continuous increase over time in the debagging group, they showed only slight increments in the bagging group. Conversely, PbrANS2 demonstrated contrasting results, with its highest expression level on day 4 in the debagging group, followed by a decrease over time. Additionally, as time elapsed, the expression of PbrUFGT4 continued to increase steadily in the debagging group, while decreasing in the bagging group. Such variations may be attributed to the differential responses of genes to light. Moreover, correlation analysis between the qRT-PCR data and the RPKM results from the RNA-seq experiments yielded r values ranging from 0.85 (PbrDFR7) to 0.99 (PbrFLS2) (Figure 8C). This underscores the support provided by the qRT-PCR analysis for the reliability of the RNA-seq data pertaining to the selected genes.

4. Discussion

4.1. The Number of Genes Related to Anthocyanin Biosynthesis

In this study, we identified 24, 94, and 127 genes related to the anthocyanin biosynthetic pathway in Arabidopsis thaliana, Pyrus bretschneideri, and Malus domestica, respectively. The number of genes associated with anthocyanin biosynthesis in pear is notably higher than in Arabidopsis thaliana but lower than in apple. Specifically, the copy numbers of the F3H, DFR, and UFGT gene family members in apples are respectively 8, 9, and 9 more than those in pears. This disparity in gene copy numbers may play a significant role in the comparatively easier coloration of apples compared to pears. Additionally, our analysis identified two F3’5’H and two LAR genes in pear, which are absent in Arabidopsis thaliana, aligning with the findings in Ginkgo biloba [34]. Anthocyanins, crucial flavonoids, are widespread in plants [45]. Notably, 68 anthocyanin pathway synthesis-related genes have been identified in Ginkgo biloba, 35 in Salvia miltiorrhiza, and 85 in Oryza sativa L. [34,46,47]. These findings underscore significant differences in the copy numbers of anthocyanin synthesis-related genes across various species. The higher abundance of anthocyanin synthesis-related genes in pears and apples may be linked to whole-genome duplication events during the evolutionary processes of these fruits.

4.2. The Chromosomal Distribution and Collinearity Analysis of Genes Involved in Anthocyanin Biosynthesis

Upon examining the distribution of 94 pear anthocyanin biosynthesis-related genes across the 17 pear chromosomes, we observed an uneven distribution pattern. Notably, chromosomes 3, 5, 7, 10, and 15 collectively harbor 42 anthocyanin biosynthesis-related genes, representing approximately 44.68% of the total gene count. Furthermore, within the same gene family, genes with high sequence similarity tend to cluster on the same chromosome in close proximity, forming gene clusters. For instance, on chromosome 2, there exists a gene cluster comprising PbrDFR1, PbrDFR2, and PbrDFR3, while chromosome 4 hosts a gene cluster containing PbrCHS1, PbrCHS2, and PbrCHS3. Similarly, chromosome 7 and chromosome 15 each contain gene clusters consisting of PbrCHI2, PbrCHI3, PbrCHI4, PbrCHI5, and PbrCHS7, PbrCHS8, PbrCHS9, PbrCHS10, PbrCHS11, respectively. The pear genome has undergone at least two rounds of genome-wide replication events in its evolutionary history, which may be responsible for the formation of gene clusters on chromosomes [33,48]. Additionally, previous studies have indicated that the metabolic process from phenylalanine to flavonoids is facilitated by multi-enzyme complexes [49,50]. It is noteworthy that members of different gene families tend to cluster on the same chromosome in close proximity, forming gene clusters. This observation leads us to speculate that the close physical or spatial proximity of these genes on the pear genome may facilitate the formation of large molecular complexes during the biosynthesis of pear anthocyanins.
Early studies have established that both segmental duplication and tandem duplication are pivotal mechanisms contributing to the expansion of protein superfamilies [51,52]. In our investigation, of the amplification mechanisms of 94 pear anthocyanin-related genes, we discovered that 42 genes (42/94) are situated in duplicated regions of the pear genome, encompassing 14 pairs of segmental duplications and 2 pairs of tandem duplications. Notably, these duplication events are confined to only six gene families (PAL, 4CL, C4H, CHI, DFR, LAR), with tandem duplication events occurring solely within the CHI and DFR families. Therefore, it becomes evident that segmental duplication serves as the primary driving force behind the expansion of the anthocyanin biosynthesis-related gene families in pear, with significant variations observed in the expansion mechanisms among different gene families. A noteworthy observation is that, within the 4CL gene family in pear, only segmental duplications are present with no instances of tandem duplications. This finding aligns with the results reported by Cao et al. [31]. However, in the study of G. hirsutum, two pairs of tandem duplications were discovered [53]. These findings underscore the differences in the expansion mechanisms of the same gene family across different species.

4.3. Cis-Acting Element Analysis of Anthocyanin Biosynthesis-Related Genes

Cis-regulatory elements serve as essential molecular switches in the transcriptional regulation of gene expression, exerting significant influence on gene function [54,55]. In the promoters of pear anthocyanin biosynthesis-related genes, we identified 15,164 cis-regulatory elements. Among the 13 specific cis-regulatory elements for analysis, light-responsive elements exhibited the highest frequency. Additionally, various hormone-responsive elements and MYB-binding elements were observed (Figure 5). The study elucidates that light can enhance the expression of structural genes in the anthocyanin biosynthesis pathway. For instance, in Arabidopsis, strong light promotes the expression of structural genes (AtCHS, AtF3H, AtDFR and AtLDOX) involved in anthocyanin synthesis, facilitating the synthesis and accumulation of anthocyanins in plants [56]. Similarly, in grapes, high expression of VvF3’H under light stimulation promotes the accumulation of anthocyanins [57]. Additionally, during the mid-stage of fruit development, sweet cherry fruits treated with NAA exhibit significant upregulation of six anthocyanin biosynthesis genes (PaPAL, PaCHS1, PaCHS3, PaDFR, PaLDOX, and PaUFGT) [58]. In apple, abscisic acid (ABA) inhibits the expression of anthocyanin structural genes, with downstream structural genes MdDFR, MdF3H, MdLDOX, and MdUFGT being particularly sensitive to ABA. Methyl jasmonate (MeJA) counteracts the inhibitory effect of ABA by reducing its expression. MeJA induces the expression of MdMYB11 and MdMYB16, increasing the expression of anthocyanin regulatory genes MdMYB3, MdMYB9, and MdMYB10, as well as structural genes MdCHS, MdDFR, MdF3H, and MdUFGT, thereby promoting anthocyanin synthesis [59]. The MYB-bHLH-WDR complex directly regulates the expression of anthocyanin biosynthesis-related structural genes during the anthocyanin biosynthesis process, with R2R3-MYB transcription factors playing a crucial role in this process [60,61]. In summary, cis-regulatory elements in the promoter regions of anthocyanin biosynthesis-related genes play a crucial role in the anthocyanin biosynthesis process.

4.4. Analysis of the Expression Patterns of Genes Related to Anthocyanin Synthesis

Through qRT-PCR analysis of different pear varieties, we observed significantly higher expression levels of downstream genes in anthocyanin synthesis in red-skinned pears compared to green-skinned pears, consistent with previous studies [32]. However, we noted that the expression pattern of PbrC4H2 did not follow this trend of higher expression in red-skinned pears and lower expression in green-skinned pears (Figure 6). Upon further analysis of these six varieties, we found that the three varieties exhibiting high expression levels belong to the sand pear group, while the three with low expression levels are European pear varieties. Previous research has highlighted that anthocyanin and lignin metabolism represent important branches of the phenylalanine metabolic pathway, with cinnamate 4-hydroxylase (C4H) participating in both metabolic pathways [62]. Moreover, pear stone cells are formed through the deposition of lignin and cellulose [63], with the concentration of stone cells typically higher in sand pears compared to European pear [64,65]. Based on these observations, we speculate that the elevated expression of PbrC4H2 in sand pears may be linked to the formation of stone cells.
In the transcriptome analysis of red and white-fleshed pears, downstream genes in the anthocyanin biosynthesis pathway (PbrDFR8, PbrUFGT5) demonstrated significantly higher expression levels in the red-fleshed samples compared to the white-fleshed samples (Figure 7), consistent with the findings of Chang et al. [25]. However, Chang et al.’s study did not investigate the expression of genes such as PAL, C4H, and 4CL. In our study, we found that the expression levels of upstream genes in the anthocyanin biosynthesis pathway, such as PbrPAL2, PbrC4H2, PbrC4H3, Pbr4CL2, and Pbr4CL17, were significantly higher in red-fleshed samples compared to white-fleshed samples (Figure 7). Therefore, we speculate that the elevated expression levels of these upstream genes in the anthocyanin biosynthesis pathway may provide a substantial substrate foundation for anthocyanin synthesis, thereby facilitating the synthesis of anthocyanins in pear fruit flesh.
Abundant evidence suggests that among environmental factors, light stands out as one of the most potent regulatory factors in the anthocyanin biosynthetic pathway [66,67]. Light not only plays a crucial role in the growth and development of plants, but also poses a risk when plants are exposed to excessive high-energy ultraviolet radiation, which can lead to cellular damage [68]. The accumulation of anthocyanin in plants serves a protective role by enhancing resistance to ultraviolet stress [69]. To delve into the expression patterns of genes involved in anthocyanin biosynthesis under shaded and exposed conditions, we conducted an examination of the expression profiles of 94 anthocyanin biosynthesis-related genes in ‘Yunhongyihao’ pear samples subjected to bagging and debagging treatments (Figure 8). Our analysis revealed that, during the same period, the expression levels of anthocyanin biosynthesis-related genes in the debagged group were notably higher compared to those in the bagged group. Furthermore, downstream genes in the anthocyanin biosynthesis pathway (PbrDFR6, PbrDFR7, PbrANS2, PbrUFGT4) exhibited significantly higher expression levels in the debagged group. Previous studies across various species have demonstrated that genes such as PAL, CHS, CHI, DFR, ANS, and UFGT are upregulated in response to light stimulation, which aligns with our analytical results [70,71,72].
By comparing the expression of anthocyanin biosynthesis-related genes in pear peel tissues across different varieties and light conditions, we have discerned that a high expression of downstream genes (PbrDFR7, PbrANS2, PbrUFGT4) in the anthocyanin biosynthesis pathway significantly contributes to anthocyanin accumulation in pear peel. Notably, in red-fleshed pear tissues, besides the heightened expression of downstream genes (PbrDFR8, PbrUFGT5) in the anthocyanin biosynthesis pathway, we also observed elevated expression of upstream genes (PbrPAL2, PbrC4H2, PbrC4H3, Pbr4CL17). Based on these findings, we speculate that the elevated expression of upstream genes in the anthocyanin biosynthesis pathway may furnish a substantial substrate pool for anthocyanin biosynthesis, thereby promoting the accumulation of anthocyanins in pear fruit flesh. In conclusion, the analysis of differential expression patterns of genes involved in pear anthocyanin biosynthesis in this study lays a robust foundation for further research on anthocyanins in pears.

5. Conclusions

In this study, we identified 94 genes belonging to 15 gene families, associated with the anthocyanin biosynthesis pathway in Pyrus bretschneideri. Through phylogenetic analysis, motif analysis, and consideration of structural features, we classified 94 genes related to anthocyanin synthesis into 8 distinct lineages. Among these genes, a total of 16 repetitive events were identified, with 14 pairs originating from segmental duplications and 2 pairs from tandem duplications. Our findings highlight that segmental duplication serves as the primary driving force for the expansion of gene families related to anthocyanin biosynthesis. Furthermore, our analysis of the promoter regions of genes related to anthocyanin synthesis revealed a significant presence of light-responsive elements and hormone-responsive elements. This suggests that changes in light stimulation and hormone levels may exert influence on anthocyanin accumulation. Through comprehensive analysis of gene expression patterns, we have uncovered the significant role played by upstream genes in the anthocyanin biosynthesis pathway (PbrPAL2, PbrC4H2, PbrC4H3, Pbr4CL2, Pbr4CL17, PbrF3H5, PbrF3H6) in the accumulation of anthocyanins in pear fruit flesh. These results collectively provide insights into the characteristics of the 15 gene families related to anthocyanin biosynthesis in pears, laying a solid foundation for further investigation into the molecular mechanisms governing fruit coloration through anthocyanin biosynthesis-related genes.

Supplementary Materials

The following supporting information can be downloaded at: https://www.mdpi.com/article/10.3390/horticulturae10040335/s1, Figure S1: The distribution anthocyanin biosynthesis-related genes in chromosomes. The bar lengths represent the size of the chromosomes. Figure S2: Conserved motifs of the genes related to the anthocyanin biosynthesis pathway in Chinese white pear. Different colors in the boxes represent different motifs. Figure S3: Expression profiles of 94 anthocyanin-related genes in red and white pulp pear. Red and yellow colors indicate high/low transcript abundance expression levels, respectively. Table S1: Primers and sequences used in this study. Table S2: Pyrus bretschneideri, Arabidopsis thaliana, and Malus domestica anthocyanin biosynthesis pathway-related gene family members. Table S3: Statistical analysis of the gene family members related to anthocyanin synthesis in pear.0

Author Contributions

Conceptualization, L.Z. and B.S.; methodology, L.Z., B.S. and B.L.; software, L.Z. and S.Z.; validation, L.Z. and B.L.; formal analysis, L.Z. and B.S.; investigation, J.Z. and G.C.; data curation, Y.L.; writing—original draft preparation, L.Z.; writing—review and editing, B.S. and J.L.; funding acquisition, J.W. All authors have read and agreed to the published version of the manuscript.

Funding

This study was supported by the National Key Research and Development Program (2022YFD1200503), Earmarked Fund for China Agriculture Research System (CARS-28), Jiangsu Agricultural Science and Technology Innovation Fund (CX(22)3043), and Earmarked fund for Jiangsu Agricultural Industry Technology System (JATS [2023]412).

Data Availability Statement

Data are contained within the article and Supplementary Materials.

Acknowledgments

We thank the high-performance computing platforms of the Bioinformatics Center of Nanjing Agricultural University for supporting this project.

Conflicts of Interest

The authors declare no conflicts of interest.

References

  1. Potter, D.; Eriksson, T.; Evans, R.C.; Oh, S.; Smedmark, J.E.E.; Morgan, D.R.; Kerr, M.; Robertson, K.R.; Arsenault, M.; Dickinson, T.A.; et al. Phylogeny and classification of Rosaceae. Plant Syst. Evol. 2007, 266, 5–43. [Google Scholar] [CrossRef]
  2. Zhang, D.; Qian, M.; Yu, B.; Teng, Y. Effect of fruit maturity on UV-B-induced post-harvest anthocyanin accumulation in red Chinese sand pear. Acta Physiol. Plant. 2013, 35, 2857–2866. [Google Scholar] [CrossRef]
  3. Alabd, A.; Ahmad, M.; Zhang, X.; Gao, Y.; Peng, L.; Zhang, L.; Ni, J.; Bai, S.; Teng, Y. Light-responsive transcription factor PpWRKY44 induces anthocyanin accumulation by regulating PpMYB10 expression in pear. Hortic. Res. 2022, 9, uhac199. [Google Scholar] [CrossRef]
  4. Sun, Y.; Qian, M.; Wu, R.; Niu, Q.; Teng, Y.; Zhang, D. Postharvest pigmentation in red Chinese sand pears (Pyrus pyrifolia Nakai) in response to optimum light and temperature. Postharvest Biol. Technol. 2014, 91, 64–71. [Google Scholar] [CrossRef]
  5. Bai, S.; Sun, Y.; Qian, M.; Yang, F.; Ni, J.; Tao, R.; Li, L.; Shu, Q.; Zhang, D.; Teng, Y. Transcriptome analysis of bagging-treated red Chinese sand pear peels reveals light-responsive pathway functions in anthocyanin accumulation. Sci. Rep. 2017, 7, 63. [Google Scholar] [CrossRef] [PubMed]
  6. Kayesh, E.; Shangguan, L.; Korir, N.K.; Sun, X.; Bilkish, N.; Zhang, Y.; Han, J.; Song, C.; Cheng, Z.-M.; Fang, J. Fruit skin color and the role of anthocyanin. Acta Physiol. Plant. 2013, 35, 2879–2890. [Google Scholar] [CrossRef]
  7. Winkel-Shirley, B. Flavonoid Biosynthesis. A Colorful Model for Genetics, Biochemistry, Cell Biology, and Biotechnology. Plant Physiol. 2001, 126, 485–493. [Google Scholar] [CrossRef]
  8. Schaefer, H.M.; Schaefer, V.; Levey, D.J. How plant—Animal interactions signal new insights in communication. Trends Ecol. Evol. 2004, 19, 577–584. [Google Scholar] [CrossRef]
  9. Jeong, S.T.; Goto-Yamamoto, N.; Hashizume, K.; Esaka, M. Expression of the flavonoid 3′-hydroxylase and flavonoid 3′,5′-hydroxylase genes and flavonoid composition in grape (Vitis vinifera). Plant Sci. 2006, 170, 61–69. [Google Scholar] [CrossRef]
  10. Veeriah, S.; Kautenburger, T.; Habermann, N.; Sauer, J.; Dietrich, H.; Will, F.; Pool-Zobel, B.L. Apple flavonoids inhibit growth of HT29 human colon cancer cells and modulate expression of genes involved in the biotransformation of xenobiotics. Mol. Carcinog. 2006, 45, 164–174. [Google Scholar] [CrossRef]
  11. Tohge, T.; Fernie, A.R. Leveraging Natural Variance towards Enhanced Understanding of Phytochemical Sunscreens. Trends Plant Sci. 2017, 22, 308–315. [Google Scholar] [CrossRef] [PubMed]
  12. Bieza, K.; Lois, R. An Arabidopsis Mutant Tolerant to Lethal Ultraviolet-B Levels Shows Constitutively Elevated Accumulation of Flavonoids and Other Phenolics. Plant Physiol. 2001, 126, 1105–1115. [Google Scholar] [CrossRef] [PubMed]
  13. Zeng, Y.; Song, J.; Zhang, M.; Wang, H.; Zhang, Y.; Suo, H. Comparison of In Vitro and In Vivo Antioxidant Activities of Six Flavonoids with Similar Structures. Antioxidants 2020, 9, 732. [Google Scholar] [CrossRef] [PubMed]
  14. Wu, T.; Guo, X.; Zhang, M.; Yang, L.; Liu, R.; Yin, J. Anthocyanins in black rice, soybean and purple corn increase fecal butyric acid and prevent liver inflammation in high fat diet-induced obese mice. Food Funct. 2017, 8, 3178–3186. [Google Scholar] [CrossRef] [PubMed]
  15. Teng, H.; Fang, T.; Lin, Q.; Song, H.; Liu, B.; Chen, L. Red raspberry and its anthocyanins: Bioactivity beyond antioxidant capacity. Trends Food Sci. Technol. 2017, 66, 153–165. [Google Scholar] [CrossRef]
  16. He, Y.; Li, D.; Li, S.; Liu, Y.; Chen, H. SmBICs Inhibit Anthocyanin Biosynthesis in Eggplant (Solanum melongena L.). Plant Cell Physiol. 2021, 62, 1001–1011. [Google Scholar] [CrossRef] [PubMed]
  17. Ou, C.; Zhang, X.; Wang, F.; Zhang, L.; Zhang, Y.; Fang, M.; Wang, J.; Wang, J.; Jiang, S.; Zhang, Z. A 14 nucleotide deletion mutation in the coding region of the PpBBX24 gene is associated with the red skin of “Zaosu Red” pear (Pyrus pyrifolia White Pear Group): A deletion in the PpBBX24 gene is associated with the red skin of pear. Hortic. Res. 2020, 7, 39. [Google Scholar] [CrossRef] [PubMed]
  18. Jaakola, L. New insights into the regulation of anthocyanin biosynthesis in fruits. Trends Plant Sci. 2013, 18, 477–483. [Google Scholar] [CrossRef] [PubMed]
  19. Holton, T.A.; Cornish, E.C. Genetics and Biochemistry of Anthocyanin Biosynthesis. Plant Cell 1995, 7, 1071–1083. [Google Scholar] [CrossRef]
  20. Guo, N.; Cheng, F.; Wu, J.; Liu, B.; Zheng, S.; Liang, J.; Wang, X. Anthocyanin biosynthetic genes in Brassica rapa. BMC Genom. 2014, 15, 426. [Google Scholar] [CrossRef]
  21. Wei, W.-L.; Jiang, F.-D.; Liu, H.-N.; Sun, M.-Y.; Li, Q.-Y.; Chang, W.-J.; Li, Y.-J.; Li, J.-M.; Wu, J. The PcHY5 methylation is associated with anthocyanin biosynthesis and transport in ‘Max Red Bartlett’ and ‘Bartlett’ pears. J. Integr. Agric. 2023, 22, 3256–3268. [Google Scholar] [CrossRef]
  22. Rauf, A.; Imran, M.; Abu-Izneid, T.; Iahtisham Ul, H.; Patel, S.; Pan, X.; Naz, S.; Sanches Silva, A.; Saeed, F.; Rasul Suleria, H.A. Proanthocyanidins: A comprehensive review. Biomed. Pharmacother. 2019, 116, 108999. [Google Scholar] [CrossRef]
  23. Zhang, H.; Yang, B.; Liu, J.; Guo, D.; Hou, J.; Chen, S.; Song, B.; Xie, C. Analysis of structural genes and key transcription factors related to anthocyanin biosynthesis in potato tubers. Sci. Hortic. 2017, 225, 310–316. [Google Scholar] [CrossRef]
  24. Liu, W.; Mei, Z.; Yu, L.; Gu, T.; Li, Z.; Zou, Q.; Zhang, S.; Fang, H.; Wang, Y.; Zhang, Z.; et al. The ABA-induced NAC transcription factor MdNAC1 interacts with a bZIP-type transcription factor to promote anthocyanin synthesis in red-fleshed apples. Hortic. Res. 2023, 10, uhad049. [Google Scholar] [CrossRef] [PubMed]
  25. Chang, Y.-J.; Chen, G.-S.; Yang, G.-Y.; Sun, C.-R.; Wei, W.-L.; Korban, S.S.; Wu, J. The PcERF5 promotes anthocyanin biosynthesis in red-fleshed pear (Pyrus communis) through both activating and interacting with PcMYB transcription factors. J. Integr. Agric. 2023, 22, 2687–2704. [Google Scholar] [CrossRef]
  26. Zhang, L.; Duan, Z.; Ma, S.; Sun, S.; Sun, M.; Xiao, Y.; Ni, N.; Irfan, M.; Chen, L.; Sun, Y. SlMYB7, an AtMYB4-Like R2R3-MYB Transcription Factor, Inhibits Anthocyanin Accumulation in Solanum lycopersicum Fruits. J. Agric. Food Chem. 2023, 71, 18758–18768. [Google Scholar] [CrossRef]
  27. Ni, J.; Wang, S.; Yu, W.; Liao, Y.; Pan, C.; Zhang, M.; Tao, R.; Wei, J.; Gao, Y.; Wang, D.; et al. The ethylene-responsive transcription factor PpERF9 represses PpRAP2.4 and PpMYB114 via histone deacetylation to inhibit anthocyanin biosynthesis in pear. Plant Cell 2023, 35, 2271–2292. [Google Scholar] [CrossRef] [PubMed]
  28. Petrussa, E.; Braidot, E.; Zancani, M.; Peresson, C.; Bertolini, A.; Patui, S.; Vianello, A. Plant flavonoids—Biosynthesis, transport and involvement in stress responses. Int. J. Mol. Sci. 2013, 14, 14950–14973. [Google Scholar] [CrossRef]
  29. Liu, H.; Liu, Z.; Wu, Y.; Zheng, L.; Zhang, G. Regulatory mechanisms of anthocyanin biosynthesis in apple and pear. Int. J. Mol. Sci. 2021, 22, 8441. [Google Scholar] [CrossRef]
  30. Li, G.; Wang, H.; Cheng, X.; Su, X.; Zhao, Y.; Jiang, T.; Jin, Q.; Lin, Y.; Cai, Y. Comparative genomic analysis of the PAL genes in five Rosaceae species and functional identification of Chinese white pear. PeerJ 2019, 7, e8064. [Google Scholar] [CrossRef]
  31. Cao, Y.; Han, Y.; Li, D.; Lin, Y.; Cai, Y. Systematic Analysis of the 4-Coumarate:Coenzyme A Ligase (4CL) Related Genes and Expression Profiling during Fruit Development in the Chinese Pear. Genes 2016, 7, 89. [Google Scholar] [CrossRef] [PubMed]
  32. Qian, M.; Yu, B.; Li, X.; Sun, Y.; Zhang, D.; Teng, Y. Isolation and Expression Analysis of Anthocyanin Biosynthesis Genes from the Red Chinese Sand Pear, Pyrus pyrifolia Nakai cv. Mantianhong, in Response to Methyl Jasmonate Treatment and UV-B/VIS Conditions. Plant Mol. Biol. Report. 2013, 32, 428–437. [Google Scholar]
  33. Wu, J.; Wang, Z.; Shi, Z.; Zhang, S.; Ming, R.; Zhu, S.; Khan, M.A.; Tao, S.; Korban, S.S.; Wang, H.; et al. The genome of the pear (Pyrus bretschneideri Rehd.). Genome Res. 2013, 23, 396–408. [Google Scholar] [CrossRef] [PubMed]
  34. Liu, S.; Meng, Z.; Zhang, H.; Chu, Y.; Qiu, Y.; Jin, B.; Wang, L. Identification and characterization of thirteen gene families involved in flavonoid biosynthesis in Ginkgo biloba. Ind. Crops Prod. 2022, 188, 115576. [Google Scholar] [CrossRef]
  35. Camacho, C.; Coulouris, G.; Avagyan, V.; Ma, N.; Papadopoulos, J.; Bealer, K.; Madden, T.L. BLAST+: Architecture and applications. BMC bioinformatics 2009, 10, 421. [Google Scholar] [CrossRef] [PubMed]
  36. Finn, R.D.; Clements, J.; Eddy, S.R. HMMER web server: Interactive sequence similarity searching. Nucleic Acids Res. 2011, 39, 29–37. [Google Scholar] [CrossRef] [PubMed]
  37. Katoh, K.; Standley, D.M. MAFFT Multiple Sequence Alignment Software Version 7: Improvements in Performance and Usability. Mol. Biol. Evol. 2013, 30, 772–780. [Google Scholar] [CrossRef] [PubMed]
  38. Nguyen, L.-T.; Schmidt, H.A.; von Haeseler, A.; Minh, B.Q. IQ-TREE: A Fast and Effective Stochastic Algorithm for Estimating Maximum-Likelihood Phylogenies. Mol. Biol. Evol. 2014, 32, 268–274. [Google Scholar] [CrossRef]
  39. Letunic, I.; Bork, P. Interactive Tree Of Life (iTOL) v5: An online tool for phylogenetic tree display and annotation. Nucleic Acids Res. 2021, 49, W293–W296. [Google Scholar] [CrossRef]
  40. Chen, C.; Chen, H.; Zhang, Y.; Thomas, H.R.; Frank, M.H.; He, Y.; Xia, R. TBtools: An Integrative Toolkit Developed for Interactive Analyses of Big Biological Data. Mol. Plant 2020, 13, 1194–1202. [Google Scholar] [CrossRef]
  41. Wang, Y.; Tang, H.; Debarry, J.D.; Tan, X.; Li, J.; Wang, X.; Lee, T.H.; Jin, H.; Marler, B.; Guo, H.; et al. MCScanX: A toolkit for detection and evolutionary analysis of gene synteny and collinearity. Nucleic Acids Res. 2012, 40, e49. [Google Scholar] [CrossRef] [PubMed]
  42. Liu, H.; Shu, Q.; Lin-Wang, K.; Allan, A.C.; Espley, R.V.; Su, J.; Pei, M.; Wu, J. The PyPIF5-PymiR156a-PySPL9-PyMYB114/MYB10 module regulates light-induced anthocyanin biosynthesis in red pear. Mol. Hortic. 2021, 1, 14. [Google Scholar] [CrossRef] [PubMed]
  43. Livak, K.J.; Schmittgen, T.D. Analysis of relative gene expression data using real-time quantitative PCR and the 2−ΔΔCT method. methods 2001, 25, 402–408. [Google Scholar] [CrossRef]
  44. Wu, T.; Zhang, R.; Gu, C.; Wu, J.; Wan, H.; Zhang, S.; Zhang, S. Evaluation of candidate reference genes for real time quantitative PCR normalization in pear fruit. Afr. J. Agric. Res. 2012, 7, 3701–3704. [Google Scholar]
  45. Shen, N.; Wang, T.; Gan, Q.; Liu, S.; Wang, L.; Jin, B. Plant flavonoids: Classification, distribution, biosynthesis, and antioxidant activity. Food Chem. 2022, 383, 132531. [Google Scholar] [CrossRef]
  46. Wang, J.; Zhang, C.; Li, Y. Genome-Wide Identification and Expression Profiles of 13 Key Structural Gene Families Involved in the Biosynthesis of Rice Flavonoid Scaffolds. Genes 2022, 13, 410. [Google Scholar] [CrossRef] [PubMed]
  47. Deng, Y.; Li, C.; Li, H.; Lu, S. Identification and Characterization of Flavonoid Biosynthetic Enzyme Genes in Salvia miltiorrhiza (Lamiaceae). Molecules 2018, 23, 1467. [Google Scholar] [CrossRef]
  48. Fawcett, J.A.; Maere, S.; Van de Peer, Y. Plants with double genomes might have had a better chance to survive the Cretaceous–Tertiary extinction event. Proc. Natl. Acad. Sci. USA 2009, 106, 5737–5742. [Google Scholar] [CrossRef]
  49. Hrazdina, G.; Wagner, G.J. Metabolic pathways as enzyme complexes: Evidence for the synthesis of phenylpropanoids and flavonoids on membrane associated enzyme complexes. Arch. Biochem. Biophys. 1985, 237, 88–100. [Google Scholar] [CrossRef]
  50. Dastmalchi, M.; Bernards, M.A.; Dhaubhadel, S. Twin anchors of the soybean isoflavonoid metabolon: Evidence for tethering of the complex to the endoplasmic reticulum by IFS and C4H. Plant J. 2016, 85, 689–706. [Google Scholar] [CrossRef]
  51. Zhu, Y.; Wu, N.; Song, W.; Yin, G.; Qin, Y.; Yan, Y.; Hu, Y. Soybean (Glycine max) expansin gene superfamily origins: Segmental and tandem duplication events followed by divergent selection among subfamilies. BMC Plant Biol. 2014, 14, 93. [Google Scholar] [CrossRef]
  52. Cannon, S.B.; Mitra, A.; Baumgarten, A.; Young, N.D.; May, G. The roles of segmental and tandem gene duplication in the evolution of large gene families in Arabidopsis thaliana. BMC Plant Biol. 2004, 4, 10. [Google Scholar] [CrossRef]
  53. Sun, S.-C.; Xiong, X.-P.; Zhang, X.-L.; Feng, H.-J.; Zhu, Q.-H.; Sun, J.; Li, Y.-J. Characterization of the Gh4CL gene family reveals a role of Gh4CL7 in drought tolerance. BMC Plant Biol. 2020, 20, 125. [Google Scholar] [CrossRef]
  54. Yang, Z.; Zhang, R.; Zhou, Z. The XTH Gene Family in Schima superba: Genome-Wide Identification, Expression Profiles, and Functional Interaction Network Analysis. Front. Plant Sci. 2022, 13, 911761. [Google Scholar] [CrossRef]
  55. Yokoyama, R.; Nishitani, K. A comprehensive expression analysis of all members of a gene family encoding cell-wall enzymes allowed us to predict cis-regulatory regions involved in cell-wall construction in specific organs of Arabidopsis. Plant Cell Physiol. 2001, 42, 1025–1033. [Google Scholar] [CrossRef]
  56. Cominelli, E.; Gusmaroli, G.; Allegra, D.; Galbiati, M.; Wade, H.K.; Jenkins, G.I.; Tonelli, C. Expression analysis of anthocyanin regulatory genes in response to different light qualities in Arabidopsis thaliana. J. Plant Physiol. 2008, 165, 886–894. [Google Scholar] [CrossRef]
  57. Sun, L.; Li, S.; Tang, X.; Fan, X.; Zhang, Y.; Jiang, J.; Liu, J.; Liu, C. Transcriptome analysis reveal the putative genes involved in light-induced anthocyanin accumulation in grape ‘Red Globe’ (V. vinifera L.). Gene 2020, 728, 144284. [Google Scholar] [CrossRef]
  58. Clayton-Cuch, D.; Yu, L.; Shirley, N.; Bradley, D.; Bulone, V.; Bottcher, C. Auxin Treatment Enhances Anthocyanin Production in the Non-Climacteric Sweet Cherry (Prunus avium L.). Int. J. Mol. Sci. 2021, 22, 10760. [Google Scholar]
  59. Sun, J.; Wang, Y.; Chen, X.; Gong, X.; Wang, N.; Ma, L.; Qiu, Y.; Wang, Y.; Feng, S. Effects of methyl jasmonate and abscisic acid on anthocyanin biosynthesis in callus cultures of red-fleshed apple (Malus sieversii f. niedzwetzkyana). Plant Cell Tissue Organ Cult. (PCTOC) 2017, 130, 227–237. [Google Scholar] [CrossRef]
  60. Liu, J.; Osbourn, A.; Ma, P. MYB Transcription Factors as Regulators of Phenylpropanoid Metabolism in Plants. Mol. Plant 2015, 8, 689–708. [Google Scholar] [CrossRef] [PubMed]
  61. Jin, W.; Wang, H.; Li, M.; Wang, J.; Yang, Y.; Zhang, X.; Yan, G.; Zhang, H.; Liu, J.; Zhang, K. The R2R3 MYB transcription factor PavMYB10.1 involves in anthocyanin biosynthesis and determines fruit skin colour in sweet cherry (Prunus avium L.). Plant Biotechnol. J. 2016, 14, 2120–2133. [Google Scholar] [CrossRef] [PubMed]
  62. Zhang, S.; Yang, J.; Li, H.; Chiang, V.L.; Fu, Y. Cooperative Regulation of Flavonoid and Lignin Biosynthesis in Plants. Crit. Rev. Plant Sci. 2021, 40, 109–126. [Google Scholar] [CrossRef]
  63. Smith, W.W. The Course of stone cell formation in pear fruits. Plant Physiol. 1935, 10, 587–611. [Google Scholar] [CrossRef]
  64. Wu, J.; Wang, Y.; Xu, J.; Korban, S.S.; Fei, Z.; Tao, S.; Ming, R.; Tai, S.; Khan, A.M.; Postman, J.D.; et al. Diversification and independent domestication of Asian and European pears. Genome Biol. 2018, 19, 77. [Google Scholar] [CrossRef]
  65. Choi, J.-H.; Lee, S.-H. Distribution of stone cell in Asian, Chinese, and European pear fruit and its morphological changes. J. Appl. Bot. Food Qual. 2013, 86, 185–189. [Google Scholar]
  66. Takos, A.M.; Jaffé, F.W.; Jacob, S.R.; Bogs, J.; Robinson, S.P.; Walker, A.R. Light-induced expression of a MYB gene regulates anthocyanin biosynthesis in red apples. Plant Physiol. 2006, 142, 1216–1232. [Google Scholar] [CrossRef]
  67. Meng, X.; Xing, T.; Wang, X. The role of light in the regulation of anthocyanin accumulation in Gerbera hybrida. Plant Growth Regul. 2004, 44, 243–250. [Google Scholar] [CrossRef]
  68. Merzlyak, M.N.; Chivkunova, O.B. Light-stress-induced pigment changes and evidence for anthocyanin photoprotection in apples. J. Photochem. Photobiol. B 2000, 55, 155–163. [Google Scholar] [CrossRef]
  69. Landi, M.; Tattini, M.; Gould, K.S. Multiple functional roles of anthocyanins in plant-environment interactions. Environ. Exp. Bot. 2015, 119, 4–17. [Google Scholar] [CrossRef]
  70. Zhang, Y.; Hu, W.; Peng, X.; Sun, B.; Wang, X.; Tang, H. Characterization of anthocyanin and proanthocyanidin biosynthesis in two strawberry genotypes during fruit development in response to different light qualities. J. Photochem. Photobiol. B Biol. 2018, 186, 225–231. [Google Scholar] [CrossRef]
  71. Li, W.; Tan, L.; Zou, Y.; Tan, X.; Huang, J.; Chen, W.; Tang, Q. The Effects of Ultraviolet A/B Treatments on Anthocyanin Accumulation and Gene Expression in Dark-Purple Tea Cultivar ‘Ziyan’ (Camellia sinensis). Molecules 2020, 25, 354. [Google Scholar] [CrossRef]
  72. Guo, X.L.; Hu, J.B.; Wang, D.L. Effect of Light Intensity on Blueberry Fruit Coloration, Anthocyanin Synthesis Pathway Enzyme Activity, and Gene Expression. Russ. J. Plant Physiol. 2023, 70, 136. [Google Scholar] [CrossRef]
Figure 2. The phylogenetic analysis of anthocyanin biosynthesis-related gene families in three different species, including Arabidopsis thaliana, Malus domestica, and Pyrus bretschneideri, was constructed using the maximum likelihood method. In the resulting phylogenetic tree, different colored backgrounds are used to indicate distinct groups, while different colored shapes represent the different species involved in the analysis.
Horticulturae 10 00335 g002
Figure 3. Phylogenetic tree: (A) conserved domains (B) and exon/intron structure (C) of the 94 genes involved in the Chinese white pear anthocyanin biosynthesis pathway. (A) The evolutionary tree was built using the maximum likelihood (ML) method with 1000 bootstrap replicates for the 94 members of the anthocyanin biosynthesis gene family using the IQ-TREE software, version 1.6.12. Different colored boxes represent different domains present in the genes or proteins. (B,C) The width of the boxes represents the relative length of the genes or proteins. Differently colored boxes in (B,C) represent different domains, respectively. The green and yellow boxes, and the grey lines in (C) represent the exons, UTRs, and introns, respectively.
Horticulturae 10 00335 g003
Figure 4. Synteny analysis in Chinese white pear. (A) The distribution and collinearity relationships of genes related to the anthocyanin biosynthesis pathway on each chromosome of Pyrus bretschneideri, Arabidopsis thaliana, and Malus domestica. The chromosomes of different species are shown in different colors. The numbers represent chromosome identifiers. (B) Identification of the 94 genes associated with the anthocyanin biosynthesis pathway in Chinese white pear using the MCScanX software. The circular plot was generated using the TBtools software. Segmental duplication events are represented with redlines and tandem duplication events with blue lines.
Horticulturae 10 00335 g004
Figure 5. Cis-acting element structures in promoter regions of anthocyanin biosynthesis-related genes. (A) The evolutionary tree was built using the maximum likelihood (ML) method with 1000 bootstrap replicates for the 94 members of the anthocyanin biosynthesis-related gene family using the IQ-TREE software, version 1.6.12. (B) The distribution of cis-elements in the 2000 bp upstream promoter region of anthocyanin biosynthesis-related genes. Different cis-elements are represented by the different colors. (C) The number of cis-acting elements on putative promoters of anthocyanin biosynthesis-related genes.
Horticulturae 10 00335 g005
Figure 6. qRT-PCR analysis of 15 anthocyanin biosynthesis-related genes in different pear cultivars. ‘Cuiguan’, ‘Shinseiki’ and ‘Binxiang’ represent green-skinned pears, while ‘RedBartlett’, ‘Starkrimson’, and ‘Yunhongyihao’ represent red-skinned pears. In addition, ‘Cuiguan’, ‘Shinseiki’, and ‘Yunhongyihao’ belong to the sand pear variety, and ‘Binxiang’, ‘RedBartlett’, and ‘Starkrimson’ belong to the European pear variety. The error bars indicate the mean ± SD (n = 3).
Horticulturae 10 00335 g006
Figure 7. Transcriptome analysis of genes related to the anthocyanin biosynthesis pathway in red- and white-fleshed pear. RPKM (reads per kilobase per million) values represent the expression levels of these genes. ‘Bartlett’ (B-S1), ‘RedBartlett’ (RB-S1), and red-fleshed pear ‘Summer Blood Birne’ (SB) at different stages of fruit collection. S1, semi-mature fruit; S2, mature fruit. The error bars indicate the mean ± SD (n = 3). The different letters above the bars indicate significantly different values (p < 0.05) calculated using a one-way analysis of variance (ANOVA) followed by Tukey’s multiple range test.
Horticulturae 10 00335 g007
Figure 8. Expression pattern analysis of anthocyanin biosynthesis-related genes in bagged and debagged ‘Yunhongyihao’ pear. (A) D1, D2, and D3 represent the fruits sampled at 4, 8, and 10 days after removal from the bags, respectively. B1, B2, and B3 fruits were bagged at the same time as the controls. The color scale represents the expression values. (B) qRT-PCR analysis of anthocyanin biosynthesis-related genes. The error bars indicate the mean ± SD (n = 3). (C) Correlation analysis of RNA-seq and qRT-PCR data for anthocyanin biosynthesis-related genes.
Horticulturae 10 00335 g008
Table 1. Summary of anthocyanin biosynthesis gene properties in the Chinese white pear. For detailed information, please refer to Table S3.
Gene FamilyNumber of GenesProtein LengthMW1
(KDa)
pI2Subcellular Prediction
PAL2715–72077.83–78.155.79–6.29E.R.3; chlo4
C4H3504–52957.58–57.699.06–9.36plas5
4CL18544–83159.14–92.055.36–8.66chlo; mito6; pero7; plas; vacu8
CHS14388–39642.41–43.215.50–6.48cyto9; cysk10
CHI8219–46623.35–49.764.99–7.65cyto; chlo
F3H9328–45637.22–52.555.01–6.75chlo; cysk; cyto; nucl11
F3′H6392–51444.32–58.716.59–9.16chlo; nucl
F3′5′H2496–51856.53–59.167.98–8.04plas
FLS4308–35935.47–39.915.49–5.85cysk; nucl; cyto
DFR8300–101633.01–110.425.35–6.16chlo; cyto
ANS4347–36138.39–40.565.23–5.85cyto; cysk
ANR3312–33934.08–36.935.00–5.63chlo; cyto
LAR235238.70–38.745.58–7.11chlo; cyto
LDOX334839.295.84cyto
UFGT8370–49351.53–54.185.33–5.93chlo; cyto; vacu
MW1, molecular weight of the gene products; pI2, theoretical isoelectric point: the Ph at which a protein or molecule carries no net electrical charge; E.R.3, endoplasmic reticulum; chlo4, chloroplast; plas5, plasma membrane; mito6, mitochondrion; pero7, peroxisome; vacu8, vacuole; cyto9, cytoplasm; cysk10, cytoskeleton; nucl11, nucleus.
Disclaimer/Publisher’s Note: The statements, opinions and data contained in all publications are solely those of the individual author(s) and contributor(s) and not of MDPI and/or the editor(s). MDPI and/or the editor(s) disclaim responsibility for any injury to people or property resulting from any ideas, methods, instructions or products referred to in the content.

