Abstract
Stem blight and dieback rank among the most relevant diseases affecting blueberry production worldwide. In Northern Italy, Neofusicoccum parvum, Diaporthe rudis, Cadophora luteo-olivacea and Peroneutypa scoparia have been reported to cause stem blight and dieback in blueberry. Considering that the incidence and severity of these diseases are on the rise in Northern Italy, two of the main aims of the present study were a—to compare the in vitro growth rate of the four fungi at different temperatures and b—to assess the aggressiveness of the same fungi on four commercial blueberry cultivars. Neofusicoccum parvum had the fastest growth rate and was the most aggressive pathogen. A possible effect of temperature on host colonization by N. parvum and disease expression was postulated and tested as a third aim. In planta trials were performed to model and predict the influence of temperature on the severity of blueberry stem blight and dieback caused by N. parvum. Increasing temperatures boosted the aggressiveness of the pathogen, causing higher disease severity and host mortality. Our findings suggest that temperature plays a relevant role in the severity of blueberry stem blight and dieback caused by N. parvum. Given the predictions of a warmer climate, this disease may become increasingly more significant and should be actively managed.
1. Introduction
Stem blight and dieback are common diseases that are seriously compromising the fruit quality and yield of blueberry (Vaccinium corymbosum) orchards worldwide [1]. Several fungal species have been reported as putative causal agents of these diseases [2]. The species most frequently isolated from symptomatic blueberry plants belong to the Botryosphaeriaceae family or to the genus Diaporthe [2]. Neofusicoccum arbuti, N. australe, N. parvum, N. nonquaesitum and Diaporthe spp. have been isolated from symptomatic blueberry plants in Chile, often in the same or in contiguous orchards [3]. Lasiodiplodia species associated with blueberry dieback have been isolated in Peru [4], while Botryosphaeria corticis has been reported in New Jersey and Noth Carolina (USA) [5]. Neofusicoccum and Diplodia spp. have been detected in farms and nurseries in New Zealand [6], and eight species in the genera Botryosphaeria, Lasiodiplodia and Neofusicoccum have been reported in Australia [7]. Botryosphaeria dothidea, Neofusicoccum parvum and Lasiodiplodia theobromae have been isolated from diseased blueberry plants in China [8], where several new Lasiodiplodia species, including L. vaccinii, have been identified in association with cankers or wilting of blueberry branches [9]. In Europe, Diaporthe eres has been reported in association with dieback, twig and stem blight and cankers of blueberry in Croatia [10] and the Netherlands [11]. Additionally, D. viticola (=D. rudis) from the Netherlands and D. baccae and D. sterilis from Italy are newly described species isolated from symptomatic blueberries [11]. Neofusicoccum parvum and N. australe have been reported as causal agents of blueberry canker and dieback in Spain [12], while the same diseases in highbush blueberry were related to species of the genus Lasiodiplodia in Spain [13] and the Czech Republic [14]. Finally, four Botryosphaeriaceae species (Botryosphaeria dothidea, Neofusicoccum parvum, N. australe and N. eucalyptorum) and six Diaporthe spp. have been reported as pathogens in blueberry in Portugal [15,16]. In Italy, the adoption of new agricultural practices and cultivars (cvs.), the intensification of cultural systems along with the movement of plant material on a large scale have all contributed to a consistent increase in blueberry production, followed by the emergence of various diseases [17,18]. Recently, stem blight and dieback symptoms have been on the rise and are of growing concern for producers in some areas of Italy. In the northwest of Italy, four different fungal species, namely Neofusicoccum parvum, Diaporthe rudis, Cadophora luteo-olivacea and Peroneutypa scoparia, have been confirmed to be pathogens of blueberries, with N. parvum and D. rudis being the dominant and most virulent ones [18]. It should be noted that Northwestern Italy contributes significantly to the overall Italian blueberry production, with Piedmont including 46.2% of the total blueberry cultivation in the country [19].
Many species in the order Diaporthales and Botryosphaeriales are known for their ability to survive as endophytes or as latent pathogens, until the onsite of conditions favorable to their growth triggers their switch to a pathogenic phase [20,21]. Thus, abiotic factors can play a major role in disease development by affecting plant physiology, which, in turn, may create a favorable environment for latent pathogens. The shift from endophytism to pathogenicity is regulated by the intimate interaction between host physiology and fungal physiology, with each one of these variables, in turn, being strongly influenced by the climate and/or by the presence of other organisms [22,23]. Climate change and global warming are strongly involved in modulating fungal disease incidence and impact woody hosts by directly affecting the fungus and the plant host independently [2,24]. For instance, variations in temperature combined with increasing drought can influence pathogen adaptation, development and spread [25]. Temperature can cause a severe impact on agricultural ecosystems, not only influencing plant physiology, but also the survival, reproduction, transmission and evolution of pathogens [26,27].
Climate change models are predicting a significant rise in summer air temperatures in the Mediterranean area, resulting in drought stress on many fruit crops, which, in turn, may increase their susceptibility [28,29]. Considering the key role of warming temperatures on pathogens, hosts and their interactions, agricultural crops will be likely challenged by global warming in the near future [30]. Disentangling the direct (e.g., directly affecting the pathogen) vs. the indirect (e.g., affecting the pathogen through changes in the host) effects of climate change is a pivotal task for the prediction and management of plant diseases in areas experiencing climate change.
The aims of the present study were as follows:
- (i)
- To compare the average in vitro growth rate of the four confirmed blueberry stem blight and dieback pathogens in Northwestern Italy at different temperatures (i.e., Neofusicoccum parvum, Diaporthe rudis, Cadophora luteo-olivacea and Peroneutypa scoparia);
- (ii)
- To evaluate the susceptibility of different northern highbush blueberry cvs. to these four pathogens;
- (iii)
- To model the in vitro effect of temperature on the mycelial growth rate of Neofusicoccum parvum;
- (iv)
- To assess and model the in planta effect of temperature on the severity of blueberry stem blight and dieback caused by Neofusicoccum parvum, the most virulent of the four pathogens studied here.
2. Materials and Methods
2.1. Fungal Species and Strain Selection
The fungal species investigated here were Neofusicoccum parvum, Diaporthe rudis, Cadophora luteo-olivacea and Peroneutypa scoparia. All four are confirmed pathogens of blueberry [18]. One representative strain of each fungal species (CVG444—N. parvum, CVG561—P. scoparia, CVG651—C. luteo-olivacea, CVG658—D. rudis) was selected for this study. The identity of each strain was confirmed thanks to a multi locus phylogenetic analysis based on the nuclear ribosomal internal transcribed spacer (ITS), the β-tubulin (tub2) and translation elongation factor-1α (tef1). All strains were collected from wilted blueberry twigs and cankered branches in 2019 and kept at −80 °C in the University of Torino culture collection area, Torino, Italy. Their pathogenicity was previously assessed thanks to inoculations performed on blueberry plants of the cv. Duke [18]. The most aggressive species in the pathogenicity study was N. parvum [18]. Fungal strains were grown on potato dextrose agar (PDA, VWR Chemicals, Leuven, Belgium) amended with 25 mg/L of streptomycin sulphate (PDA-S, AppliChem GmbH, Darmstadt, Germany) at 25 ± 1 °C for 7 days in the dark. Mycelial plugs were cut with a cork borer (4 mm diam) from the margin of actively grown colonies and used for the inoculation of plates and plants.
2.2. Plant Material
The northern highbush blueberry cvs. ‘Blue Ribbon’, ‘Cargo’, ‘Last Call’ and ‘Top Shelf’ were selected to compare the virulence of the four fungal strains. The cvs. Blue Ribbon, Last Call and Top Shelf were selected because the fungal strains used in this study were originally isolated from such cultivars. ‘Cargo’ was included due to its increased popularity associated with the demand for varieties with different ripening times [31]. Plants of the cv. Duke were additionally used to assess the in planta effect of temperature on the colonization rate and branch mortality caused by N. parvum. This cv. was selected for the in planta portion of the study given that it is currently the most widely cultivated worldwide.
2.3. Comparison of In Vitro Growth Rates of Cadophora luteo-olivacea, Diaporthe rudis, Neofusicoccum parvum and Peroneutypa scoparia
Mycelial plugs (6 mm diam.) of the four selected strains were placed onto the center of new PDA-S plates and incubated at 5, 10, 15, 20, 25, 30 and 35 °C in the dark. Seven replicate Petri dishes per strain and temperature combinations were considered in a completely randomized design. Two perpendicular diameters of the colonies were measured with a scale ruler once daily for 4 to 7 days post inoculation. Mean data were converted to radial growth rate (mm/day). Average in vitro growth rates (IGR, mm/day) were calculated for each of the four fungal species along with their 95% bias-corrected and accelerated confidence intervals (95%BCaCI) [32]. Bounds of confidence intervals were obtained from 104 bootstrap resamplings as described in the study by Lione et al. [33]. Average IGRs were compared among fungal species by fitting an unbiased recursive partitioning tree model based on conditional inference [34,35], whose algorithm was initialized as reported by Lione et al. [36].
2.4. Varietal Susceptibility Test
Potted 1-year-old healthy northern highbush blueberry plants were used. Seven ‘Blue Ribbon’, ‘Cargo’ and ‘Top Shelf’ plants and five ‘Last Call’ plants were considered for each selected fungal strain to conduct the inoculation trials. Each plant was inoculated on four branches with a single fungal strain. The inoculation point of each branch was surface disinfected with 70% ethanol solution. A piece of bark was cut with a sterile scalpel to expose the cambium. Mycelium-colonized agar plugs (4 mm diam.) were placed on the wound with the mycelium in contact with the cambium. Each inoculation point was wrapped with Parafilm® (American National Can, Chicago, IL, USA). The same number of plants per cv. and branches per plant was treated with sterile PDA-S discs as inoculation controls. The plants were placed in a growth chamber at 24 °C with 12 h light per day and monitored daily for external necrosis and dead branch development. Mortality of branches was assessed at two and four weeks post inoculation. After seven weeks, a destructive assessment was conducted. The Parafilm® was removed, and the external lesion length was measured. Moreover, the internal lesion length was recorded after bark removal. Small pieces (5 mm) of symptomatic tissue from the margins of the lesions were plated onto PDA to re-isolate the inoculated fungal species to fulfil Koch’s postulates. Pathogen identity was confirmed through morphology and DNA sequencing of partial regions of the β-tubulin (tub2) locus for N. parvum, D. rudis and P. scoparia and of the translation elongation factor-1α (tef1) locus for C. luteo-olivacea. Varietal susceptibility of blueberry cultivars to the pathogens was assessed by fitting three different unbiased recursive partitioning tree models [34,35,36]. Models differed for the selected response variable, namely the length of the external or internal necrosis measured for each inoculated plant (quantitative continuous variables, in mm) or the mortality scored at the end of the trial (binary categorical variable set to 1 or 0 for the living or dead plants, respectively). All models included three categorical input variables, with each one characterized by a different number of levels [37]. Input variables were as follows:
- Inoculation treatment (2 levels: “plants inoculated with isolates of the target fungal pathogens” and “control plants mock-inoculated with plugs of sterile PDA-S”);
- Blueberry cultivar (4 levels: ‘Blue Ribbon’, ‘Cargo’, ‘Last Call’ and ‘Top Shelf’);
- Target pathogen species (5 levels: “C. luteo-olivacea”, “D. rudis”, “N. parvum”, “P. scoparia” and “none” for control plants).
By applying the p-value criterion to the c-statistics with a significance threshold set to 5%, tree models were used to detect significant input variables and to define clusters of blueberry cultivars based on their susceptibility to the pathogens [38,39,40]. Hence, each terminal node of the tree model graphs included a cluster of blueberry cultivars equally susceptible to one, or more, of the inoculated fungal pathogens (p > 0.05). Conversely, different terminal nodes hosted clusters of cultivars displaying different levels of susceptibility (p < 0.05) to the above pathogens. The unique combination of input variable levels leading to any single terminal node of the tree model was obtained by (I) identifying the paths connecting the root, intermediate and terminal nodes of the graph, accounting for all significant splits (p < 0.05); (II) listing the categorical variable levels associated with the sequence of edges connecting nodes along the path; and (III) removing the redundant duplicates of the same level from the list [35,41]. For plants clustering within each terminal node, the average of external and internal necrosis was calculated, along with the corresponding 95%BCaCI. The ratio between dead plants and total number of plants (mortality rate, in %) was calculated with its associated 95% exact confidence interval (95%ECI) for terminal nodes of the mortality tree model. Upper and lower bounds of the confidence interval were derived as described by Blaker [42].
The fungus N. parvum was selected for the in planta temperature trial given its greatest growth rate in vitro and its highest pathogenicity in planta.
2.5. Modeling the Effect of Temperature on the Mycelial Growth Rate of Neofusicoccum parvum In Vitro
The mycelial growth rate of Neofusicoccum parvum was modeled as a function of temperature by fitting the generalized Analytis Beta Model to data obtained in vitro through the following equations [43]:
In Equation (1), Y is the radial growth rate of the fungal colonies (mm/day), Tmin and Tmax are the minimum and maximum growth temperatures set to conduct the experiment (i.e., 5 and 35 °C, respectively) and T is the temperature level (°C) of each replication of the trial (i.e., 5, 10, 15, 20, 25, 30 and 35 °C). In Equation (2), Topt is the optimum temperature, corresponding to the maximal mycelial growth rate of N. parvum in vitro. For both equations, a, b and d are unknown parameters. Equation (1) was fitted to data through nonlinear regression based on the Levenberg–Marquardt algorithm [44,45,46]. The algorithm was initialized by setting the starting values at a = 2, b = 2 and d = 2 using the data reported in the study by López-Moral et al. [43] as reference. The performance of the generalized Analytis Beta Model resulting from the algorithm convergence was assessed as described by Lione et al. [39] by fitting a linear regression model between the observed and predicted growth rate values (OP-regression) [47] and calculating the Theil’s UII coefficient [48].
2.6. In Planta Effect of Temperature on Colonization Rate and Branch Mortality of N. parvum
Based on the results obtained from the in vitro assay, temperatures of 18, 22, 26 and 30 °C were selected to assess the in planta effect of temperature on the colonization rate and branch mortality of N. parvum. Strain CVG444 of Neofusicoccum parvum was inoculated into potted 1-year-old healthy northern highbush blueberry plants of the cv. Duke. Inoculations were performed as described above on one branch of each of the thirty plants per temperature. Twenty plants per each temperature were mock-inoculated using sterile PDA-S discs. Plants were incubated in four different growth chambers and constantly monitored for symptoms and signs of development. After two weeks, a destructive assessment was conducted due to the high visual presence of symptoms. Parafilm® was removed, plants were carefully inspected for signs of the pathogen and external lesion lengths were measured. Internal lesion lengths were measured after bark removal. Branches’ mortality was recorded.
2.7. Modeling the Effect of Temperature on the Severity of Neofusicoccum parvum in Planta
To model the effects of temperature on the severity of N. parvum in planta, the data obtained from the inoculation trials were analyzed by using the same unbiased recursive partitioning tree models and response variables reported in the section describing the blueberry varietal susceptibility test. Categorical input variables were set as follows:
- Inoculation treatment (2 levels: “plants inoculated with the selected isolate of N. parvum” and “control plants mock-inoculated with plugs of sterile PDA-S”);
- Temperature (4 levels: “18 °C”, “22 °C”, “27 °C” and “30 °C”).
For each blueberry plant, the average increase in the necrosis severity (AINS, mm/day) was calculated as the ratio between the internal or external necrosis lengths at the end of the trial and the number of days since inoculation. AINS values were transformed into a series of binary variables by applying a threshold (X), with levels coded as 1 for AINS > X, as 0 for AINS ≤ X [49]. Thresholds were set based on increasing severity levels at X = 2, X = 5, X = 10, X = 15 and X = 20 mm/days. Hence, binary logistic regressions [49] were fitted to model the probability of observing AINS values larger than the above threshold as a function of increasing temperatures. The fulfillment of the models’ adequacy conditions was assessed as reported by Lione et al. [36] through a—the application of the Wald’s test to the β and β0 coefficients [49,50]; b—the comparison of the fitted model to the corresponding null-model M0, assessing the overall regression significance with the likelihood ratio test [49,50]; and, c—the comparison of the Akaike information criterion (AIC) and AIC weight (AICw) values between the non-null and the null models [51,52]. Mortality rates were calculated along with their 95%ECI values and analyzed as described by Garbelotto et al. [53] by using the Fisher’s Exact test to compare the blueberry plants inoculated with the selected isolate of N. parvum and the control plants at each temperature level. A binary logistic regression equation was fitted and assessed as previously described to model the probability of death of the inoculated plants as a function of temperature.
3. Results
3.1. Comparison of In Vitro Growth Rates of Cadophora luteo-olivacea, Diaporthe rudis, Neofusicoccum parvum and Peroneutypa scoparia
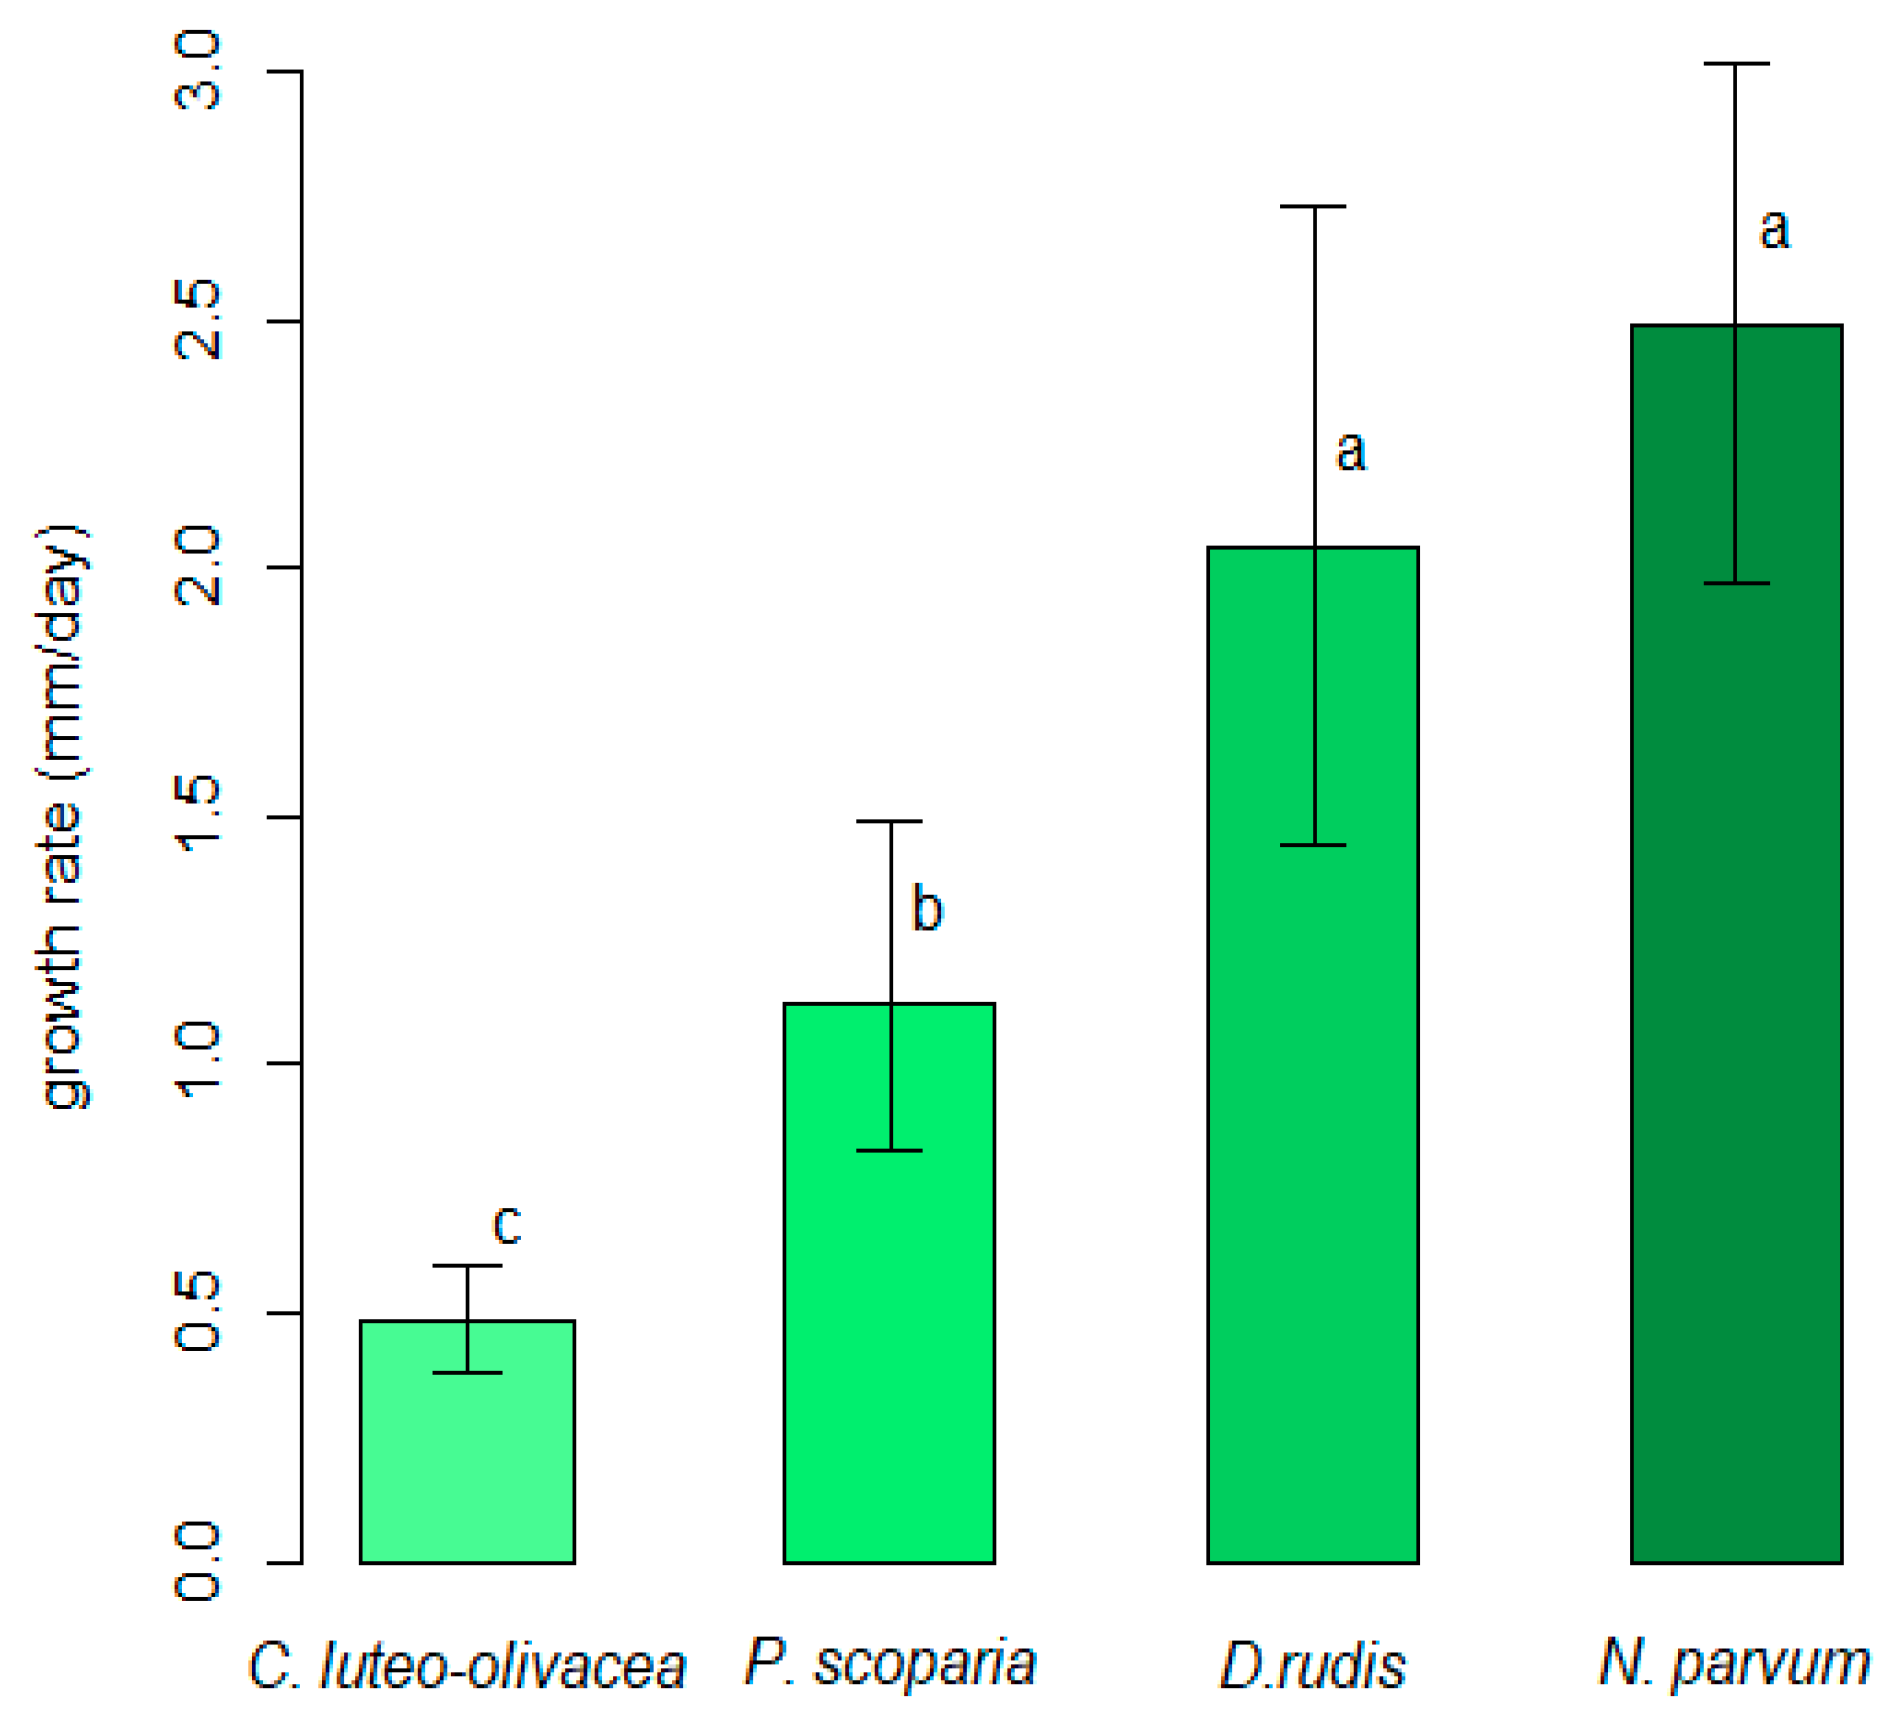
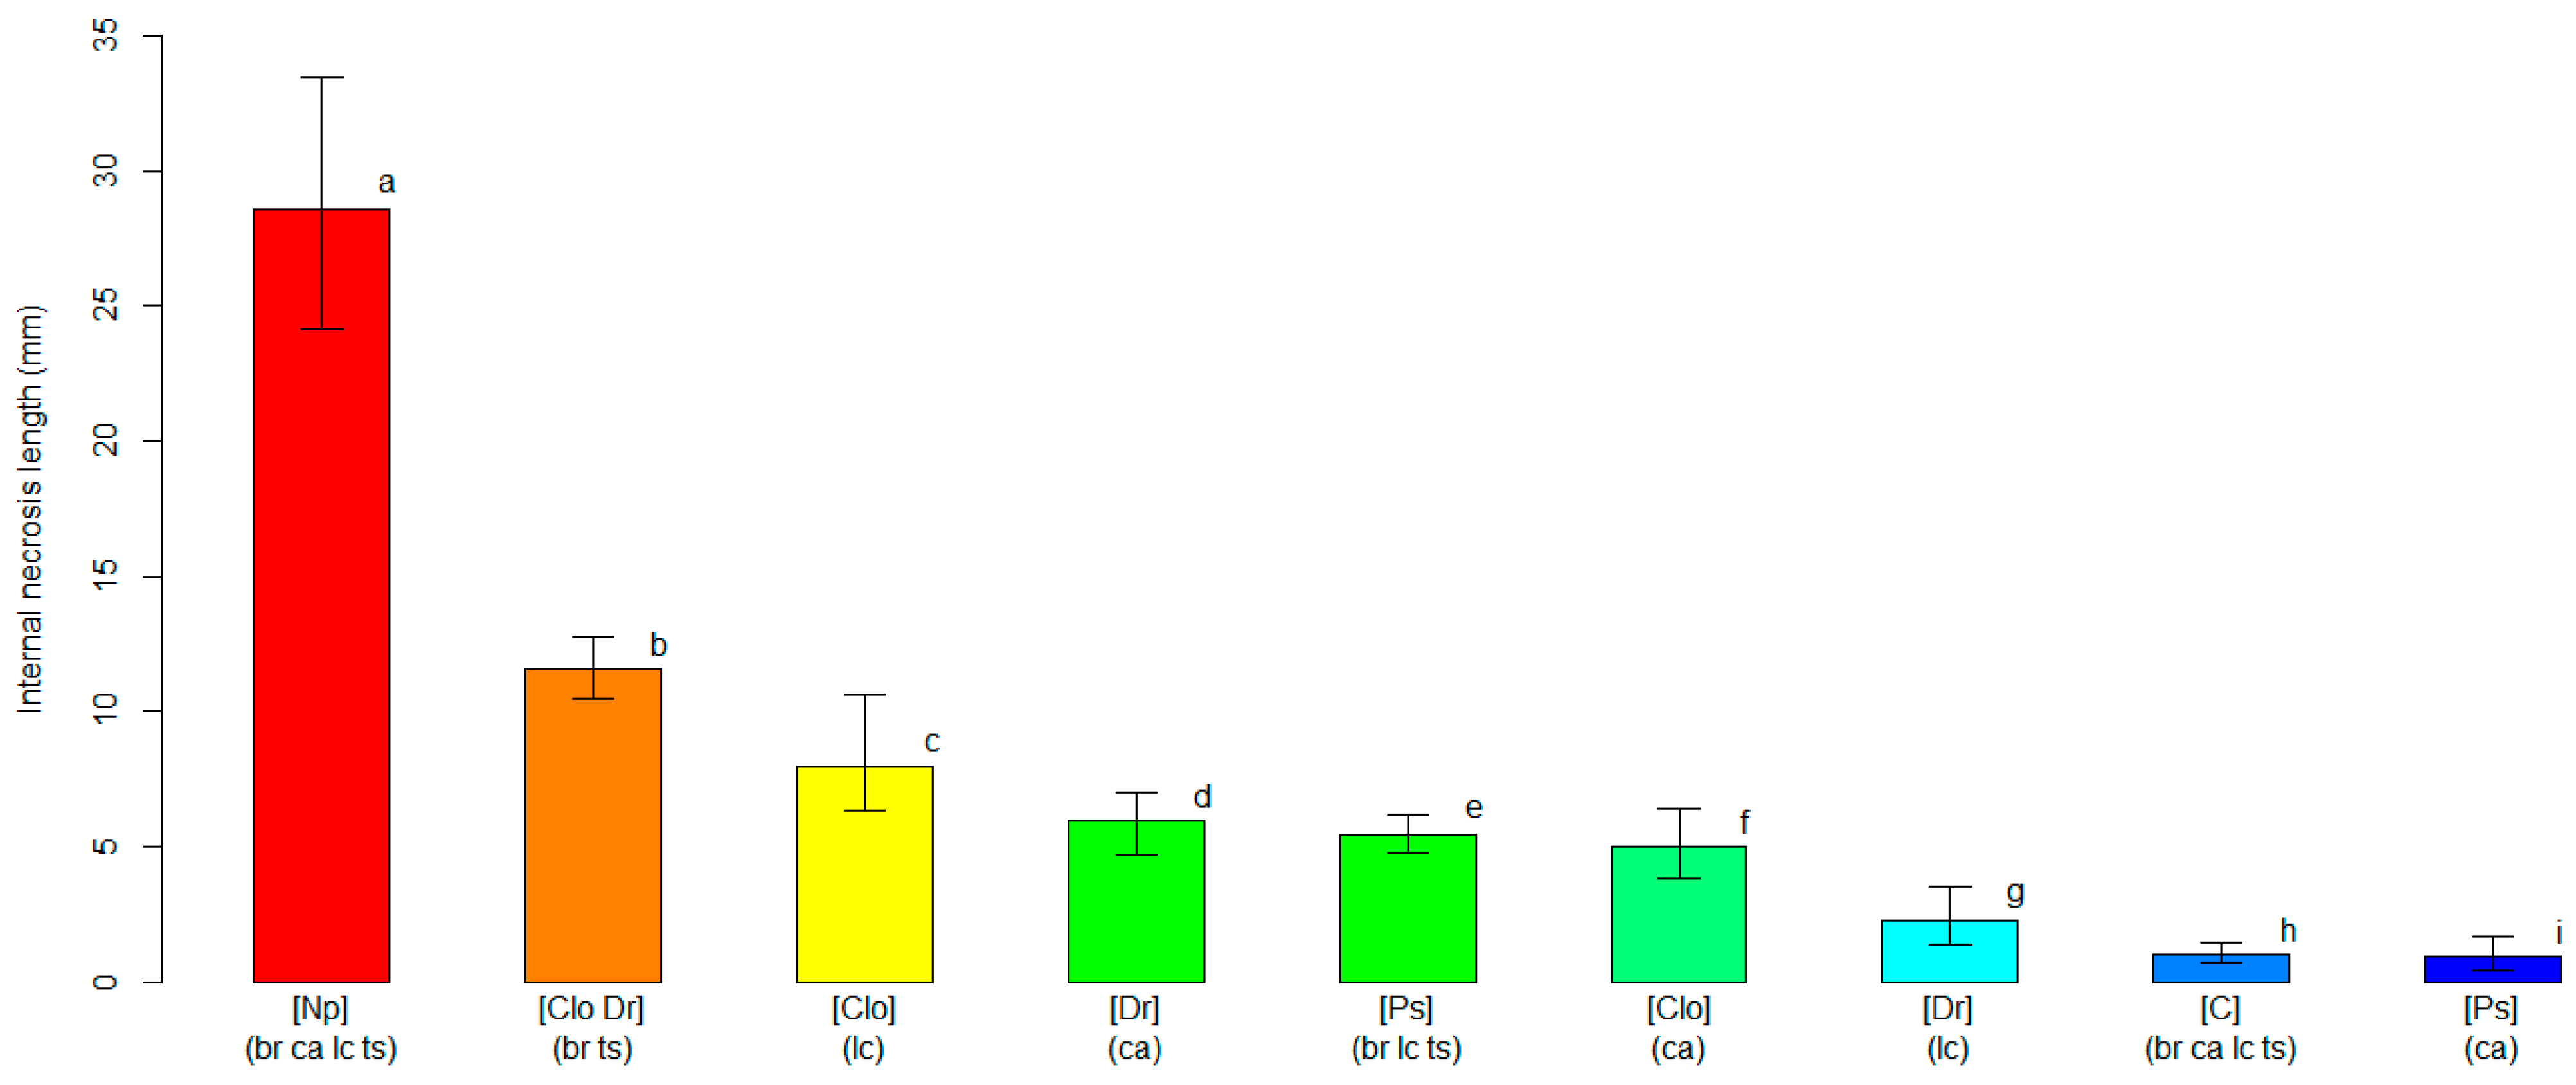
All of the strains were able to grow on PDA-S in the 10 to 30 °C range of temperatures. Weak mycelial growth was observed at 5 °C for the C. luteo-olivacea and D. rudis strains, while N. parvum and P. scoparia showed weak mycelial growth at 35 °C. The unbiased recursive partitioning tree model showed that N. parvum was the fungal species that displayed the highest average values regarding the in vitro growth rate (IGV = 2.49 mm/day, 1.97–3.01 95%BCaCI), followed by D. rudis (2.04 mm/day, 1.44–2.73 95%BCaCI), P. scoparia (1.12 mm/day, 0.83–1.49 95%BCaCI) and C. luteo-olivacea (0.49 mm/day, 0.38–0.59 95%BCaCI), respectively. The difference detected among the average IGRs were significant (p < 0.05) for all fungal species, except for that between N. parvum and D. rudis (Figure 1).
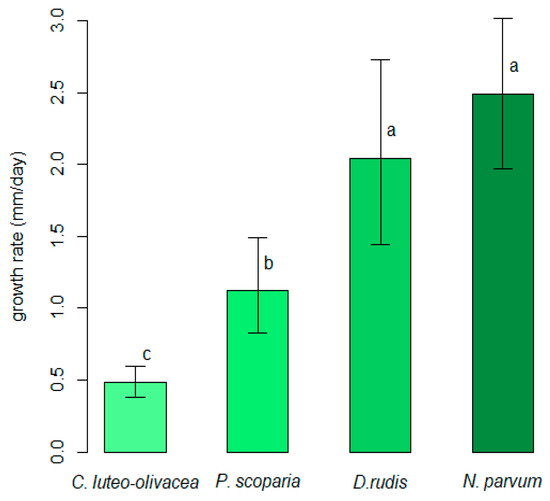
Figure 1.
Comparison of average in vitro growth rates among Cadophora luteo-olivacea, Diaporthe rudis, Neofusicoccum parvum and Peroneutypa scoparia. Different letters indicate that associated values are different (p < 0.05) based on outcomes of unbiased recursive partitioning tree model. Error whiskers refer to 95% bias-corrected and accelerated confidence interval bounds.
3.2. Varietal Susceptibility Test
The four pathogens caused different levels of disease severity when inoculated on the four cvs. of northern highbush blueberry. The analyses grouped pathogens and cultivars with similar interactions based on decreasing levels of the observed symptoms severity. The unbiased recursive partitioning tree model employing the length of the external necrosis as a response variable resulted in a graph leading to eight clusters (i.e., terminal nodes) derived from seven significant splits (p < 0.05) associated with all input variables (i.e., blueberry cultivar, inoculation treatment and fungal species) (Figure S1). The susceptibility levels based on the external necrosis length were variable, depending on the combination of fungal species inoculated and on the host blueberry cultivar. The cluster displaying the highest severity level (p < 0.05) grouped all blueberry plants inoculated with N. parvum, regardless of the cultivar. The average length of the external necrosis caused by N. parvum was 25.17 mm (21.45–30.22 95%BCaCI), while the other clusters, including other fungi, had an average external necrosis below 8.20 mm (7.40–8.85 95%BCa CI). All fungal pathogens inoculated in blueberry plants induced necroses greater (p < 0.05) than those in the mock-inoculated plants, with the exception of D. rudis on ‘Last Call’ (Figure 2).
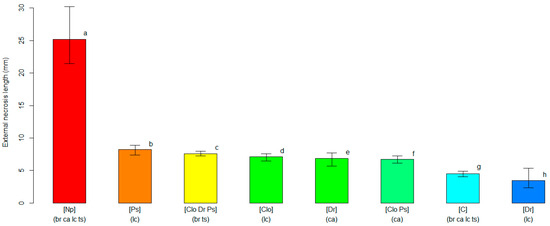
Figure 2.
A comparison of the average length of the external necrosis (in mm, on the y-axis) among clusters of blueberry plants identified by the unbiased recursive partitioning tree model. Each bar represents a cluster of blueberry cultivars (listed within round brackets) that are equally susceptible (p > 0.05) to one or more of the inoculated fungal pathogens [listed within squared brackets]. The cultivar acronyms are defined as follows: br, ‘Blue Ribbon’; ca, ‘Cargo’; lc, ‘Last Call’ and ts, ‘Top Shelf’. The pathogens’ acronyms are Clo, Cadophora luteo-olivacea; Dr, Diaporthe rudis; Np, Neofusicoccum parvum and Ps, Peroneutypa scoparia. The acronym C represents control plants that were mock-inoculated with plugs of sterile agar medium. Different letters indicate that the associated cluster bars display significantly different average values of the external necrosis length (p < 0.05). The error whiskers refer to the 95% bias-corrected and accelerated confidence interval bounds.
Similar results were obtained from the unbiased recursive partitioning tree model employing the length of the internal necrosis as a response variable (Figure S2). The tree model graph showed nine significant clusters (p < 0.05), and the highest severity score (p < 0.05) was found for plants inoculated with N. parvum, with an average length of the internal necrosis equaling 28.61 mm (24.11–33.45 95%BCaCI). As previously observed for the analysis of the external necrosis, all plants of the four blueberry cultivars inoculated with N. parvum were grouped within the same cluster, displaying comparable levels of susceptibility to the pathogen (p > 0.05). Internal necroses by the other pathogens were variable, and the average values ranged between 0.96 mm (0.43–1.68 95%BCaCI) for ‘Cargo’ plants inoculated with P. scoparia and 11.58 mm (10.50–12.78 95%BCaCI) for the cluster grouping ‘Blue Ribbon’ and ‘Top Shelf’ plants inoculated with C. luteo-olivacea and D. rudis. Hence, C. luteo-olivacea, D. rudis and P. scoparia induced internal necrosis with average lengths that were 2.5- to 30-fold lower than those caused by N. parvum (Figure 3). All average internal necrosis lengths were significantly larger (p < 0.05) on blueberry plants inoculated with the pathogens than on the mock-inoculated controls, with the exception of the ‘Cargo’ plants inoculated with P. scoparia.
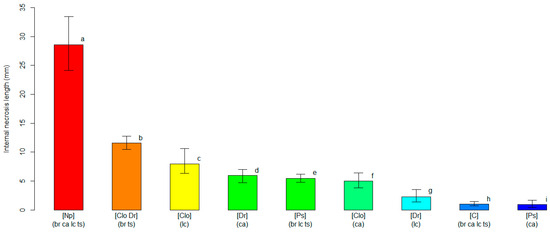
Figure 3.
A comparison of the average length of the internal necrosis (in mm, on the y-axis) among clusters of blueberry plants identified by the unbiased recursive partitioning tree model. Each bar represents a cluster of blueberry cultivars (listed within round brackets) that are equally susceptible (p > 0.05) to one or more of the inoculated fungal pathogens [listed within squared brackets]. The cultivar acronyms are defined as follows: br, ‘Blue Ribbon’; ca, ‘Cargo’; lc, ‘Last Call’ and ts, ‘Top Shelf’. The pathogens’ acronyms are Clo, Cadophora luteo-olivacea; Dr, Diaporthe rudis; Np, Neofusicoccum parvum and Ps, Peroneutypa scoparia. The acronym C represents control plants that were mock-inoculated with plugs of sterile agar medium. Different letters indicate that the associated cluster bars display significantly different average values of the internal necrosis length (p < 0.05). The error whiskers refer to the 95% bias-corrected and accelerated confidence interval bounds.
The unbiased recursive partitioning tree model analyzing mortality rates showed that only the inoculation treatment and inoculated fungal species were significant explanatory variables (p < 0.05), while the blueberry cultivar did not have any significant effect on plant mortality (p > 0.05) (Figure S3). Regardless of the cultivar, blueberry plants inoculated with N. parvum reached an average mortality rate of 82.7% (74.2–89.3 95%ECI), while the control plants and plants inoculated with the other pathogens attained a lower value (p < 0.05) of 4.0% (2.3–6.2 95%ECI) (Figure 4). All of the inoculated fungi were re-isolated from the plants on which they had been inoculated, and their identities were confirmed through morphology and molecular features, thus fulfilling Koch’s postulates.
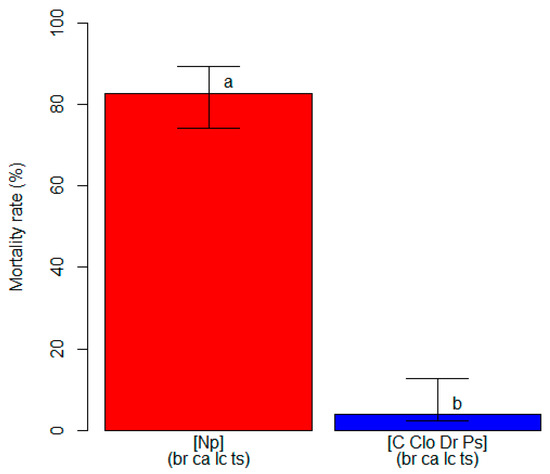
Figure 4.
A comparison of the mortality rate (in %, on the y-axis) among clusters of blueberry plants identified by the unbiased recursive partitioning tree model. Each bar represents a cluster of blueberry cultivars (listed within round brackets) that are equally susceptible (p > 0.05) to one or more of the inoculated fungal pathogens [listed within squared brackets]. The cultivar acronyms are defined as follows: br, ‘Blue Ribbon’; ca, ‘Cargo’; lc, ‘Last Call’ and ts, ‘Top Shelf’. The pathogens acronyms are Clo, Cadophora luteo-olivacea; Dr, Diaporthe rudis; Np, Neofusicoccum parvum and Ps, Peroneutypa scoparia. The acronym C represents control plants that were mock-inoculated with plugs of sterile agar medium. Different letters indicate that the associated cluster bars display significantly different mortality rate values (p < 0.05). The error whiskers refer to the 95% exact confidence interval bounds.
3.3. Modeling the Effect of Temperature on the Mycelial Growth Rate of Neofusicoccum parvum In Vitro
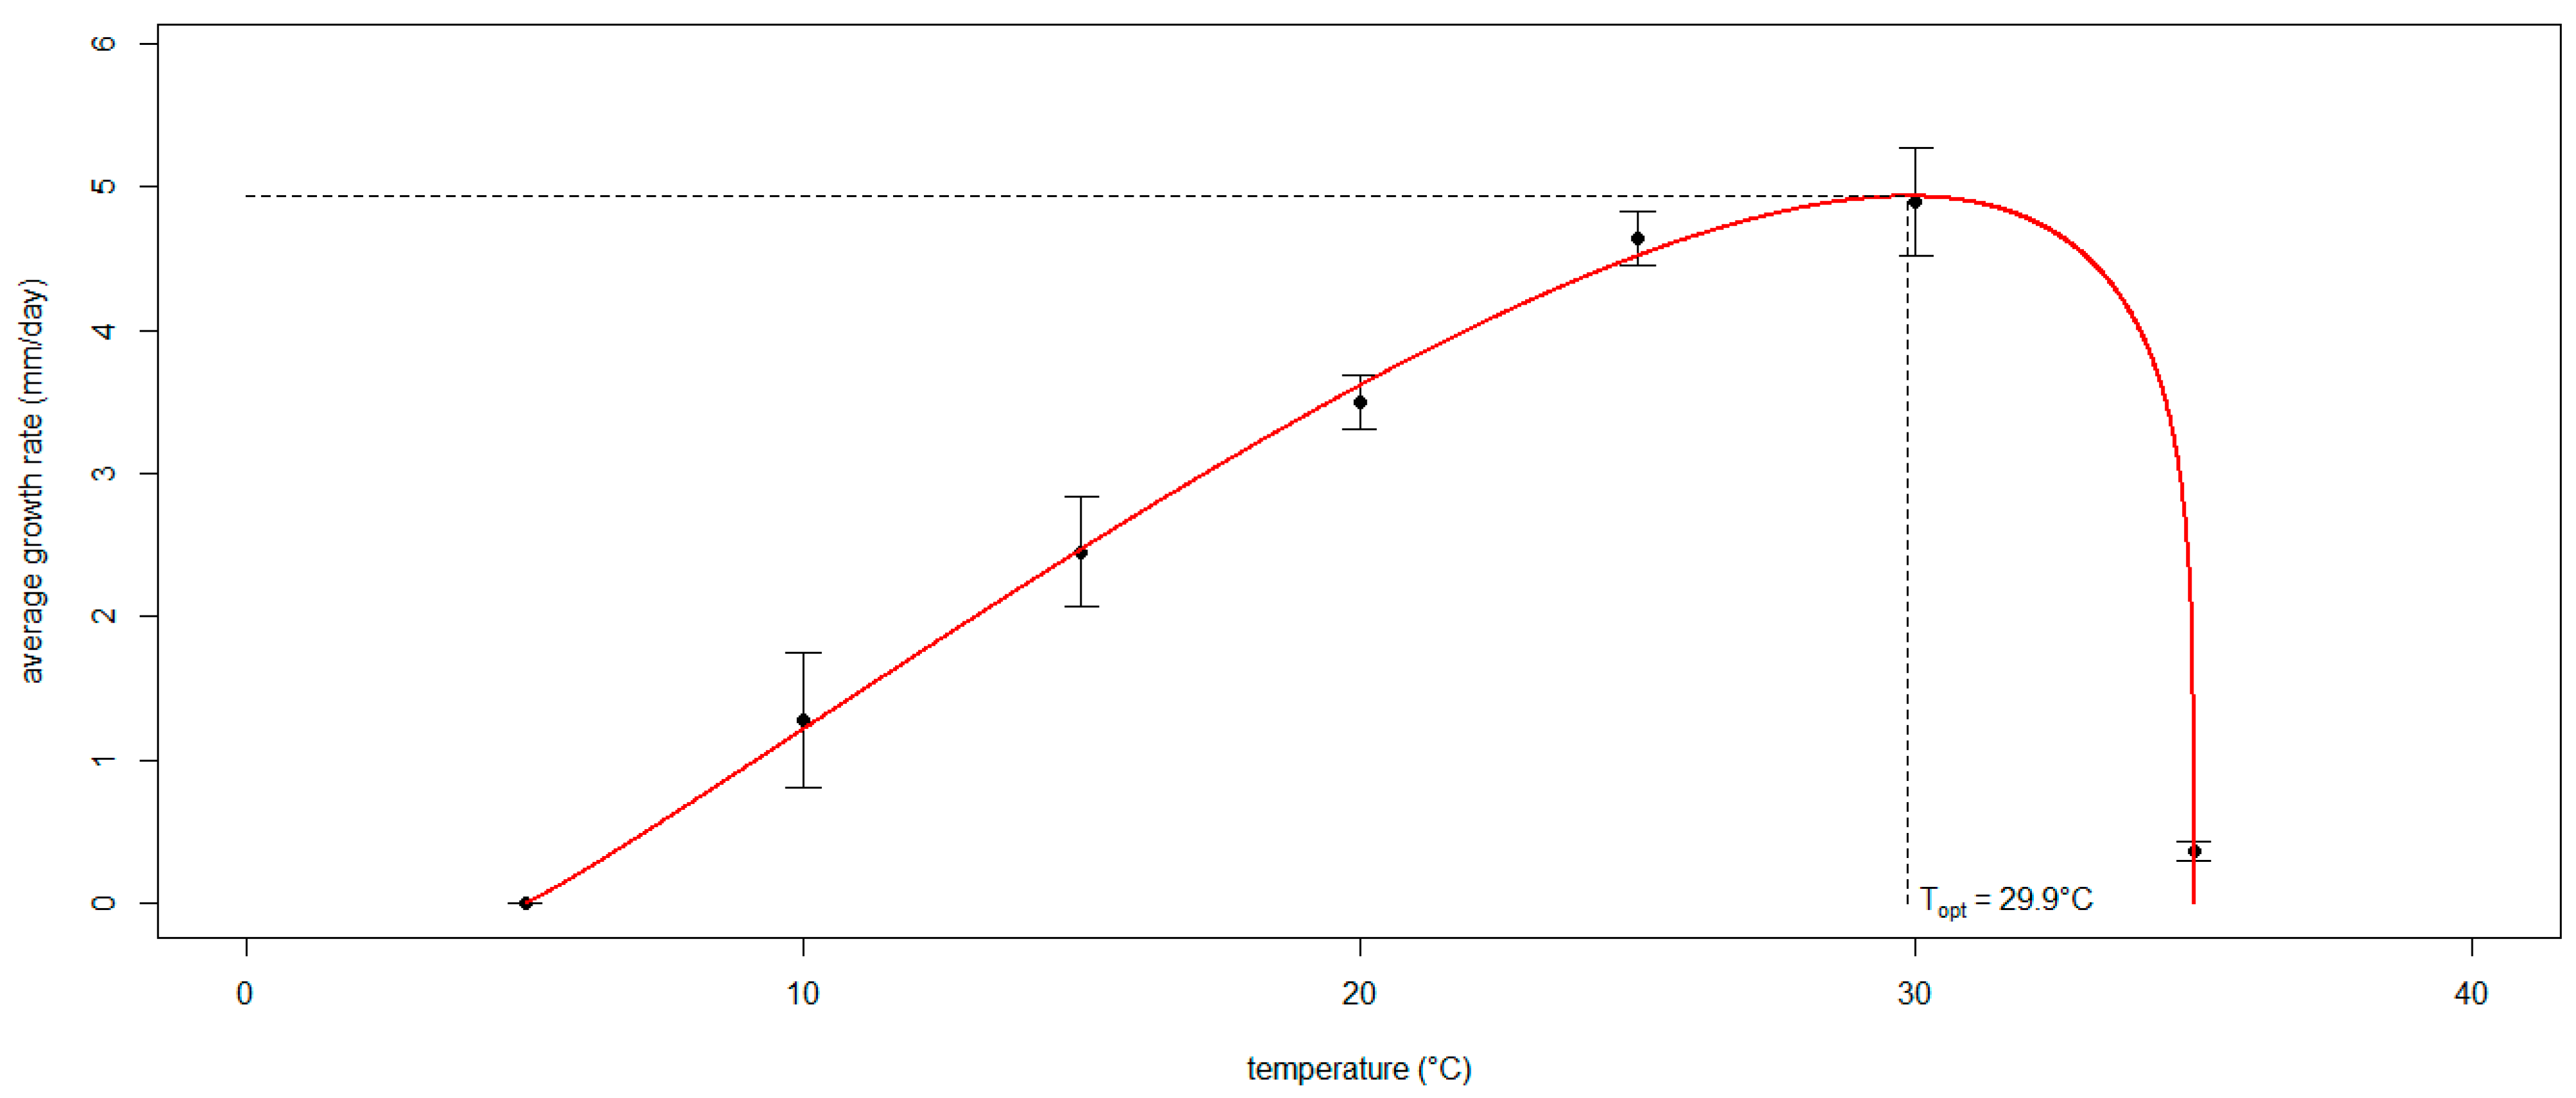
The algorithm run to define the three coefficients of the generalized Analytis Beta Model expressing the mycelial growth rate of Neofusicoccum parvum as a function of temperature converged on values that are significantly different from 0 (p < 0.05): a = 1.096, b = 0.226 and d = 0.100 (Figure 5). The resulting optimal temperature was 29.9 °C, corresponding to a maximum radial growth rate of approximately 5 mm/day. The model performance was scored as adequate since the OP regression slope (m = 0.967) and intercept (q = 0.129) were not significantly different from 1 and 0, respectively (p > 0.05); R2 = 0.974 was close to 1, and Theil’s coefficient (UII = 0.0997) was close to 0.
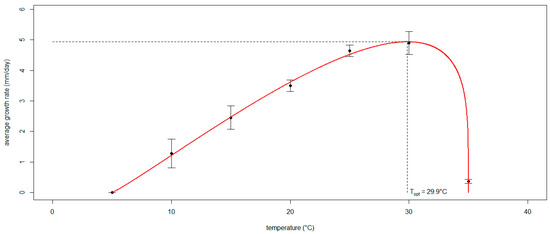
Figure 5.
The curve of the generalized Analytis Beta Model expressing the mycelial growth rate of Neofusicoccum parvum as a function of temperature. The black dots interpolated by the curve (in red) show the average radial growth rate displayed by the isolates grown in vitro at different temperatures. The whiskers indicate the standard deviation. The dashed lines mark the optimal temperature with the corresponding peak of the radial growth rate.
3.4. Modeling the Effect of Temperature on the Severity of Neofusicoccum parvum in Planta
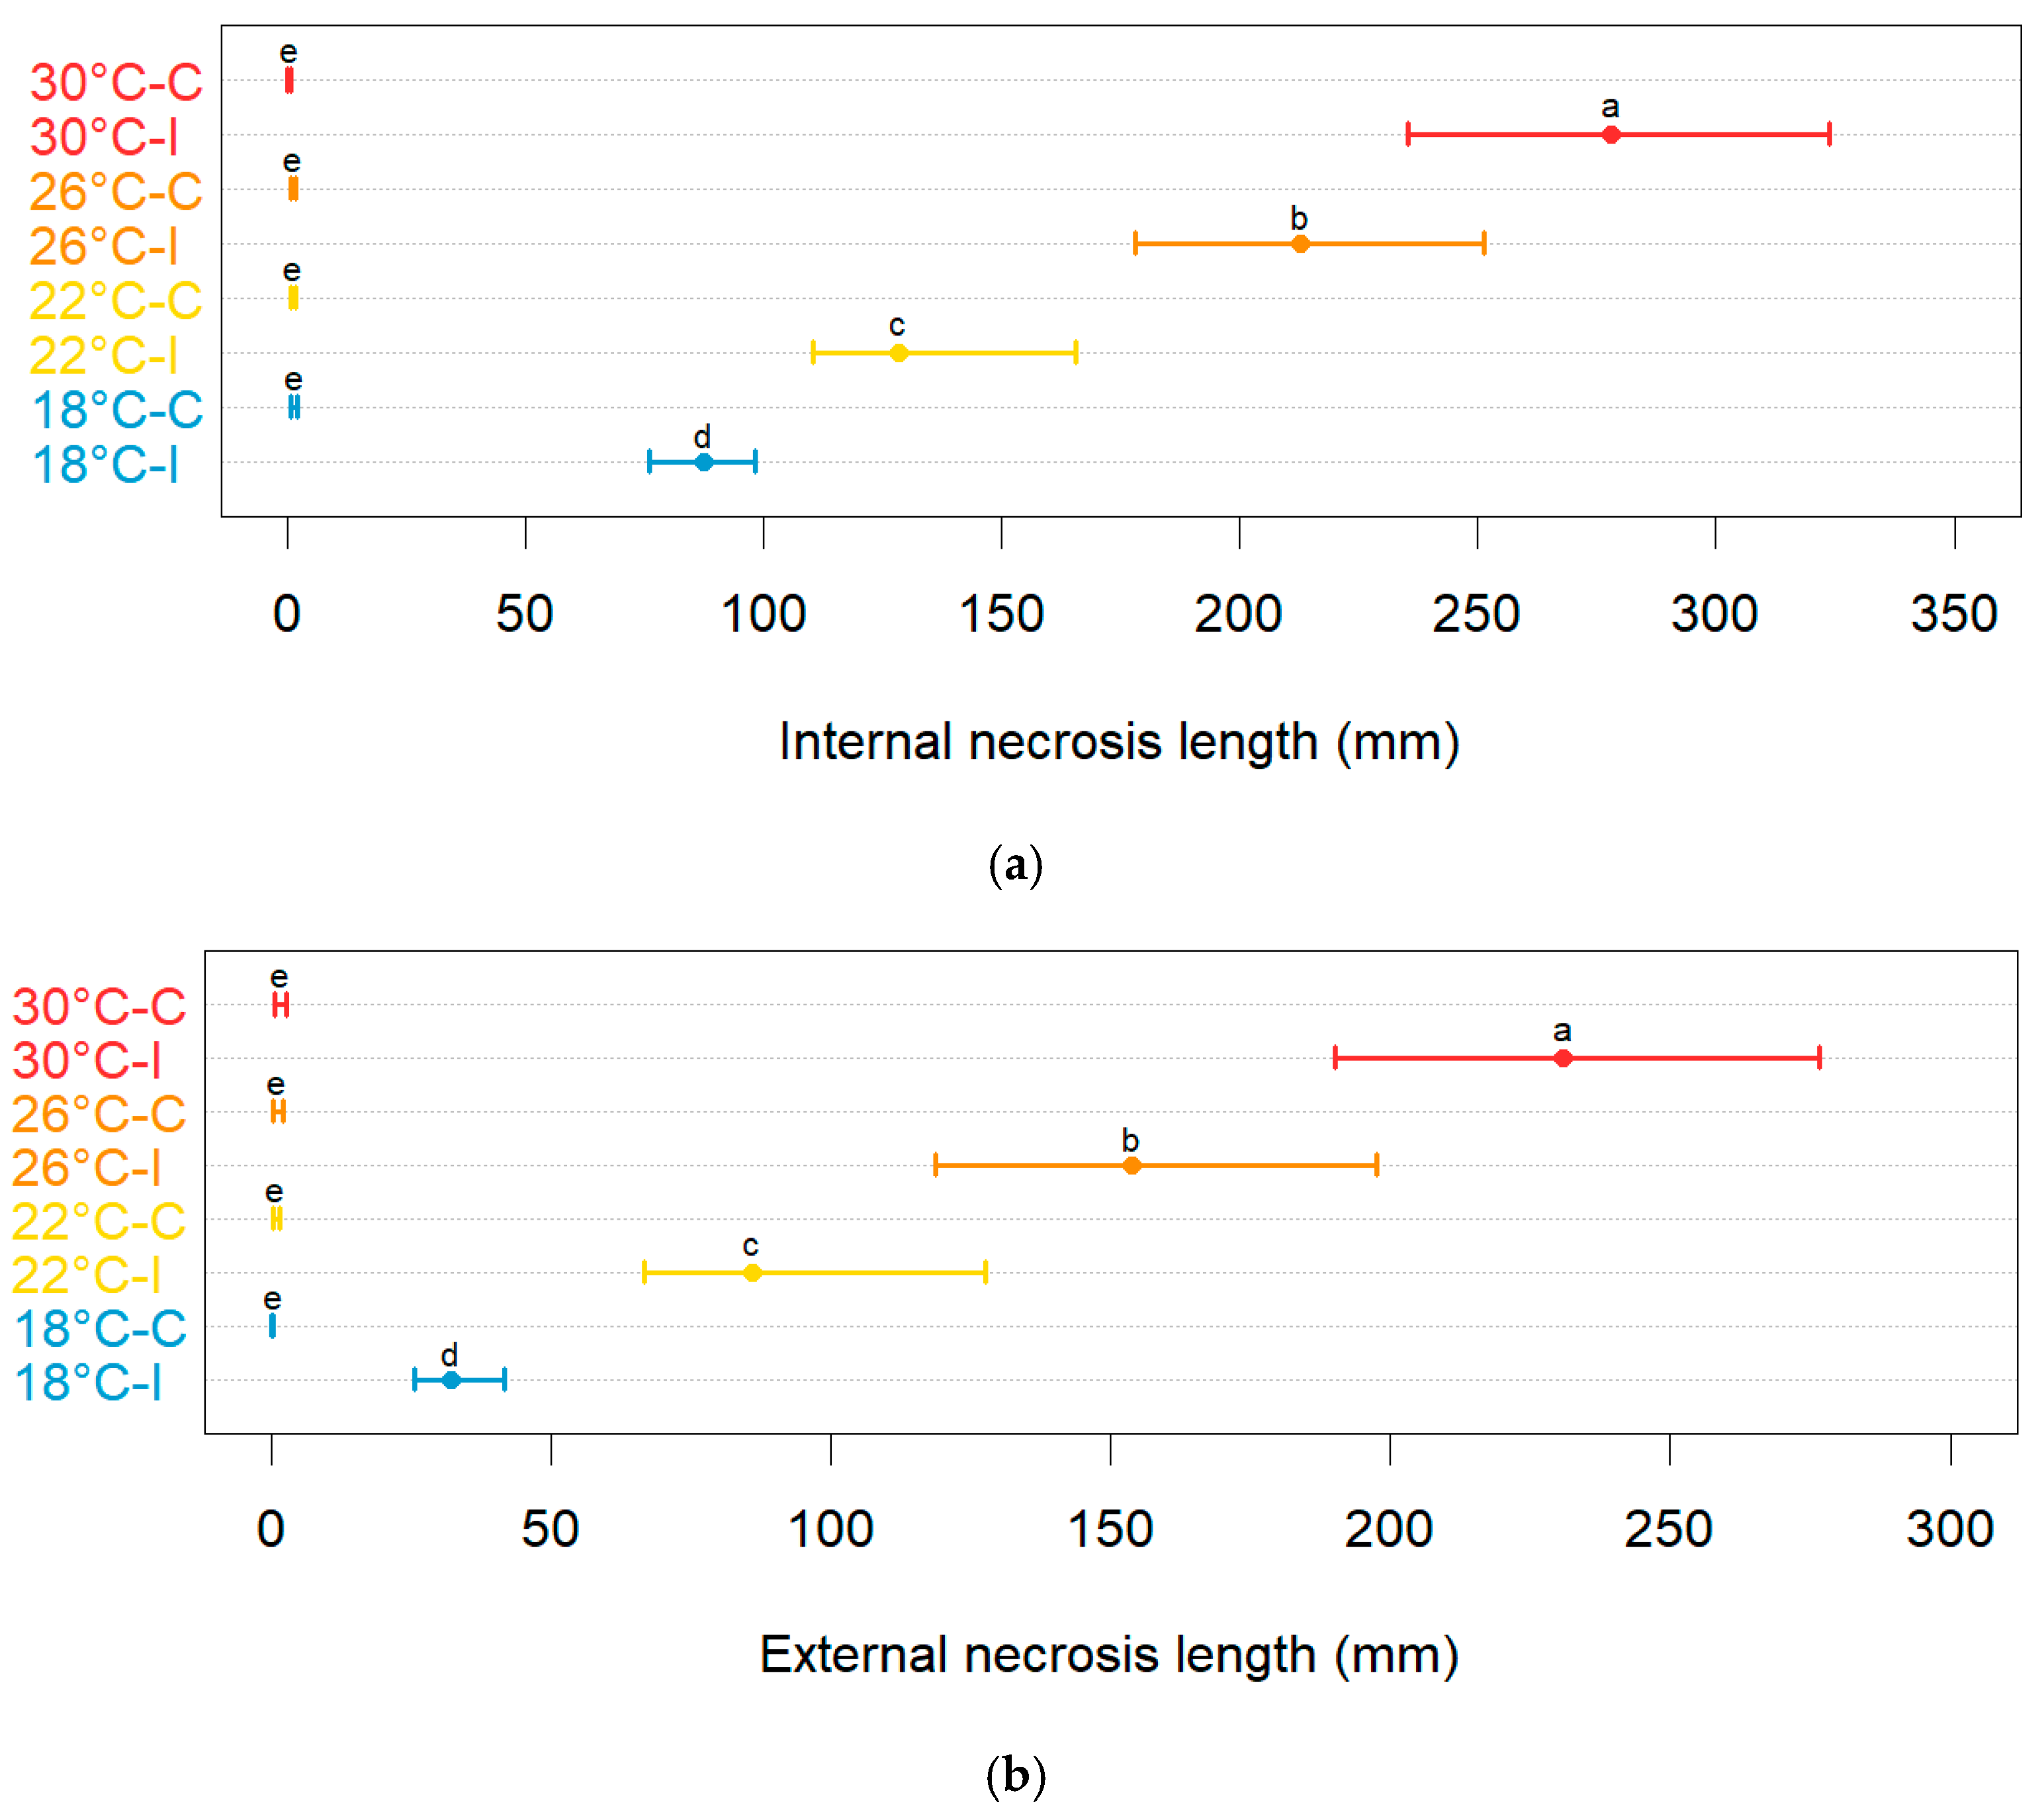
Neofusicoccum parvum induced different levels of disease severity on the inoculated plants depending on the temperature. The unbiased recursive partitioning tree models showed that both internal (Figure S4) and external (Figure S5) necrosis induced by N. parvum on plants of blueberry displayed average lengths that were larger (p < 0.05) than those of the control plants that were mock-inoculated with plugs of sterile agar medium (Figure 6). The above difference remained significant (p < 0.05) at all temperatures employed in this study. The average lengths of necrosis among the control plants were not significantly different (p > 0.05) regardless of the temperature and type of necrosis considered. The average lesion lengths in the controls ranged between 0.40 mm (0.10–0.80 95%BCaCI) and 1.30 mm (0.70–2.20 95%BCaCI) for internal necrosis and between 0.20 mm (0.00–0.30 95%BCaCI) and 1.60 mm (0.60–2.70 95%BCaCI) for the external one.
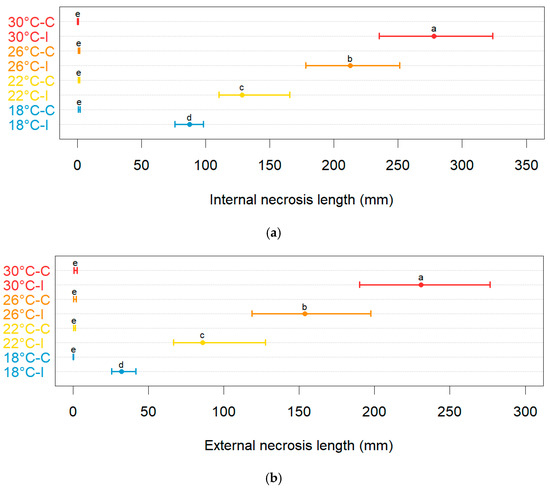
Figure 6.
Comparisons of the average lengths of internal (a) and external (b) necrosis (in mm, on the x-axis) among the blueberry plants inoculated with Neofusicoccum parvum (I) and the control plants (C) that were mock-inoculated with plugs of sterile agar medium at different temperature levels (in °C, on the y-axis). Different letters in the dot chart indicate that the associated averages are significantly different (p < 0.05). The error whiskers refer to the 95% bias-corrected and accelerated confidence interval bounds.
Conversely, on average, both the internal and external necrosis lengths increased (p < 0.05) with the increasing temperature levels. For instance, the inoculations of N. parvum conducted at 30 °C led to an average internal necrosis length of 278.00 mm (235.30–323.80 95%BCaCI), which is higher (p < 0.05) than that found in blueberry plants inoculated at 18 °C (87.60 mm, 76.00–98.1095%BCaCI). Similarly, while at 18 °C, the average external necrosis length was 32.00 mm (25.50–41.50 95%BCaCI), the blueberry plants inoculated at 30 °C developed an external lesion with an average length of 230.70 mm (190.00–276.70 95%BCaCI).
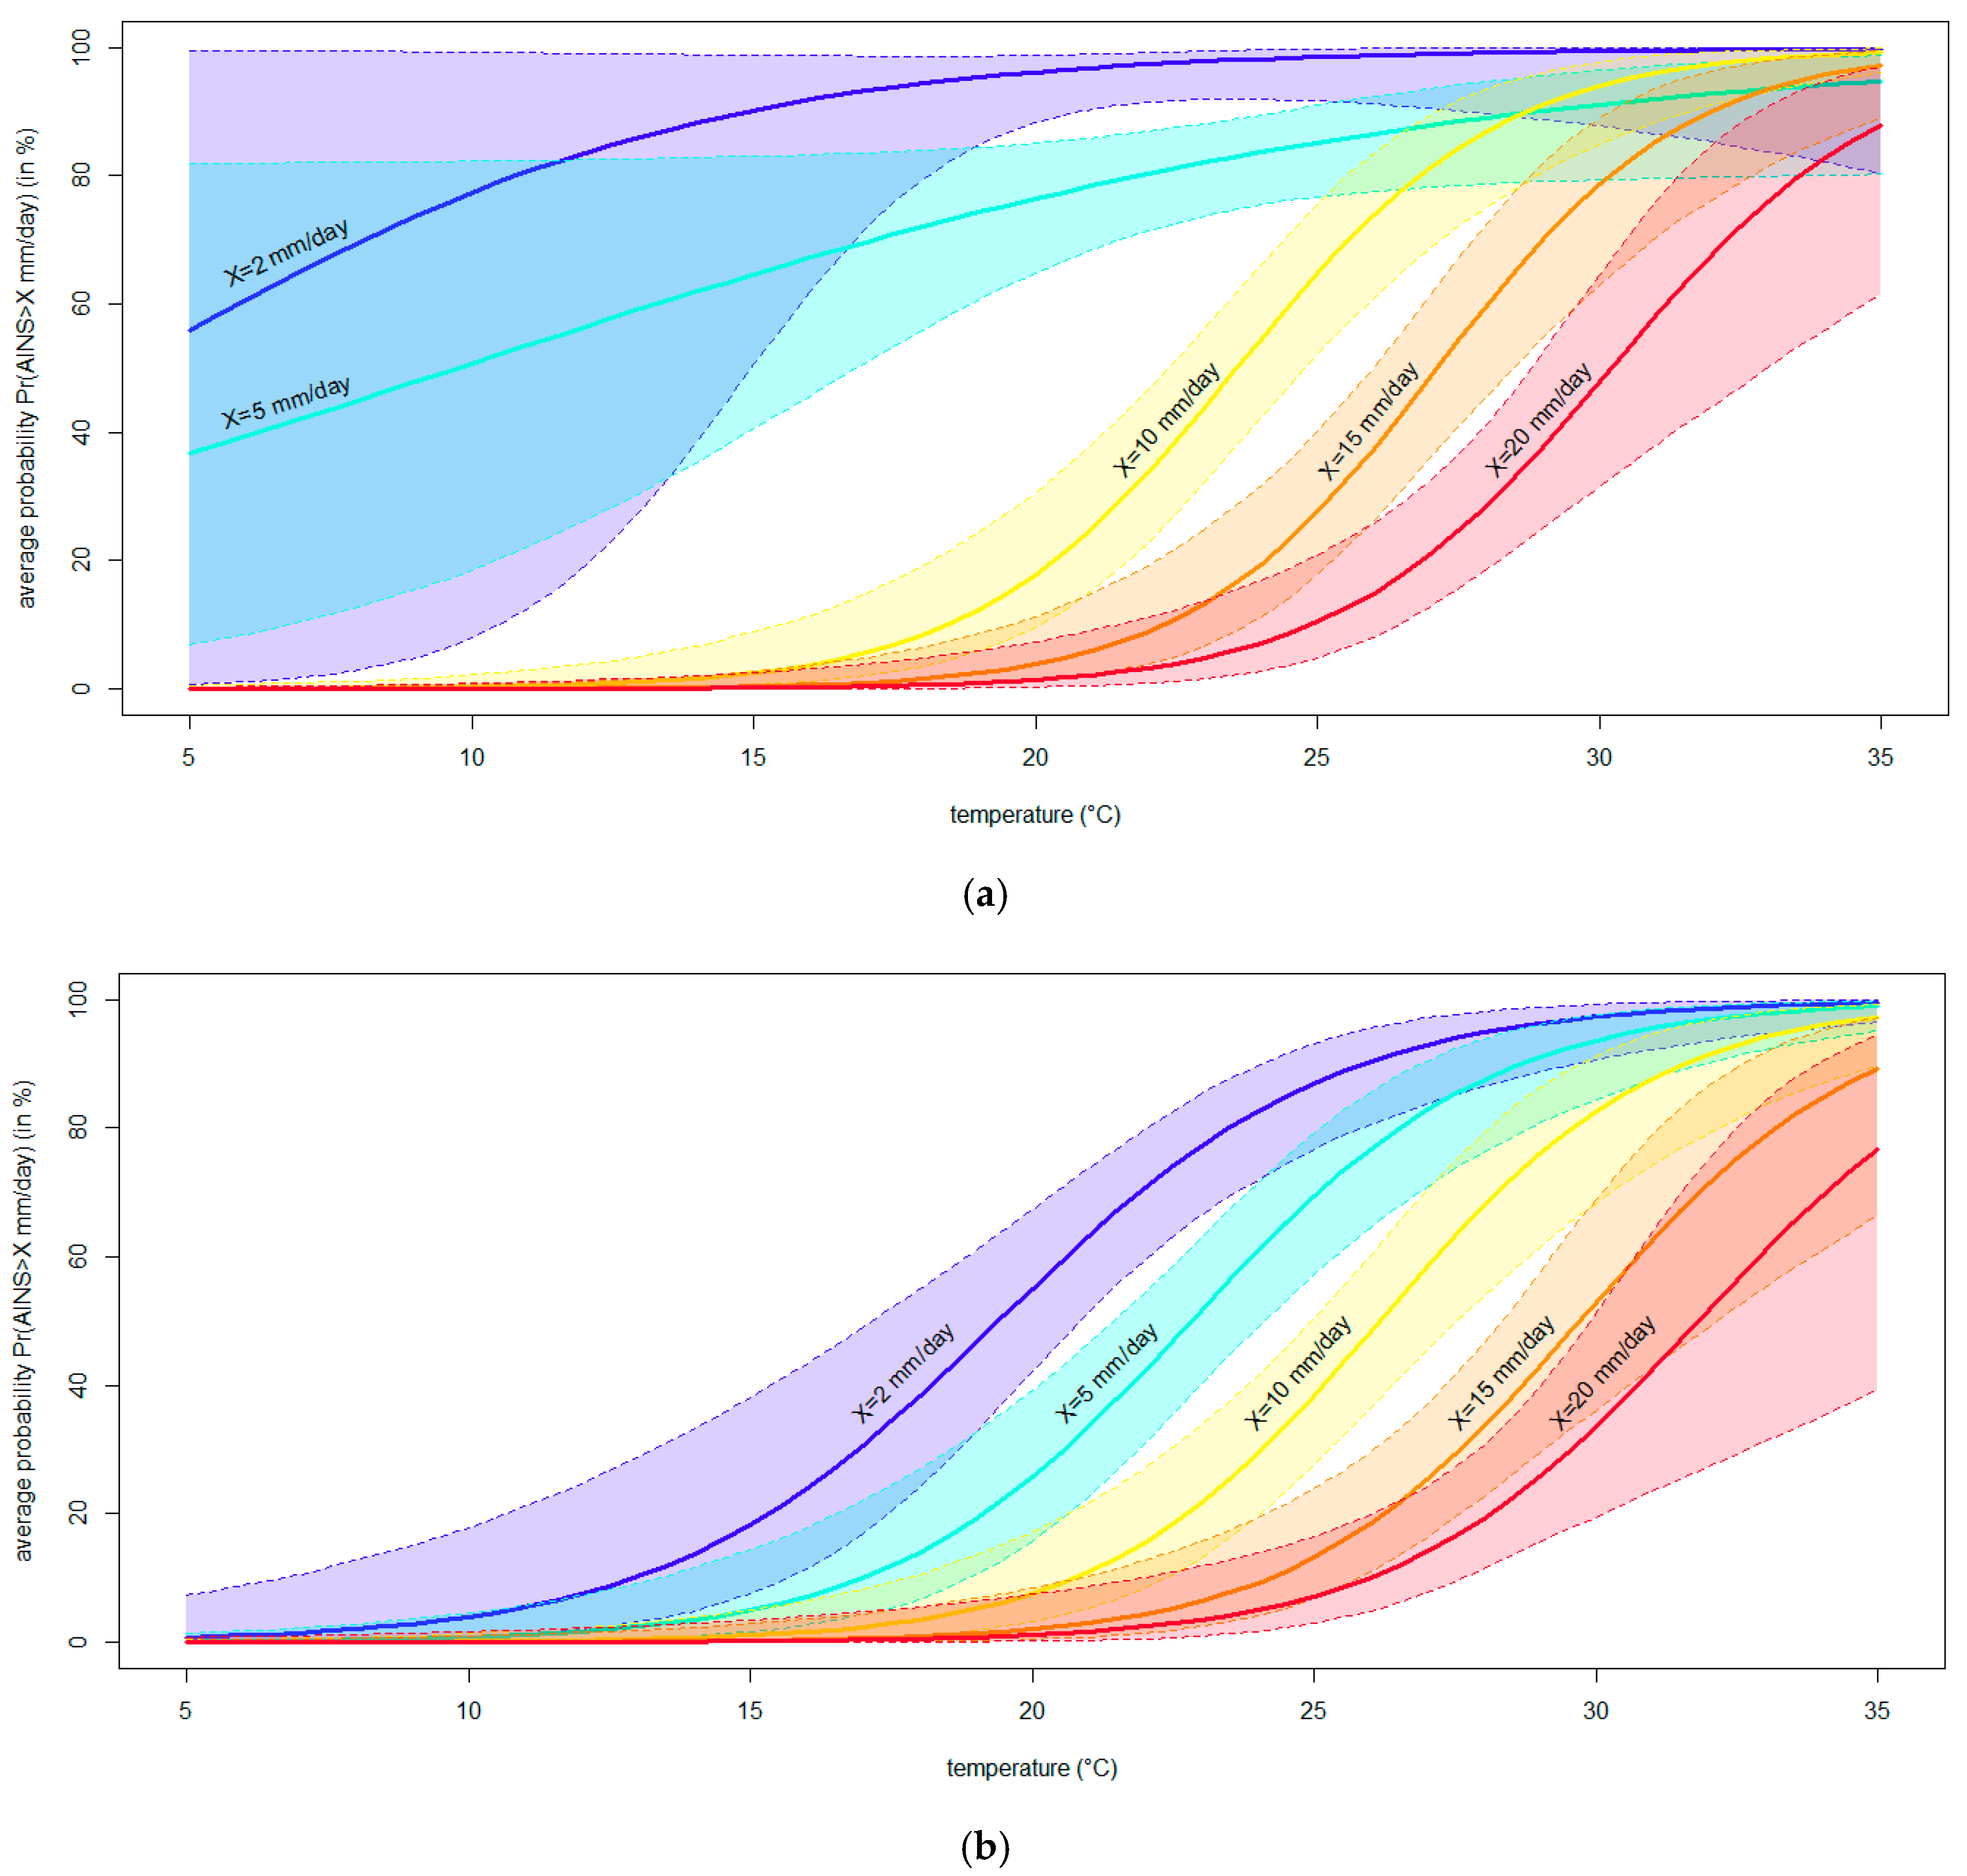
Consistent results were obtained from the binary logistic regressions modeling the average increase in the necrosis severity (AINS). In brief, the logistic curves showed that the necrosis caused by N. parvum grew significantly faster with warming temperatures (p < 0.05) (Figure 7). In fact, rising temperatures led to a higher frequency of symptoms of a given severity level, as evidenced by the ascending trend of each logistic curve. Moreover, increasing temperatures caused more severe symptoms, as evidenced by the left-to-right shift in the curves associated with augmented threshold levels (i.e., shifting from blue to red in Figure 7). Technically, all logistic equations, except one, displayed a—a significant and positive β coefficient for temperature (p < 0.05); b—a significant overall likelihood ratio test (p < 0.05); and c—lower AIC and higher AICW values than each associated null model, thus fulfilling the whole set of adequacy conditions. Details on regressions modeling the AINS calculated on the internal and external necrosis lengths are reported in Tables S1 and S2, respectively.

Figure 7.
The binary logistic regression curves modeling the probability (Pr, in %) of observing an average increase in the necrosis severity (AINS, mm/day) larger than a given threshold X (set to 2, 5, 10, 15 and X = 20 mm/days) at different temperatures (°C). Curves resulting from the models fitted to AINS calculated from internal (a) or external (b) necrosis lengths are shown. The region between the contours above and below the curves delimits the 95% confidence interval of the modeled probability.
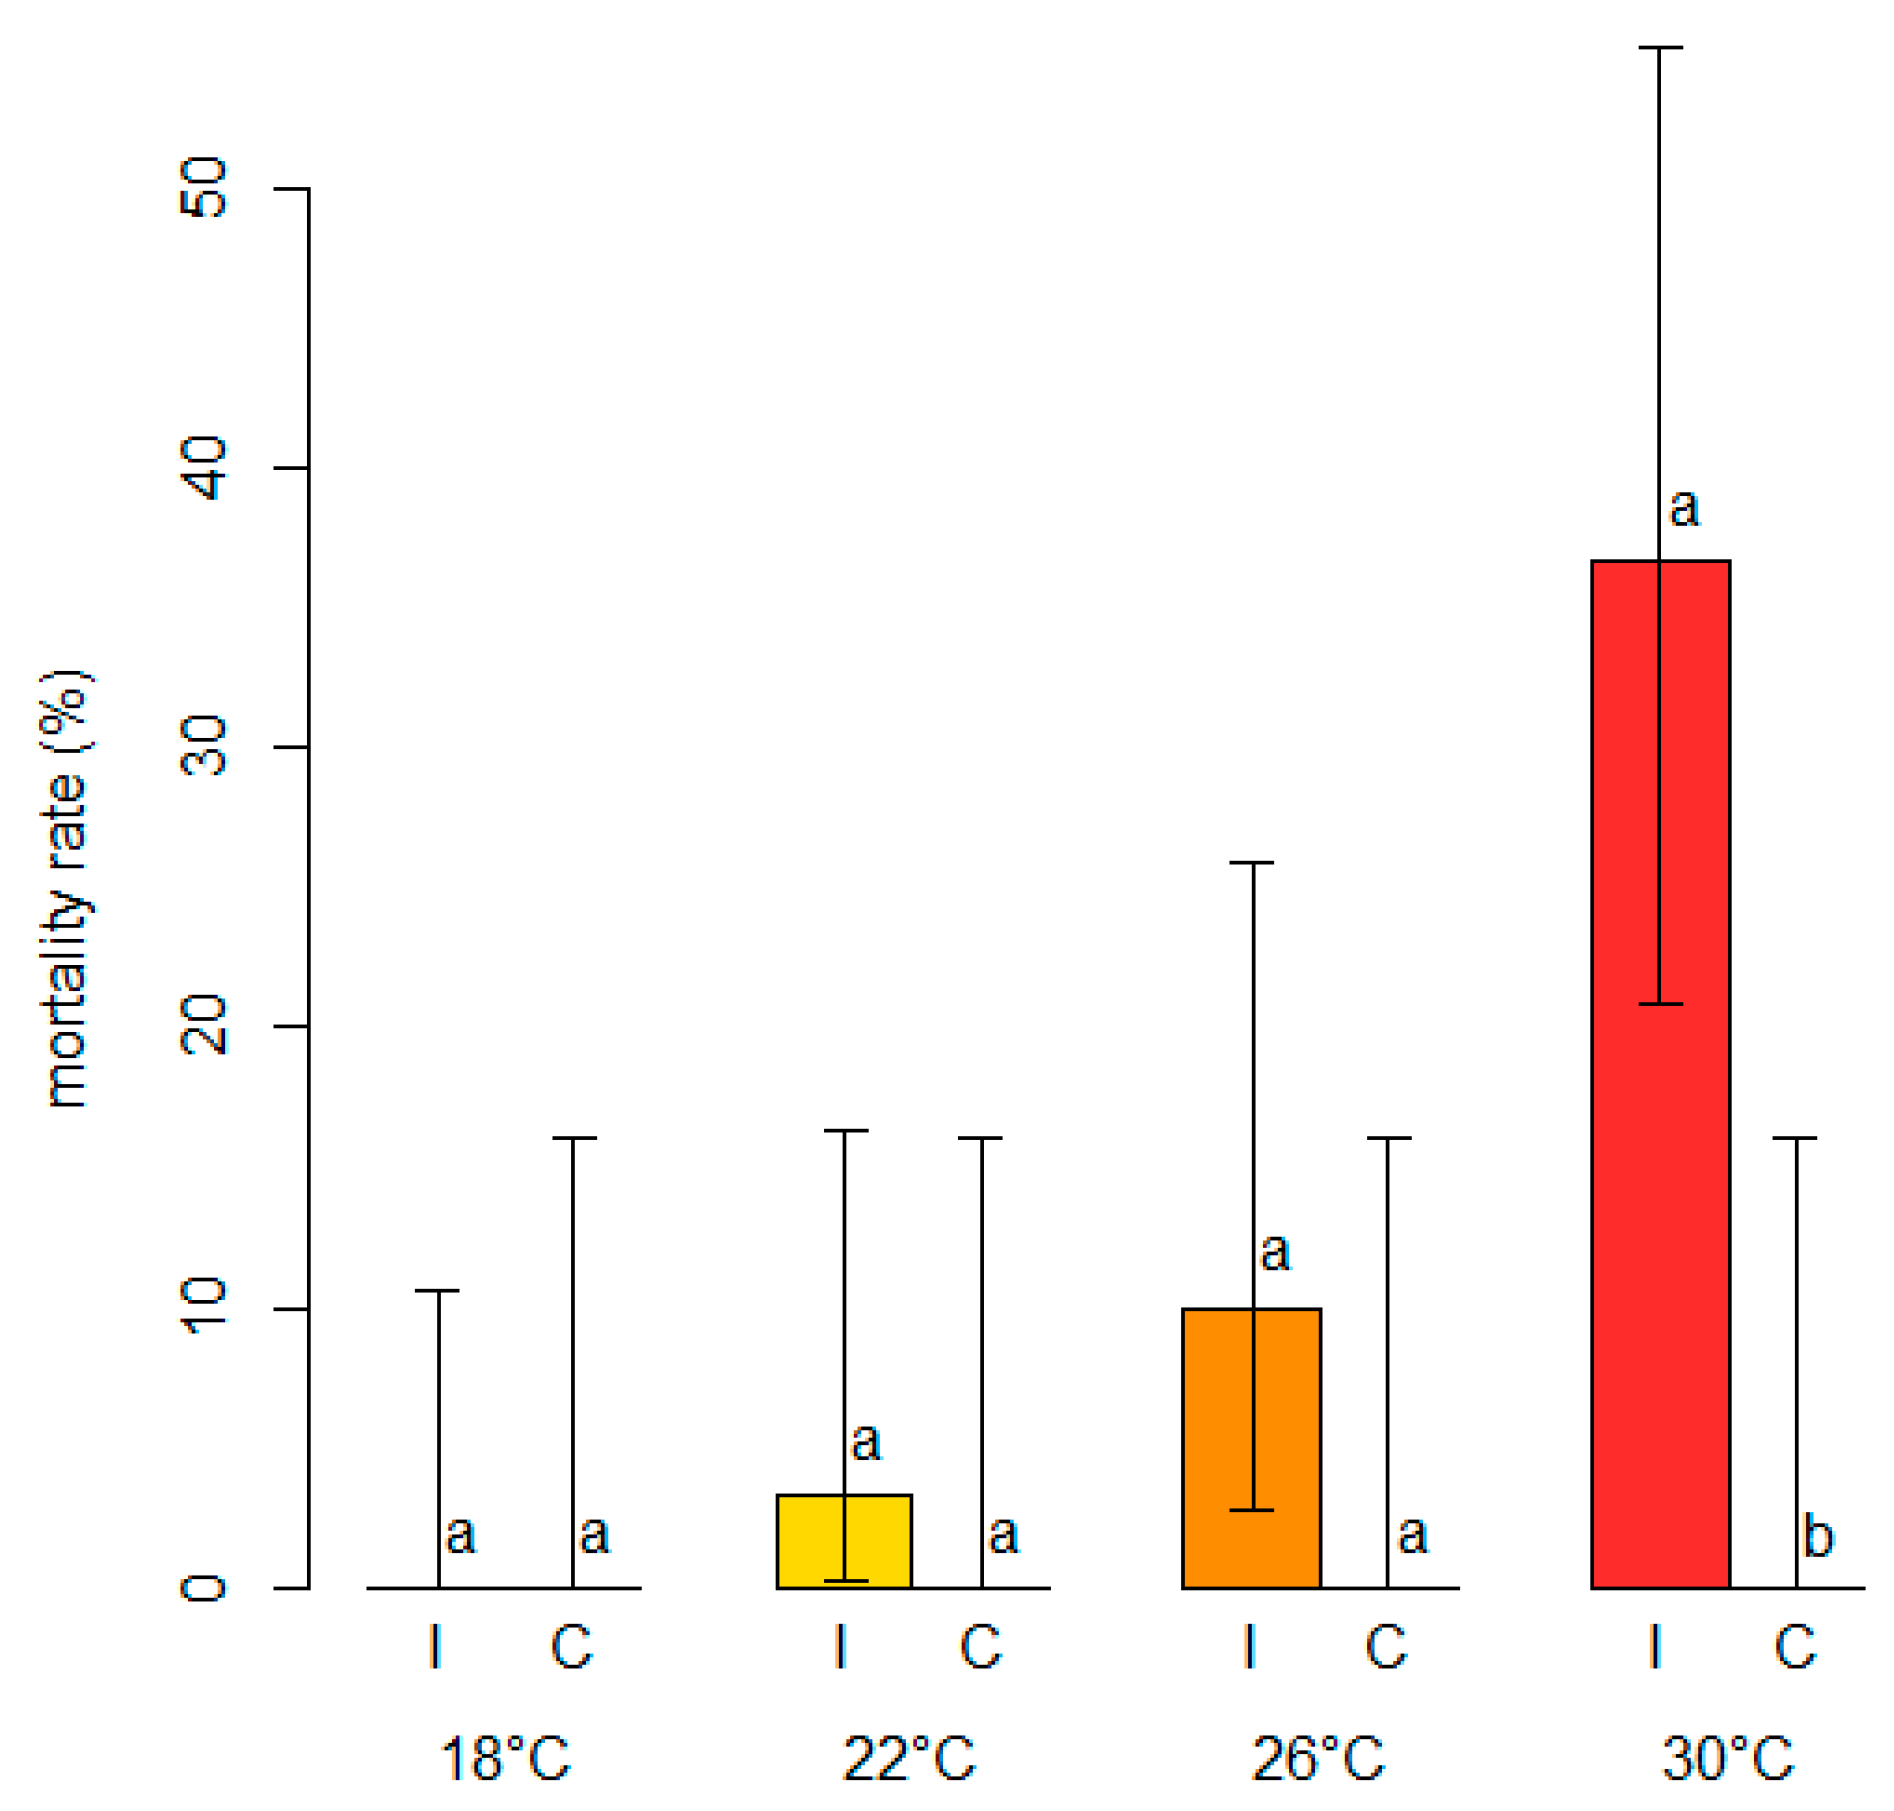
The analysis of the mortality rates showed that while there was no mortality in the control plants, regardless of the temperature level, a variable proportion of dead plants was present among those inoculated with N. parvum (Figure 8).

Figure 8.
Comparisons of mortality rates (in %, on the y-axis) among blueberry plants inoculated with Neofusicoccum parvum (I) and control plants (C) mock-inoculated with plugs of sterile agar medium at different temperature levels (°C). Different letters in the bar chart indicate that the associated averages are significantly different (p < 0.05). The error whiskers refer to the 95% exact confidence interval bounds.
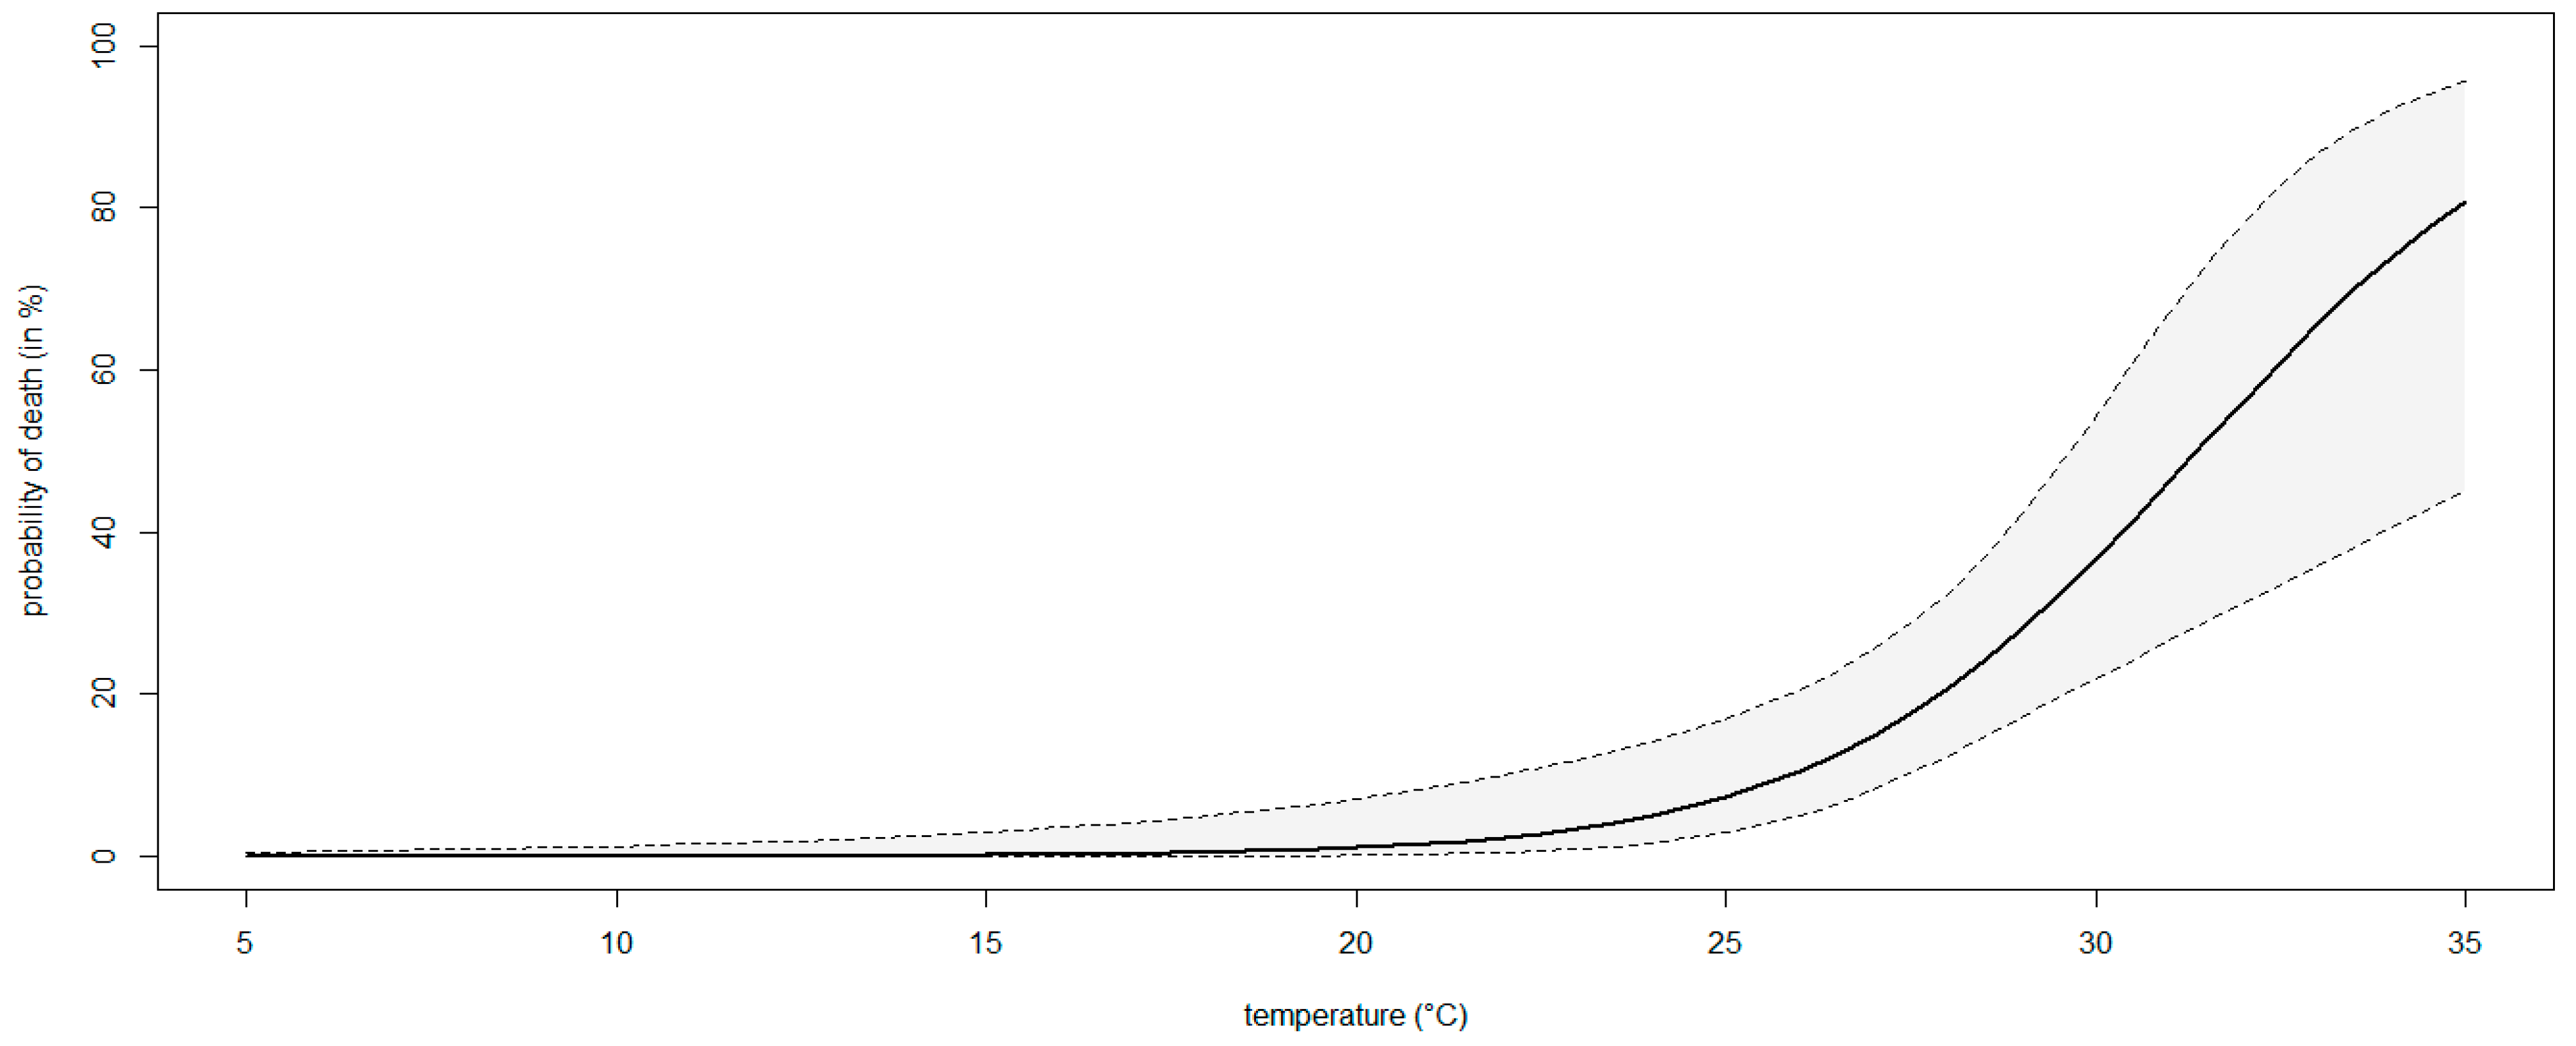
The percentage of mortality increased with increasing temperature levels, ranging from 0% (0–10.6 95%ECI) at 18 °C to 36.7% (20.9–55.1 95%ECI) at 30 °C, although the Fisher’s Exact test comparing the mortality rates was only significant (p < 0.05) at the highest temperature. A significant binary logistic regression model (p < 0.05) showed that the probability of death in blueberry plants inoculated with N. parvum rose with increasing temperature levels (Figure 9). The model fulfilled the adequacy conditions required (Table S3).
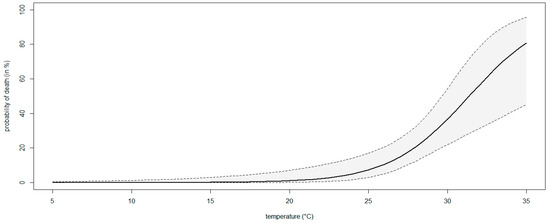
Figure 9.
A binary logistic regression curve modeling the probability of death (%) of blueberry plants inoculated with Neofusicoccum parvum at different temperatures (°C). The region between the contours above and below the curve delimits the 95% confidence interval of the modeled probability.
4. Discussion
Global warming represents one of the most important and difficult challenges for agriculture [54]. An elevated air temperature is a serious problem for several crops, as it affects the physiology of plants and may enhance their susceptibility to pathogens [25]. Moreover, rising temperatures influence the development of fungal pathogens, modulating the expression of toxic compounds, influencing the infection processes and favoring spore germination and mycelial growth, thus resulting in the emergence of diseases caused by thermophilic fungi [26,55]. In the present study, we first assessed the in vitro effect of temperature on the mycelial growth of four pathogens causing blueberry stem blight and dieback. The experiment showed that mycelial growth was variable depending on the species. The comparison of in vitro growth rates among the four target pathogens suggests that N. parvum is the species which colonizes host plant tissues at the fastest rate. Nonetheless, the growth rate of D. rudis was statistically undistinguishable from that of N. parvum. Species within the Botryosphaeriaceae are well known to be fast-growing [56], while Diaporthe rudis is described as relatively slow-growing [57], so our results regarding D. rudis are somewhat unexpected. Further research is needed to confirm that faster growth rates among Botryosphaeriales and Diaporthales always equate to greater disease severity.
The varietal susceptibility test showed that disease severity, expressed as the length of necroses, was highest when the plants were inoculated with N. parvum. At the same time, N. parvum caused the highest mortality rates regardless of the blueberry cultivar. Conversely, not only did the other tested pathogens display lower levels of virulence, but virulence varied depending on the cultivar. In spite of its good growth in vitro, D. rudis displayed mild virulence in planta, causing lesions that, in some cases, were undistinguishable from those observed in the control plants. The superiority of N. parvum as a pathogen was well exemplified by the clustering of mortality rates, which indicated that the proportion of dead plants was approximately 20-fold higher when the plants were inoculated with N. parvum than the proportion of dead plants that were inoculated with the other three fungi or mock-inoculated. All of the above results strongly support the selection of N. parvum as an ideal species to test and model the effects of increasing temperature levels on the growth rate and virulence of a fungal plant pathogen.
The generalized Analytis Beta Model resulted in an inverse U-shaped and highly asymmetric curve, displaying a mildly increasing pattern of growth rates between 5 °C and 29.9 °C (optimal temperature), followed by a steep drop in growth between 29.9 °C and 35 °C. Based on this theoretical model, any positive discrete variation in temperature (Δt > 0) occurring between 5 °C and 29.9 − Δt °C leads to a corresponding positive increment in the substrate colonization ability of N. parvum (Δc > 0). If this model developed in vitro held true in planta, it might be argued that the severity of the symptoms observed in the host plants infected by N. parvum should increase with increasing temperature levels. This hypothesis was strongly supported by the results of the inoculations of N. parvum in plants of blueberry grown in an environment where the temperature was controlled. In these trials, the air temperature increased by Δt = 4 °C, starting at 18 °C and ending at 30 °C, leading to a corresponding significant and positive increment in symptom severity (i.e., internal and external necrosis lengths). Probabilistic models based on binary logistic regression not only show that warming temperatures are positively correlated with a higher probability of observing larger lesions, but also that lesion sizes at higher temperatures may be substantially larger. Similarly, the mortality rates of blueberry plants inoculated with N. parvum also increased with increasing temperatures. Interestingly, but not surprisingly, the peak of mortality was observed at 30 °C, which corresponds to the optimal temperature for the mycelial growth of N. parvum in the Analytis Beta Model developed from in vitro observations. The logistic equations predict that warming temperatures lead to an increasing probability of death in plants infected by N. parvum. This probability calculation may be a proxy to estimate yield losses in different climate change scenarios. Incidentally, the pathogen was also able to produce visible oozing pycnidia on plants at 30 °C, which is in line with what was reported in previous studies conducted on blueberry and grapevine [58,59]. This aspect suggests that high temperatures, even for a prolonged period, may not only increase disease severity in the field, but may also lead to sporulation, thus providing an additional inoculum source for further infections.
Based on the results of this study, we predict that outbreaks by N. parvum will worsen in warmer summers, possibly thanks to the direct effect of temperature on the growth of the pathogen. However, we note that the magnitude of the increase in in vitro growth rates with an increase of 12 °C in temperature was 1.65-fold (Figure 5). That increase value is much lower than the 3.5- and 7.6-fold increases in the internal and external in planta lesion sizes, respectively, which were observed with a similar 12 °C increase in temperature (Figure 6). We posit that the stronger in planta effect may be due to the effects of warmer temperatures on plant physiology or on plant–pathogen interactions, which, in turn, will affect disease severity. In conclusion, our data suggest that temperature affects disease severity through multiple pathways and not solely through affecting fungal growth.
The climatic data from the blueberry production fields currently experiencing the emergence of stem blight and dieback show a prolonged trend of increasing temperatures [60]. In the Piedmont region of Italy, blueberry cultivation consisted of 1461 ha, with 9693 tons of berries produced in 2022, and it is constantly expanding [17]. The results of this study suggest that disease may be curtailed by the selection of growing sites that may be cooler in the summer or may be more resilient to increases in temperature. It should also be considered that in the past decade, blueberry cultivation has expanded into warmer sites with a lower altitude, and blueberry cultural systems have been intensified [61]. Warmer temperatures combined with a high plant density can alter the agro-ecological balance of a plantation as well as the physiology of blueberry plants. The same is true for wounding associated with the mechanization of harvesting given that wounds have been associated with increased infection by fungi in the Botryosphaeriaceae [20,56]. If the changes caused by intensive plantations result in increased wounding and plant stress, we know that infection rates and the virulence of latent pathogens such as N. parvum will also increase. Physiological stress will thus trigger disease expression by N. parvum, and warmer temperatures, which are ideal for N. parvum, will increase the severity of the disease caused by this pathogen [62,63].
We suggest that the productivity of blueberry orchards may be maintained by a mix of strategies that include, but are not limited to, avoiding the introduction of N. parvum or similar pathogens, planting in sites selected for a future optimal climate based on climatic predictions, shading the orchard, avoiding excessive wounding and minimizing physiological stress in the host. Assessing the role that each variable above may have on disease may help to further fine-tune disease management strategies. Additional insights may come from studies conducted to investigate the presence of N. parvum in asymptomatic plant tissues and commodities other than blueberry and to further understand the biology of this pathogen, which is reported as one of the most widespread causal agents of fungal trunk disease (FTD) due to its broad host range [2,64]. In light of warming trends, generalist pathogens, such as N. parvum, truly present a challenge. The enhanced spread and development of this species with rising temperatures could seriously compromise several fruit crops [65]. Thus, further investigations focused on different fruit crops and the genetic structures of both N. parvum and host populations should be performed to better our understanding of the ecology and evolution of this pathogen and to improve current management strategies.
Supplementary Materials
The following supporting information can be downloaded at: https://www.mdpi.com/article/10.3390/horticulturae10040363/s1.
Author Contributions
Conceptualization, I.M, G.L, M.G., P.G. and V.G.; methodology, I.M.; software, G.L.; validation, M.G., V.G. and G.L.; formal analysis, G.L.; investigation, I.M. and V.G.; resources, V.G.; data curation, I.M. and G.L.; writing—original draft preparation, I.M.; writing—review and editing, I.M, G.L, M.G., P.G. and V.G.; supervision, V.G.; project administration, V.G.; funding acquisition, V.G. All authors have read and agreed to the published version of the manuscript.
Funding
This research was supported by the Foundation CRT in the “Avversità del MIRtillo in Piemonte: dove e come combAtteRlE (MIRARE)” project. This study was carried out also within the Agritech National Research Center and received funding from the European Union Next-Generation EU (PIANO NAZIONALE DI RIPRESA E RESILIENZA (PNRR)—MISSIONE 4 COMPONENTE 2, INVESTIMENTO 1.4—D.D. 1032 17/06/2022, CN00000022). In particular, our study represents an original paper related to the Spoke 4—“Multifunctional and resilient agriculture and forestry systems for the mitigation of climate change risks”—Task 4.1.3. This manuscript reflects only the authors’ views and opinions, neither the European Union nor the European Commission can be considered responsible for them.
Data Availability Statement
The original contributions presented in the study are included in the article, further inquiries can be directed to the corresponding author.
Conflicts of Interest
The authors declare no conflicts of interest.
References
- Retamales, J.B.; Hancock, J.F. Blueberries, 2nd ed.; CABI: Wallingford, UK, 2018. [Google Scholar]
- Guarnaccia, V.; Kraus, C.; Markakis, E.; Alves, A.; Armengol, J.; Eichmeier, A.; Compant, S.; Gramaje, D. Fungal Trunk Diseases of Fruit Trees in Europe: Pathogens, Spread and Future Directions. Phytopathol. Mediterr. 2022, 61, 563–599. [Google Scholar] [CrossRef]
- Espinoza, J.G.; Briceño, E.X.; Chávez, E.R.; Úrbez-Torres, J.R.; Latorre, B.A. Neofusicoccum spp. Associated with Stem Canker and Dieback of Blueberry in Chile. Plant Dis. 2009, 93, 1187–1194. [Google Scholar] [CrossRef]
- Rodríguez-Gálvez, E.; Hilário, S.; Lopes, A.; Alves, A. Diversity and Pathogenicity of Lasiodiplodia and Neopestalotiopsis Species Associated with Stem Blight and Dieback of Blueberry Plants in Peru. Eur. J. Plant Pathol. 2020, 157, 89–102. [Google Scholar] [CrossRef]
- Phillips, A.J.L.; Oudemans, P.V.; Correia, A. Characterisation and Epitypification of Botryosphaeria corticis, the Cause of Blueberry Cane Canker. Fungal Divers. 2006, 21, 141–155. [Google Scholar]
- Tennakoon, K.M.S.; Ridgway, H.J.; Jaspers, M.V.; Eirian Jones, E. Botryosphaeriaceae Species Associated with Blueberry Dieback and Sources of Primary Inoculum in Propagation Nurseries in New Zealand. Eur. J. Plant Pathol. 2018, 150, 363–374. [Google Scholar] [CrossRef]
- Scarlett, K.A.; Shuttleworth, L.A.; Collins, D.; Rothwell, C.T.; Guest, D.I.; Daniel, R. Botryosphaeriales Associated with Stem Blight and Dieback of Blueberry (Vaccinium spp.) in New South Wales and Western Australia. Australas. Plant Pathol. 2019, 48, 45–57. [Google Scholar] [CrossRef]
- Xu, C.; Zhang, H.; Zhou, Z.; Hu, T.; Wang, S.; Wang, Y.; Cao, K. Identification and Distribution of Botryosphaeriaceae Species Associated with Blueberry Stem Blight in China. Eur. J. Plant Pathol. 2015, 143, 737–752. [Google Scholar] [CrossRef]
- Wang, Y.; Zhang, Y.; Bhoyroo, V.; Rampadarath, S.; Jeewon, R. Multigene Phylogenetics and Morphology Reveal Five Novel Lasiodiplodia Species Associated with Blueberries. Life 2021, 11, 657. [Google Scholar] [CrossRef]
- Ivić, D.; Novak, A.; Pilipovi, P. Diaporthe eres Nitschke Is the Only Diaporthe Species Found on Blueberry in Croatia. Fragm. Phytomed. 2018, 32, 23–30. [Google Scholar]
- Lombard, L.; van Leeuwen, G.C.M.; Guarnaccia, V.; Polizzi, G.; van Rijswick, P.C.J.; Rosendahl, K.C.H.M.; Gabler, J.; Crous, P.W. Diaporthe Species Associated with Vaccinium, with Specific Reference to Europe. Phytopathol. Mediterr. 2014, 53, 23–30. [Google Scholar] [CrossRef]
- Castillo, S.; Borrero, C.; Castaño, R.; Rodríguez, A.; Avilés, M. First Report of Canker Disease Caused by Neofusicoccum parvum and N. australe on Blueberry Bushes in Spain. Plant Dis. 2013, 97, 1112. [Google Scholar] [CrossRef]
- Borrero, C.; Pérez, S.; Avilés, M. First Report of Canker Disease Caused by Lasiodiplodia theobromae on Blueberry Bushes in Spain. Plant Dis. 2019, 103, 2684. [Google Scholar] [CrossRef]
- Pečenka, J.; Tekielska, D.; Kocanová, M.; Peňázová, E.; Berraf-Tebbal, A.; Eichmeier, A. First Report of Lasiodiplodia theobromae Causing Decline of Blueberry (Vaccinium corymbosum) in the Czech Republic. Plant Dis. 2021, 105, 215. [Google Scholar] [CrossRef]
- Hilário, S.; Lopes, A.; Santos, L.; Alves, A. Botryosphaeriaceae Species Associated with Blueberry Stem Blight and Dieback in the Centre Region of Portugal. Eur. J. Plant Pathol. 2020, 156, 31–44. [Google Scholar] [CrossRef]
- Hilário, S.; Amaral, I.A.; Gonçalves, M.F.M.; Lopes, A.; Santos, L.; Alves, A. Diaporthe Species Associated with Twig Blight and Dieback of Vaccinium corymbosum in Portugal, with Description of Four New Species. Mycologia 2020, 112, 293–308. [Google Scholar] [CrossRef]
- ISTAT. 2023. Available online: https://www.istat.it/ (accessed on 27 November 2023).
- Guarnaccia, V.; Martino, I.; Tabone, G.; Brondino, L.; Gullino, M.L. Fungal Pathogens Associated with Stem Blight and Dieback of Blueberry in Northern Italy. Phytopathol. Mediterr. 2020, 59, 229–245. [Google Scholar] [CrossRef]
- ISTAT. 2023. Available online: http://dati.istat.it (accessed on 11 March 2024).
- Slippers, B.; Wingfield, M.J. Botryosphaeriaceae as Endophytes and Latent Pathogens of Woody Plants: Diversity, Ecology and Impact. Fungal Biol. Rev. 2007, 21, 90–106. [Google Scholar] [CrossRef]
- Sessa, L.; Abreo, E.; Lupo, S. Diversity of Fungal Latent Pathogens and True Endophytes Associated with Fruit Trees in Uruguay. J. Phytopathol. 2018, 166, 633–647. [Google Scholar] [CrossRef]
- Hilário, S.; Gonçalves, M.F.M. Mechanisms Underlying the Pathogenic and Endophytic Lifestyles in Diaporthe: An Omics-Based Approach. Horticulturae 2023, 9, 423. [Google Scholar] [CrossRef]
- Salvatore, M.M.; Andolfi, A.; Nicoletti, R. The Thin Line between Pathogenicity and Endophytism: The Case of Lasiodiplodia theobromae. Agriculture 2020, 10, 488. [Google Scholar] [CrossRef]
- Lione, G.; Giordano, L.; Sillo, F.; Gonthier, P. Testing and Modelling the Effects of Climate on the Incidence of the Emergent Nut Rot Agent of Chestnut Gnomoniopsis castanea. Plant Pathol. 2015, 64, 852–863. [Google Scholar] [CrossRef]
- Velásquez, A.C.; Castroverde, C.D.M.; He, S.Y. Plant–Pathogen Warfare under Changing Climate Conditions. Curr. Biol. 2018, 28, R619–R634. [Google Scholar] [CrossRef]
- Pour, F.; Ferreira, V.; Félix, C.; Serôdio, J.; Alves, A.; Duarte, A.S.; Esteves, A.C. Effect of Temperature on the Phytotoxicity and Cytotoxicity of Botryosphaeriaceae Fungi. Fungal Biol. 2020, 124, 571–578. [Google Scholar] [CrossRef]
- Hunjan, M.S.; Lore, J.S. Climate Change: Impact on Plant Pathogens, Diseases, and Their Management. In Crop Protection under Changing Climate; Jabran, K., Florentine, S., Chauhan, B.S., Eds.; Springer International Publishing: Cham, Switzerland, 2020; pp. 85–100. [Google Scholar] [CrossRef]
- Lung, T.; Dosio, A.; Becker, W.; Lavalle, C.; Bouwer, L.M. Assessing the Influence of Climate Model Uncertainty on EU-Wide Climate Change Impact Indicators. Clim. Change 2013, 120, 211–227. [Google Scholar] [CrossRef]
- Medda, S.; Fadda, A.; Mulas, M. Influence of Climate Change on Metabolism and Biological Characteristics in Perennial Woody Fruit Crops in the Mediterranean Environment. Horticulturae 2022, 8, 273. [Google Scholar] [CrossRef]
- Lead, C. Climate and Environmental Change in the Mediterranean Basin–Current Situation and Risks for the Future. In Union for the Mediterranean, Plan Bleu; UNEP/MAP: Marseille, France, 2020. [Google Scholar]
- Brondino, L.; Briano, R.; Massaglia, S.; Giuggioli, N.R. Influence of Harvest Method on the Quality and Storage of Highbush Blueberry. J. Agric. Food Res. 2022, 10, 100415. [Google Scholar] [CrossRef]
- DiCiccio, T.J.; Efron, B. Bootstrap Confidence Intervals. Stat. Sci. 1996, 11, 189–228. [Google Scholar] [CrossRef]
- Lione, G.; Giordano, L.; Sillo, F.; Brescia, F.; Gonthier, P. Temporal and Spatial Propagule Deposition Patterns of the Emerging Fungal Pathogen of Chestnut Gnomoniopsis castaneae in Orchards of North-western Italy. Plant Pathol. 2021, 70, 2016–2033. [Google Scholar] [CrossRef]
- Hothorn, T.; Zeileis, A. Partykit: A Modular Toolkit for Recursive Partytioning in R. J. Mach. Learn. Res. 2015, 16, 3905–3909. [Google Scholar]
- Hothorn, T.; Hornik, K.; Zeileis, A. Unbiased Recursive Partitioning: A Conditional Inference Framework. J. Comput. Graph. Stat. 2006, 15, 651–674. [Google Scholar] [CrossRef]
- Lione, G.; Giordano, L.; Turina, M.; Gonthier, P. Hail-Induced Infections of the Chestnut Blight Pathogen Cryphonectria Parasitica Depend on Wound Size and May Lead to Severe Diebacks. Phytopathology 2020, 110, 1280–1293. [Google Scholar] [CrossRef] [PubMed]
- Agresti, A. Categorical Data Analysis; John Wiley & Sons: Hoboken, NJ, USA, 2012. [Google Scholar]
- Zeileis, A.; Leisch, F.; Hornik, K.; Kleiber, C. Strucchange: An R Package for Testing for Structural Change in Linear Regression Models. J. Stat. Softw. 2002, 7, 1–38. [Google Scholar] [CrossRef]
- Lione, G.; Brescia, F.; Giordano, L.; Gonthier, P. Effects of Seasonality and Climate on the Propagule Deposition Patterns of the Chestnut Blight Pathogen Cryphonectria parasitica in Orchards of the Alpine District of North Western Italy. Agriculture 2022, 12, 644. [Google Scholar] [CrossRef]
- Kļaviņa, D.; Lione, G.; Kenigsvalde, K.; Pellicciaro, M.; Muižnieks, I.; Silbauma, L.; Jansons, J.; Gaitnieks, T.; Gonthier, P. Host-Associated Intraspecific Phenotypic Variation in the Saprobic Fungus Phlebiopsis gigantea. Microb. Ecol. 2023, 86, 1847–1855. [Google Scholar] [CrossRef] [PubMed]
- Venkatasubramaniam, A.; Wolfson, J.; Mitchell, N.; Barnes, T.; JaKa, M.; French, S. Decision Trees in Epidemiological Research. Emerg. Themes Epidemiol. 2017, 14, 11. [Google Scholar] [CrossRef] [PubMed]
- Blaker, H. Confidence Curves and Improved Exact Confidence Intervals for Discrete Distributions. Can. J. Stat. 2000, 28, 783–798. [Google Scholar] [CrossRef]
- López-Moral, A.; Raya-Ortega, M.C.; Agustí-Brisach, C.; Roca, L.F.; Lovera, M.; Luque, F.; Arquero, O.; Trapero, A. Morphological, Pathogenic, and Molecular Characterization of Colletotrichum acutatum Isolates Causing Almond Anthracnose in Spain. Plant Dis. 2017, 101, 2034–2045. [Google Scholar] [CrossRef] [PubMed]
- Moré, J.J. The Levenberg-Marquardt Algorithm: Implementation and Theory. In Numerical Analysis: Proceedings of the Biennial Conference Held at Dundee, UK, 28 June–1 July 1977; Springer: Berlin/Heidelberg, Germany, 2006. [Google Scholar]
- Bates, D.M.; Watts, D.G. Nonlinear Regression Analysis and Its Applications. Sebastião Gazola 1988, 31, 95. [Google Scholar]
- Bates, D.M.; Chambers, J.M. Nonlinear Models. In Statistical Models; Wadsworth & Brooks: California, CA, USA, 1992; Chapter 10. [Google Scholar]
- Piñeiro, G.; Perelman, S.; Guerschman, J.P.; Paruelo, J.M. How to Evaluate Models: Observed vs. Predicted or Predicted vs. Observed? Ecol. Model. 2008, 216, 316–322. [Google Scholar] [CrossRef]
- Bliemel, F. Theil’s Forecast Accuracy Coefficient: A Clarification. J. Mark. Res. 1973, 10, 444–446. [Google Scholar] [CrossRef]
- Hosmer, D.W.; Lemeshow, S. Applied Logistic Regression; Johns Wiley & Sons: New York, NY, USA, 1989. [Google Scholar]
- Crawley, M.J. The R Book, 2nd ed.; John Wiley & Sons: Chichester, UK, 2013. [Google Scholar]
- Grueber, C.E.; Nakagawa, S.; Laws, R.J.; Jamieson, I.G. Multimodel Inference in Ecology and Evolution: Challenges and Solutions: Multimodel Inference. J. Evol. Biol. 2011, 24, 699–711. [Google Scholar] [CrossRef] [PubMed]
- Wagenmakers, E.-J.; Farrell, S. AIC Model Selection Using Akaike Weights. Psychon. Bull. Rev. 2004, 11, 192–196. [Google Scholar] [CrossRef] [PubMed]
- Garbelotto, M.; Schmidt, D.; Swain, S.; Hayden, K.; Lione, G. The Ecology of Infection between a Transmissive and a Dead-end Host Provides Clues for the Treatment of a Plant Disease. Ecosphere 2017, 8, e01815. [Google Scholar] [CrossRef]
- Juroszek, P.; Racca, P.; Link, S.; Farhumand, J.; Kleinhenz, B. Overview on the Review Articles Published during the Past 30 Years Relating to the Potential Climate Change Effects on Plant Pathogens and Crop Disease Risks. Plant Pathol. 2020, 69, 179–193. [Google Scholar] [CrossRef]
- Ji, T.; Altieri, V.; Salotti, I.; Rossi, V. Effects of Temperature and Moisture Duration on Spore Germination of Four Fungi That Cause Grapevine Trunk Diseases. Plant Dis. 2023, 107, 1005–1008. [Google Scholar] [CrossRef]
- Batista, E.; Lopes, A.; Alves, A. What Do We Know about Botryosphaeriaceae? An Overview of a Worldwide Cured Dataset. Forests 2021, 12, 313. [Google Scholar] [CrossRef]
- Udayanga, D.; Castlebury, L.A.; Rossman, A.Y.; Hyde, K.D. Species Limits in Diaporthe: Molecular Re-Assessment of D. citri, D. cytosporella, D. foeniculina and D. rudis. Persoonia Mol. Phylogeny Evol. Fungi 2014, 32, 83–101. [Google Scholar] [CrossRef] [PubMed]
- Tennakoon, K.M.S.; Ridgway, H.J.; Jaspers, M.V.; Jones, E.E. Factors Affecting Neofuscicoccum Ribis Infection and Disease Progression in Blueberry. Eur. J. Plant Pathol. 2018, 151, 87–99. [Google Scholar] [CrossRef]
- Shafi, A.; Ridgway, H.J.; Jaspers, M.V.; Jones, E.E. Factors Influencing Virulence and Conidial Production of Neofusicoccum Species on Grapevine Shoots. Eur. J. Plant Pathol. 2019, 153, 1067–1081. [Google Scholar] [CrossRef]
- ARPA. 2023. Available online: https://www.arpa.piemonte.it/ (accessed on 14 October 2023).
- Pérez, R.; Laca, A.; Laca, A.; Díaz, M. Environmental Behaviour of Blueberry Production at Small-Scale in Northern Spain and Improvement Opportunities. J. Clean. Prod. 2022, 339, 130594. [Google Scholar] [CrossRef]
- Qiu, Y.; Steel, C.C.; Ash, G.J.; Savocchia, S. Effects of Temperature and Water Stress on the Virulence of Botryosphaeriaceae spp. Causing Dieback of Grapevines and Their Predicted Distribution Using CLIMEX in Australia. Acta Hortic. 2016, 1115, 171–182. [Google Scholar] [CrossRef]
- Van Dyk, M.; Spies, C.F.J.; Mostert, L.; Halleen, F. Survey of Trunk Pathogens in South African Olive Nurseries. Plant Dis. 2021, 105, 1630–1639. [Google Scholar] [CrossRef] [PubMed]
- Sakalidis, M.L.; Slippers, B.; Wingfield, B.D.; Hardy, G.E.S.J.; Burgess, T.I. The Challenge of Understanding the Origin, Pathways and Extent of Fungal Invasions: Global Populations of the Neofusicoccum parvum-N. ribis Species Complex. Divers. Distrib. 2013, 19, 873–883. [Google Scholar] [CrossRef]
- Martino, I.; Agustí-Brisach, C.; Nari, L.; Gullino, M.L.; Guarnaccia, V. Characterization and Pathogenicity of Fungal Species Associated with Dieback of Apple Trees in Northern Italy. Plant Dis. 2024, 108, 311–331. [Google Scholar] [CrossRef] [PubMed]


Disclaimer/Publisher’s Note: The statements, opinions and data contained in all publications are solely those of the individual author(s) and contributor(s) and not of MDPI and/or the editor(s). MDPI and/or the editor(s) disclaim responsibility for any injury to people or property resulting from any ideas, methods, instructions or products referred to in the content. |
© 2024 by the authors. Licensee MDPI, Basel, Switzerland. This article is an open access article distributed under the terms and conditions of the Creative Commons Attribution (CC BY) license (https://creativecommons.org/licenses/by/4.0/).