Article

Assessing the Genetic Diversity of Wild and Commercial Feijoa sellowiana Accessions Using AFLPs

1
Department of Agriculture, Food, Environment and Forestry (DAGRI), University of Florence, Viale delle Idee 30, 50019 Sesto Fiorentino, Italy
2
Interdepartmental Service Center for Agricultural, Chemical and Industrial Biotechnology (CIBIACI), University of Florence, Via Romana 21, 50125 Florence, Italy
3
Center for Photosynthetic and Biochemical Studies (CEFOBI), National Scientific and Technical Research Council (CONICET), Rosario National University (UNR), Suipacha 531, Rosario 2000, Argentina
4
Laboratory for Vegetative Propagation, Conservation and Domestication of Native Plants (LAPROVECO), School of Forestry, National University of Misiones (UNaM), Bertoni 124, Eldorado N3380, Argentina
5
Council for Agricultural Research and Economics (CREA), Research Center for Olive, Fruits, and Citrus Crops, 81100 Caserta, Italy
*
Authors to whom correspondence should be addressed.
Horticulturae 2024, 10(4), 366; https://doi.org/10.3390/horticulturae10040366
Submission received: 29 February 2024 / Revised: 3 April 2024 / Accepted: 4 April 2024 / Published: 6 April 2024
(This article belongs to the Section Genetics, Genomics, Breeding, and Biotechnology (G2B2))

Abstract

:
Feijoa sellowiana (O. Berg) is a broadly widespread fruit tree species at a very early stage of domestication. Although appreciated for its flavored berries rich in nutrients and nutraceuticals, and as an ornamental plant, feijoa is still considered an underutilized species and little information is available about its genetic background, cultivar traceability and divergence. This study aimed to investigate, for the first time, the genetic diversity of feijoa through the application of AFLPs. Specifically, twenty cultivars from different countries and six wild types (WTs) from their area of origin (Misiones, Argentina) were analyzed. The AFLPs proved to be informative, revealing the values of the percentage of polymorphic loci (PPB), Nei’s genetic diversity (h), and the Shannon index (I) at 69.36%, 0.27, and 0.43, respectively, consistent with the average of long-lived perennial and outcrossing species. However, despite the limited number of WTs examined, the genetic variability (h) was higher (approximately 37%) within the six samples compared to cultivars. The population structure analysis identified three clusters, with WTs forming a separated cluster (III) as expected. Cultivars were divided into two clusters (I and II), with cluster I exhibiting a closer genetic proximity to WTs compared to cluster II. This finding was further confirmed using the UPGMA dendrogram based on Provesti distances. This work raised awareness of the genetic variability among the feijoa’s widespread cultivars and demonstrated that the limited genetic breeding programs over the last decades resulted in low diversity among them. Moreover, these results confirm the hypothesis that all varieties are derived from a single narrow ancestral population. The potential of this species is considerable and needs to be further investigated to exploit its peculiarities.

1. Introduction

Feijoa (Feijoa sellowiana O. Berg) is an evergreen shrub or small tree, belonging to the Myrtaceae family, and frequently referred to as pineapple guava and guavasteen, despite being different from the true guava (Psidium guajava) [1]. It is originally native to the southern regions of Brazil, northern Argentina, western Paraguay and Uruguay [1,2,3].
Feijoa is characterized by stunning blooming with beautiful flowers, which have captured the interest of many collectors, gardens, and park designers. Moreover, its fruits are a good source of vitamins and minerals, as well as bioactive compounds that have pharmaceutical attributes, such as antioxidant, antimicrobial, and anti-inflammatory characteristics providing various human benefits and reducing the risk of disease [1,4]. Processed feijoa products, including yogurts, ice cream, chocolates, pies, wines, jams, liqueurs, and juices, showcase the versatility of this fruit in culinary applications [5]. Despite its exceptional qualities, feijoa fruits have a relatively modest shelf-life, influenced by storage temperature. When stored at 4 °C, they can last for up to 42 days, and for up to 2 weeks at 16°C [6]. However, later exposure to temperatures higher than 20 °C drastically reduces their shelf-life to less than 7 days [7]. This condition limits feijoa marketability and therefore has led home gardeners to adopt a practice of widespread sharing with friends and neighbors [8].
Two feijoa populations have been distinguished in South America [9]. The first, known as the ‘Brazilian’ type, is located in southeastern Brazil, specifically the high plains of Paraná, Santa Catarina, and the northern part of Rio Grande do Sul. The second one, known as the ‘Uruguayan’ type, is primarily situated on both sides of the Uruguay–Brazil border, at elevations ranging from 100 to 500 m [10]. The latter, whose fruits are smaller but sweeter and softer than the ‘Brazilian’ ones, is the type commercialized worldwide [11].
In this context, beyond its sensory qualities, the feijoa tree has shown remarkable adaptability to subtropical and warm-temperate climates, which has enabled it to garner global popularity. Although it is still a minor crop, it is widespread outside its native regions, being cultivated in North America, Europe, Australia and New Zealand for fruit production and ornamental value [1,2,3].
It was introduced outside its origin center at the end of the 19th century by the botanist Edouard André, who was responsible for its diffusion in Europe and North America. Then, from the latter, it was spread to Australia and New Zealand in the 20th century [11]. Feijoa distribution in other South American countries is more ambiguous, but the main common type is the ‘Uruguayan’ one [11]. Indeed, it is well known that the acclimatization of feijoa in Colombia occurred from New Zealand seeds in the first half of the 20th century [12]. Nowadays, the commercial production of feijoa is concentrated in New Zealand, Colombia, California, Georgia, Portugal, Italy, Australia, Brazil, and Azerbaijan [11,13,14,15]. Among them, Colombia stands out as the leading producer of feijoa, with cultivation spanning 339.30 ha and yielding 3133.30 tons of fruit in 2022 [16]. The second producer is New Zealand, with 150 hectares of cultivated feijoa trees, contributing to an annual production of 1100 tons of fruit. [17].
Moreover, in New Zealand, many feijoa varieties have been selected by the fruit industry, categorized into early season (e.g., Gemini, Unique, Pounamu, Anatoki), mid-season (e.g., Apollo, Den’s Choice), and late season (e.g., Opal Star, Triumph) [4], exporting them worldwide for both fruit and ornamental production. Nevertheless, their diffusion is limited due to the difficulty of obtaining an efficient clonal production through traditional vegetative propagation methods such as cutting, grafting, micropropagation, and stump layering [18,19].
These varieties have been carefully selected through traditional selection methods. In this context, it is imperative to develop new cultivars that improve fruit quality parameters, aiming to maximize the utilization of this valuable species [20]. However, the implementation of traditional breeding programs poses challenges, demanding significant time and expense to characterize all phenotypical traits [21].
Consequently, the integration of molecular markers emerges as a valuable tool to refine breeding programs. These markers not only facilitate the identification of candidate genes for selection but also serve as a practical approach to discern genetic variability and differences between established commercial varieties and wild accessions [22].
Within the feijoa’s center of origin, characterized by high genetic variability, various germplasm collections have arisen to safeguard this vital resource. Noteworthy among these are the Feijoa Active Germplasm Bank (AGB) in Sao Joaquim-SC (Brazil), the National Feijoa Center (CENAF) in La Vega (Cundinamarca, Colombia), and the Nikitsky Botanical Garden (Crimean Peninsula), collectively preserving 313, 1500, and 400 accessions, respectively [23,24]. Despite the vast potential offered by this genetic diversity in elevating feijoa quality, its full exploitation remains unrealized [4]. Furthermore, information on studies related to F. sellowiana and the development of molecular markers for this species is limited. Particularly, few works have been carried out with random amplified polymorphic DNA (RAPD) [25] and simple sequence repeats (SSRs), which were based on a SSRs primer (~24) previously developed on eucalyptus and transferred to feijoa [26], as well as a primer specifically for feijoa (~10) applying an enriched genomic library [27]. From this latter primer dataset, a few other studies have been carried out analyzing both natural populations and the AGB collection in Brazil [28,29]. Another molecular approach has been developed, based on sequence-related amplified polymorphism (SRAP) [14], used to analyze the genetic diversity of 12 different feijoa cultivars. Other molecular markers, such as AFLP, ISSR and SNPs, have not been used to assess the genetic variability of this species yet, but only to develop genetic maps [30,31].
Given that this species exhibits noteworthy adaptability, particularly in response to increasing climatic variations which makes it a crop with promising growth prospects, there is a need for additional information to enhance its market appeal and improve the quality and shelf-life of its fruits.
Consequently, it is imperative to increase its genetic knowledge through diverse molecular approaches. To this purpose, this study aims to comprehensively characterize the genetic diversity of F. sellowiana through the implementation of AFLP molecular markers, which are considered a cost-effective and useful tool to assess the genetic variation in plants with few prior genetic information, due to their reproducibility, robustness and highly resolving power of polymorphism [32]. To the best of our knowledge, no similar studies have determined the genetic variability analysis in feijoa samples using AFLPs. Moreover, this research endeavors to evaluate the genetic variability of different commercial varieties in comparison with wild accessions collected from one of the centers of origin of this species (Misiones, Argentina).

2. Materials and Methods

2.1. Feijoa sellowiana Sampling

In this study, twenty renowned feijoa genotypes were used to evaluate the genetic diversity through AFLP molecular markers. The 20 genotypes are reported in Table 1. Also, two Italian varieties (i.e., Pagliaia and Russo) were included in this research. The pedigree of the current cultivars is almost unknown. Their leaves were collected from three different germplasm resources in Italy and France: CREA-OFA Caserta (Caserta Italy), ALSIA (Metaponto, Matera, Italy), and Uzein (France). The cultivars from CREA-OFA Caserta are the same used by Pasquariello et al. [14]. In addition, six samples from wild feijoa trees were added to the analysis. The wild trees (WTs) are native to the Alto Paraná Atlantic forests and collected in 4 localities of Misiones province (Argentina), considered as part of the center of origin of this species [33,34]: San Ignacio (DMS co-ordinates 27° 16′ 00″ S, 55° 24′ 44″ E); Candelaria (27° 28′ 53″ S, 55° 17′ 06″ E); Cainguás (27° 15′ 44″ S, 54° 57′ 29″ E) and Oberá (27° 21′ 23″ S, 55° 03′ 58″ E). They were collected in the frame of a local project for safeguarding endangered native plants and preserved in the repository of the National University of Misiones (UNaM). According to the rules of the Nagoya Protocol, the leaves were imported into Italy after official permission from the Instituto Misionero de Biodiversidad (IMIBIO). The information about the collection sites of these wild accessions is also reported in Table 1. For each sample, five leaves were stored with silica gel in hermetically sealed plastic bags until DNA extraction.

2.2. DNA Isolation and AFLP Protocol

Fifty milligrams of fresh young leaves were ground employing TissueLyser (Qiagen, Hilden, Germany) alongside three tungsten carbide beads and liquid nitrogen. The CTAB procedure [35] with slight adjustments was carried out for the DNA extraction. DNA quantification was assessed using a Qubit Fluorometer 1.0 (Invitrogen, Waltham, MA, USA).
Since no other studies focused on AFLP analysis on F. sellowiana, we preliminarily investigated the reliability of different AFLP primers. After this evaluation, four primer pairs, previously used in other research [36,37] were considered reliable and used for further analysis. In this context, the primer pairs selected by Lopez-Sepulveda et al. [36] were developed on the species Myrceugenia, belonging to the Myrtaceae family as F. sellowiana. The primer pairs and the adaptors are described in Table 2.
AFLP protocol was performed as described by Vos et al. [38] with minor modifications [37,39]. Briefly, 200 ng of DNA were treated with 2 U of EcoRI and MseI endonucleases (New England Biolabs, Ipswich, MA, USA) for 2 h at 37 °C. Afterward, digested DNA was ligated with double-stranded adapters (Table 2) using a T4 DNA ligase (New England Biolabs, Ipswich, MA, USA) for 2 h at 20 °C and diluted (1:1 v/v). PCR was accomplished in a final volume of 25 μL and consisted of 10 μL of the diluted ligation as the template, 1 U GoTaq Polymerase (Promega, Madison, WI, USA), 1X GoTaq colorless buffer, 1.5 mM MgCl2, 0.2 mM dNTPs and 10 pmol of each primer combination. The PCR program comprised 12 cycles of 94 °C for 30 s; 65 °C for 30 s and 72 °C for 1 min; 23 cycles of 94 °C for 30 s; 56 °C for 30 s and 72 °C for 1 min and a final extension at 72 °C for 2 min. Sizing was performed in a 16-capillary electrophoresis automated sequencer ABI 3130xl (Applied Biosystems, Waltham, MA, USA) using 1.7% GeneScanTM 500 ROXTM (Invitrogen, Waltham, MA, USA). The four sets of primers were labelled with 5′-hexachloro-fluorescein phosphoramidite (HEX) or fluorescein (FAM) fluorophores (Table 2), with complementary sequences to EcoRI or MseI adaptors. GeneMapperTM software v4.0 (Applied Biosystem, Waltham, MA, USA) was employed to analyze the sequencing results. The internal size standard profile was surveyed in all samples to check the quality of the sequencing. For each primer set, chromatograms were manually examined to establish the stable, defined, and robust peaks ranging between 50 and 500 bp. A binary matrix denoting absence (0) or presence (1) of peaks was built. The reproducibility of the results was assessed by performing duplicate AFLP profiles for ten individuals [40].

2.3. Data Analysis

Monomorphic loci were removed from the AFLP data. Genetic parameters such as the percentage of polymorphic loci (PPB), the effective number of alleles (ne), Nei’s genetic diversity (h) and the Shannon diversity index were calculated with POPGENE v1.32 [41]. In addition, the analysis of the molecular variance (AMOVA) alongside PhiPT was carried out to define the distribution of genetic diversity between and within populations using Genalex v 6.5 [42]. In addition, PhiPT was used to calculate the gene flow for the haploid data matrix (Nm = [(1/PhiPT)−1]/2).
A comprehensive evaluation of the population structure was carried out using STRUCTURE 2.3.4 software [43], based on a Bayesian procedure. To understand the real genetic differentiation, data on origin or cultivar were excluded (popinfo and popflag = 0). An admixture model was performed to predict the most accurate population number (K) by testing ten different K values, within the range of 1 to 10, employing 150,000 burn-in periods and 300,000 Markov chain Monte Carlo (MCMC) iterations, and repeating the process ten times. STRUCTURE HARVESTER [44] was utilized to compute the Evanno ΔK [45], allowing the identification of the most reliable population. A bar plot showing the coefficient of membership of the samples per cluster was employed with the R-package pophelper 2.3.1 [46]. Each individual was considered in a specific cluster with a coefficient of membership > 60%.
In addition, a clustering analysis was performed as validation of the Bayesian approach. In this context, Provesti distances among samples were computed and an unweighted pair-group method with arithmetic mean (UPGMA) dendrogram was obtained with 1000 bootstrap permutations. Adegenet 2.1.3 [47] and poppr 2.9 [48] packages for R v. 4.2.2 [49] were used for this purpose and the dendrogram was edited in Interactive Tree of Life (iTOL) software v. 6.8 [50].

3. Results

3.1. AFLP Genetic Parameters

The four primer pairs successfully amplified a total of 209 fragments, spanning a size from 50 to 500 bp (Table 3). Among these bands, the total count of polymorphic loci reached 146, representing 69.39% of the total loci detected. Particularly, the number of scorable bands varied from 40 (EcoRI–ACG/MseI–CTC) to 69 (EcoRI–ATG/MseI–CTT) with an average of 52.25. The number of polymorphic loci ranged between 27 (EcoRI–ACG/MseI–CTC) and 51 (EcoRI–ATG/MseI–CTT) with a mean of 36.50. The percentage of polymorphic loci (PPB) exhibited a range from 67.50% (EcoRI–ACG/MseI–CTC) to 73.91% (EcoRI–ATG/MseI–CTT). Upon exclusive analysis of the polymorphic loci, the effective number of alleles (ne) averaged at 1.43, with values ranging from 1.41 (EcoRI–ACG/MseI–CTC and EcoRI–ACT/MseI–CTT) to 1.49 (EcoRI–ATG/MseI–CTG). The Nei’s genetic diversity (h) revealed a mean value of 0.27, spanning from 0.26 (EcoRI–ACG/MseI–CTC, EcoRI–ACT/MseI–CTT and EcoRI–ATG/MseI–CTT) to 0.29 (EcoRI–ATG/MseI–CTG). The Shannon index (I) varied from 0.41 (EcoRI–ACG/MseI–CTC) to 0.46 (EcoRI–ATG/MseI–CTG) with an average of 0.43.

3.2. Genetic Diversity of Wild Types and Cultivars

The descriptive genetic indicators of the WTs alone and cultivars are reported in Table 4. The analysis was performed considering only the polymorphic loci out of 209 ones obtained. In this context, 75 loci were polymorphic among the six WTs, while 115 loci were selected to assess the genetic variability between cultivars. Even though the number of samples was lower, the six wild types showed a higher genetic variability compared to the 20 different cultivars analyzed. Specifically, the cultivars revealed a mean value of 1.43, while WTs showed a greater amount of 1.62. Moreover, Nei’s genetic diversity (h) revealed the same trend with an average of 0.27 in the cultivar group and 0.37 in WTs. Considering the Shannon index (I), WTs showed a higher value of 0.55, while cultivars showed 0.43.
The genetic variation between cultivars and WT accessions was further assessed through the Analysis of Molecular Variance (AMOVA) and PhiPT (Table 5). The AMOVA revealed 39% of the total genetic divergence among the two populations. Conversely, the variation within populations accounted for 61% of the total variation. The PhiPT result was shown to be statistically significant (p < 0.001), showing a high value of 0.392, while the detected gene flow (Nm) showed a low value of 0.775.

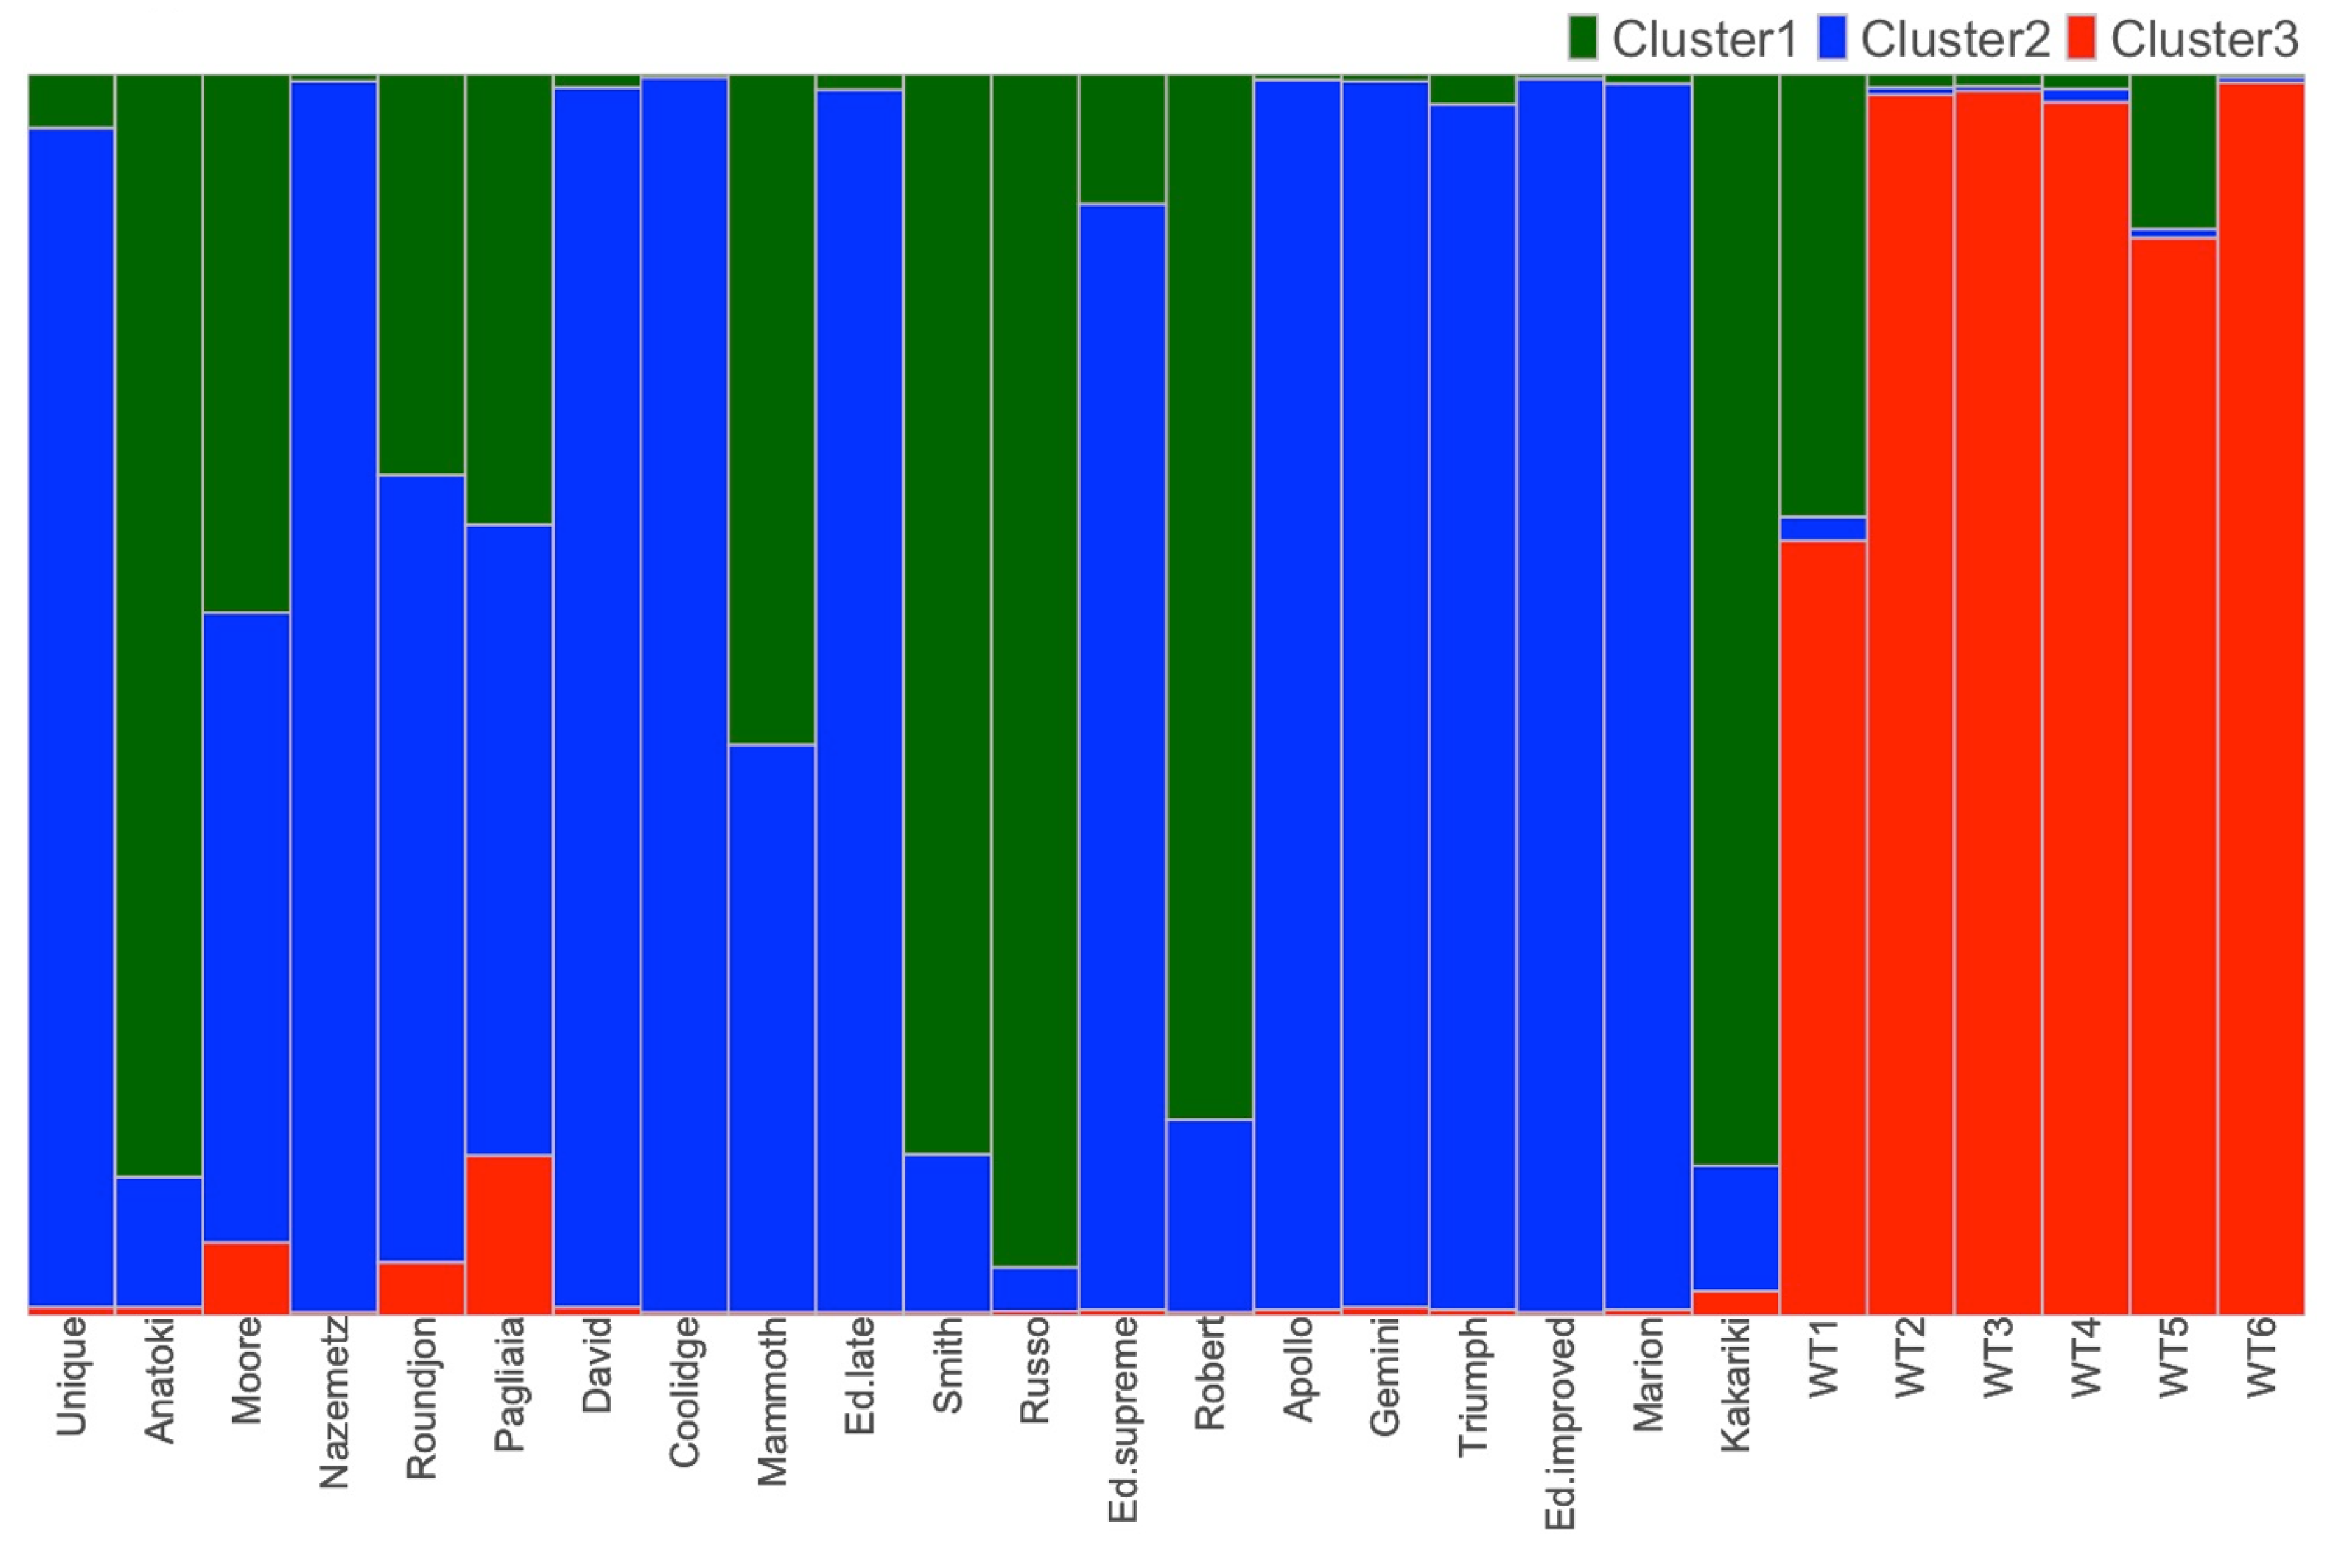
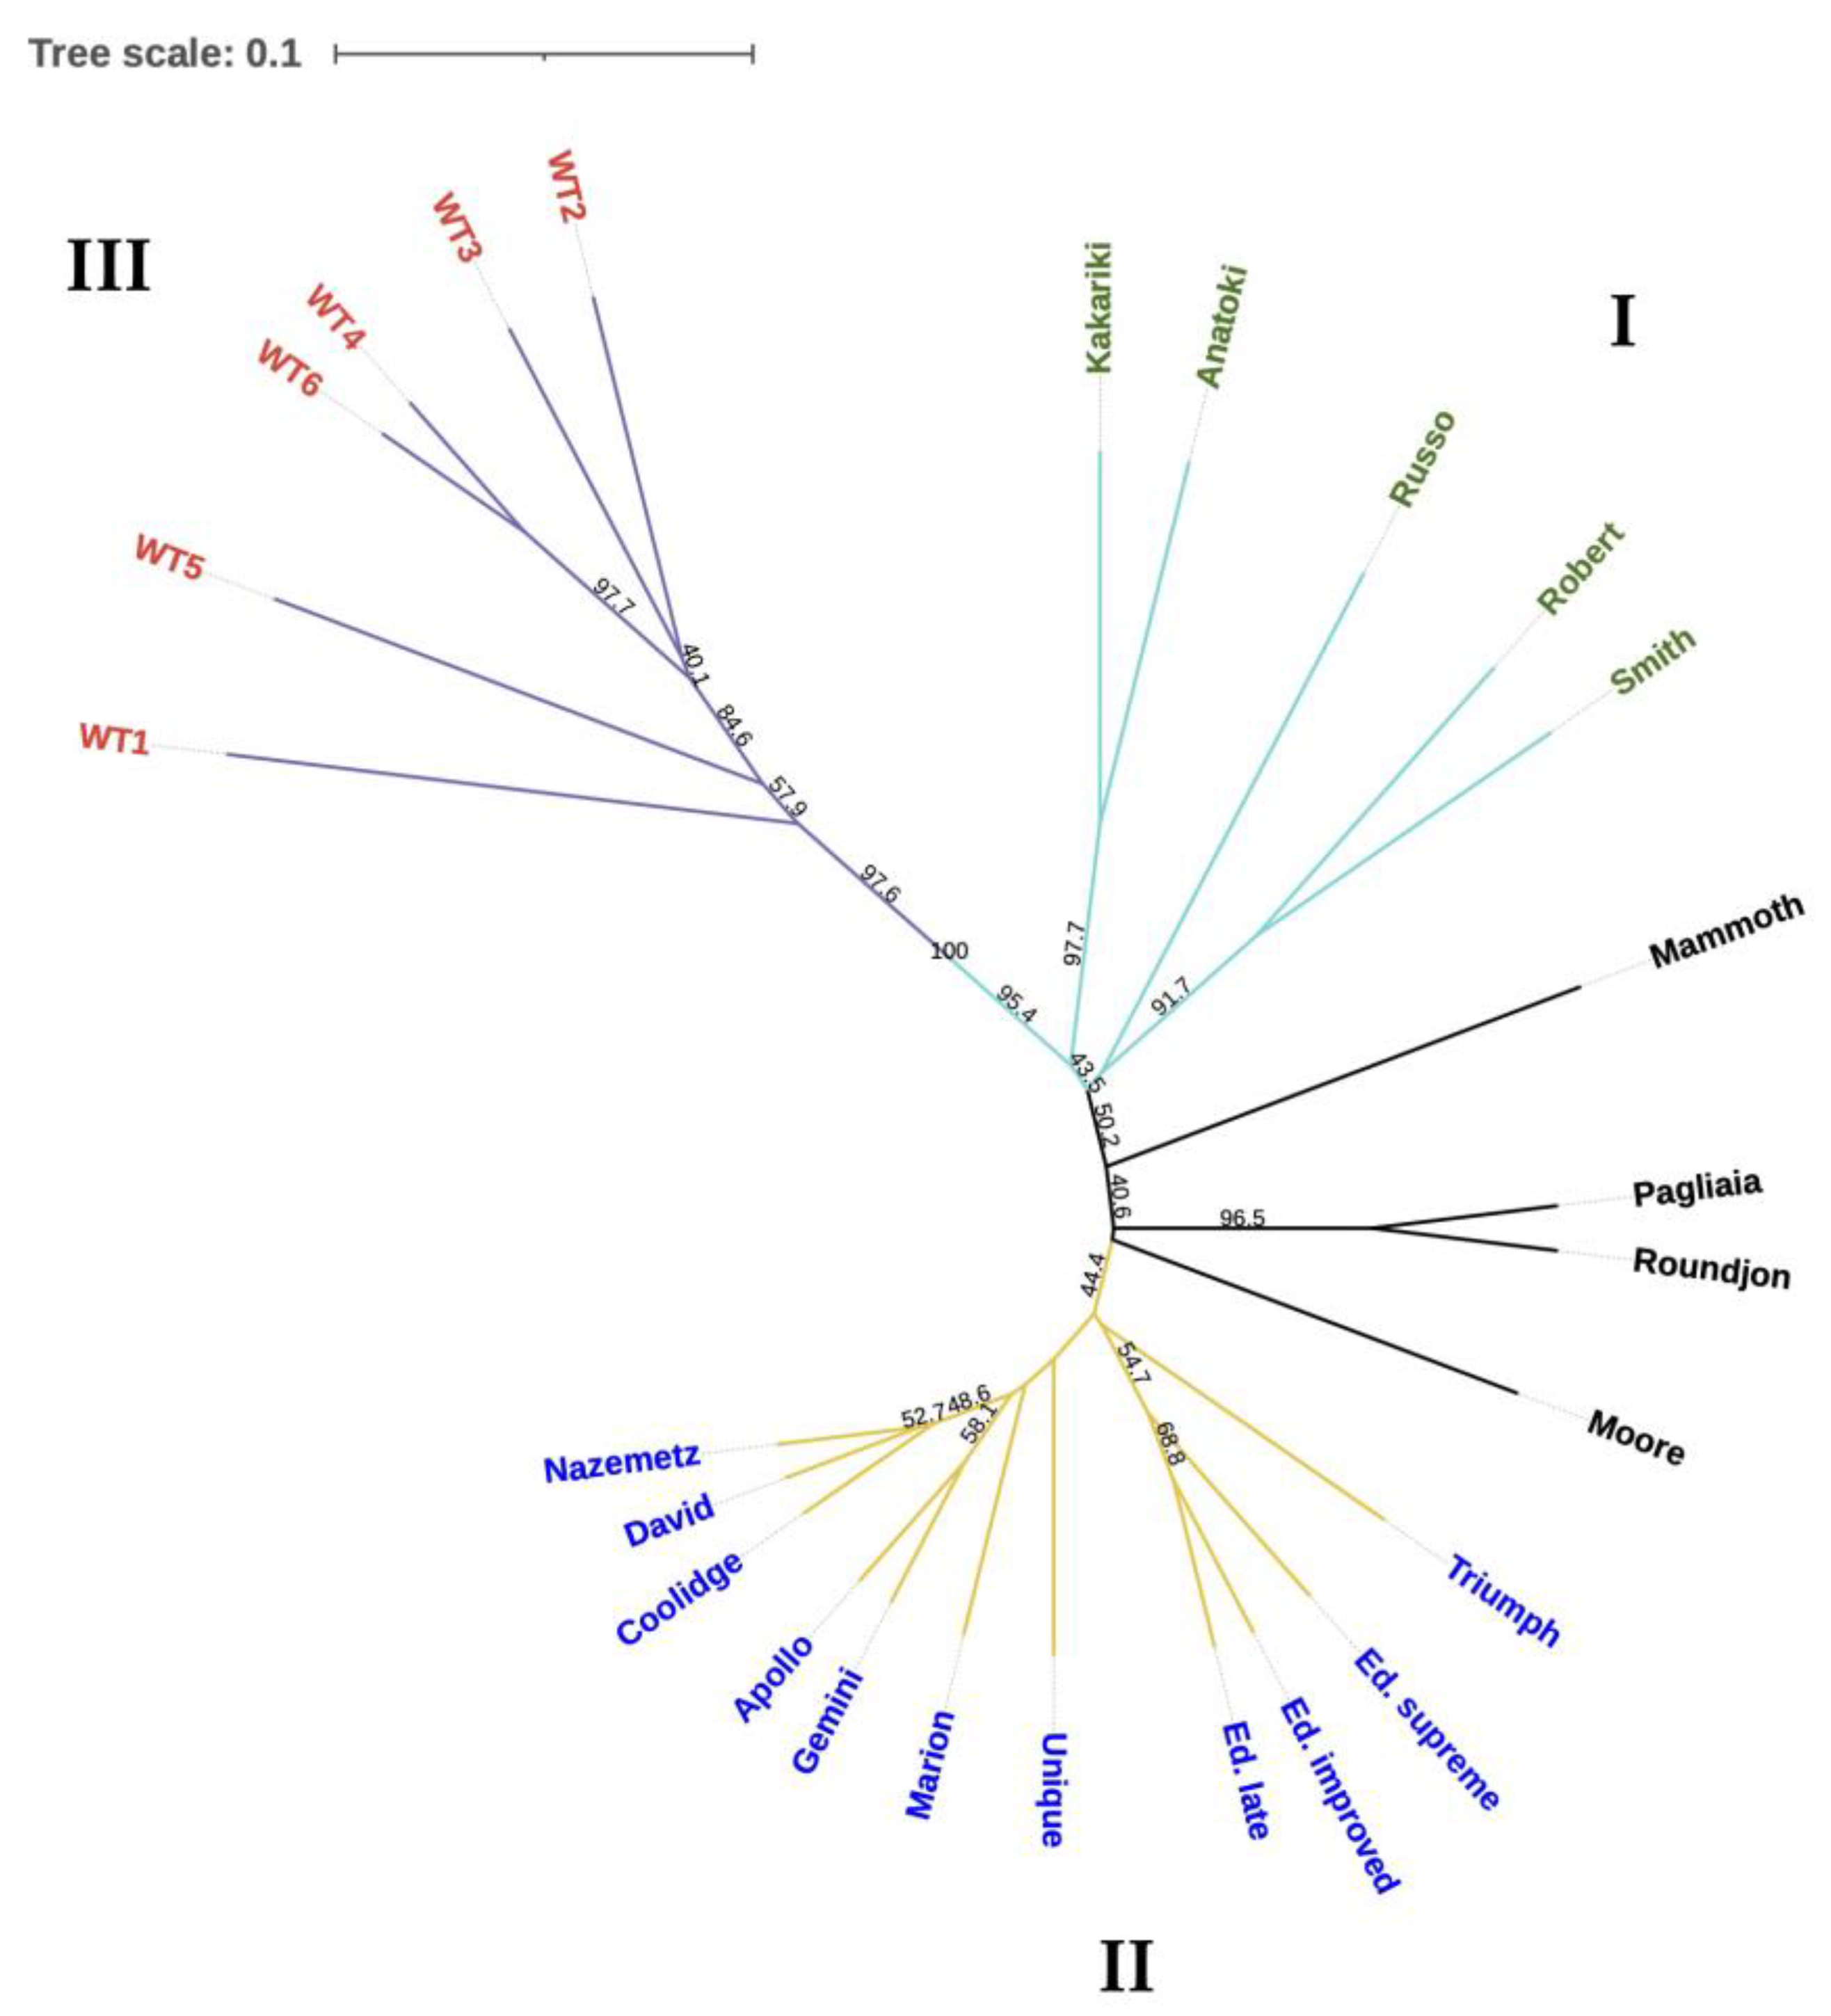
3.3. Population Structure

The analysis of feijoa cultivars and the WTs’ population structure was carried out using the Bayesian software STRUCTURE 2.3.4 [43]. Employing the Evanno method, the optimal K value was determined to be 3 (Figure S1). The subsequent STRUCTURE bar plot affirmed a distinct separation between the WTs and the cultivars (Figure 1). Indeed, all the WT accessions were grouped in Cluster 3 with a coefficient of membership greater than 60%. Conversely, cultivars were categorized into two main clusters. Cluster 1 included 5 accessions (Kakariki, Anatoki, Smith, Russo, Robert), while Cluster 2 encompassed the majority of cultivars (Unique, Nazemetz, David, Coolidge, Edenvale late, Edenvale supreme, Edenvale improved, Apollo, Gemini, Triumph and Marion). The genetic divergence, based on net nucleotide distance, was found to be low between Cluster 1 and 2 (0.0568). In contrast, a more substantial distance was observed when comparing WTs with the two cultivar clusters. Wild types exhibited the highest dissimilarity with Cluster 2 (0.1634), whereas the divergence with Cluster 1 was comparatively lower (0.0979). Notably, certain cultivars (Moore, Mammoth, Roundjon, and Pagliaia) did not neatly align with either cluster, revealing an intermediate genetic profile between the two. Particularly, Moore showed 50.7% of membership with Cluster 2, while Mammoth had 54.0% of membership with Cluster 1.

Clustering Analysis

The validation of STRUCTURE results was corroborated through a cluster analysis utilizing a UPGMA dendrogram based on Provesti distances (Figure 2). The average genetic distance was 0.28, ranging from 0.068 (observed between the pair David and Nazemetz) to 0.506 (detected between Smith and WT3). The clustering pattern derived from Provesti distances aligned with the findings from the STRUCTURE analysis. The cluster III encompassed all WTs, which exhibited greater genetic distance from the cultivars. Consistent with the Bayesian approach, WT1 appeared closer to the commercial cultivar than the other “ancestral” accessions. The second cluster (I) included the same accessions observed in Cluster 1 of the STRUCTURE analysis (Anatoki, Kakariki, Russo, Robert, and Smith). Notably, Anatoki and Kakariki were closely grouped, as were Robert and Smith. As previously noted, this cultivar group demonstrated closer genetic proximity to WTs than the other cluster (II), consisting of Unique, Nazemetz, David, Coolidge, Edenvale late, Edenvale supreme, Edenvale improved, Apollo, Gemini, Triumph, and Marion. Within this group, intriguing associations emerged, such as the grouping of Nazemetz and David with Coolidge, and the proximity of the three Edenvale varieties (i.e., late, improved, and supreme). Moreover, samples (i.e., Moore, Mammoth, Roundjon, and Pagliaia) that exhibited an intermediate profile in the STRUCTURE bar plot (Figure 1) showcased a similar trend in the dendrogram. Specifically, Mammoth was positioned closer to Cluster I, while Moore aligned with Cluster II. As illustrated in the preceding figure, Pagliaia and Roundjon were situated between the other two accessions. The reliability of the dendrogram was confirmed using a good cophenetic correlation (0.85) between Provesti distances and the UPGMA dendrogram.

4. Discussion

Utilizing molecular markers for assessing genetic diversity and relationships within populations is highly advantageous. This method enables the rapid and cost-effective acquisition of numerous polymorphic loci, eliminating the necessity for prior knowledge of the species’ genome [32]. Notably, AFLP has proven to be a powerful technique for identifying cultivars and creating genetic fingerprints, particularly in plants [51,52,53]. Even though AFLPs are dominant markers and may lack the same discriminant power of co-dominant markers such as SRRs or SNPs due to their highly informative multi-allelic loci, this limitation is overcome by their abundant di-allelic loci, covering more regions of the genome [54]. AFLPs find utility in various scenarios: (i) when no initial information about the species is available; (ii) in genomically heterogeneous populations; (iii) in polyploid species; (iv) in the presence of hybridization and (v) with low genetic variability [55,56,57].
The current study is the first attempt to assess the genetic variability in F. sellowiana by employing AFLP molecular markers. The four selected primer sets were capable of amplifying a considerable range of loci, between 40 and 69, which was high considering that fragments were detected in a range of 50–500 bp. Notably, our results were greater than the ones reported by Dettori et al. [25] and Pasquariello et al. [14], who were analyzing the genetic variability of feijoa cultivars using RAPD (8–10 bands) and SRAP (10–19 bands), respectively. The variation in the number of loci can be attributed, in part, to the chosen detection method. While our research employed capillary electrophoresis for fragment detection, the two referenced studies utilized a traditional electrophoresis approach to distinguish bands. Despite this methodological difference, our findings align with other studies using a similar technique [51,58].
Furthermore, the efficacy of this procedure was determined using the percentage of polymorphic loci. Although these primers were not specifically designed for feijoa species and the sample size was limited to 26 individuals, PPB was notable at 69.36%. This surpassed the findings of Lopez- Sepulvelda et al. [36], who used these primer pairs to study two Myrtaceae family species, M. fernandeziana (approximately 58%) and M. schulzei (around 59%), with sample sizes of 211 and 129 accessions, respectively. In the context of the genetic analysis of F. sellowiana species, our PPB values were comparable to those obtained by Pasquariello et al. [14], who observed an average of 73% PPB, employing 10 SRAP primers.
Moreover, the observed genetic diversity, referred to as expected heterozygosity, in feijoa cultivars (0.27) aligned with the average values of within-population diversity reported by Nybom [32], considering a long-lived perennial and outcrossing species. Nybom’s comparison, based on 201 studies on dominant markers, revealed a mean heterozygosity of 0.25 for long-lived perennials and 0.27 for outcrossing species. Thus, our approach stands in line with the majority of studies based on dominant molecular markers, confirming the robust quality and reliability of AFLPs in feijoa.
Nevertheless, our investigation unveils a notable contrast in genetic variability between wild accessions and cultivars. The WTs showed a higher effective number of alleles (1.62), Nei’s genetic diversity (0.37), and Shannon index (0.55), in comparison to the values observed in the 20 cultivars (1.43, 0.27 and 0.43, respectively). This finding clearly shows the existence of a wider genetic divergence among the six Argentinian wild types from a small area of the center of origin than the one observed in the pool of the considered 20 cultivars. These wild accessions belong to naturally occurring populations, consisting of plants growing within mixed ombrophilous forests which are untouched by human activities, thus depending only on natural selection and gene flow. This event is considered the reason for a higher genetic diversity caused by the necessity for a broader range of alleles and genotypes to cope with these selective pressures [28]. Moreover, as stated by Thorp and Bielinski [5], modern feijoas are supposed to derive from the first plants exported outside South America, which are considered as a single narrow population derived from the Uruguayan type which is known to have a lower genetic diversity than the Brazilian one [59]. Moreover, the majority of cultivars were produced using the traditional open pollination procedure, thus originating from a restricted number of cultivars. This approach, which has been used for years, along with the restricted initial genetic resources, may have led to the observed narrow genetic variability among cultivars.
However, we need to highlight that the feijoa selection is quite recent (end of the 19th century) [60], and, in addition to the exiguity of the genetic pool mainly based on the Uruguayan type, it may be another reason for the limited genetic differentiation among varieties. Indeed, a fruit species subjected to domestication for a longer period might induce a continuous selection of new varieties based on morphological characteristics well suited to specific environmental conditions occurring in that era. Then, the commercialization and spreading of these varieties using vegetative propagation methods (cutting, micropropagation, grafting, etc.) will stabilize their genomes. Consequently, the repeating of these procedures throughout the domestication span has led to newly selected cultivars, showcasing advantageous traits, which tend to exhibit greater genetic distances among the others over time. This effect can be observed by comparing the genetic diversity detected in our study with one of another long-lived perennial and outcrossing species such as the olive, whose cultivation dates back to one of the earliest agricultural practices in the Mediterranean basin [61]. Despite the inclusion of several varieties developed worldwide in this study, the identified genetic diversity among feijoa cultivars ranked 0.27, while the genetic diversity values for olive regional cultivars typically fall within the range of 0.32 to 0.40 using AFLP [62,63,64,65].
In any case, exploring the genetic variability of wild accessions of feijoa becomes mandatory for increasing the genetic reservoir as well as identifying the relationship between genetics and agronomic traits. Our research based on AFLPs has demonstrated substantial genetic variability within WTs even in a limited region of collection, underscoring the necessity to expand its areas of investigation.
This study also pinpointed the considerable genetic divergence between WTs and cultivars. The AMOVA and PhiPT values indicated a definite genetic variation among the two populations (39% and 0.392, respectively). Furthermore, these findings evidenced the low gene flow (0.775) between the two groups. As stated by Hutchinson and Templeton [66], a gene flow < 1 stands for a distinct variation among populations which is caused by genetic drift. In this context, the genetic drift and divergence are the consequences of the recent feijoa domestication as well as the mating system.
Despite the lower genetic variability observed in cultivars compared to WTs, our analysis revealed the presence of two distinct clusters using two different methodologies: a Bayesian procedure (STRUCTURE) and clustering analysis (UPGMA dendrogram). Confirming our earlier findings, the WTs exhibited greater genetic distance from cultivars. Interestingly, cultivars themselves formed two separate groups. Nevertheless, the net genetic distance between these two clusters was relatively small (0.0568), as determined using STRUCTURE. This segregation was further supported through the UPGMA dendrogram, which demonstrated a strong cophenetic correlation (85%) with Provesti distances. Comparisons with prior studies [14,25] revealed both similarities and differences. Notably, the three Edenvale cultivars (E. late, E. improved, and E. supreme) exhibited a high genetic association, consistent with previous RAPD analysis by Dettori and Palombi [25]. Similarities between Apollo and Gemini varieties, as observed in our study, align with their findings. Conversely, AFLPs indicated a significant genetic similarity between David and Nazemetz, contrasting with Dettori and Palombi’s [25] report of these cultivars belonging to distinct clusters. However, our findings align with Pasquariello et al.’s [14] study using SRAP. In this context, this distinction between the two groups of cultivars can be considered as the consequence of approximately only one year of selection.
Regardless, our results evidenced a tendency for cultivars produced from various countries to group in the same clusters, consistent with observations from prior studies [14,25]. This supports the notion that domestication might have originated from a singular, restricted population, as previously reported [5,14,25,59].

5. Conclusions

This study is the first assessment of feijoa genetic variability through AFLP markers. The feijoa, used for its fruit characteristics (e.g., nutritional and nutraceutical properties), environmental adaptability, and ornamental purposes, is a crop with an unexplored potential due to the little information about its genetic features, cultivar origin traceability, short fruit shelf-life and the difficulties in vegetative propagation. This study highlights the genetic diversity among globally produced cultivars, indicating a limited divergence when compared to wild samples collected from a confined region in Misiones. Thus, increasing the study areas of wild accessions is advisable for a better knowledge of the feijoa germplasm in its center of origin and the identification of peculiar genetic/morphological traits to enhance the known varieties. In this context, molecular markers play a crucial role in identifying wild accessions with genetic traits that are advantageous to enhance vegetative propagation, fruits (long shelf-life) and flowers (size, shelf-life and appeal), as well as ornamental aspects, all to be integrated into genetic improvement processes.
To achieve this purpose, our research reports that AFLPs are a reliable technique for distinguishing the genetic variability among feijoa cultivars and wild accessions. Thus, AFLPs can be used as a powerful tool to support F. sellowiana selection, also allowing the recognition of potential new accession in breeding programs.
Moreover, a deeper analysis could be performed using advanced techniques such as Next Generation Sequences (NGSs), studying the whole genome and using different molecular markers, such as SNPs.

Supplementary Materials

The following supporting information can be downloaded at: https://www.mdpi.com/article/10.3390/horticulturae10040366/s1, Figure S1: ΔK of the Evanno method representing the best number of population (K = 3).

Author Contributions

Conceptualization, L.B., M.G., S.B. and E.G.; methodology, L.B., M.G., S.B., E.G. and R.N.; software, L.B., M.A.N. and J.M.F.; validation, L.B., M.G., M.A.N., S.B., J.M.F. and R.N.; formal analysis, L.B., M.G., M.A.N., J.M.F. and R.N.; investigation: L.B., M.G., M.A.N. and R.N.; resources, M.A.N., E.G., M.V.L., F.N., A.N. and P.R.; data curation, L.B., M.G., M.A.N., J.M.F. and R.N.; writing—original draft preparation, L.B., M.A.N. and R.N.; writing—review and editing, L.B., M.G., M.A.N., S.B., E.G., M.V.L., F.N., A.N., P.R., J.M.F. and R.N.; supervision, S.B., M.V.L. and E.G.; funding acquisition, M.G., S.B. and E.G. All authors have read and agreed to the published version of the manuscript.

Funding

This research received no external funding.

Data Availability Statement

Data are contained within the article or Supplementary Material.

Acknowledgments

The authors thank ALSIA (Metaponto, Matera, Italy) and Bertrand Labourdette (Uzein, France) for providing plant material for different commercial cultivars.

Conflicts of Interest

The authors declare no conflicts of interest.

References

  1. Weston, R.J. Bioactive Products from Fruit of the Feijoa (Feijoa sellowiana, Myrtaceae): A Review. Food Chem. 2010, 121, 923–926. [Google Scholar] [CrossRef]
  2. Tuncel, N.B.; Yılmaz, N. Optimizing the Extraction of Phenolics and Antioxidants from Feijoa (Feijoa sellowiana, Myrtaceae). J. Food Sci. Technol. 2015, 52, 141–150. [Google Scholar] [CrossRef]
  3. Ramírez, F.; Kallarackal, J. Feijoa [Acca sellowiana (O. Berg) Burret] Pollination: A Review. Sci. Hortic. 2017, 226, 333–341. [Google Scholar] [CrossRef]
  4. Zhu, F. Chemical and Biological Properties of Feijoa (Acca sellowiana). Trends Food Sci. Technol. 2018, 81, 121–131. [Google Scholar] [CrossRef]
  5. Thorp, G.; Bieleski, R. Feijoas: Origins, Cultivars and Uses; David Bateman Ltd.: Auckland, New Zealand, 2002. [Google Scholar]
  6. Álvarez-Herrera, J.G.; Tovar-Escobar, J.; Ruiz, H.D. Postharvest behavior of feijoa fruit (Acca sellowiana Berg) subjected to different 1-MCP doses and storage temperatures. Rev. Bras. Frutic. 2023, 45. Available online: https://www.scielo.br/j/rbf/a/pqCfZWvcMJwpc3TZw9XZxrt/ (accessed on 1 January 2024).
  7. Rupavatharam, S.; East, A.R.; Heyes, J.A. Re-Evaluation of Harvest Timing in ‘Unique’Feijoa Using 1-MCP and Exogenous Ethylene Treatments. Postharvest Biol. Technol. 2015, 99, 152–159. [Google Scholar] [CrossRef]
  8. Oseko, J.; East, A.; Heyes, J. Recent Advances in the Postharvest Technology of Feijoa. Sci. Hortic. 2022, 297, 110969. [Google Scholar] [CrossRef]
  9. Borsuk, L.J.; Saifert, L.; Villamil, J.; Otalora, M.; Mora, F.D.S.; Nodari, R.O. Phenotypic Variability in Feijoa Fruits [Acca sellowiana (O. Berg.) Burret] on Indigenous Lands, Quilombolas Communities and Protected Areas in the South of Brazil. Rev. Bras. Frutic. 2017, 39, e-699. [Google Scholar] [CrossRef]
  10. Thorp, T.G. DSIR’s Feijoa Breeding Programme Goes to South America. Orchard. New Zealand 1988, 61, 213–215. [Google Scholar]
  11. Schotsmans, W.C.; East, A.; Thorp, G.; Woolf, A.B. Feijoa (Acca sellowiana [Berg] Burret). In Postharvest Biology and Technology of Tropical and Subtropical Fruits; Elsevier: Amsterdam, The Netherlands, 2011; pp. 115–135e. [Google Scholar]
  12. Fischer, G.; Miranda Lasprilla, D.C.; Cayón Salinas, G. Cultivo, Poscosecha y Exportación de La Feijoa (Acca sellowiana Berg); Universidad Nacional de Colombia: Bogota, Colombia, 2003. [Google Scholar]
  13. Joel, D.; Thiago, S.O.; Juliano, G.B.; Rubens, O.N. Performance of Segregating Populations of Feijoa Cultivated under the Agroforestry Systems in Southern Brazil. Afr. J. Agric. Res. 2014, 9, 3305–3312. [Google Scholar]
  14. Pasquariello, M.S.; Mastrobuoni, F.; Di Patre, D.; Zampella, L.; Capuano, L.R.; Scortichini, M.; Petriccione, M. Agronomic, Nutraceutical and Molecular Variability of Feijoa (Acca sellowiana (O. Berg) Burret) Germplasm. Sci. Hortic. 2015, 191, 1–9. [Google Scholar] [CrossRef]
  15. Ramírez, F.; Kallarackal, J. Phenological Growth Stages of Feijoa [Acca sellowiana (O. Berg) Burret] According to the BBCH Scale under Tropical Andean Conditions. Sci. Hortic. 2018, 232, 184–190. [Google Scholar] [CrossRef]
  16. Agronet—Agricultural Statistics. Report: Area, Production and National Yield per Cultivation. Ministry of Agriculture, Colombia. Available online: https://www.agronet.gov.co/estadistica/Paginas/home.aspx (accessed on 25 March 2024).
  17. Aitken, A.G.; Hewett, E.W. FreshFacts: New Zealand Horticulture; New Zealand Institute for Plant & Food Research: Auckland, New Zealand, 2016; p. 14. [Google Scholar]
  18. Guerra, M.P.; Cangahuala-Inocente, G.C.; Vesco, L.L.D.; Pescador, R.; Caprestano, C.A. Micropropagation Systems of Feijoa (Acca sellowiana (O. Berg) Burret). Protoc. Micropropag. Sel. Econ. -Important Hortic. Plants 2013, 11013, 45–62. [Google Scholar]
  19. Da Silva, J.C.; Da Silva Tognon, L.; Martins, Y.G.; Louise dos Santos, K.; Picolotto, L.; Araújo, L.; Haygert Lencina, K. Enraizamento de Estacas de Feijoa sellowiana Com Uso de Antioxidante. Agropecuária Catarin. 2023, 36, 42–47. [Google Scholar] [CrossRef]
  20. Vatrano, T.; Amenta, M.; Copetta, A.; Guardo, M.; Nunziata, A.; Strano, M.C.; Petriccione, M. Multifunctional Role of Acca sellowiana from Farm Management to Postharvest Life: A Review. Agronomy 2022, 12, 1802. [Google Scholar] [CrossRef]
  21. Byrne, D.H. Trends in Fruit Breeding. In Fruit Breeding; Springer: New York, NY, USA, 2012; pp. 3–36. [Google Scholar]
  22. Amiteye, S. Basic Concepts and Methodologies of DNA Marker Systems in Plant Molecular Breeding. Heliyon 2021, 7, e08093. [Google Scholar] [CrossRef] [PubMed]
  23. Sánchez-Mora, F.D.; Saifert, L.; Ciotta, M.N.; Ribeiro, H.N.; Petry, V.S.; Rojas-Molina, A.M.; Lopes, M.E.; Lombardi, G.G.; dos Santos, K.L.; Ducroquet, J.P.H.J. Characterization of Phenotypic Diversity of Feijoa Fruits of Germplasm Accessions in Brazil. Agrosystems Geosci. Environ. 2019, 2, 1–11. [Google Scholar] [CrossRef]
  24. Fischer, G.; Parra-Coronado, A. Influence of Some Environmental Factors on the Feijoa (Acca sellowiana [Berg] Burret): A Review. Agron. Colomb. 2020, 38, 388–397. [Google Scholar] [CrossRef]
  25. Dettori, M.T.; Palombi, M.A. Identification of Feijoa sellowiana Berg Accessions by RAPD Markers. Sci. Hortic. 2000, 86, 279–290. [Google Scholar] [CrossRef]
  26. dos Santos, K.L.; Welter, L.J.; Dantas, A.C.d.M.; Guerra, M.P.; Ducroquet, J.P.H.J.; Nodari, R.O. Transference of Microsatellite Markers from Eucalyptus spp to Acca sellowiana and the Successful Use of This Technique in Genetic Characterization. Genet. Mol. Biol. 2007, 30, 73–79. [Google Scholar] [CrossRef]
  27. Santos, K.L.; Santos, M.O.; Laborda, P.R.; Souza, A.P.; Peroni, N.; Nodari, R.O. Isolation and Characterization of Microsatellite Markers in Acca sellowiana (Berg) Burret. Mol. Ecol. Resour. 2008, 8, 1417–1419. [Google Scholar] [CrossRef] [PubMed]
  28. Donazzolo, J.; Stefenon, V.M.; Guerra, M.P.; Nodari, R.O. On Farm Management of Acca sellowiana (Myrtaceae) as a Strategy for Conservation of Species Genetic Diversity. Sci. Hortic. 2020, 259, 108826. [Google Scholar] [CrossRef]
  29. Saifert, L.; Sánchez-Mora, F.D.; Borsuk, L.J.; Donazzolo, J.; da Costa, N.C.F.; Ribeiro, H.N.; Nodari, R.O. Evaluation of the Genetic Diversity in the Feijoa Accessions Maintained at Santa Catarina, Brazil. Crop. Sci. 2020, 60, 345–356. [Google Scholar] [CrossRef]
  30. Quezada, M.; Pastina, M.M.; Ravest, G.; Silva, P.; Vignale, B.; Cabrera, D.; Hinrichsen, P.; Garcia, A.A.F.; Pritsch, C. A First Genetic Map of Acca sellowiana Based on ISSR, AFLP and SSR Markers. Sci. Hortic. 2014, 169, 138–146. [Google Scholar] [CrossRef]
  31. Quezada, M.; Amadeu, R.R.; Vignale, B.; Cabrera, D.; Pritsch, C.; Garcia, A.A.F. Construction of a High-Density Genetic Map of Acca sellowiana (Berg.) Burret, an Outcrossing Species, Based on Two Connected Mapping Populations. Front. Plant. Sci. 2021, 12, 626811. [Google Scholar] [CrossRef] [PubMed]
  32. Nybom, H. Comparison of Different Nuclear DNA Markers for Estimating Intraspecific Genetic Diversity in Plants. Mol. Ecol. 2004, 13, 1143–1155. [Google Scholar] [CrossRef]
  33. Keller, H.A.; Tressens, S.G. New records for Argentina of two multipurpose species: Acca sellowiana (Myrtaceae) and Casearia lasiophylla (Flacourtiaceae). Darwiniana 2007, 45, 204–212. [Google Scholar]
  34. Nuñez, M.; Keller, H.; Pirondo, A. Etnobotánica de Acca sellowiana (Myrtaceae): Una especie de uso múltiple de Misiones, Argentina. Bonplandia 2013, 32.1, 27–37. [Google Scholar] [CrossRef]
  35. Doyle, J.J. Isolation of Plant DNA from Fresh Tissue. Focus 1990, 12, 13–15. [Google Scholar]
  36. López-Sepúlveda, P.; Takayama, K.; Greimler, J.; Peñailillo, P.; Crawford, D.J.; Baeza, M.; Ruiz, E.; Kohl, G.; Tremetsberger, K.; Gatica, A. Genetic Variation (AFLPs and Nuclear Microsatellites) in Two Anagenetically Derived Endemic Species of Myrceugenia (Myrtaceae) on the Juan Fernández Islands, Chile. Am. J. Bot. 2013, 100, 722–734. [Google Scholar] [CrossRef]
  37. Coppi, A.; Cecchi, L.; Mengoni, A.; Pustahija, F.; Tomović, G.; Selvi, F. Low Genetic Diversity and Contrasting Patterns of Differentiation in the Two Monotypic Genera Halacsya and Paramoltkia (Boraginaceae) Endemic to the Balkan Serpentines. Flora-Morphol. Distrib. Funct. Ecol. Plants 2014, 209, 5–14. [Google Scholar] [CrossRef]
  38. Vos, P.; Hogers, R.; Bleeker, M.; Reijans, M.; van de Lee, T.; Hornes, M.; Friters, A.; Pot, J.; Paleman, J.; Kuiper, M. AFLP: A New Technique for DNA Fingerprinting. Nucleic Acids Res. 1995, 23, 4407–4414. [Google Scholar] [CrossRef]
  39. Coppi, A.; Lastrucci, L.; Cappelletti, D.; Cerri, M.; Ferranti, F.; Ferri, V.; Foggi, B.; Gigante, D.; Venanzoni, R.; Viciani, D. AFLP Approach Reveals Variability in Phragmites australis: Implications for Its Die-Back and Evidence for Genotoxic Effects. Front. Plant Sci. 2018, 9, 386. [Google Scholar] [CrossRef] [PubMed]
  40. Meudt, H.M.; Clarke, A.C. Almost Forgotten or Latest Practice? AFLP Applications, Analyses and Advances. Trends Plant. Sci. 2007, 12, 106–117. [Google Scholar] [CrossRef] [PubMed]
  41. Yeh, F.C. POPGENE (Version 1.3. 1). Microsoft Window-Bases Freeware for Population Genetic Analysis. 1999. Available online: http://www.ualberta.ca/~fyeh/ (accessed on 16 January 2024).
  42. Peakall, R.O.D.; Smouse, P.E. GENALEX 6: Genetic Analysis in Excel. Population Genetic Software for Teaching and Research. Mol. Ecol. Notes 2006, 6, 288–295. [Google Scholar] [CrossRef]
  43. Pritchard, J.K.; Stephens, M.; Donnelly, P. Inference of Population Structure Using Multilocus Genotype Data. Genetics 2000, 155, 945–959. [Google Scholar] [CrossRef] [PubMed]
  44. Earl, D.A.; VonHoldt, B.M. Structure Harvester: A Website and Program for Visualizing Structure Output and Implementing the Evanno Method. Conserv. Genet. Resour. 2012, 4, 359–361. [Google Scholar] [CrossRef]
  45. Evanno, G.; Regnaut, S.; Goudet, J. Detecting the Number of Clusters of Individuals Using the Software Structure: A Simulation Study. Mol. Ecol. 2005, 14, 2611–2620. [Google Scholar] [CrossRef] [PubMed]
  46. Francis, R.M. Pophelper: An R Package and Web App to Analyse and Visualize Population Structure. Mol. Ecol. Resour. 2017, 17, 27–32. [Google Scholar] [CrossRef]
  47. Jombart, T. Adegenet: A R Package for the Multivariate Analysis of Genetic Markers. Bioinformatics 2008, 24, 1403–1405. [Google Scholar] [CrossRef]
  48. Kamvar, Z.N.; Tabima, J.F.; Grünwald, N.J. Poppr: An R Package for Genetic Analysis of Populations with Clonal, Partially Clonal, and/or Sexual Reproduction. PeerJ 2014, 2, e281. [Google Scholar] [CrossRef]
  49. R Core Team. R: A Language and Environment for Statistical Computing; R Foundation for Statistical Computing: Vienna, Austria, 2013. [Google Scholar]
  50. Letunic, I.; Bork, P. Interactive Tree of Life (ITOL) v5: An Online Tool for Phylogenetic Tree Display and Annotation. Nucleic Acids Res. 2021, 49, W293–W296. [Google Scholar] [CrossRef] [PubMed]
  51. Sensi, E.; Vignani, R.; Scali, M.; Masi, E.; Cresti, M. DNA Fingerprinting and Genetic Relatedness among Cultivated Varieties of Olea europaea L. Estimated by AFLP Analysis. Sci. Hortic. 2003, 97, 379–388. [Google Scholar] [CrossRef]
  52. Gao, J.; Zhang, Y.; Wang, C.; Zhang, S.; Qi, L.; Song, W. AFLP Fingerprinting of Populus deltoides and Populus × canadensis Elite Accessions. New For. 2009, 37, 333–344. [Google Scholar] [CrossRef]
  53. Christensen, S.; von Bothmer, R.; Poulsen, G.; Maggioni, L.; Phillip, M.; Andersen, B.A.; Jørgensen, R.B. AFLP Analysis of Genetic Diversity in Leafy Kale (Brassica oleracea L. Convar. Acephala (DC.) Alef.) Landraces, Cultivars and Wild Populations in Europe. Genet. Resour. Crop. Evol. 2011, 58, 657–666. [Google Scholar] [CrossRef]
  54. Campbell, D.; Duchesne, P.; Bernatchez, L. AFLP Utility for Population Assignment Studies: Analytical Investigation and Empirical Comparison with Microsatellites. Mol. Ecol. 2003, 12, 1979–1991. [Google Scholar] [CrossRef]
  55. Mueller, U.G.; Wolfenbarger, L.L. AFLP Genotyping and Fingerprinting. Trends Ecol. Evol. 1999, 14, 389–394. [Google Scholar] [CrossRef] [PubMed]
  56. Schlötterer, C. The Evolution of Molecular Markers—Just a Matter of Fashion? Nat. Rev. Genet. 2004, 5, 63–69. [Google Scholar] [CrossRef]
  57. Bensch, S.; Åkesson, M. Ten Years of AFLP in Ecology and Evolution: Why so Few Animals? Mol. Ecol. 2005, 14, 2899–2914. [Google Scholar] [CrossRef]
  58. Torres, M.M.; Pierantozzi, P.; Cáceres, M.E.; Labombarda, P.; Fontanazza, G.; Maestri, D.M. Genetic and Chemical Assessment of Arbequina Olive Cultivar Grown in Córdoba Province, Argentina. J. Sci. Food Agric. 2009, 89, 523–530. [Google Scholar] [CrossRef]
  59. Nodari, R.O.; Guerra, M.P.; Meler, K.; Ducroquet, J.P. Genetic Variability of Feijoa sellowiana Germplasm. Acta Hortic. 1997, 452, 41–46. [Google Scholar] [CrossRef]
  60. Sharpe, R.H.; Sherman, W.B.; Miller, E.P. Feijoa history and improvement. Proc. Fla. State Hort. Soc. 1993, 106, 134–139. [Google Scholar]
  61. Besnard, G.; Terral, J.-F.; Cornille, A. On the Origins and Domestication of the Olive: A Review and Perspectives. Ann. Bot. 2018, 121, 385–403. [Google Scholar] [CrossRef] [PubMed]
  62. Sanz-Cortés, F.; Parfitt, D.E.; Romero, C.; Struss, D.; Llácer, G.; Badenes, M.L. Intraspecific Olive Diversity Assessed with AFLP. Plant Breed. 2003, 122, 173–177. [Google Scholar] [CrossRef]
  63. Bandelj, D.; Jakše, J.; Javornik, B. Assessment of Genetic Variability of Olive Varieties by Microsatellite and AFLP Markers. Euphytica 2004, 136, 93–102. [Google Scholar] [CrossRef]
  64. Grati-Kamoun, N.; Mahmoud, F.L.; Rebaï, A.; Gargouri, A.; Panaud, O.; Saar, A. Genetic Diversity of Tunisian Olive Tree (Olea europaea L.) Cultivars Assessed by AFLP Markers. Genet. Resour. Crop. Evol. 2006, 53, 265–275. [Google Scholar] [CrossRef]
  65. Corrado, G.; la Mura, M.; Ambrosino, O.; Pugliano, G.; Varricchio, P.; Rao, R. Relationships of Campanian Olive Cultivars: Comparative Analysis of Molecular and Phenotypic Data. Genome 2009, 52, 692–700. [Google Scholar] [CrossRef]
  66. Hutchison, D.W.; Templeton, A.R. Correlation of Pairwise Genetic and Geographic Distance Measures: Inferring the Relative Influences of Gene Flow and Drift on the Distribution of Genetic Variability. Evolution 1999, 53, 1898–1914. [Google Scholar] [CrossRef]
Figure 1. Bar plot showing the three clusters predicted using the STRUCTURE software 2.3.4, where each distinct color corresponds to the membership coefficient of the 26 feijoa accessions (cultivars and WTs). Ed = Edenvale.
Horticulturae 10 00366 g001
Figure 2. UPGMA dendrogram representing the clustering of feijoa cultivars and wild types according to Provesti distances. I, II, III and distinct colors of accessions identify the three clusters, while branches are colored to highlight groups. The black-colored accessions are the ones with an undefined group.
Horticulturae 10 00366 g002
Table 1. Feijoa cultivars, germplasm location, and their country of origin.
Accession of GenotypeCollection SiteCountry of Origin
WT1Misiones (AR)Argentina
WT2Misiones (AR)Argentina
WT3Misiones (AR)Argentina
WT4Misiones (AR)Argentina
WT5Misiones (AR)Argentina
WT6Misiones (AR)Argentina
MooreALSIA (IT)Unknown
NazemetzCREA-OFA-Caserta (IT)USA
RoundjonCREA-OFA-Caserta (IT)New Zealand
PagliaiaCREA-OFA-Caserta (IT)Italy
CoolidgeCREA-OFA-Caserta (IT)USA
MammouthCREA-OFA-Caserta (IT)New Zealand
DavidCREA-OFA-Caserta (IT)New Zealand
SmithCREA-OFA-Caserta (IT)USA
RussoCREA-OFA-Caserta (IT)Italy
RobertCREA-OFA-Caserta (IT)New Zealand
ApolloCREA-OFA-Caserta (IT)New Zealand
GeminiCREA-OFA-Caserta (IT)New Zealand
TriumphCREA-OFA-Caserta (IT)New Zealand
Edenvale ImprovedCREA-OFA-Caserta (IT)USA
Edenvale SupremeCREA-OFA-Caserta (IT)USA
Edenvale LateCREA-OFA-Caserta (IT)USA
MarionCREA-OFA-Caserta (IT)New Zealand
KakarikiUzein (FR)New Zealand
UniqueUzein (FR)New Zealand
AnatokiUzein (FR)New Zealand
Table 2. Primers name, primers sequence, selective extension, and fluorescent labeling.
Oligo NameSequence 5′–3′LabelingRefs.
Adapt. EcoRI_2AATTGGTACGCAGTCTAC
Adapt. MseI_1GACGATGAGTCCTGAG
Adapt. MseI_2TACTCAGGACTCAT
Primer pair 1EcoRI–ACG/MseI–CTCHEX[37]
Primer pair 2EcoRI–ACT/MseI–CTTFAM[36]
Primer pair 3EcoRI–ATG/MseI–CTTFAM[36]
Primer pair 4EcoRI–ATG/MseI–CTGFAM[36]
Table 3. Genetic parameters according to the four AFLP primer sets used in this study. The number of total and polymorphic loci, the percentage of polymorphic loci (PPB), the effective number of alleles (ne), Nei’s genetic diversity (h) and the Shannon index (I) are reported.
PrimersN. Total LociN. Polymorphic LociPPBnehI
EcoRI–ACG/MseI–CTC40.0027.0067.50%1.410.260.41
EcoRI–ACT/MseI–CTT53.0036.0067.92%1.410.260.42
EcoRI–ATG/MseI–CTT69.0051.0073.91%1.420.260.42
EcoRI–ATG/MseI–CTG47.0032.0068.09%1.490.300.46
Table 4. Genetic parameters comparing feijoa cultivars and wild types. The sample size, the number of polymorphic loci, the effective number of alleles (ne), Nei’s genetic diversity (h) and the Shannon index (I) are reported.
GroupSample SizeN. Polymorphic LocinehI
Cultivars20.001151.430.270.43
WT6.00751.620.370.55
Table 5. Analysis of the molecular variance (AMOVA), PhiPT and Nm between the two feijoa populations considered.
SourcedfSSMSEst. Var.%PhiPTNm
Among Pops1114.985114.98510.66539%
Within Pops24396.90016.53816.53861%
Total25511.885 27.203100%0.392 ***0.775
*** p-value < 0.001.
Disclaimer/Publisher’s Note: The statements, opinions and data contained in all publications are solely those of the individual author(s) and contributor(s) and not of MDPI and/or the editor(s). MDPI and/or the editor(s) disclaim responsibility for any injury to people or property resulting from any ideas, methods, instructions or products referred to in the content.

