Article

The AnUFGT1 Is Involved in the Anthurium ‘Alabama’ Anthocyanidin Deficiency

1
Institute of Tropical Crop Genetic Resources, Chinese Academy of Tropical Agricultural Sciences, Haikou 571701, China
2
Ministry of Agriculture Key Laboratory of Crop Gene Resources and Germplasm Enhancement in Southern China, Danzhou 571700, China
3
Hainan Province Key Laboratory of Tropical Crops Germplasm Resources Genetic Improvement and Innovation, National Gene Bank of Tropical Crops, Danzhou 571700, China
*
Author to whom correspondence should be addressed.
These authors contributed equally to this work.
Horticulturae 2024, 10(4), 369; https://doi.org/10.3390/horticulturae10040369
Submission received: 26 February 2024 / Revised: 29 March 2024 / Accepted: 3 April 2024 / Published: 6 April 2024
(This article belongs to the Section Genetics, Genomics, Breeding, and Biotechnology (G2B2))

Abstract

:
Anthurium is the second largest tropical flower crop in the world. The international market has urgent demand for anthurium varieties with different spathe colors, which mainly arises from the types and contents of anthocyanin. The flavonoid 3-O-glycosyltransferase (UF3GT) gene is the key enzyme involved in promoting anthocyanin accumulation through glycosylation downstream of the anthocyanin synthesis pathway (ASP). Abnormal functioning of UFGT usually results in a reduction in or loss of anthocyanins. The aim of this study was to reveal the role of one anthurium UFGT gene (AnUFGT1) in ‘Xueyu’ (X), an anthocyanin-deficient mutant of ‘Alabama’. Metabolome analysis was used to analyze the metabolic products in the ASP to determine the possible key link of the anthocyanin deletion mutation. Agrobacterium-mediated transformation of Arabidopsis UFGT functionally deficient mutant (ufgt) and ‘X’ validated the function of AnUFGT1. The results of comparative metabolome analysis of ‘X’ and ‘Alabama’ showed that there was no significant difference in product levels upstream of ASP. The expression levels of AnUFGT1 were significantly greater in ‘Alabama’ than in ‘X’. The overexpression of AnUFGT1 in ufgt significantly increased its anthocyanin contents. The overexpression of AnUFGT1 in ‘X’, mediated by a new injection method, can only promote the synthesis of trace anthocyanins. These results showed that AnUFGT1 could fully compensate the phenotype of ufgt, but only partially compensate the anthocyanidin-deficient phenotype of anthurium mutant X. This difference suggested that anthocyanin-deletion mutations in anthurium ‘X’ are associated with AnUFGT1, but AnUFGT1 is not the only factor. There should be other factors interacting with AnUFGT1 that cause anthocyanin deficiency.

1. Introduction

Anthurium is an attractive and commercially popular ornamental plant. The trade value of anthurium is second only to that of tropical orchids among the tropical flowers. Its brilliantly colored, heart-shaped spathe is important for viewing. Anthurium ‘Alabama’ is a traditional red variety. Its spathe color is bright red. The young leaves, bracts, and bare roots are red to varying degrees because of the presence of anthocyanins. ‘Xueyu’ (‘X’), a tissue culture mutant of ‘Alabama’, is a white variety. The spathe is white, and the leaves, bracts and bare roots are all green. Previous research indicated that there were three main kinds of anthocyanidins in the ‘Alabama’ spathe, leaf, and petiole: anthocyanidin-rutinoside, pelargonidin-rutinoside, and peonidin-rutinoside. However, in ‘X’, apart from the presence of trace amounts of anthocyanidin-rutinoside in the petiole, no anthocyanidins were detected in the spathe, leaf, or petiole [1]. The establishment of an Arabidopsis mutant library provides an ideal material for the study of gene function. Mutants in other plants are also ideal model materials for studying the function of genes in plants and transgenic breeding [2,3,4].
Anthocyanin deletion mutations are widespread in plants. Mutations in structural genes in the ASP can disrupt the red floral pigmentation. The structural genes involved in the ASP are chalxone synthase gene (CHS), chalcone isomerase gene (CHI), flavanone-3-hydroxylase (F3H), dihydroflavonol-4-reductase gene (DFR), anthocyanidin syntheses gene (ANS), UDP glucose-flavonoid 3-O-glcosyl-transferase gene (UFGT), etc. [4]. Functional deletion of BoNAnza1, the homologous gene of dihydroflavonol-4-reductase (DFR-like) protein, was found to result in anthocyanin deletion in cabbage [5]. An insertion and an SNP in the coding region of ANS gene in pomegranate resulted in no anthocyanin accumulation, forming “white” pomegranate [2]. A green stem mutant of red stem strawberry ‘Ruegen’ was found to be caused by FvDFR2 mutation [6]. Mutations in the sequence of DFR resulted in the absence of anthocyanins and proanthocyanins of barley [7]. One single-base deletion in the flavonoid 3′-hydroxylase (F3′H) gene which represents the T gene of soybean controls gray pubescence color [8]. Studies on white and green spathes showed that the decreased expression of transcription factor AaMYB2 and increased expression of AaLAR (leucoanthocyanidin reductase) and AaANR (anthocyanidin reductase) were accompanied with the accumulation of colorless proanthocyanidin, thus the white spathe [9]. The structural gene UFGT functions as the final structural gene in ASP to catalyze the 3-O-glucosylation of anthocyanidins in the anthocyanin biosynthesis pathway [4]. It converts unstable anthocyanins to stable anthocyanins. The anthocyanin accumulation is associated with the expression of the UFGT gene in kiwifruit (Actinidia chinensis) [10], island Scutellaria [11], Japanese apricot (Prunus mume Sieb. et Zucc.) [12], and sweet potato (Impomoea batatas L.) [13,14]. The abnormal function of UFGT gene can easily lead to the loss of anthocyanin. Frameshift mutation was characterized in the UFGT in Japanese and the common morning glory (I. purpurea), which caused about an 80% reduction in anthocyanin accumulation [15]. By comparing dark blue with white myrtle berries and light with dark red plums, researchers found that the PAL, CHI, DFR, and UFGT enzyme levels were greater in fruits with greater anthocyanin content [16,17]. Seven non-sense mutations occurred in the coding region of two alleles of PmUFGT3, resulting in the generation of green skin phenotype from red skin phenotype of Japanese apricots [12]. Genome-transcriptome transition approaches showed that the expression of more than 10 UFGTs in purple wheat was significantly greater than that in white wheat [18]. A comparative transcriptome analysis showed that the expression level of UFGT and AN2 in ‘X’ was significantly decreased [19].
In order to reveal the main structural gene and its role in the mutation of ‘X’, the metabolites from the ASP of ‘Alabama’ and ‘X’ were identified by metabolome analysis. A comparison of these metabolites of ASP between ‘Alabama’ and ‘X’ showed that the upstream metabolites of ASP were not significantly different between the two anthuriums. The indicated that the functional genes regulating the synthesis of these products were normal. Therefore, ‘X’ anthocyanin deficiency should occur downstream of ASP. The key structural gene downstream is UFGT. The anthurium UFGT gene AnUFGT1 was isolated from ‘Alabama’ and highly expressed in pigment tissues of ‘Alabama’. The AnUFGT enzyme activity was also greater in the wild type ‘Alabama’ than in the mutant ‘X’. The overexpression of AnUFGT1 in the Arabidopsis UFGT mutant (ufgt) can completely compensate for the anthocyanin-deficient phenotype of ufgt. Transient expression of the AnUFGT1 gene in ‘X’ also confirmed that AnUFGT1 could induce anthocyanin synthesis in the spathe of the anthocyanin-deficient mutant, although it did not completely compensate for the anthocyanin deficient phenotype of ‘X’.

2. Materials and Methods

2.1. Plant Materials and Sample Preparation

The anthurium variety ‘Alabama’ and its anthocyanin-deficient mutant ‘Xueyu’ (CAN20090270.0) used in this study were planted in a greenhouse located at an experimental site at the Institute of Tropical Crop Genetic Resources, Chinese Academy of Tropical Agricultural Sciences (CATAS). Images of the wild type and mutant anthurium strains are shown in Figures S1 and S2. The development of the spathe is divided into 5 stages: S1—the flower has not yet protruded from its sheath, but the base of the sheath has been opened by the flower, and part of the bud can be seen; S2—the flower is first visible; S3—the bud does not unfold, and the stalk begins to extend, but it does not exceed the length of the bud; S4—the bud is not unfolded, and the stalk is obviously elongated; S5—the spathe is just open. And the leaf development stages are as follows: S1—the leaf has not yet protruded from its sheath; S2—the leaf is first visible; S3—the leaf is half unfolded; S4—the leaf is just fully expanded, but the color has not changed; S5—the leaf is completely expanded and turn dark green.
Metabolome analysis was commissioned by Igenebook company. For metabolomics analysis, the spathes from ‘Alabama’ and ‘X’ were freeze-dried by a vacuum freeze-dryer. The freeze-dried sample was crushed using a mixer mill (MM 400, Germany Retsch China headquarters, Shanghai, China) with zirconia beads for 1.5 min at 30 Hz. Then, 100 mg of lyophilized powder was dissolved in 1.2 mL of 70% methanol solution, vortexed for 30 s every 30 min (6 times in total), and placed in a refrigerator at 4 °C overnight. Following centrifugation at 12,000 rpm for 10 min, the extracts were filtered (SCAA-104, 0.22 μm pore size; ANPEL, Shanghai, China; http://www.anpel.com.cn/) before UPLC–MS/MS analysis.
For gene cloning, tissue-specific expression, and enzyme activity analysis, different tissue samples, including leaves, spathes, roots, pedicels, and spadices, were collected and immediately frozen in liquid nitrogen for further analysis.
Arabidopsis thaliana seeds of both the WT (Columbia ecotype) and ufgt plants were planted in an artificial climate chamber at a temperature of 22 °C, humidity of 70%, light intensity of 120 μmol m−2 s−1, and light duration of 16 h.

2.2. Metabolomics Analysis

The spathes of the S3 stage from ‘Alabama’ and ‘X’ were collected, respectively. For metabolomics analysis, ten individual spathes were mixed as one biological replicate. ‘Alabama’ and ‘X’ were each set 3 biological replicates. The sample extracts were analyzed using a UPLC–ESI–MS/MS system (UPLC, SHIMADZU Nexera X2, www.shimadzu.com.cn/; MS, Applied Biosystems 4500 Q TRAP, www.appliedbiosystems.com.cn/). LIT and triple quadrupole (QQQ) scans were acquired on a triple quadrupole-linear ion trap mass spectrometer (Q TRAP), AB4500 Q TRAP UPLC/MS/MS System, equipped with an ESI Turbo Ion-Spray interface, operating in positive and negative ion modes and controlled by Analyst 1.6.3 software (AB Sciex, Beijing, China). Unsupervised principal component analysis (PCA) was performed by the statistics function prcomp within R (www.r-project.org, accessed on 2 February 2021).

2.3. Extraction and Determination of Anthocyanin Content

The content of anthocyanin was determined by ultraviolet spectrophotometry.
Standard anthocyanin solutions of 28.0 µg/mL, 11.2 µg/mL, 5.60 µg/mL, 2.80 µg/mL, and 0 µg/mL were prepared with standard samples of cyanidin and pelargonidin and 0.1% hydrochloric methanol solution (methanol contain 0.1% v/v hydrochloric) as blank control. The ultraviolet spectrophotometer was used to measure the absorbance at the maximum absorption wavelength of 530 nm, parallel for 3 times, and draw a standard curve.
The leaf or spathe were grinded in liquid nitrogen, added 5 mL 0.1% hydrochloric methanol solution, vortexed 20 s for 5 times, standing for 1 min, vortexed again and centrifuged for 10 min at 4 °C, 12,000 g. Take 300 µL supernatant, 200 µL ultra-pure water, and 500 µL chloroform, and vortex for 1 min; take supernatant and dilute it with equal volume of 0.1% hydrochloric methanol solution. The value at 530 nm was measured by ultraviolet spectrophotometer, parallel for 3 times; the absorption value was substituted into the standard curve equation to calculate the content of anthocyanins in the tissue.
This analysis set up three biological replicates.

2.4. Isolation of the AnUFGT1 Gene

A total of 0.2 g of leaves of ‘Alabama’ was ground in liquid nitrogen, and total RNA was extracted by the CTAB method [20]. The integrity, purity, and concentration of the RNA were determined by agarose electrophoresis and ultraviolet spectrophotometry. The PrimeScriptTM RT Reagent Kit with gDNA Eraser (Takara, Dalian, China) was used to reverse transcribe RNA to cDNA. Using cDNA as a template, the specific full-length primers AnUFGT1-F (5′-CATCGCCTGCTCCGCC-3′) and AnUFGT1-R (5′-CAAACTCGGACAAACTACGCC-3′) were designed according to the anthurium transcriptome sequence and used for amplification. The PCR mixture contained 10 µL of Premix Ex Taq, 1 µL of cDNA, 0.5 µL 10 mM of forward primer, 0.5 µL 10 mM of reverse primer, and 8 µL of ddH2O. The PCR procedure was carried out as follows: 94 °C for 5 min, followed by 35 cycles of amplification (94 °C for 30 s, 60 °C for 30 s, and 72 °C for 2 min) and incubation at 72 °C for 10 min. The amplified products were subjected to agarose gel electrophoresis. The target strip was cut, purified (OMEGA, Gel Extraction Kit D2500, Shanghai Yubo biotechanology CO., Ltd., Shanghai, China), subcloned, and inserted into pEASY-T1 vectors and sent to TianYi Hui Yuan Company for sequencing. After sequence comparison, the UFGT gene sequence consistent with that in the anthurium transcriptome was selected and named AnUFGT1.

2.5. Bioinformatics Analysis of AnUFGT1

Comparative analyses of AnUFGT1 were carried out online via the website BLAST (https://blast.ncbi.nlm.nih.gov/Blast.cgi, accessed on 3 March 2022). Homology analysis was performed using DNAMAN software (5.0). Bioinformatics analyses of AnUFGT1 were performed using the online analysis software ExPASy (https://www.expasy.org/proteomics, accessed on 3 March 2022). MEGA 6.0 software was used to construct the phylogenetic tree of AnUFGT1. Another online software package, MEME, was used to predict the functional domain of AnUFGT1 (http://memesuite.org/doc/overview.html, accessed on 3 March 2022).

2.6. AnUFGT1 Expression Characteristics and Enzyme Activity Analysis

To investigate AnUFGT1 expression in different tissues (roots, pedicels, spathes, leaves, and spadices) and at different growth stages, the AnUFGT1 gene was used as a target gene, and β-actin was used as an internal control. The forward and reverse primers were designed according to the principles of real-time quantitative PCR (qRT–PCR) primer design to amplify these genes. The sequences of the PCR primers are shown in Table S1. The reference gene used in this study is β-actin, which we have used in the analysis of anthurium [19].
To investigate AnUFGT1 expression, qRT–PCR was conducted according to the instructions of the Trans Start Tip Green qPCR Super Mix Kit (Takara, Dalian, China). The mixture contained 1 µL of cDNA, 5 µL of 2× TransStart Tip Green qPCR SuperMix, 0.3 µL 10 mM forward primer, 0.3 µL 10 mM reverse primer, and nuclease-free H2O up to 10 µL. The amplifications were performed in Applied Biosystems QuantStudio 3 using ChamQ Universal SYBR qPCR Master Mix under the following conditions: 95 °C for 7 min, followed by 40 cycles of amplification (94 °C for 5 s, 60 °C for 30 s, and 62 °C for 30 s) and incubation at 94 °C for 2 min. After the amplification, the dissolution curve and amplification curve of real-time PCR were generated, and the expression level was calculated by the 2−ΔΔCT method [21]. A total of 3 biological replicates were used in this experiment.
For enzyme activity detection, spathes of ‘Alabama’ and ‘X’ at growth stage 3 were selected. The AnUFGT enzyme activity was detected by using the Plant UFGT ELISA Kit (Jianglai Biotechnology, Shanghai, China). A total of 3 biological replicates were set for detection of AnUFGT enzyme activity.

2.7. Transform Solution of Agrobacterium Containing AnUFGT1

The primers AnUFGT1-FK (5′-CAAACTCGGACAAACTACGCC-3′) and AnUFGT1-RX (5′-GCTCTAGACAAACTCGGACAAACTACGCC-3′) were designed to amplify AnUFGT1 whole cDNA sequence with cleavage sites for the restriction enzymes KpnI and XbaI. The mixture contained 10 µL 10 mM Primer STAR Max Premix (2×), 1 µL of cDNA solution, 0.5 µL 10 mM each of the forward primer and reverse primer, and 8 µL of ddH2O. The PCR procedure was carried out as follows: 98 °C for 4 min, followed by 35 cycles of amplification (98 °C for 10 s, 60.5 °C for 5 s, and 72 °C for 1.5 min) and incubation at 72 °C for 10 min. After double-enzyme hydrolysis, agarose-coagulated electrophoresis, and target band recovery, the product was inserted into the pBI121 expression vector and finally transformed into Agrobacterium tumefaciens strain EHA105. The positive strains were stored at −80 °C with glycerol. Before transformation, the 35S::AnUFGT1-positive strains were activated and then cultured to 50–100 mL, and then centrifuged, and the bacterial cells were collected and then resuspended in LB liquid media supplemented with 5% sucrose and 0.02% Silwet77, after which the OD600 was adjusted to 0.5–0.8. This transformation solution can be used for the transformation of A. thaliana and anthurium.

2.8. Transformation of AnUFGT1 into Ufgt and ‘X’

The genetic transformation of ufgt was improved by the standard flower-dip protocol [22].
The A. tumefaciens-mediated transformation of ‘X’ was performed via a new injection method. A 2 mL syringe was used to pierce the peduncle 2–3 cm below the nonexpanded spathe to a depth of approximately 2 mm, and the Agrobacterium solution at an OD600 of 0.5 containing pBI121-35S::AnUFGT1 was slowly injected. The injection hole was immediately sealed with Vaseline. The injection was given once a day for 2–3 days at different points in the peduncle. The Agrobacterium solution containing the pBI121 empty vector at an OD600 of 0.5 was simultaneously used as a control. When the spathe unfolded, it was observed with an anatomic microscope in time.

3. Results

3.1. Metabolomics Analysis Further Elucidated the Differences in the Anthocyanin Pathway between ‘Alabama’ and ‘X’

3.1.1. Metabolomic Analysis Revealed the Main Types and Levels of Anthocyanins in ‘Alabama’ and ‘X’

Metabolomics analysis revealed that the main anthocyanins in the ‘Alabama’ variety were cyanidin-3-O-glucoside, pelargonidin-3-O-glucoside, pelargonidin-3-O-glucoside-5-O-arabinoside, cyanidin-3-O-(2″-O-glucosyl) glucoside, cyanidin-3-O-glucosylrutinoside and cyanidin-3-O-rutinoside. The ‘X’ showed no anthocyanins except for trace amounts of cyanidin-3-O-glucoside (Table 1).

3.1.2. Metabolomics Analysis Revealed the Levels of Intermediate Products of the ASP in ‘Alabama’ and ‘X’

According to the results of the metabolomics analysis, the upstream products of ASP were not significantly different between the ‘Alabama’ and ‘X’. Comparison of dihydroquercetin and dihydrokaempferol levels revealed no differences between ‘Alabama’ and ‘X’, which indicated that the synthesis of their common substrate, dihydroflavonols, was normal in ‘X’. The results of the comparison between epicatechin and several proanthocyanidins showed that there was no difference between ‘Alabama’ and ‘X’ (Table 2).

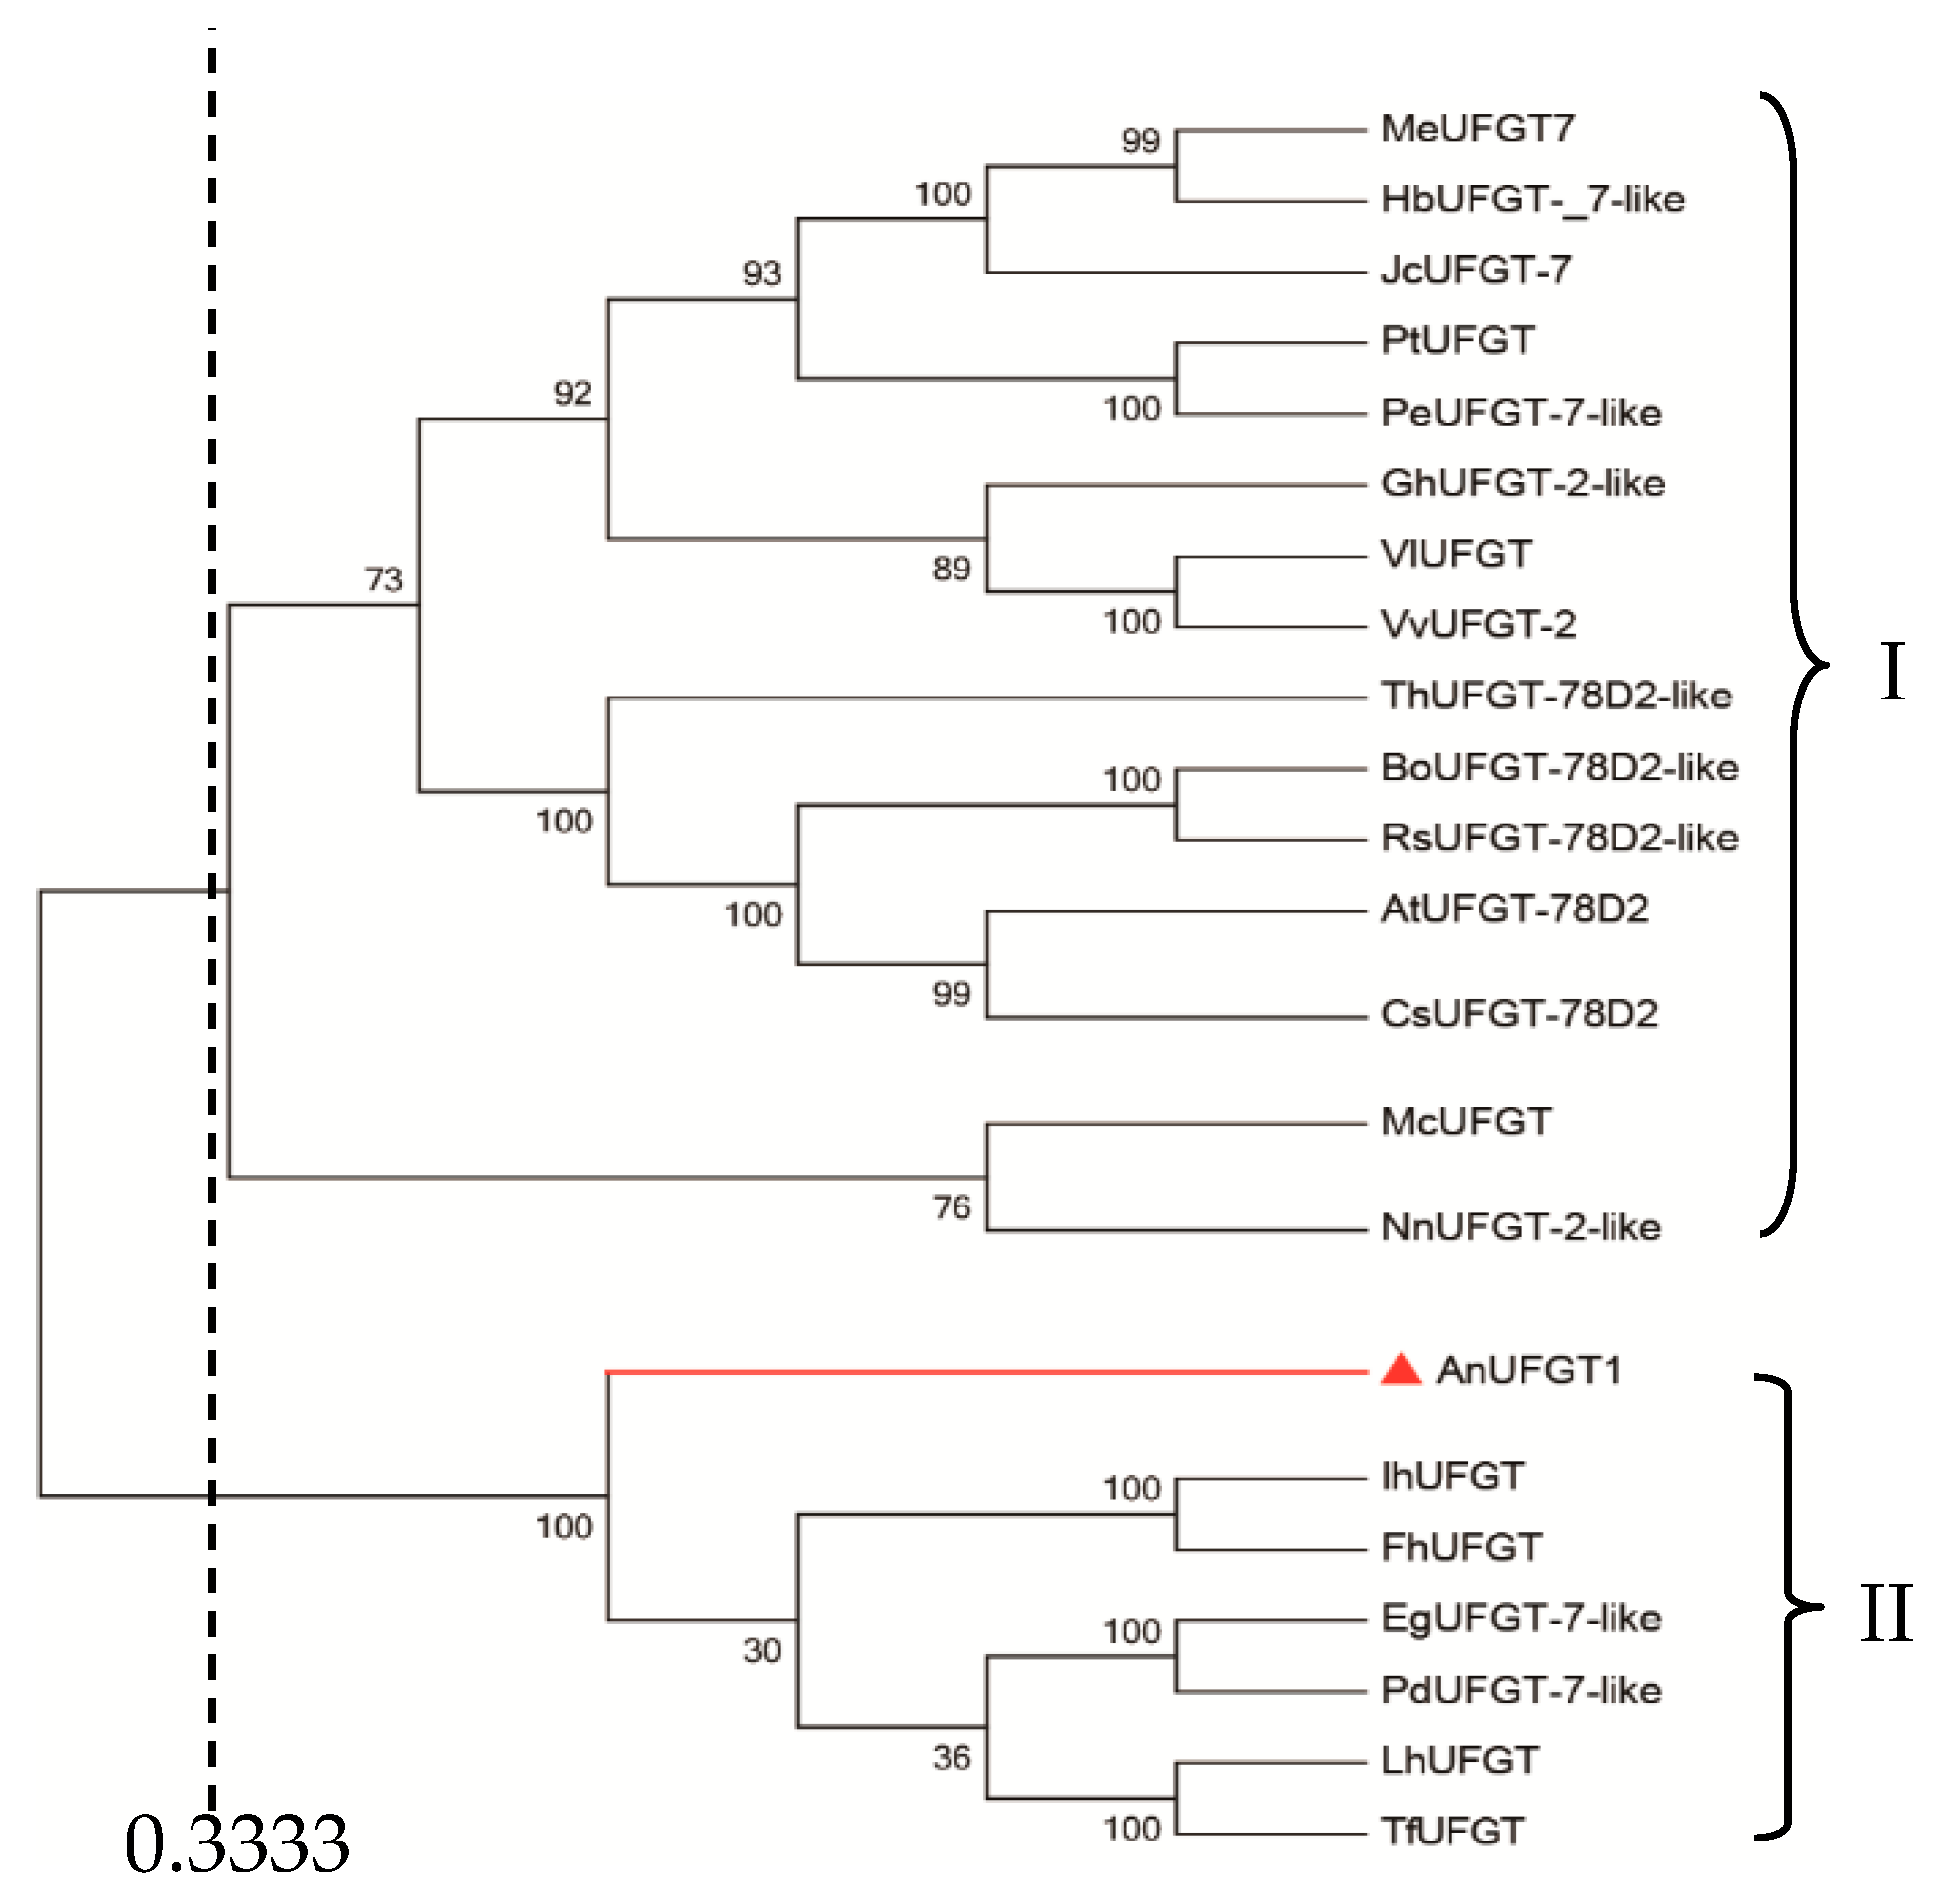
3.2. AnUFGT1 Belongs to the UFGT Genes

The UFGT cDNA of anthurium was isolated, sequenced, and named AnUFGT1. The full-length cDNA of AnUFGT1 was 1793 bp in length, contained a 1440 bp coding sequence, and encoded a polypeptide of 480 amino acids. The nucleic acid sequence of the AnUFGT1 gene was aligned by BLAST, which showed that the AnUFGT1 gene shared some homology with the UFGT genes of many kinds of species, including Oryza sativa (50%, XP_015643442.1), Vitis rotundifolia (50%, AGS57502.1), Zea mays (47%, ABF72120.1), Arabidopsis thaliana (47%, AAM91139.1), and Petunia × hybrida (42%, AAD55985.1). The deduced amino acid sequence also showed that the AnUFGT1 gene shared some homology with the UFGT genes in other plant materials, such as O. sativa, Z. mays, and V. rotundifolia (Figure S3).
A comparison of the genetic relationships among UFGTs from different plants is shown in Figure 1. Using the similarity coefficient of 0.333 as the threshold, UFGTs from 21 plants could be divided into two subgroups. AnUFGT1, Ih UFGT (Iris hollandica, BAD83701.1), FhUFGT (Freesia hybrid cultivar, ADK75021.1), EgUFGT-7-like (Elaeis guineensis, XP_010913632.1), PdUFGT-7-like (Phoenix dactylifera, XP_008801969.1), LhUFGT (Lilium hybrid cultivar, ARR28805.1), and ThUFGT (Tulipa fosteriana, AHY20031.1) were clustered into the same subgroup. In this subgroup, all UFGTs source plants are monocotyledonous plants.
Online functional domain prediction analysis of AnUFGT1 revealed that AnUFGT1 and UFGTs from O. sativa, V. rotundifolia, Z. mays, A. thaliana, and Petunia × hybrida all encoded multiple identical functional domains, suggesting that UFGTs are functionally conserved (Figure S4).

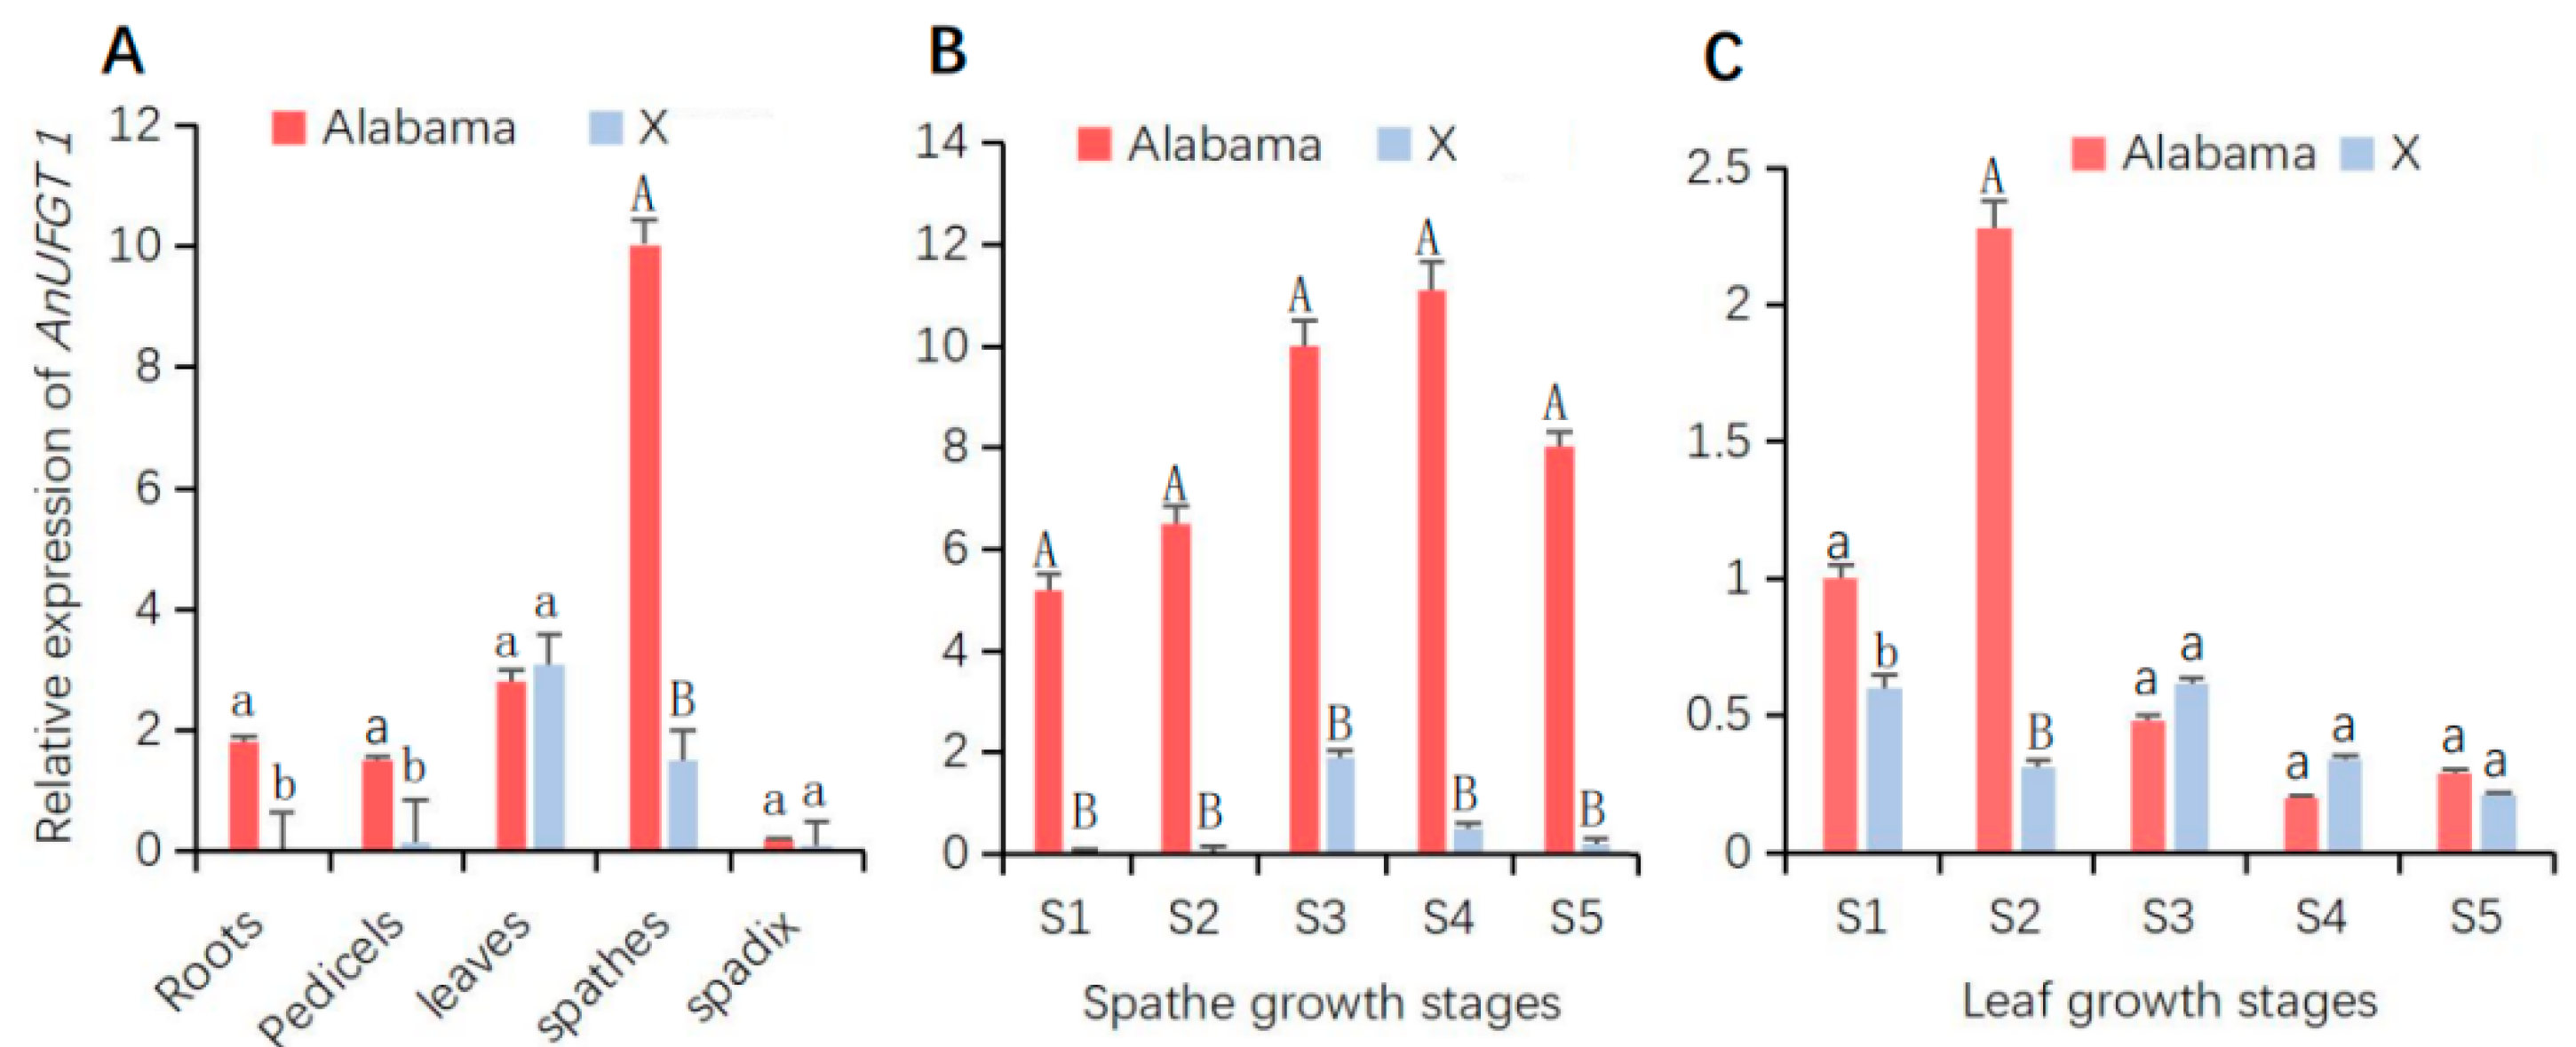
3.3. AnUFGT1 Expression Characteristics Differed between ‘Alabama’ and ‘X’

Analysis of the expression patterns of AnUFGT1 in anthurium revealed that AnUFGT1 was expressed in most tissues, while the expression patterns in different tissues of the two anthurium cultivars were quite different. In both cultivars, the AnUFGT1 gene showed almost no expression in the spadix, and the highest expression was detected in the spathe. The expression levels in the spathe, roots, and pedicels of ‘Alabama’ were significantly greater than those in ‘X’. The AnUFGT1 gene also had relatively high expression in leaves, but there was no significant difference between ‘Alabama’ and ‘X’ (Figure 2A).
In different spathe growth stages, AnUFGT1 expression in ‘Alabama’ tended to increase in S1–S4 but peaked in S4. In the ‘X’ spathe, the expression levels of the AnUFG1 gene increased in S1–S3 but peaked in S3. At each spathe growth stage, the expression level of AnUFGT1 in the ‘Alabama’ variety was significantly greater than that in the ‘X’ variety (Figure 2B).
In different leaf growth stages, the expression levels of AnUFGT1 were highest in S2 of ‘Alabama’, and almost no change was detected in ‘X’ during stages S1–S5. Except for the S2 stage, the expression of AnUFGT1 in the ‘X’ stage did not significantly differ from that in the ‘Alabama’ stage (Figure 2C). The above results showed that the expression levels of the AnUFGT1 gene were positively correlated with spathe color (Figure 2A and Figure S1).

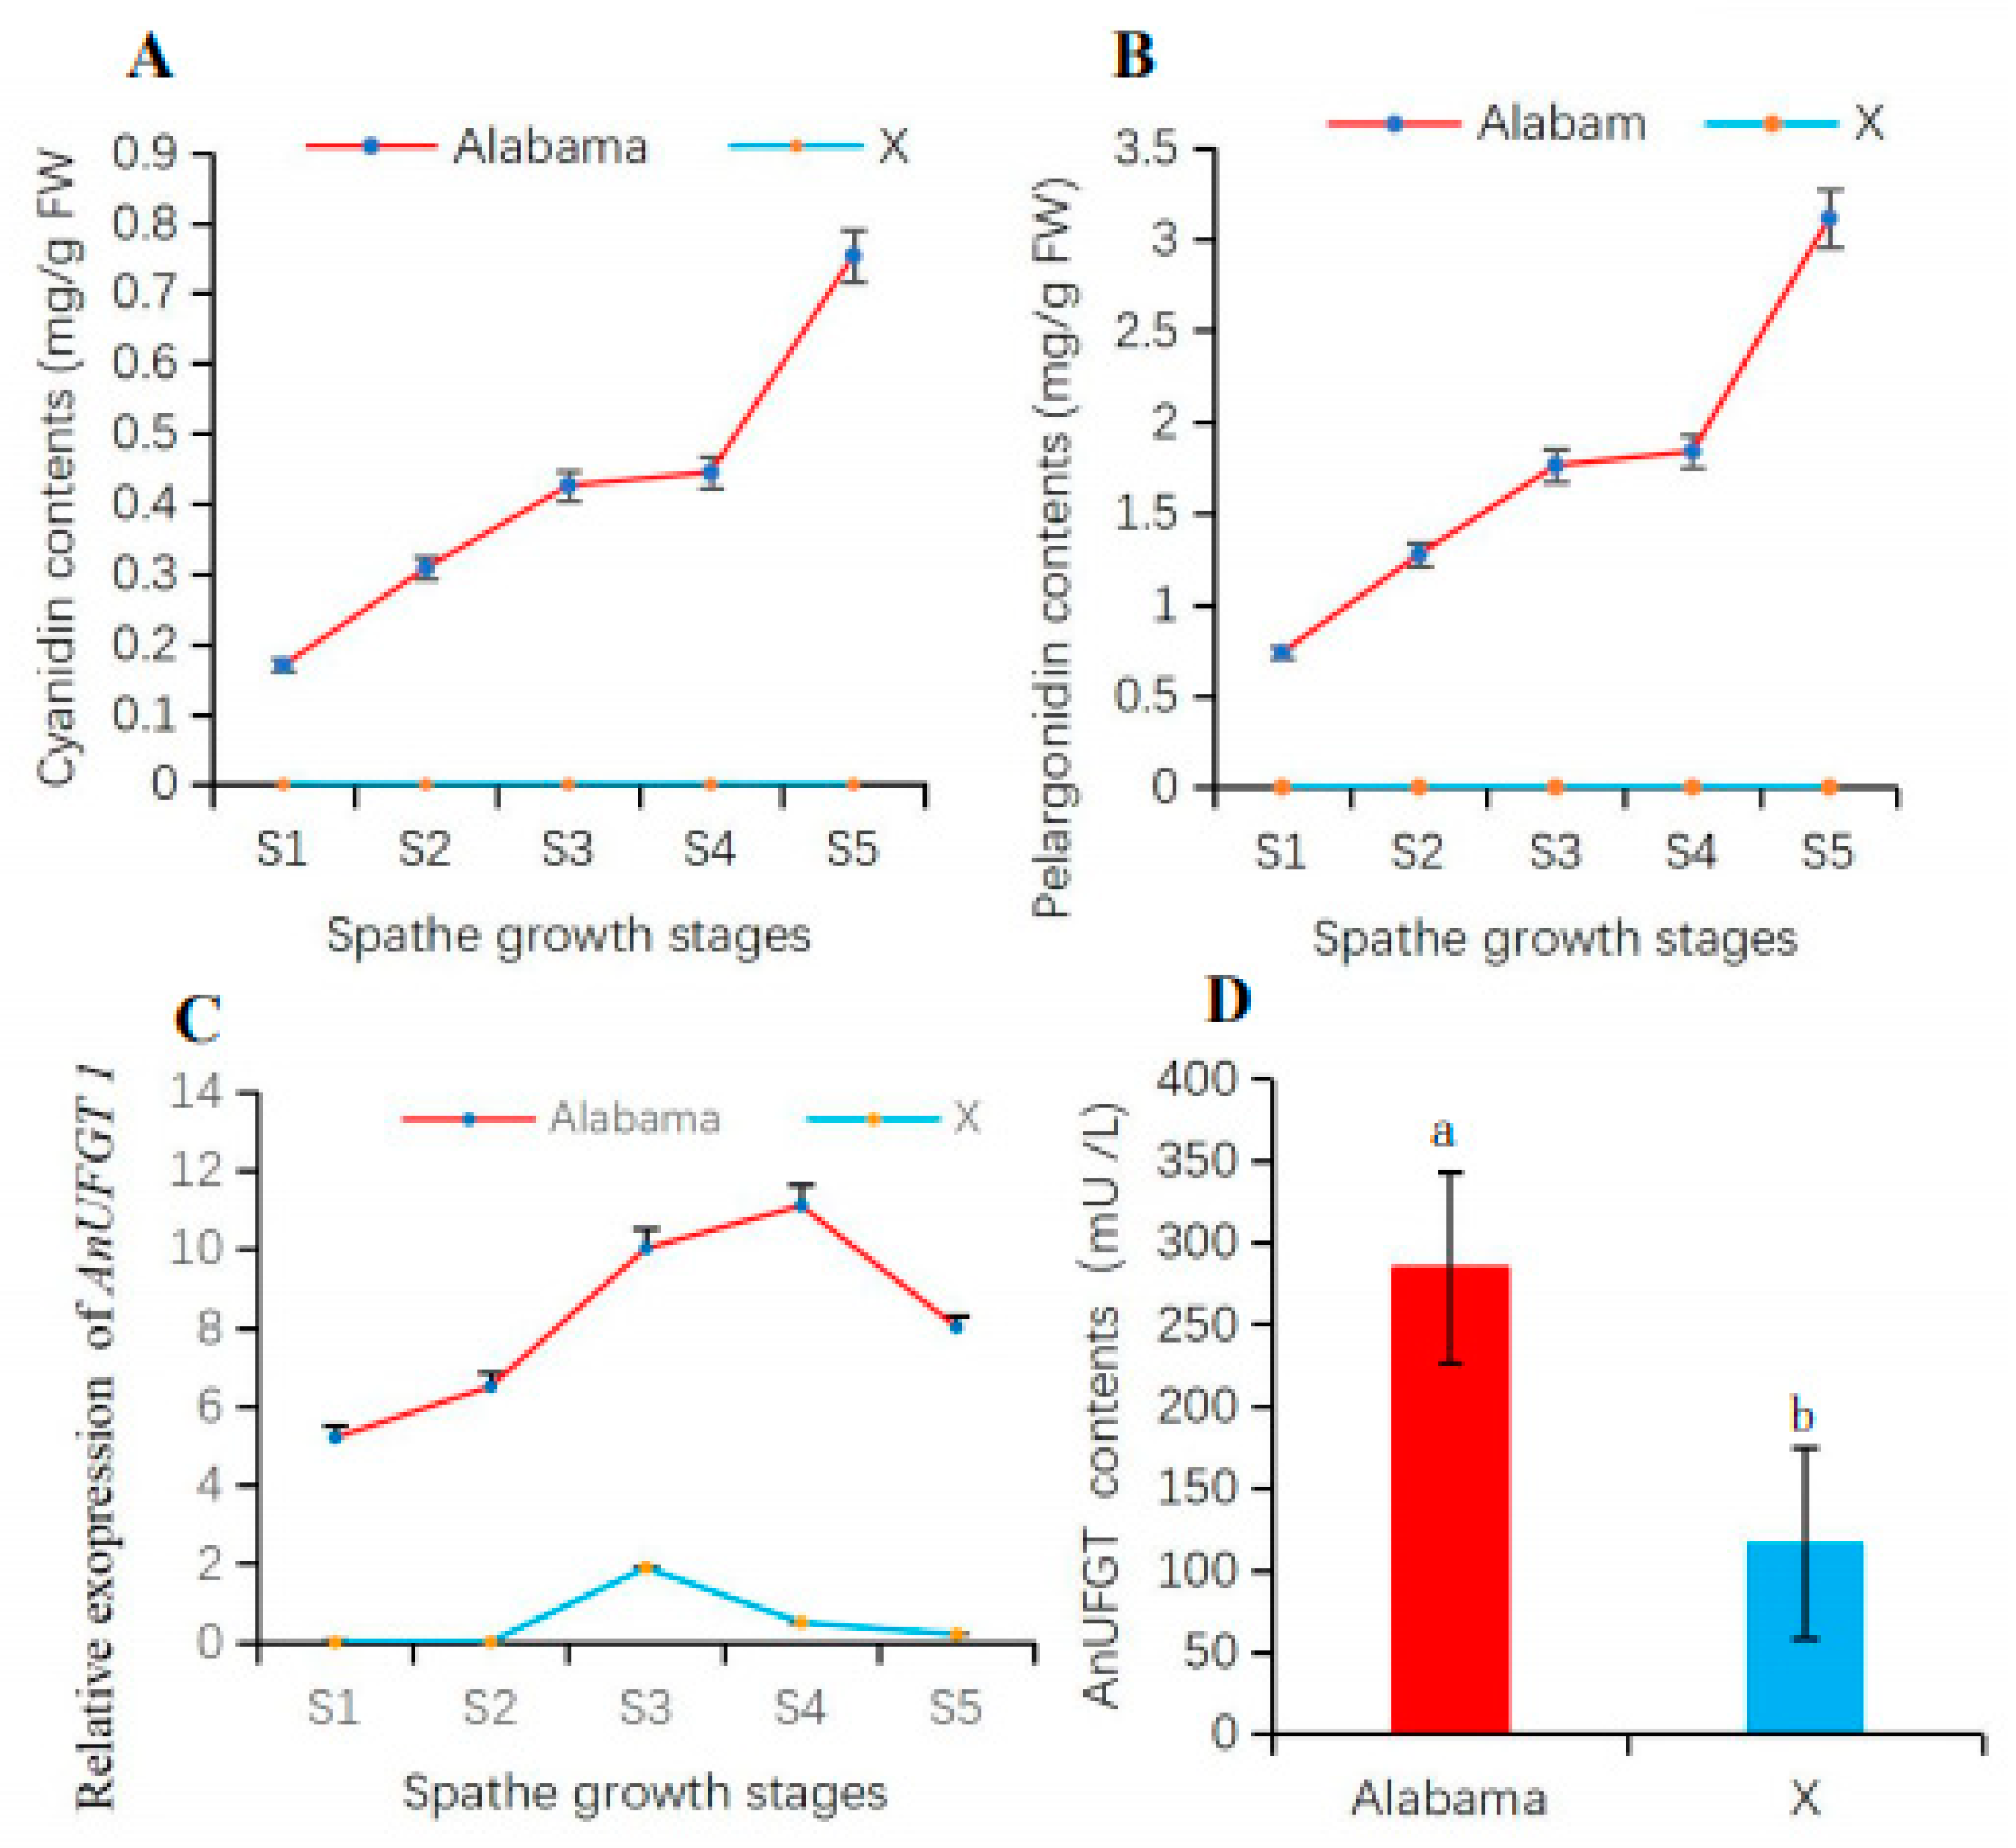
3.4. The AnUFGT1 Is Related to Anthocyanin Accumulation

Analysis of anthocyanin accumulation in spathes at different growth stages revealed that the levels of the main anthocyanins (cyanidin and pelargonidin) in ‘Alabama’ continued to increase from the S1 to S5 stages. The pelargonidin content was greater than the cyanidin content in the ‘Alabama’ variety. In the spathe of ‘X’, none of these anthocyanins were detected (Figure 3A,B). From S1 to S5 of the spathe, the expression level of AnUFGT1 in ‘Alabama’ was all greater than that in ‘X’ (Figure 3C). The AnUFGT enzyme activity in ‘Alabama’ was also greater than that in ‘X’ (Figure 3D). These results confirmed that the difference in spathe color is closely related to the anthocyanin content. Moreover, AnUFGT enzyme activity and the expression of AnUFGT1 had certain effects on anthocyanin synthesis.

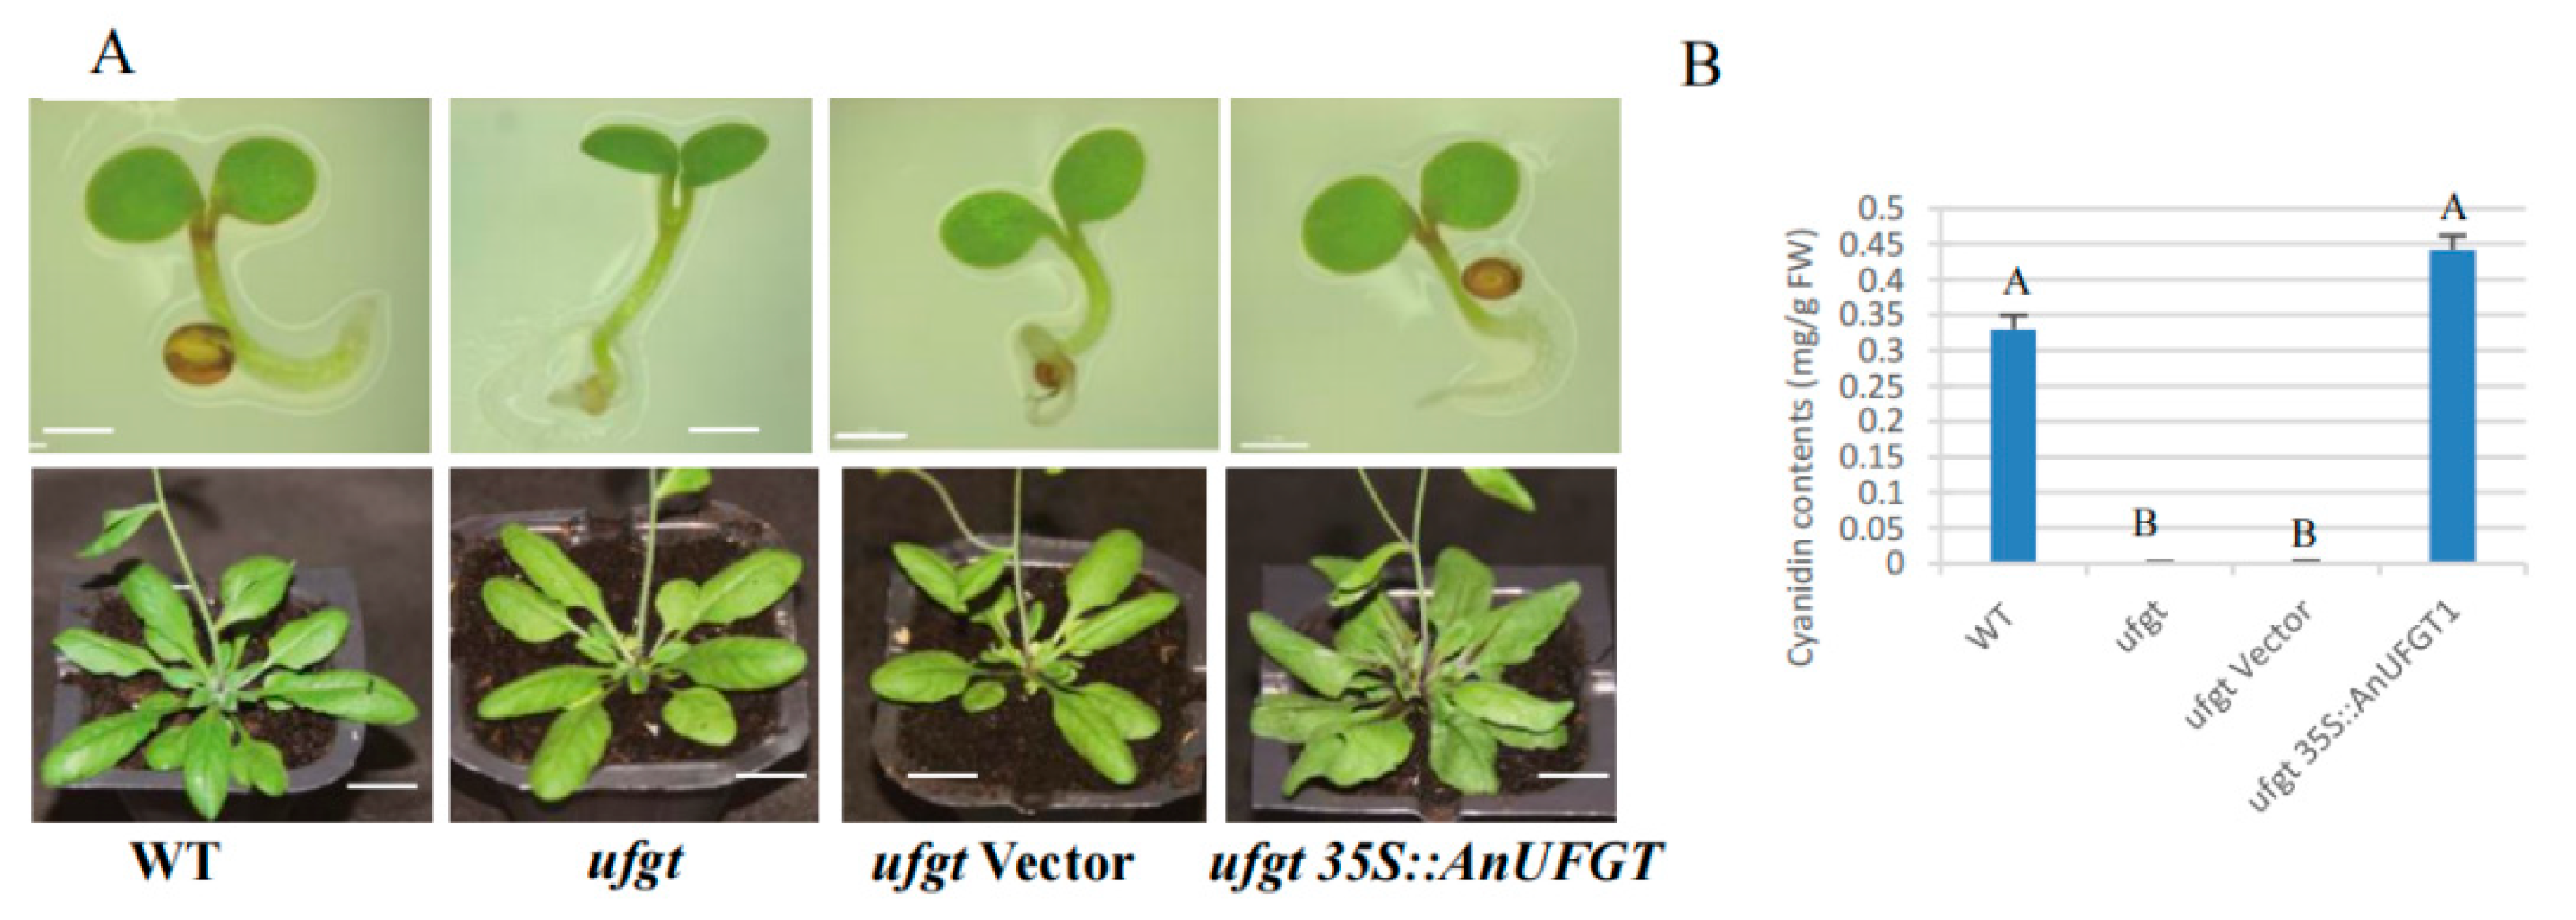
3.5. Overexpression of AnUFGT1 in Arabidopsis Accelerated the Accumulation of Anthocyanins

The cotyledons and hypocotyls in ufgt and ufgt transfected with the CaMV35S empty vector were all green at the seedling stage and flowering stage. The wild type Arabidopsis plants and the ufgt plants transfected with 35S::AnUFGT1 showed light purple coloration at the base of the leaves at the seedling stage and obvious purple–red coloration at the flowering stage (Figure 4A). Anthocyanins were detected at the base of the purple leaves by an ultraviolet spectrophotometer, and the cyanidin content in ufgt 35S::AnUFGT1 was greater than that in wild type plants (Figure 4B). The results indicated that the AnUFGT1 gene could completely compensate for the anthocyanin-deficient phenotype of ufgt and may be involved in the mutation of anthocyanin-deficient anthurium.

3.6. Transient Expression of AnUFGT1 in ‘X’ Promoted Anthocyanin Synthesis

After 2 weeks of injection, the unfolded white spathes of ‘X’ harboring AnUFGT1 showed red spots (Figure 5A–C). On average, 4 out of every 10 spathes produced red spots, with 1–7 spots randomly distributed on each spathe. The composition of the red spot was analyzed, and it was found that the red spots and “Alabama” spathe had light absorption value at the same wavelength, and it was speculated that the red spots contained anthocyanins (Figure 5D). The spathe of ‘X’ and those carrying the empty vector had no anthocyanidin (Figure 5). These results indicated that the AnUFGT1 gene could compensate for the anthocyanin-deficient phenotype of the ‘X’ to a certain degree.

4. Discussion

The brilliant colors of the plant world are fascinating, and scientists have devoted their lives to exploring how colors form. Anthocyanins make important contributions to flower color. The development of technology has led to the discovery of an increasing number of anthocyanin components. The regulatory molecular basis of anthocyanin synthesis is also becoming clearer.

4.1. Metabolomics Enables More Accurate Detection of ASP-Related Metabolites in Plants

With the development of science and technology, a few kinds of omics techniques have developed rapidly. These omics include genomics, transcriptomics, proteomics, and metabolomics. Among these omics, metabolomics is a newly developed subject after genomics and proteomics, and it has broad application prospects in biology and medicine.
Anthocyanins, as an important metabolic product in plants, have long attracted the attention of scientists. Detection methods of anthocyanidin include spectrophotometry [23], chromatography [24], mass spectrometry [25], and the metabolomics techniques [26,27]. Metabolomics analysis has the characteristics of broad spectrum, more accurate and more able to discover new metabolites. In previous reports, the main anthocyanins identified in anthurium were cyanidin 3-rutinoside and pelargonidin 3-rutinoside [28,29]. In A. amnicola, peonidin has also been synthesized [30]. We previously used high-performance liquid chromatography (HPLC) to analyze the anthocyanins of anthurium ‘Alabama’ and found that it contained three kinds of anthocyanins: anthocyanin-rutinoside, anthocyanin-rutinoside, and methyl anthocyanin-rutinoside [1]. Compared with previous analyses, metabolome analysis more accurately distinguished five different cyanidins and pelargonidin. The combined analysis of the metabolome and transcriptome is more beneficial for revealing the regulatory mechanism of anthocyanin synthesis [31].
Through metabolomics analysis of anthurium, not only the relevant information of anthocyanins, but also the components of proanthocyanidins and flavonoid were detected [32]. However, metabolites such as anthocyanins, proanthocyanidins, and flavonoid need to be detected by completely different techniques in previous methods. Therefore, the results of this study further validate the advantages of broad spectrum and high efficiency of metabolomics.

4.2. AnUFGT1 Gene Is the Key Structural Gene for the Deletion of ‘X’ Anthocyanins

The expression level of UFGT is closely related to the content of anthocyanins, and regulating the expression level of UFGT can create flowers, fruits, and vegetables with more colors [11,15,18]. Earlier transcriptomic analysis revealed that the expression level of UFGT in ‘Alabama’ was significantly greater than that in the anthocyanin-deficient mutant ‘X’ [19]. The results of this study showed that in ‘Alabama’ spathe, from S1 to S4, the expression level of AnUFGT1 were significantly greater than those in ‘X’. This phenomenon was like that of the expression of the UFGT gene in other plants [14,33]. Our results further proved that the expression level of AnUFGT1 in ‘Alabama’ and its anthocyanin-deficient mutant ‘X’ is closely related to the content of anthocyanins.
The results of the metabolomics analysis of ‘X’ showed that the end products Cyanidin-3-O-glucoside and Pelargonidin-3-O-glucoside could not be detected. Between ‘Alabama’ and ‘X’, there was no significant difference in the levels of naringenin chalcone, naringenin, dihydrokaempferol, and dihydroquercetin, which were synthesized under action of genes CHS, CHI, F3H, and F3′H respectively. Thses genes were predicted to be normal in ‘X’. Similarly, there was a little bit of increase or no difference in epicatechin and procyanidine, which was synthesized with cyanidin as substrate between ‘Alabama’ and ‘X’, indicating that anthocyanin reductase (ANR) gene was normal. So, the significant difference in the deletion of cyanidin-3-O-glucoside and pelargonidin-3-O-glucoside be-tween ‘Alabama’ and in ‘X’ could be attributed to the abnormal function of the last structural gene UFGT of ASP [4]. According to the results of phylogenetic tree, UFGTs from 21 plants could be divided into three subgroups. AnUFGT1 were clustered into one subgroup with the UFGTs from six kinds of plants. Interestingly, all six of these plants are monocotyledonous, which indicated that UFGT gene is relatively conserved. Of course, this phenomenon needs to be tested in a wider range of plant species.

4.3. AnUFGT1 Gene May Act with Transcription Factor in the Deletion of Anthocyanins

To further verify the association between AnUFGT1 and anthocyanidin deficiency, AnUFGT1 was overexpressed in Arabidopsis thaliana and ‘X’. A. thaliana is a model plant used to investigate the function of genes [34]. A. thaliana mutants are the best materials for verifying gene function. A. thaliana ufgt is a mutant with only the loss of UF3GT function. In ufgt, stable anthocyanin glycosides could not form. After the overexpression of AnUFGT1 in ufgt, the anthocyanin content in ufgt increased to the same level as the wild type, indicating that the phenotype of mutant ufgt was completely compensated. After overexpressing AnUFGT1 in ‘X’ using a new transgene injection method, the anthocyanin-deficient phenotype was compensated to a certain degree. These results indicated not only the establishment of a new anthurium gene transformation technique, but also directly proved that AnUFGT1 is a key functional gene for anthocyanin synthesis and is involved in the anthocyanin deletion mutation of anthurium ‘X’.
However, AnUFGT1 can fully replenish the phenotype of A. thaliana ufgt, but it can only promote the synthesis of small amounts of anthocyanins on the ‘X’ white spathe. Thus, AnUFGT1 participated in the ‘X’ anthocyanin deficiency mutation, but it probably acts with transcription factors. Transcription factors play an important role in the regulation of anthocyanin deficiency in other plants alone or act with structural gene. A study on grapes revealed that both mutations in VvMYBA1 and VvMYBA2 removed the ability of the regulator to switch on anthocyanin biosynthesis [35,36]. The phenotypic change in grapes from white to red in sprout is thought to be the result of a mutation in a regulatory gene controlling the expression of UFGT [36,37]. The petiole specific transcription factor FvMYB10L and FvTT8 binds the promoter of FvDFR2. A mutation of FvDFR2 gene resulted in no anthocyanidin accumulation only in the red strawberry petiole [6]. BrMYBL2.1-G blocks the activity of the MYB-bHLH-WD 40 (MBW) complex and thus represses anthocyanin biosynthesis in Chinese cabbage (Brassica rapa L.) [38]. A white leaf mutant from the red leaf caladium variety was obtained by the down-regulation of key genes (four PAL, four CHS, six CHI, eight F3H, one F3′H, one FLS, one LAR, four DFR, one ANS, and two UFGT) and the significant change in the expression of numerous transcription factors (12 NAC, 12 bZIP, 23 ERF, 23 bHLH, 19 MYB_related, etc.) [39,40]. The heterozygous frameshift mutation of FaMYB10 resulted in the loss of the ability to activate the expression of the FaUFGT gene, which was responsible for the natural formation of white-fleshed strawberry [41]. According to transcriptome analysis, the loss of anthocyanins in ‘X’ occurred mainly due to the loss of functional expression of AN2 and UFGT [1,20]. AN2 belongs to the MYB family of transcription factors. Through transgene identification, it was found that AnAN2 negatively regulates anthocyanin synthesis [42]. In Fuji apple, MdMYB90-like bound to the promoters of both structural genes (MdCHS and MdUFGT) and other transcription factor genes (MdMYB1 and MdbHLH3), and the mutation of the promoter of MdMYB90-like increased the anthocyanin content in the mutant apple skin [43]. In response to light, Py-bZIPa promoted anthocyanin biosynthesis by regulating important transcription factors (PyMYB114, PyMYB10, and PyBBX22) as well as structural genes (PyUFGTs) by binding to G-boxes within its promoter [44]. The comparison of black goji berry and white goji berry, a natural anthocyanin-deficient variant, revealed the absence of LrAN1b expression in white goji berry [45].
This study provides a theoretical basis for understanding the anthocyanin metabolism difference between red and white anthurium and will be beneficial for the genetic improvement of anthurium flower color. It also provides a technical reference for rapid and efficient identification of the function of anthocyanin synthesis-related genes.

5. Conclusions

In this study, the red wild type ‘Alabama’ and the white mutant ‘X’ of anthurium were used to identify the metabolites of anthurium ASP and its branches. Based on the comparison between ‘Alabama’ and ‘X’, it was determined that the anthocyanin deletion mutation of ‘X’ occurred in the catalytic gene of AnUFGT1, the last step in anthocyanin synthesis. This conclusion was further verified with Arabidopsis mutant ufgt. We also invented a new anthurium genetic transformation technology with simple operation, short cycle, and high conversion rate, which is suitable for the functional verification of anthocyanin synthesis-related genes by using anthurium anthocyanidin-deficient mutant ‘X’.

6. Patents

Genetic transformation mediated by Agrobacterium is difficult, has a long cycle and has low efficiency. In this study, a transgenic technique using Agrobacterium injection was developed. Agrobacterium harboring the AnUFGT1 gene was injected directly into young pedicels and induced the synthesis of trace anthocyanins in white spathe. The technology is simple to operate and has a short cycle. It has been applied for a Chinese invention patent.

Supplementary Materials

The following supporting information can be downloaded at: https://www.mdpi.com/article/10.3390/horticulturae10040369/s1, Figure S1: Comparison of the morphological characteristics of different parts of ‘Alabama’ and ‘X’, Figure S2: The spathes and leaves of ‘Alabama’ and ‘X’ at five growth stages; Figure S3. Sequence alignment of the amino acid sequences of UFGTs from Anthurium andraeanum and other plants.; Figure S4: Comparison of the predicted domains of AnUFGT1 and those of other plants; Table S1. Primers used for qRT–PCR analysis.

Author Contributions

Z.L., research idea construction, writing, and method innovation; J.W., data collection and analysis, table preparation; Y.G., Y.J. and J.L., technical implementation, investigation; and L.X., manuscript proposal and manuscript revision. All authors have read and agreed to the published version of the manuscript.

Funding

We acknowledge funding from the National Key R&D Programs of China (project no. 2021YFC2600603) and the Natural Science Foundation of Hainan Province (project no. 321RC644).

Data Availability Statement

Data are contained within the article and Supplementary Materials.

Conflicts of Interest

The authors declare no conflicts of interest.

References

  1. Cong, H.; Xu, L.; Xin, C.; Li, Z. Comparison and Determination of Anthocyanidins in Anthurium Mutant. J. Anhui Agric. Sci. 2009, 37, 7832–7834. [Google Scholar]
  2. Ben-Simhon, Z.; Judeinstein, S.; Trainin, T.; Harel-Beja, R.; Bar-Ya’Akov, I.; Borochov-Neori, H.; Holland, D. A “White” Anthocyanin-less Pomegranate (Punica granatum L.) Caused by an Insertion in the Coding Region of the Leucoanthocyanidin Dioxygenase (LDOX; ANS) Gene. PLoS ONE 2015, 10, e0142777. [Google Scholar] [CrossRef] [PubMed]
  3. Castillejo, C.; Waurich, V.; Wagner, H.; Ramos, R.; Oiza, N.; Muñoz, P.; Triviño, J.C.; Caruana, J.; Liu, Z.; Cobo, N.; et al. Allelic Variation of MYB10 Is the Major Force Controlling Natural Variation in Skin and Flesh Color in Strawberry (Fragaria spp.) Fruit. Plant Cell 2020, 32, 3723–3749. [Google Scholar] [CrossRef] [PubMed]
  4. Wei, L.; Cheng, J.; Xiang, J.; Zheng, T.; Wu, J. Transcriptome and proteome analysis of the fig (Ficus carica L.) cultivar Orphan and its mutant Hongyan based on the fruit peel colour in South China. Czech J. Genet. Plant Breed. 2022, 59, 33–42. [Google Scholar] [CrossRef]
  5. Yuan, K.; Zhao, X.; Sun, W.; Yang, L.; Zhang, Y.; Wang, Y.; Ji, J.; Han, F.; Fang, Z.; Lv, H. Map-based cloning and CRISPR/Cas9-based editing uncover BoNA1 as the causal gene for the no-anthocyanin-accumulation phenotype in curly kale (Brassica oleracea var. sabellica). Hortic. Res. 2023, 10, uhad133. [Google Scholar] [CrossRef] [PubMed]
  6. Li, X.; Luo, X.; Liu, Z.; Wang, C.; Lin, A.; Xiao, K.; Cao, M.; Fan, J.; Lian, H.; Xu, P. FvDFR2 rather than FvDFR1 play key roles for anthocyanin synthesis in strawberry petioles. Plant Sci. 2024, 340, 111960. [Google Scholar] [CrossRef] [PubMed]
  7. Wang, X.; Olsen, O.; Knudsen, S. Expression of the Dihydroflavonol Reductase Gene in an Anthocyanin-Free Barley Mutant. Hereditas 1993, 119, 67–75. [Google Scholar] [CrossRef] [PubMed]
  8. Toda, K.; Yang, D.; Yamanaka, N.; Watanabe, S.; Harada, K.; Takahashi, R. A single-base deletion in soybean flavonoid 3′-hydroxylase gene is associated with gray pubescence color. Plant Mol. Biol. 2002, 50, 187–196. [Google Scholar] [CrossRef]
  9. Li, J.; Tan, Q.; Yi, M.; Yu, Z.; Xia, Q.; Zheng, L.; Chen, J.; Zhou, X.; Zhang, X.-Q.; Guo, H.-R. Identification of key genes responsible for green and white colored spathes in Anthurium andraeanum (Hort.). Front. Plant Sci. 2023, 14, 1208226. [Google Scholar] [CrossRef]
  10. Liu, Y.; Zhou, B.; Qi, Y.; Liu, C.; Liu, Z.; Ren, X. Biochemical and functional characterization of AcUFGT3a, a galactosyltransferase involved in anthocyanin biosynthesis in the red-fleshed kiwifruit (Actinidia chinensis). Physiol. Plant. 2018, 162, 409–426. [Google Scholar] [CrossRef]
  11. Huang, B.-H.; Chen, Y.-W.; Huang, C.-L.; Gao, J.; Liao, P.-C. Diversifying selection of the anthocyanin biosynthetic downstream gene UFGT accelerates floral diversity of island Scutellaria species. BMC Evol. Biol. 2016, 16, 1–13. [Google Scholar] [CrossRef] [PubMed]
  12. Ni, X.; Ni, Z.; Ouma, K.O.; Gao, Z. Mutations in PmUFGT3 contribute to color variation of fruit skin in Japanese apricot (Prunus mume Sieb. et Zucc.). BMC Plant Biol. 2022, 22, 1–16. [Google Scholar] [CrossRef] [PubMed]
  13. Xie, F.; Burklew, C.E.; Yang, Y.; Liu, M.; Xiao, P.; Zhang, B.; Qiu, D. De novo sequencing and a comprehensive analysis of purple sweet potato (Impomoea batatas L.) transcriptome. Planta 2012, 236, 101–113. [Google Scholar] [CrossRef] [PubMed]
  14. Hu, M.; Lu, Z.; Guo, J.; Luo, Y.; Li, H.; Li, L.; Gao, F. Cloning and characterization of the cDNA and promoter of UDP-glucose: Flavonoid 3-O-glucosyltransferase gene from a purple-fleshed sweet potato. S. Afr. J. Bot. 2016, 106, 211–220. [Google Scholar] [CrossRef]
  15. Morita, Y.; Ishiguro, K.; Tanaka, Y.; Iida, S.; Hoshino, A. Spontaneous mutations of the UDP-glucose:flavonoid 3-O-glucosyltransferase gene confers pale- and dull-colored flowers in the Japanese and common morning glories. Planta 2015, 242, 575–587. [Google Scholar] [CrossRef] [PubMed]
  16. Liao, L.; Li, Y.; Lan, X.; Yang, Y.; Wei, W.; Ai, J.; Feng, X.; Chen, H.; Tang, Y.; Xi, L.; et al. Integrative Analysis of Fruit Quality and Anthocyanin Accumulation of Plum cv. ‘Cuihongli’ (Prunus salicina Lindl.) and Its Bud Mutation. Plants 2023, 12, 1357. [Google Scholar] [CrossRef] [PubMed]
  17. Medda, S.; Sanchez-Ballesta, M.T.; Romero, I.; Dessena, L.; Mulas, M. Expression of Structural Flavonoid Biosynthesis Genes in Dark-Blue and White Myrtle Berries (Myrtus communis L.). Plants 2021, 10, 316. [Google Scholar] [CrossRef]
  18. Kapoor, P.; Sharma, S.; Tiwari, A.; Kaur, S.; Kumari, A.; Sonah, H.; Goyal, A.; Krishania, M.; Garg, M. Genome–Transcriptome Transition Approaches to Characterize Anthocyanin Biosynthesis Pathway Genes in Blue, Black and Purple Wheat. Genes 2023, 14, 809. [Google Scholar] [CrossRef] [PubMed]
  19. Li, Z.; Wang, J.; Zhang, X.; Xu, L. Comparative Transcriptome Analysis of Anthurium “Albama” and Its Anthocyanin-Loss Mutant. PLoS ONE 2015, 10, e0119027. [Google Scholar] [CrossRef]
  20. Tel-Zur, N.; Abbo, S.; Myslabodski, D.; Mizrahi, Y. Modified CTAB Procedure for DNA Isolation from Epiphytic Cacti of the Genera Hylocereus and Selenicereus (Cactaceae). Plant Mol. Biol. Rep. 1999, 17, 249–254. [Google Scholar] [CrossRef]
  21. Kenneth, J.L.; Thomas, D.S. Analysis of relative gene expression data using real-time quantitative PCR and the 2-△△CT method. Methods 2001, 25, 402–408. [Google Scholar]
  22. Clough, S.J.; Bent, A.F. Floral dip: A simplified method for agrobacterium-mediated transformation of Arabidopsis thaliana. Plant J. 1998, 16, 735–743. [Google Scholar] [CrossRef]
  23. Lister, C.E.; Lancaster, J.E.; Sutton, K.H.; Walker, J.R. Developmental changes in the concentration and composition of flavonoids in skin of a red and a green apple cultivar. J. Sci. Food Agric. 1994, 64, 155–161. [Google Scholar] [CrossRef]
  24. Bonaccorsi, P.; Caristi, C.; Gargiulli, C.; Leuzzi, U. Flavonol glucosides in Allium species: A comparative study by means of HPLC–DAD–ESI-MS–MS. Food Chem. 2007, 107, 1668–1673. [Google Scholar] [CrossRef]
  25. Termentzi, A.; Kefalas, P.; Kokkalou, E. LC–DAD–MS (ESI+) analysis of the phenolic content of Sorbus domestica fruits in relation to their maturity stage. Food Chem. 2007, 106, 1234–1245. [Google Scholar] [CrossRef]
  26. Yamazaki, M.; Nakajima, J.-I.; Yamanashi, M.; Sugiyama, M.; Makita, Y.; Springob, K.; Awazuhara, M.; Saito, K. Metabolomics and differential gene expression in anthocyanin chemo-varietal forms of Perilla frutescens. Phytochemistry 2003, 62, 987–995. [Google Scholar] [CrossRef] [PubMed]
  27. Tweeddale, H.; Notley-McRobb, L.; Ferenci, T. Effect of Slow Growth on Metabolism of Escherichia coli, as Revealed by Global Metabolite Pool (“Metabolome”) Analysis. J. Bacteriol. 1998, 180, 5109–5116. [Google Scholar] [CrossRef] [PubMed]
  28. Iwata, R.Y.; Tang, C.S.; Kamemoto, H. Concentration of anthocyanins affecting spathe colour in Anthuriums. J. Am. Soc. Hortic. Sci. 1985, 110, 383–385. [Google Scholar] [CrossRef]
  29. Iwata, R.Y.; Tang, C.S.; Kamemoto, H. Anthocyanins of Anthurium andraeanum Lind. J. Am. Soc. Hortic. 1979, 104, 464–466. [Google Scholar] [CrossRef]
  30. Marutani, M.; Tang, C.S.; Paull, R.; Kamemoto, H. Anthocyanins in the Lavender Anthurium. HortScience 1987, 22, 620–622. [Google Scholar] [CrossRef]
  31. Meng, X.; Li, G.; Gu, L.; Sun, Y.; Li, Z.; Liu, J.; Wu, X.; Dong, T.; Zhu, M. Comparative metabolomic and transcriptome analysis reveal distinct flavonoid biosynthesis regulation between petals of white and purple Phalaenopsis amabilis. J. Plant Growth Regul. 2020, 39, 823–840. [Google Scholar] [CrossRef]
  32. Wang, Z.; Li, X.; Chen, M.; Yang, L.; Zhang, Y. Molecular and Metabolic Insights into Anthocyanin Biosynthesis for Spot Formation on Lilium leichtlinii var. maximowiczii Flower Petals. Int. J. Mol. Sci. 2023, 24, 1844. [Google Scholar] [CrossRef] [PubMed]
  33. Wei, Y.-Z.; Hu, F.-C.; Hu, G.-B.; Li, X.-J.; Huang, X.-M.; Wang, H.-C. Differential Expression of Anthocyanin Biosynthetic Genes in Relation to Anthocyanin Accumulation in the Pericarp of Litchi chinensis Sonn. PLoS ONE 2011, 6, e19455. [Google Scholar] [CrossRef] [PubMed]
  34. Meinke, D.W.; Cherry, J.M.; Dean, C.; Rounsley, S.D.; Koornneef, M. Arabidopsis thaliana: A Model Plant for Genome Analysis. Science 1998, 282, 662–682. [Google Scholar] [CrossRef] [PubMed]
  35. Walker, A.R.; Lee, E.; Bogs, J.; McDavid, D.A.; Thomas, M.R.; Robinson, S.P. White grapes arose through the mutation of two similar and adjacent regulatory genes. Plant J. 2007, 49, 772–785. [Google Scholar] [CrossRef] [PubMed]
  36. Kobayashi, S.; Goto-Yamamoto, N.; Hirochika, H. Association of VvmybAl Gene Expression with Anthocyanin Production in Grape (Vitis vinifera) Skin-color Mutants. J. Jpn. Soc. Hortic. Sci. 2005, 74, 196–203. [Google Scholar] [CrossRef]
  37. Kobayashi, S.; Ishimaru, M.; Ding, C.; Yakushiji, H.; Goto, N. Comparison of UDP-glucose:flavonoid 3-O-glucosyltransferase (UFGT) gene sequences between white grapes (Vitis vinifera) and their sports with red skin. Plant Sci. 2001, 160, 543–550. [Google Scholar] [CrossRef] [PubMed]
  38. Kim, J.; Kim, D.-H.; Lee, J.-Y.; Lim, S.-H. The R3-Type MYB Transcription Factor BrMYBL2.1 Negatively Regulates Anthocyanin Biosynthesis in Chinese Cabbage (Brassica rapa L.) by Repressing MYB–bHLH–WD40 Complex Activity. Int. J. Mol. Sci. 2022, 23, 3382. [Google Scholar] [CrossRef] [PubMed]
  39. Zhou, Y.; Xu, Y.; Zhu, G.-F.; Tan, J.; Lin, J.; Huang, L.; Ye, Y.; Liu, J. Pigment Diversity in Leaves of Caladium × hortulanum Birdsey and Transcriptomic and Metabolic Comparisons between Red and White Leaves. Int. J. Mol. Sci. 2024, 25, 605. [Google Scholar] [CrossRef]
  40. Muhammad, N.; Uddin, N.; Khan, M.K.U.; Ali, N.; Ali, K.; Jones, D.A. Diverse role of basic Helix-Loop-Helix (bHLH) transcription factor superfamily genes in the fleshy fruit-bearing plant species. Czech J. Genet. Plant Breed. 2022, 59, 1–13. [Google Scholar] [CrossRef]
  41. Yuan, H.; Cai, W.; Chen, X.; Pang, F.; Wang, J.; Zhao, M. Heterozygous frameshift mutation in FaMYB10 is responsible for the natural formation of red and white-fleshed strawberry (Fragaria x ananassa Duch). Front. Plant Sci. 2022, 13, 1027567. [Google Scholar] [CrossRef] [PubMed]
  42. Xu, L.; Li, Z.; Cong, H.; Li, X. Cloning of Anthurium MYB Transcription Factor AN2-Like and Construction of Expression Vector. Chinese Invention Patent ZL201310140892.0, 19 November 2014. [Google Scholar]
  43. Sun, C.; Wang, C.; Zhang, W.; Liu, S.; Wang, W.; Yu, X.; Song, T.; Yu, M.; Yu, W.; Qu, S. The R2R3-type MYB transcription factor MdMYB90-like is responsible for the enhanced skin color of an apple bud sport mutant. Hortic. Res. 2021, 8, 156. [Google Scholar] [CrossRef] [PubMed]
  44. Liu, H.; Su, J.; Zhu, Y.; Yao, G.; Allan, A.C.; Ampomah-Dwamena, C.; Shu, Q.; Lin-Wang, K.; Zhang, S.; Wu, J. The involvement of PybZIPa in light-induced anthocyanin accumulation via the activation of PyUFGT through binding to tandem G-boxes in its promoter. Hortic. Res. 2019, 6, 1–13. [Google Scholar] [CrossRef] [PubMed]
  45. Li, T.; Wang, J.; Zhang, Z.; Fan, Y.; Qin, H.; Yin, Y.; Dai, G.; Cao, Y.; Tang, L. Anthocyanin biosynthesis in goji berry is inactivated by deletion in a bHLH transcription factor LrLAN1b promoter. Plant Physiol. 2024, kiae122. [Google Scholar] [CrossRef] [PubMed]
Figure 1. Phytogenetic tree analysis of AnUFGT1 and UFGTs in other plants. The tree was generated in MEGA 6.0 and constructed by the neighbor-joining method. The node numbers represent the bootstrap values from 1000 replications. Sequences were downloaded from the NCBI database: MeUFGT7 (Manihot esculenta, XP_021621771.1); HbUFGT-_7-like (Hevea brasiliensis, XP_021684284.1); JcUFGT-7 (Jatropha curcas, XP_012090922.1); PtUFGT (Populus trichocarpa, XP_006376354.1); PeUFGT-7-like (Populus euphratica, XP_011038212.1); GhUFGT-2-like (Gossypium hirsutum, XP_016740936.1); VIUFGT (Vitis labrusca, ABR24135.1); VvUFGT-2 (Vitis vinifera, XP_002277035.1); ThUFGT-78D2-like (Tarenaya hassleriana, XP_010549820.1); BoUFGT-78D2-like (Brassica oleracea, XP_013620486.1); RsUFGT-78D2-like (Raphanus sativus, XP_018471085.1); AtUFGT-78D2 (Arabidopsis thaliana, AAM91139.1); CsUFGT-78D2-like (Camelina sativa, XP_010492637.1); McUFGT (Macleaya cordata, OVA20940.1); NnUFGT-2-like (Nelumbo nucifera, XP_010279580.1); IhUFGT (Iris hollandica, BAD83701.1); FhUFGT (Freesia hybrid cultivar, ADK75021.1); EgUFGT-7-like (Elaeis guineensis, XP_010913632.1); PdUFGT-7-like (Phoenix dactylifera, XP_008801969.1); LhUFGT (Lilium hybrid cultivar, ARR28805.1); ThUFGT (Tulipa fosteriana, AHY20031.1).
Horticulturae 10 00369 g001
Figure 2. Gene expression patterns of AnUFGT1 in ‘Alabama’ and ‘X’. The expression patterns detected by real-time quantitative PCR. Red represents ‘Alabama’, and blue represents ‘X’. (A) Expression levels of AnUFGT1 in different organs. There were highly significant differences in roots, pedicels, and spathes between ‘Alabama’ and ‘X’. (B) Expression levels of AnUFGT1 in spathes at different growth stages. There were highly significant differences from S1 to S5 between ‘Alabama’ and ‘X’. (C) Expression levels of AnUFGT1 in leaves at different growth stages. Capital letters A and B in (AC) indicate a significant difference at the α = 0.01 level; lowercase letters a and b indicate a significant difference at the α = 0.05 level.
Horticulturae 10 00369 g002
Figure 3. Accumulation of anthocyanins and AnUFGT enzyme activity in anthurium spathes. (A) Cyanidin content in spathes. The cyanidin content in the ‘Alabama’ spathe was greater than that in the ‘X’ spathe and increased from S1 to S5. The cyanidin contents in ‘X’ are not detected. (B) Pelargonidin content in spathes. The pelargonidin content in the ‘Alabama’ spathe was greater than that in the ‘X’ spathe and increased from S1 to S5. The pelargonidin contents in ‘X’ were not detected. (C) Changes in the expression level of AnUFGT1 from S1 to S5 in ‘Alabama’ and ‘X’, respectively. (D) The enzyme activity of AnUFGT in the spathes of the ‘Alabama’ and ‘X’. Lowercase letters a and b in (D) indicate a significant difference at the α = 0.05 level.
Horticulturae 10 00369 g003
Figure 4. Phenotype of 35S::AnUFGT1 transgenic Arabidopsis. (A) Phenotypes of WT, ufgt, ufgt vector, and ufgt 35S::AnUFGT1 plants. The WT and ufgt 35S::AnUFGT1 plants had obvious pigmentation at the base of the cotyledons and leaves. (B) Anthocyanin contents of WT, ufgt, ufgt vector, and ufgt 35S::AnUFGT1 flowering plants. In picture (A) of the cotyledon stage, the bars mean 1 mm. In picture (A) of the flowering stage, the bars mean 1 cm. In (B), capital letters A and B indicate a significant difference at the α = 0.01 level.
Horticulturae 10 00369 g004
Figure 5. Phenotype of ‘X’ 35S::AnUFGT1. (A) Young spathe of ‘Xueye’, which is used for injection transformation. (B) The spathe unfolded after injection. The meat panicle is removed. The black circles show where the red spots are. (C) One red spot on a transgenic ‘X’ spathe. (D) Cyaniding contents of ‘Alabama’, ‘X’ and ‘X’ 35S::AnUFGT1. The data showed that the red spots were due to the accumulation of anthocyanins. The bar in (A,B) represents 2 cm. The bar in (C) represents 50 μm. Capital letters A, B, and C in (D) indicate a significant difference at the α = 0.01 level.
Horticulturae 10 00369 g005
Table 1. Metabonomic analysis of the main anthocyanins and their levels in ‘Alabama’ and ‘X’.
CompoundAlabamaXComparative Result
Cyanidin-3-O-glucoside1.37 × 1083.08 × 105Down
Pelargonidin-3-O-glucoside2.19 × 1079.00 × 100Down
Pelargonidin-3-O-glucoside-5-O-arabinoside1.02 × 1069.00 × 100Down
Cyanidin-3-O-(2″-O-glucosyl) glucoside1.24 × 1069.00 × 100Down
Cyanidin-3-O-rutinoside1.59 × 1079.00 × 100Down
Table 2. Metabonomic analysis of the products from ASP and its branches in ‘Alabama’ and ‘X’.
CompoundAlabamaXType
A1A2A3X1X2X3
Dihydroquercetin (Taxifolin)5.58 × 1047.72 × 1045.62 × 1043.73 × 1044.37 × 1044.03 × 104insig
Aromadendrin (Dihydrokaempferol)1.03 × 1051.03 × 1051.16 × 1051.21 × 1051.09 × 1051.08 × 105insig
Naringenin (5,7,4′-Trihydroxyflavanone)1.25 × 1061.15 × 1061.08 × 1061.76 × 1061.67 × 1061.90 × 106insig
Eriodictyol (5,7,3′,4′-Tetrahydroxyflavanone)9.08 × 1037.91 × 1031.36 × 1047.89 × 1037.35 × 1038.15 × 103insig
Naringenin chalcone1.34 × 1061.13 × 1061.21 × 1061.81 × 1061.75 × 1061.97 × 106insig
Epicatechin5.38 × 1065.34 × 1064.64 × 1064.49 × 1065.78 × 1065.05 × 106insig
Procyanidine B42.51 × 1072.63 × 1072.59 × 1072.82 × 1072.24 × 1072.24 × 107insig
Procyanidine C15.63 × 1065.00 × 1064.80 × 1066.71 × 1066.78 × 1066.89 × 106insig
Procyanidine B11.28 × 1061.62 × 1061.12 × 1064.19 × 1063.72 × 1063.39 × 106up
Procyanidine C28.60 × 1059.04 × 1056.96 × 1052.04 × 1062.09 × 1062.04 × 106up
Procyanidine A28.18 × 1059.94 × 1051.35 × 1061.24 × 1061.23 × 1061.06 × 106insig
Procyanidine A13.25 × 1053.55 × 1055.80 × 1054.66 × 1054.53 × 1054.12 × 105insig
Procyanidine A61.22 × 1054.39 × 1041.43 × 1058.61 × 1041.04 × 1051.04 × 105insig
Procyanidine B31.50 × 1041.82 × 1041.45 × 1044.43 × 1044.26 × 1044.10 × 104up
Disclaimer/Publisher’s Note: The statements, opinions and data contained in all publications are solely those of the individual author(s) and contributor(s) and not of MDPI and/or the editor(s). MDPI and/or the editor(s) disclaim responsibility for any injury to people or property resulting from any ideas, methods, instructions or products referred to in the content.

