Article

Biomass Source of Biochar and Genetic Background of Tomato Influence Plant Growth and Development and Fruit Quality

1
Department of Horticulture, Washington State University, Pullman, WA 99164, USA
2
Department of Horticultural Sciences, Texas A&M University, College Station, TX 77843, USA
*
Author to whom correspondence should be addressed.
Horticulturae 2024, 10(4), 368; https://doi.org/10.3390/horticulturae10040368
Submission received: 7 March 2024 / Revised: 27 March 2024 / Accepted: 1 April 2024 / Published: 7 April 2024

Abstract

:
Maintaining healthy soils and restoring marginal lands are necessary to ensure efficient food production and food security. Biochar, a porous carbon-rich material generated from the pyrolysis of organic feedstock, is receiving attention as a soil amendment that can potentially restore soil health and enhance crop yields. However, the physical and chemical properties of biochar are influenced by pyrolysis parameters and organic feedstock sources. These determine its interaction with the soil, influencing its impact on soil health and plant productivity. While most studies report the evaluation of one biochar and a single plant cultivar, the role of genetic background in responding to biochar as a soil amendment remains unexplored. The impact of six biochars on agronomic performance and fruit quality of three tomato (Solanum lycopersicum) cultivars was evaluated to test the hypotheses that (1) biochars derived from different feedstock sources would produce unique phenotypes in a single cultivar of tomato, and (2) single feedstock-derived biochar would produce different phenotypes in each of the three tomato cultivars. The data supported both hypotheses. This study demonstrated that plant genetic background and biomass source are important variables that must be considered for using biochar as a soil amendment.

1. Introduction

Intensified crop production has resulted in a loss of organic matter and sodification in many soils, leading to the deterioration of soil health [1]. To combat depleting tilth, new soil management practices are being employed in attempts to increase soil organic matter (SOM), foster a diverse soil microbiome, improve crop productivity, and promote additional ecosystem services [2,3,4,5,6]. However, due to changing climatic conditions, soil organic carbon (SOC) levels are projected to decrease in the future [7]. Therefore, it is critical to pursue interventions that encourage beneficial soil practices such as implementing cover crops and reduced tillage [8,9,10]. Such measures will aid in the development of carbon-negative ecosystems, which focus on returning carbon assimilated by plants into the soil in a stable form. These challenges need to be addressed to ensure global food security for current and future generations.
One potential solution to address these challenges is biochar (BC), a carbon-rich, porous product generated by a thermochemical process known as pyrolysis or gasification. The production process involves the controlled thermal decomposition of feedstock under low oxygen levels at temperatures ranging from 300 °C to 800 °C [11,12]. The production of BC can be achieved using various feedstocks, the most common of which include agricultural crop residue, organic manure, and wood [13]. The feedstock source determines the final nutrient profile of the biochar. Organic waste feedstocks generate BC rich in potassium and phosphorus, low in C levels, and low in surface area. BC derived from wood feedstocks is enriched in organic matter and surface area; however, it has low N, P, and K levels and a reduced capacity for cation exchange. Generally, crop residue-derived BCs are rich in N [14,15,16]. The variation in nutrient profiles along with other physical properties determines how the BC interacts with the soil and collectively influences plant performance. The specific impacts of BC amendment to soil include alterations in bulk density, porosity, and water retention; these properties make the exchange of water, nutrients, and gases more efficient, resulting in enhanced crop productivity [17,18]. Productivity in a diverse range of crops, including tomatoes, lettuce and other leafy vegetables, beans, potatoes, wheat, maize, and rice, among others, has been evaluated in soils amended with BC derived from various feedstocks [19,20,21,22,23,24,25]. Additionally, since BC is a stable source of carbon and nutrients, it enables the proliferation of beneficial microbial communities, which in turn enhance soil tilth and health [2,26]. With improvements in automation, it is now feasible to produce consistent-quality BC; together with a growing knowledge of the utility of BC as a soil amendment for enhancing nutrient availability and facilitating long-term carbon sequestration, utilization in both research and farming is expected to increase [27,28,29,30,31].
The biological, chemical, and physical influence of BC and its role in enhancing soil health is well documented; however, its utilization in soils produces a spectrum of outcomes in terms of crop productivity [25,32,33,34,35,36,37]. Several recent meta-analyses investigating the role of BC on crop productivity conclude that, overall, there is a positive impact on crop yield [16,29,38,39]. However, there are studies where the BC amendment impacts one aspect of plant development but has no impact on yield or produces a detrimental outcome [21,40,41]. It is well known that the genetic background of a plant influences how it responds to a given stimulus [42,43,44]. Interestingly, most previous reports evaluating the impact of BC have studied one cultivar’s response to biochar derived from a single feedstock. The interaction between BC type and genotype remains largely unexplored.
In this study, the impact of BC derived from six different feedstocks on the growth and development of three genotypically distinct cultivars of tomato (Solanum lycopersicum L.) was evaluated. Experiments were conducted to test the following hypotheses: (1) BC derived from different feedstock sources will produce unique phenotypes in a single cultivar of tomato, and (2) a single feedstock-derived BC will produce different phenotypes in each of the three tomato cultivars.

2. Materials and Methods

2.1. BC Source

Five types of BC generated from their respective feedstocks were provided by Ag Energy Systems (Spokane, WA, USA). The feedstocks used were as follows: ryegrass straw (RGS), ryegrass tailings (RGT), Russian thistle (RT), thermomechanical pulp waste (TMP), and walnut shell (W). A commercially available BC product, CoolTerra® (CT), manufactured by Cool Planet (Greenwood Village, CO, USA), was also used in the study. All experiments were conducted with 0.5% and 1% w/w rates of BC amendment.

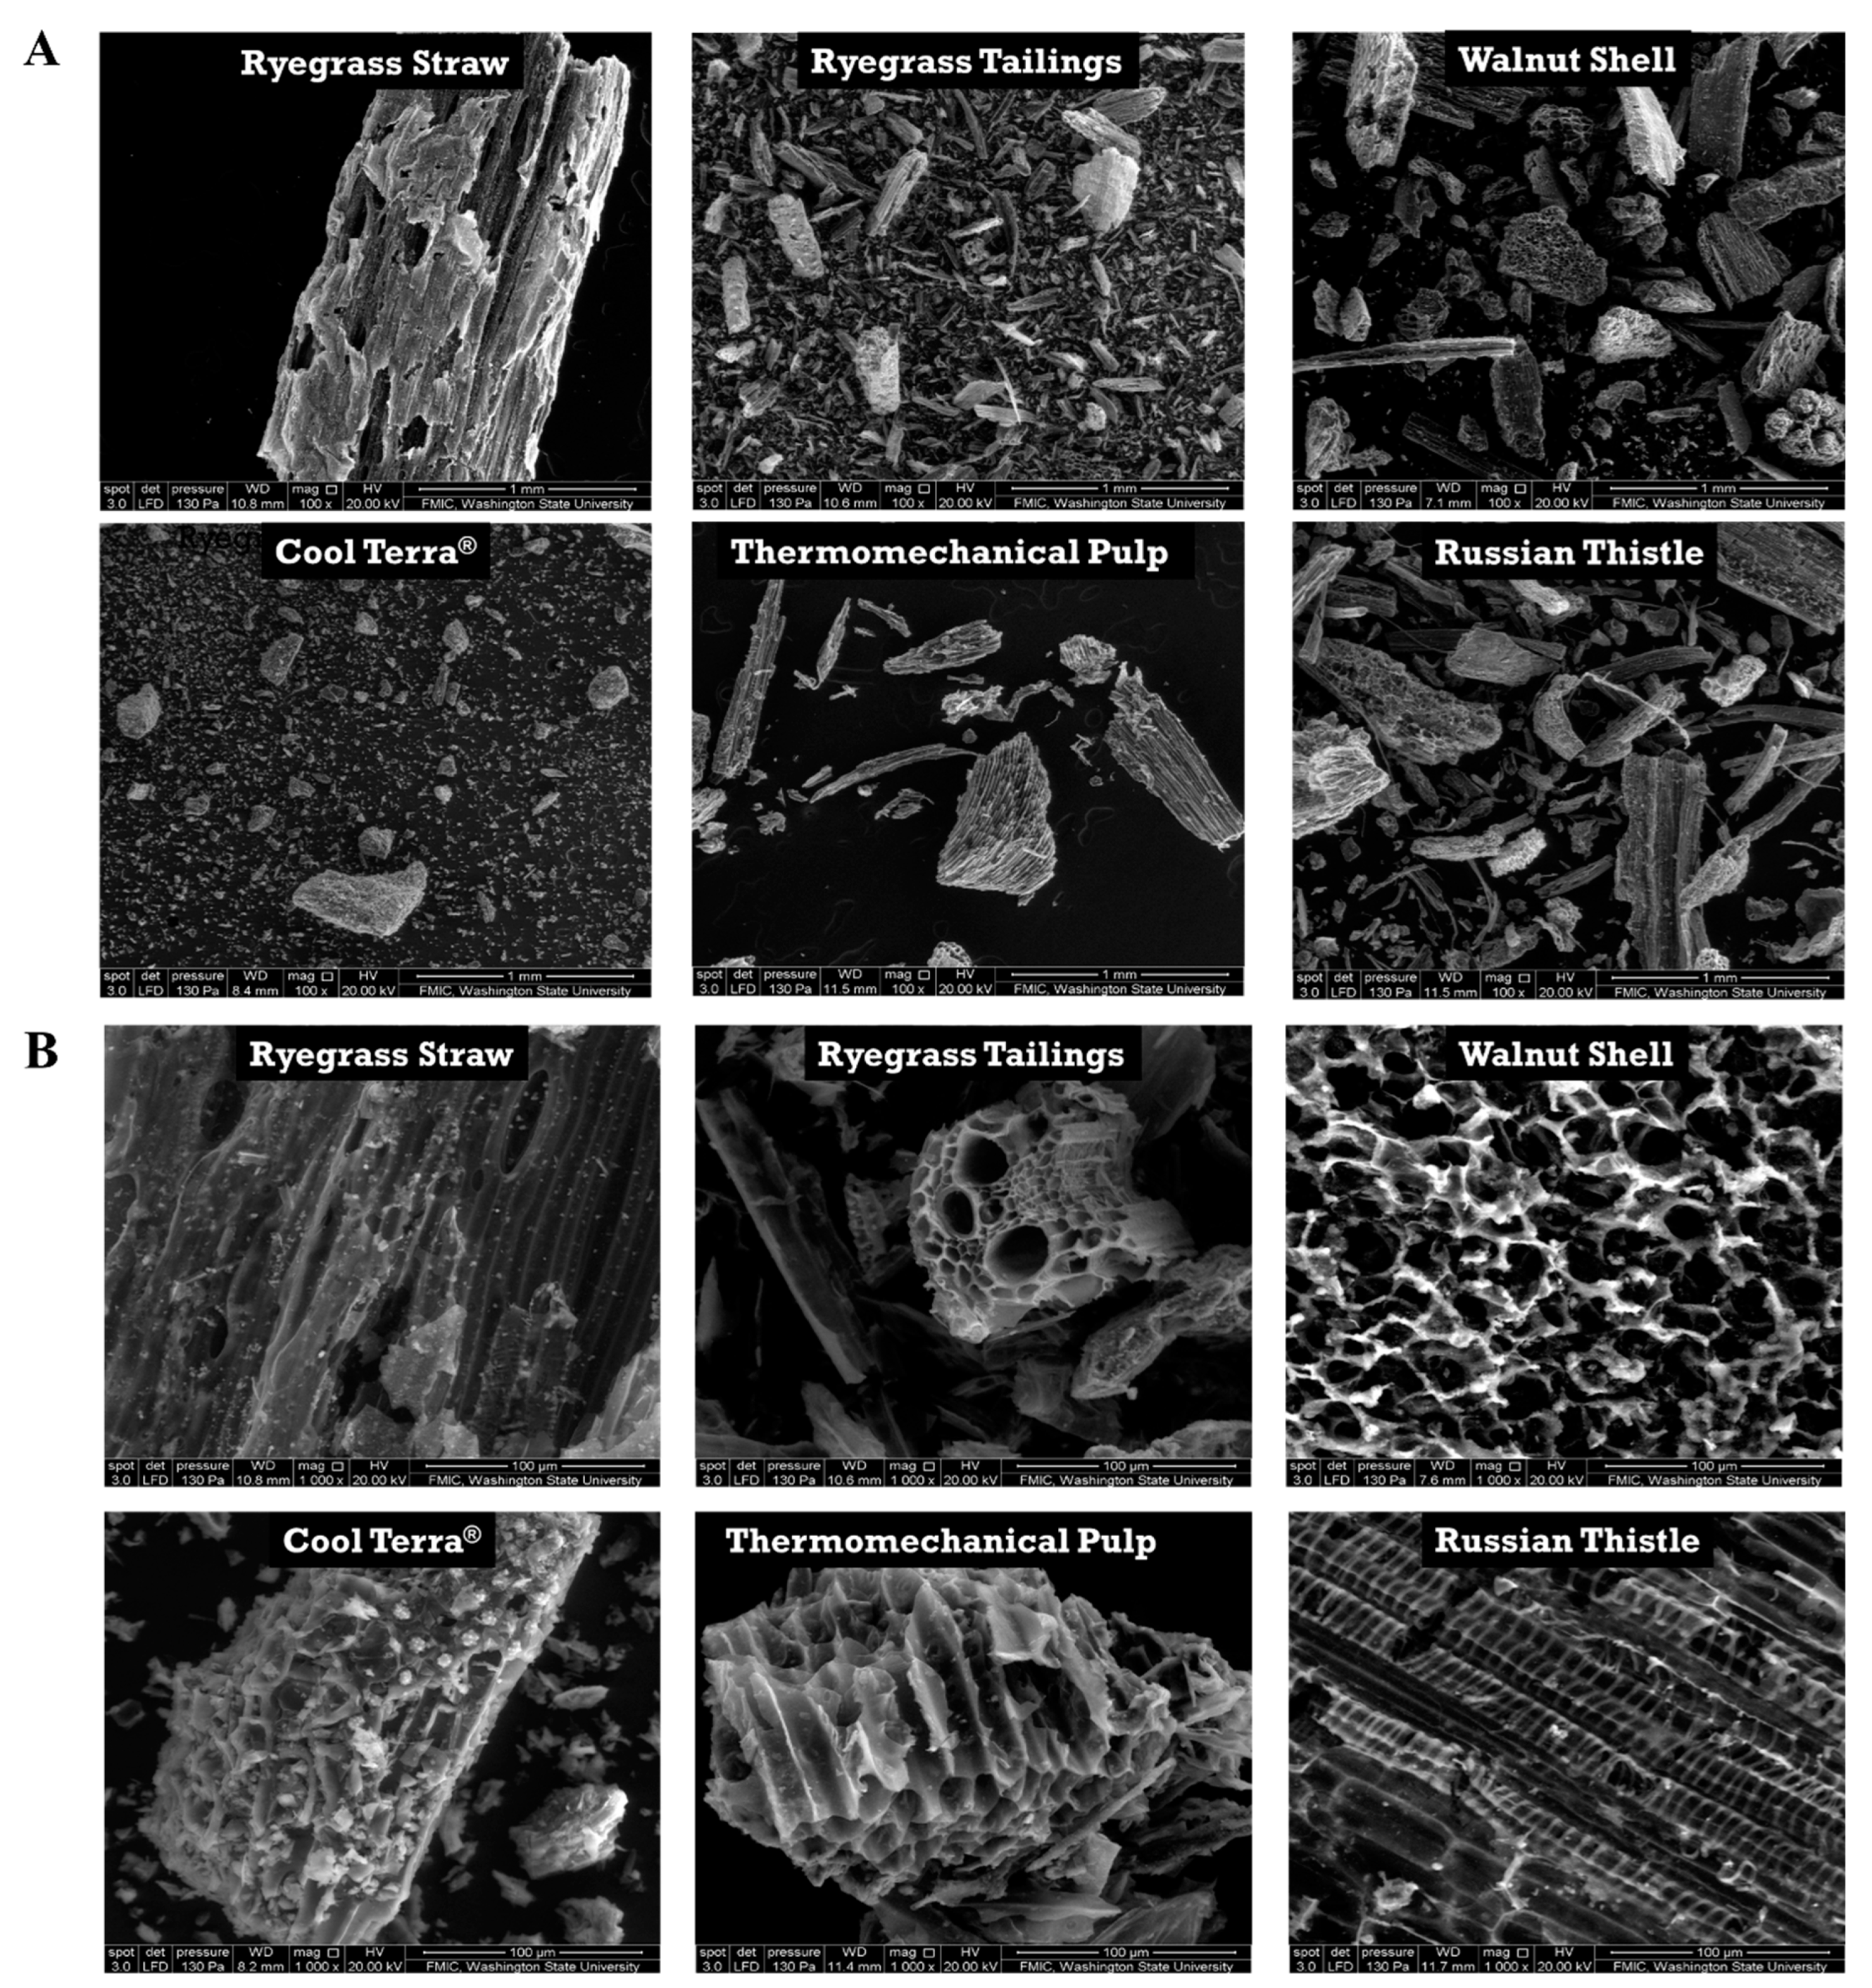
2.2. SEM and EDX Analysis

Scanning electron microscopy (SEM) was performed on each BC at the Franceschi Microscopy and Imaging Center at Washington State University. A sample of each BC was fixed to a pin stub and sputter coated in gold. SEM samples were imaged on a Tescan Vega SEM equipped with an energy-dispersive X-ray spectroscopy (EDX) detector to make a qualitative visual assessment of the biochar samples. Images were recorded at a 1 mm and a 100 μm resolution (Figure 1A,B). Qualitative elemental composition data for each BC were collected with the EDX detector.

2.3. Plant Growth Conditions

Three cultivars of tomato (Solanum lycopersicum L.) representing unique market applications and diverse genetic backgrounds were selected for this experiment. ‘Oregon Spring’, an heirloom determinate variety, was selected due to its popularity in home gardening. ‘Heinz 2653’, also a determinate variety, is commonly used as a commercial processing tomato. ‘Cobra F1’, an indeterminate variety, was selected due to its commercial use as a greenhouse variety.
Seeds for the three cultivars were obtained from the Territorial Seed Company (Cottage Grove, OR, USA). Seeds were germinated in 4-inch rockwool squares and grown to 4–5 nodes (15–20 cm) in height. Afterward, plantlets were transplanted into 2.8 L pots with either organic Sunshine Mix#1/LC1 (Sun Gro Horticulture, Agawam, MA, USA) as a control or Sunshine Mix containing BC at 0.5% and 1% (w/w) rates. One week after transplant, each pot was fertilized twice a week with 450 mL of dilute (20 mL/L water) organic Alaska 5-1-1 Fish Fertilizer (Lilly Miller Brands, Atlanta, CA, USA). Plants were maintained in a glasshouse at the Washington State University Plant Growth Facilities with temperatures held at 24 °C/18 °C (day/night); relative humidity was maintained at 40–60%. High-Pressure Sodium (HPS) lights provided supplemental lighting, extending the day length to 16 h as needed. Young plants were watered every other day, while the larger, mature plants were watered daily. Plants growing on the glasshouse benches were initially arranged in a randomized design and after two weeks of growth underwent regular plant rotations and random sampling to reduce spatial variation in the glasshouse.

2.4. Experimental Design

Six independent experiments were conducted, with two experiments each for ‘Oregon Spring’, ‘Heinz 2653’ (‘Heinz 2653’), and ‘Cobra’ F1 (Table 1). Experiments with ‘Heinz 2653’ and ‘Oregon Spring’ were conducted over 102 days while with ‘Cobra’ F1 for 182 days (Table 1). Each experiment consisted of 56 plants of the same genotype: eight plants were grown in soil media containing 0% BC and served as controls, while four plants were randomly assigned to each of the 12 treatment groups (Table 2).

2.5. Plant Growth Parameters and Assessment of Fruit Quality

Dry weight: The shoot biomass of each plant was collected at the conclusion of each experiment. Fruits were removed, plants were cut at soil level, and the shoots were completely dried in large paper bags at 60 °C for 48 h. The resulting dry tissue was weighed in grams of aboveground dry mass per plant.
Yield: To measure yield, four random fruits per plant were selected for sampling at the ‘Breaker’ stage [45,46]. Following the achievement of the ‘Red’ stage, the point in development where greater than 90% of a fruit’s surface area displays color change, fruit were collected at regular intervals throughout the remainder of the experiment [46]. The yield for each plant was quantified based on the total number of fruits and cumulative fruit weight in grams.
Quality: Fruit quality parameters were assessed by quantifying total soluble solids (TSS), sugars, and organic acid content. A handheld rotary Bio-Homogenizer (model M133/1281-0 from Biospec Products Inc., Bartlesville, OK, USA) was used to extract juice from five grams of fruit pericarp tissue from each of the four sampled fruits. Juice extracted from ‘Red’ stage fruit was filtered through cheesecloth and used for the refractometer-based quantification of TSS. An aliquot of the juice sample was centrifuged and the supernatant was filtered using 0.45 µm pore size filters. The filtered supernatant was stored at −80 °C for later use in the quantification of sugar and organic acid profiles. Fructose, glucose, citric acid, malic acid, and fumaric acid were quantified using a Varian Prostar 230 HPLC equipped with an Aminex HPX 87H column coupled to a refractive index (RI) and UV (210 nm) detector. The column was eluted with 0.005 M of H2SO4 at a flow rate of 0.6 mL/min at 65 °C [47]. The identification and quantification of sugars and organic acids were performed using a previously published method [47].

2.6. Statistical Analysis

2.6.1. Three-Way and Two-Way ANOVA

For each greenhouse trial, plant dry weight, fruit yield per plant, fruit organic acid (citrate and malate), and fruit carbohydrate (glucose and fructose) data were subjected to 3-way analysis of variance (ANOVA) with variation partitioned into main effects (3 cultivars, 6 biochars, 3 rates) and interactions. The data were also analyzed using 2-way ANOVA to assess the effects of biochar, biochar rate, and their interaction separately for each cultivar. The p-values for main effects and interactions were calculated for the 3-way and 2-way factorial analyses. Data are plotted separately (±SE) by cultivar with means separated by LSD (p < 0.1) to show the effects of biochar and biochar rate (linear, deviations) on growth, yield, and fruit chemistry.

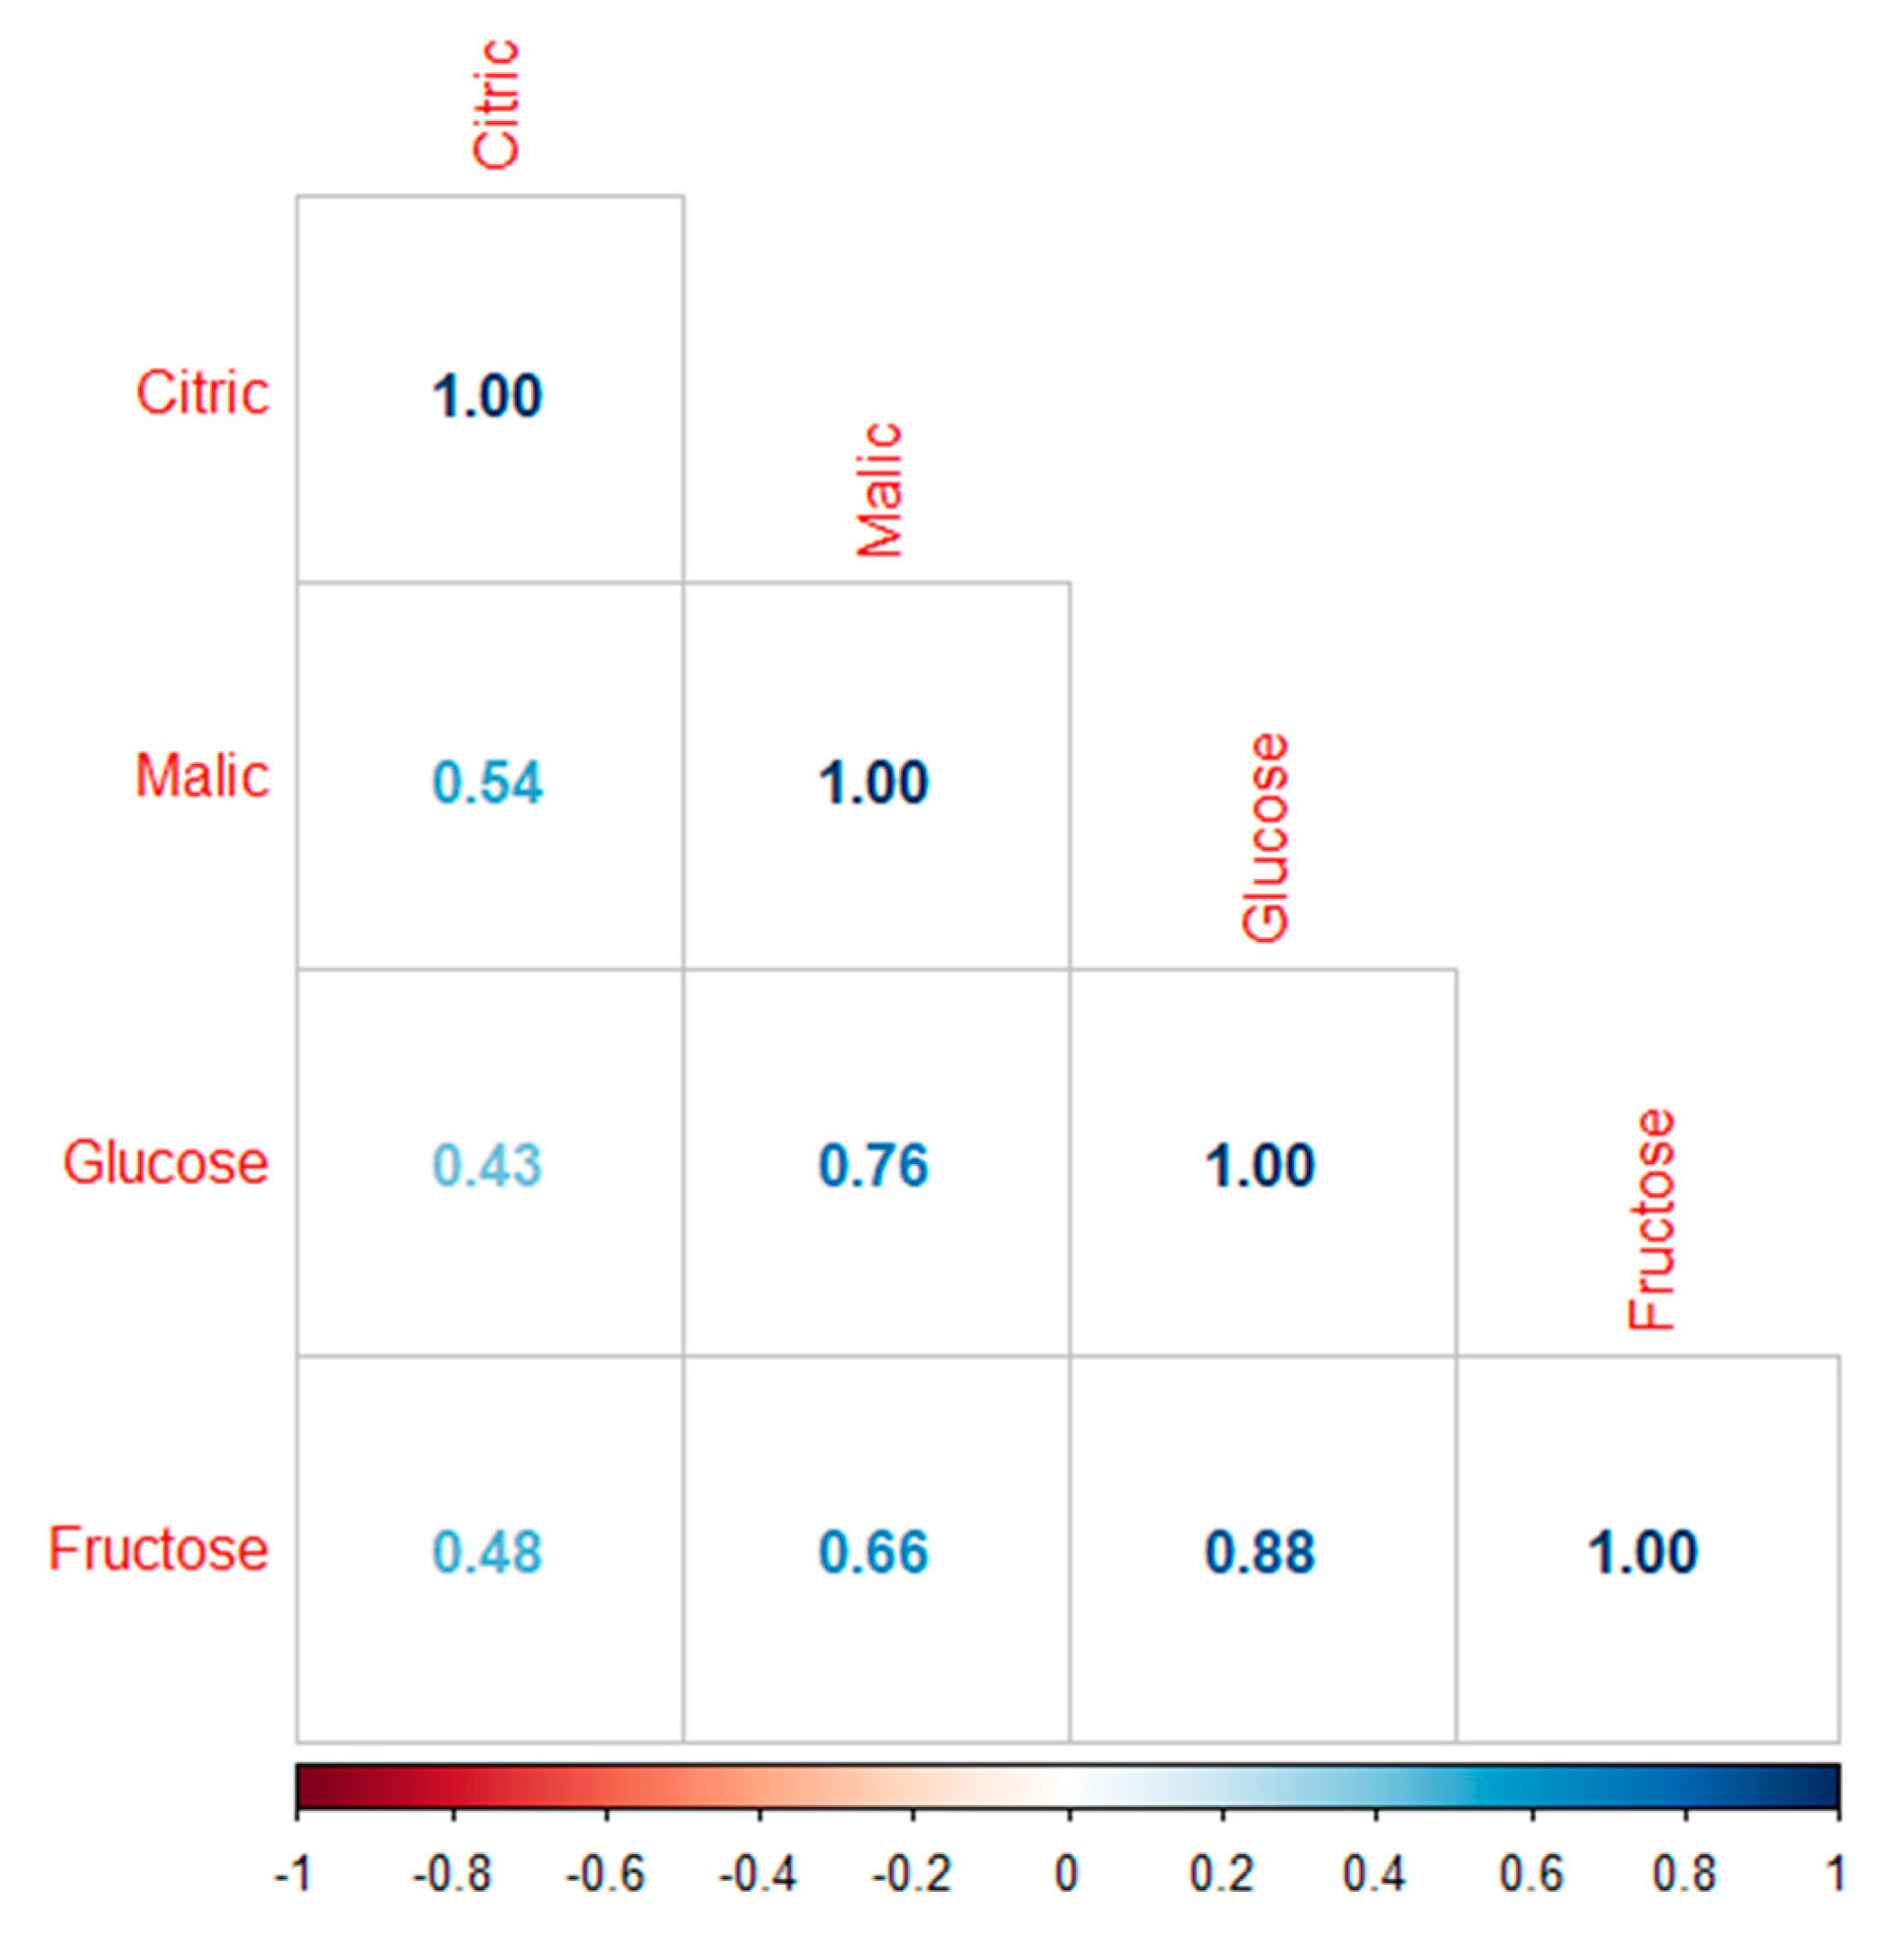
2.6.2. Correlation Plot

The correlation plot was generated by running correlation tests between fruit citric acid, malic acid, glucose, and fructose measurements using R version 4.2.2 with the R libraries stats, dplyr, and corrplot.

3. Results and Discussion

3.1. Qualitative Characterization of BC Using Scanning Electron Microscopy and EDX

BC derived from ryegrass straw and tailings (RGS and RGT) represents crop-residue biomass, while walnut shell BC (W) is derived from highly lignified biomass waste. Russian thistle (RT) represents biomass where lignification is intermediate between hardwoods and crop residue. Thermomechanical pulp (TMP) is a derivative of a process that involves heat and mechanical pressure to soften the lignin and fiberize hardwood material for the production of paper [48].
Micrographs were recorded for each BC at 100× and 1000× magnifications. A qualitative visual analysis revealed that the plant residue BC, RGT, and RT exhibited a more heterogeneous composition, exemplified by a broader range of particle sizes, in comparison with the walnut and thermomechanical pulp BC (Figure 1A,B). The CoolTerra BC featured the smallest particle size of the examined BCs, and the pores were occluded with small particles. Each feedstock in this study generated BC with distinct microscopic structures. These unique physical properties likely provide unique capabilities in regard to altering soil physical characteristics such as moisture content, bulk density, and pH [49,50] as well as microbial and nutrient uptake interactions in the rhizosphere [2] (Figure 1A,B).
Characterization with EDX spectra facilitated the qualitative estimation of the specific elements present in each BC. The EDX method is an analytical technique that relies on X-ray excitation and its interaction with a given sample. The unique atomic structure of each element in a sample corresponds to distinctive peaks on the electromagnetic emission spectrum, allowing for chemical and elemental characterization [51]. Nitrogen (N), phosphorus (P), potassium (K), calcium (Ca), and silicon (Si) were the most abundant elements in all BC varieties (Table 3). Sulfur (S) and aluminum (Al) were detected in three BCs (RT, Russian thistle; W, walnut; and CT, CoolTerra®), while chlorine (Cl), molybdenum (Mo), magnesium (Mg), and sodium (Na) were only scarcely distributed among the BCs. Ryegrass tailings (RGT)-derived BC contained all analyzed elements except Cl and Na, while the only elements identified in walnut BC were N, P, Ca, and Al (Table 3). Walnut BC also demonstrated highly lignified cell walls. While this study used EDX to qualitatively assess BC elemental composition, it is feasible to use this methodology for quantitative elemental analysis [52]. The elemental composition observed is consistent with the results of other studies that examined the chemical properties of BCs; woody tissue-derived BC consistently demonstrates a less diverse and beneficial nutrient profile relative to BC derived from other sources [53] despite their generally higher surface area. These results indicate that feedstocks influence the chemical composition of their BC derivatives, which vary further based on pyrolysis temperature and retention time [54].

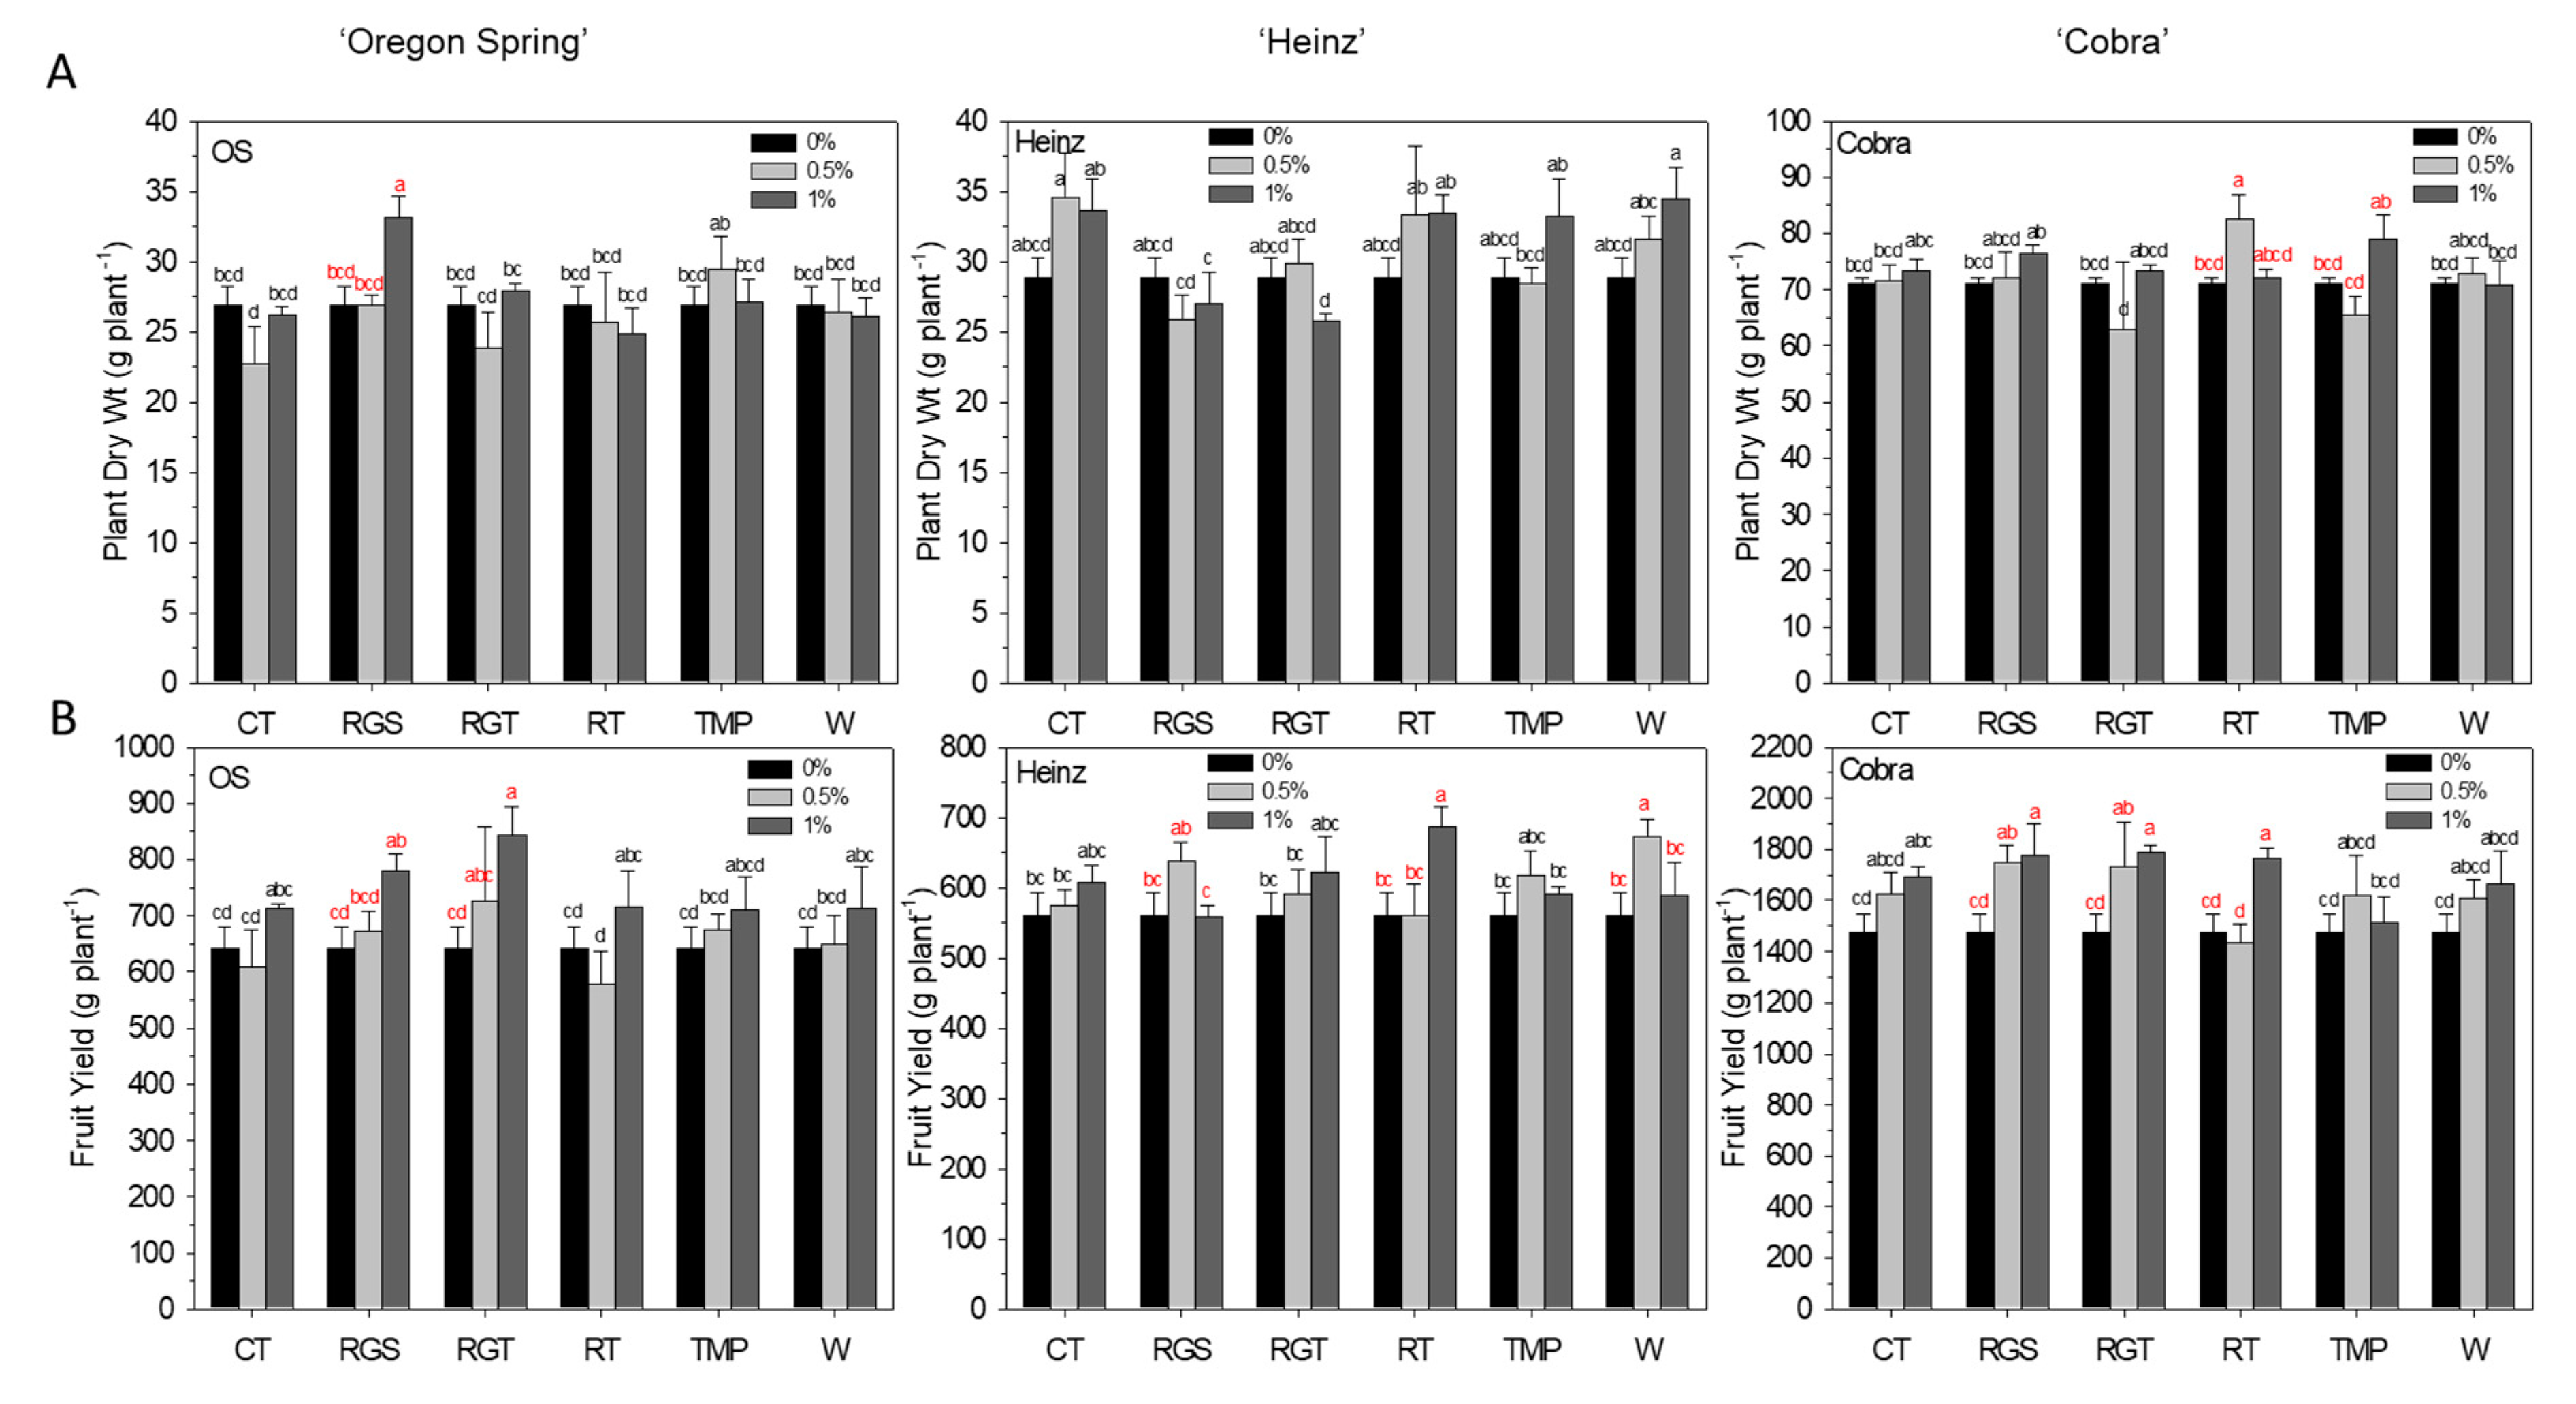
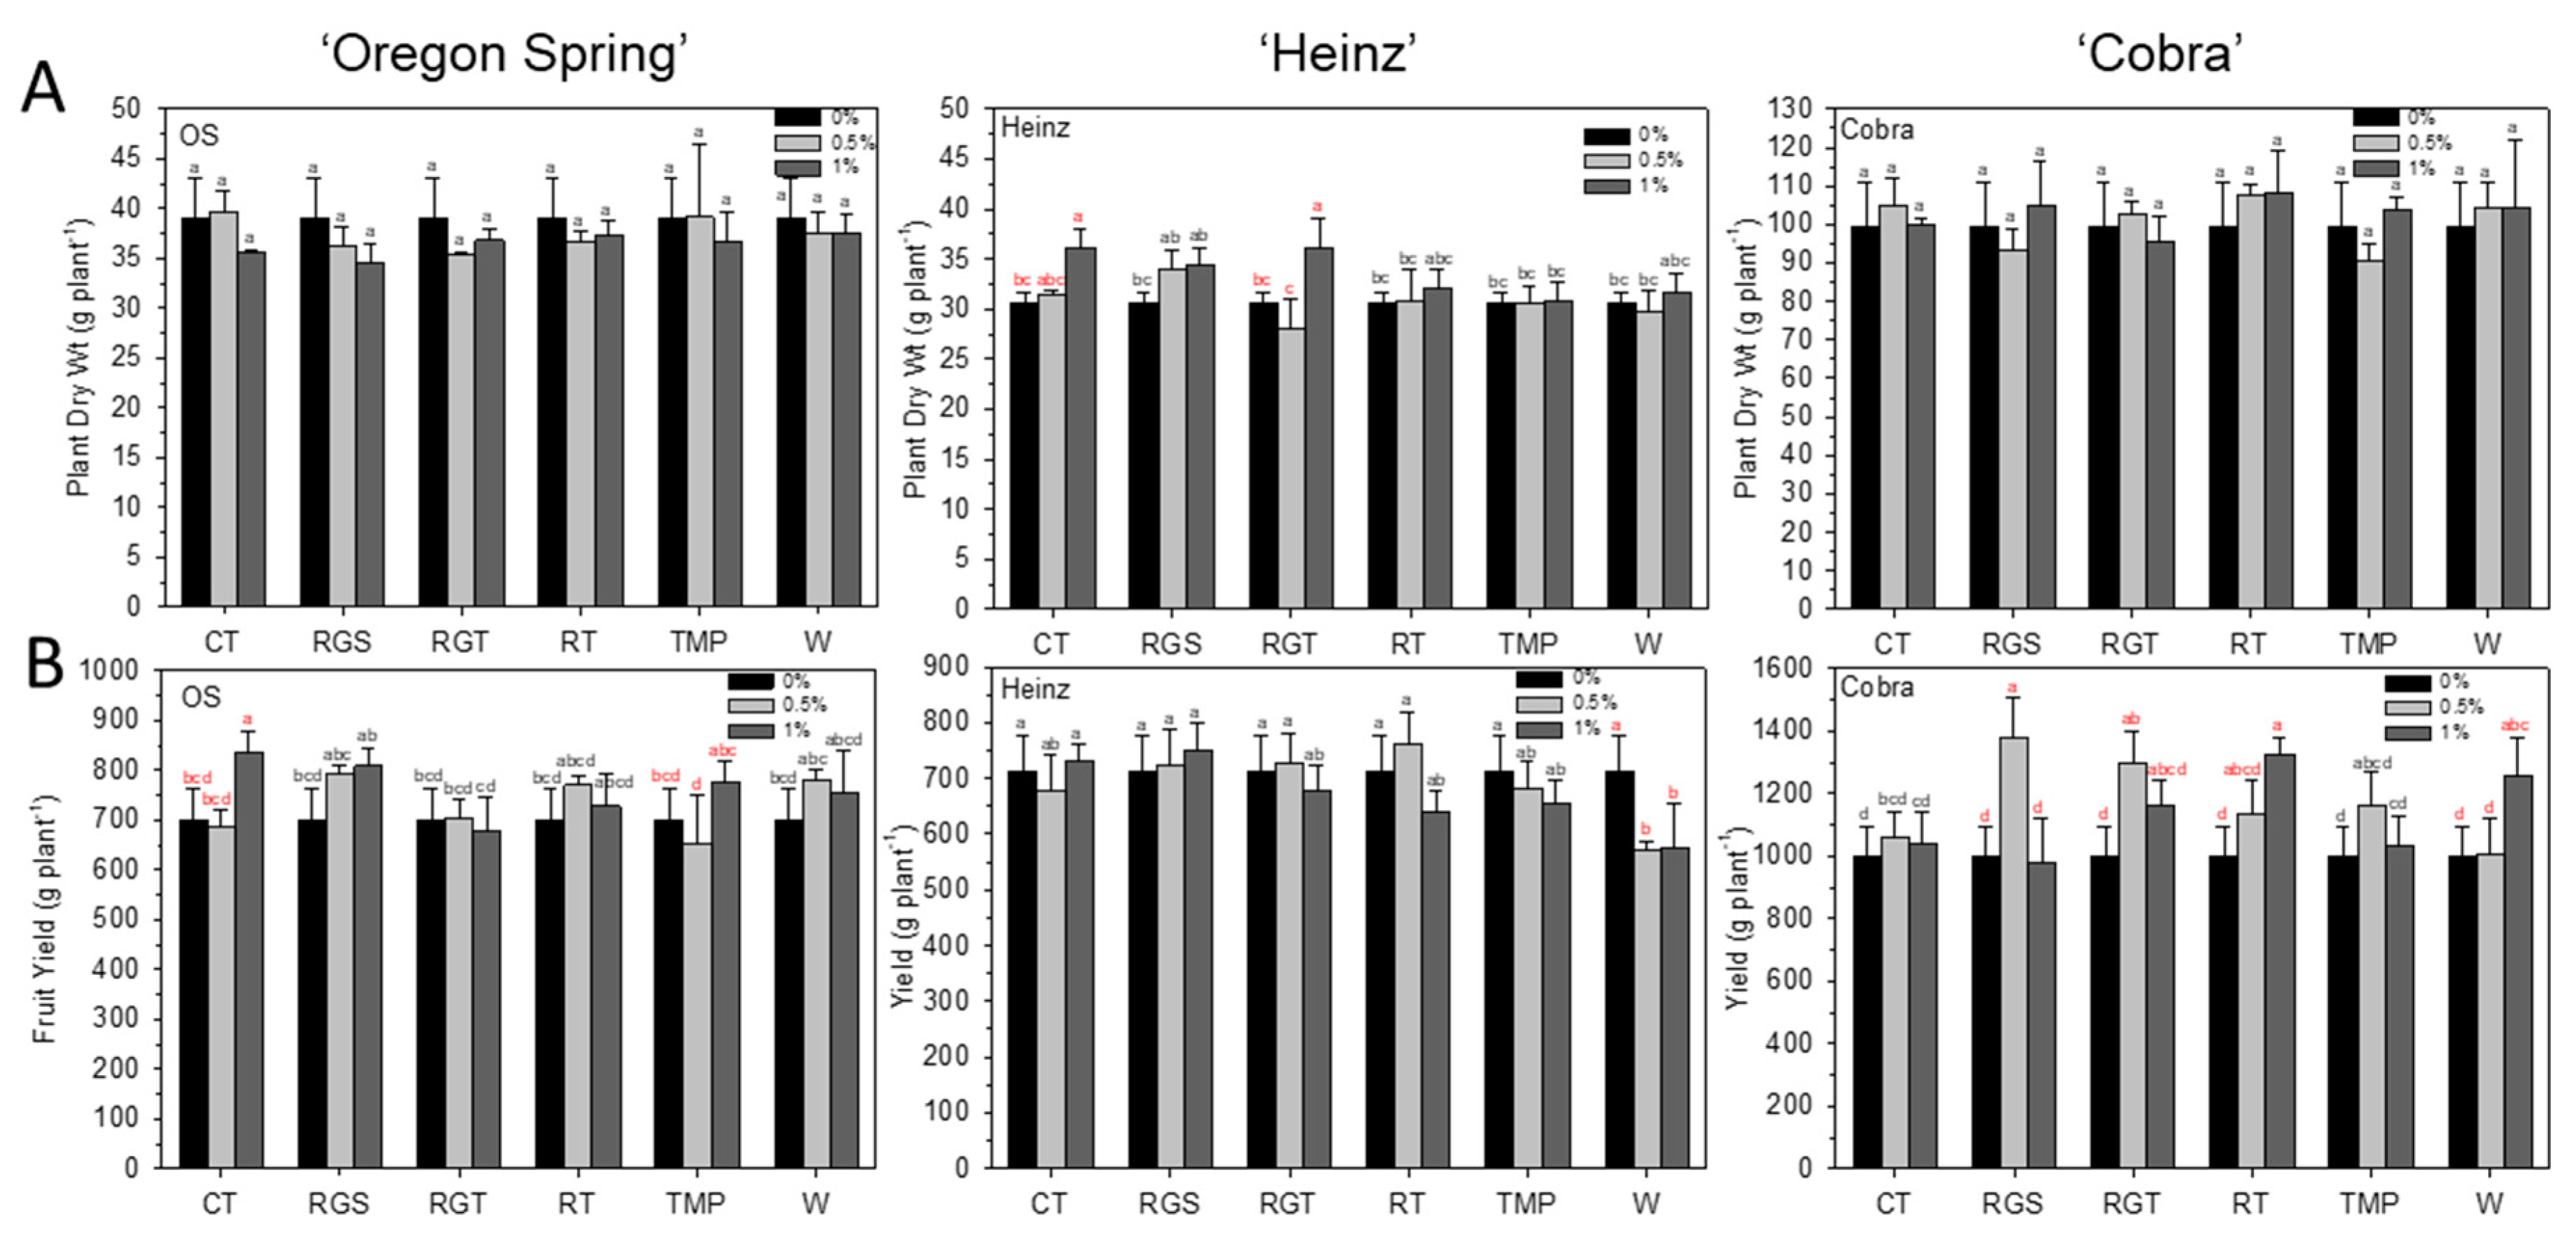
3.2. Agronomic Traits: Plant Dry Weight and Yield Per Plant

BC had a generally positive or non-significant impact on the agronomic traits explored in this study, the yield per plant (YPP) and the plant dry weight (PDW). Of the 108 groups, PDW had significantly increased over the control in 4, and remained unchanged in 104, while YPP was elevated in 14, unchanged in 88, and decreased in 2. Effect sizes varied widely, especially in terms of YPP, where decreases of as large as 151 g/plant were seen in ‘Heinz’ 0.5% W Trial 2 and increases of as large as 326 g/plant in ‘Cobra’ 0.5% RGS Trial 2 (Figure 2 and Figure 3). RGS and RGT produced significant increases in the greatest number of trials for these traits; while very different in average particle size and pore size (Figure 1), both are crop residue BCs with diverse elemental compositions relative to the woody tissue-derived BCs (Table 3).
Three–way ANOVA indicated that PDW has a significant response according to cultivar alone in Trial 2 and both cultivar and the rate of BC application in Trial 1, but not the BC type or interactions between any of these variables. YPP saw a similar significant response not only to the cultivar and BC rate but also to the interaction between these two variables in both trials (Table 4). Broken down by cultivar, two–way ANOVA indicated that the only significant PDW response was ‘Heinz’ to BC type in Trial 1 and to BC rate in Trial 2; while the response of YPP to BC rate varied depending on cultivar, the BC type did not appear to be consequential (Table 5).
Previous reports on BC’s impact on agronomic traits have also demonstrated mixed results, dependent upon both the biochar type and the studied plant. It was noted that there was an increase in tomato fruit diameter and yield in grapes in BC and compost-amended soils [55]. However, a field trial with tomato cultivar ‘Trust’ with 10 or 20% (v/v) hardwood BC generated from balsam fir and spruce showed no difference in crop yield [56]. Augmenting fertigated soilless media with citrus wood BC resulted in an increased yield in pepper, but only improved plant height and leaf size without yield gain in tomato [57]. An enhanced abundance of rhizosphere microbes in addition to a hormesis effect that stimulated plant growth was also reported [57]. Pine needle BC and Lantana BC both improved yield in wheat, but this effect was not observed in rice [58]. Negative agronomic impacts in a variety of cereal, vegetable, and fruit crops grown in soils amended with both wood and crop residue biochar have been previously reviewed [59]. The widely divergent properties of BC depending on feedstock and pyrolysis conditions combined with the rich genetic diversity of crop plants ensures that the effects of BC application on agronomic performance remain difficult to predict.

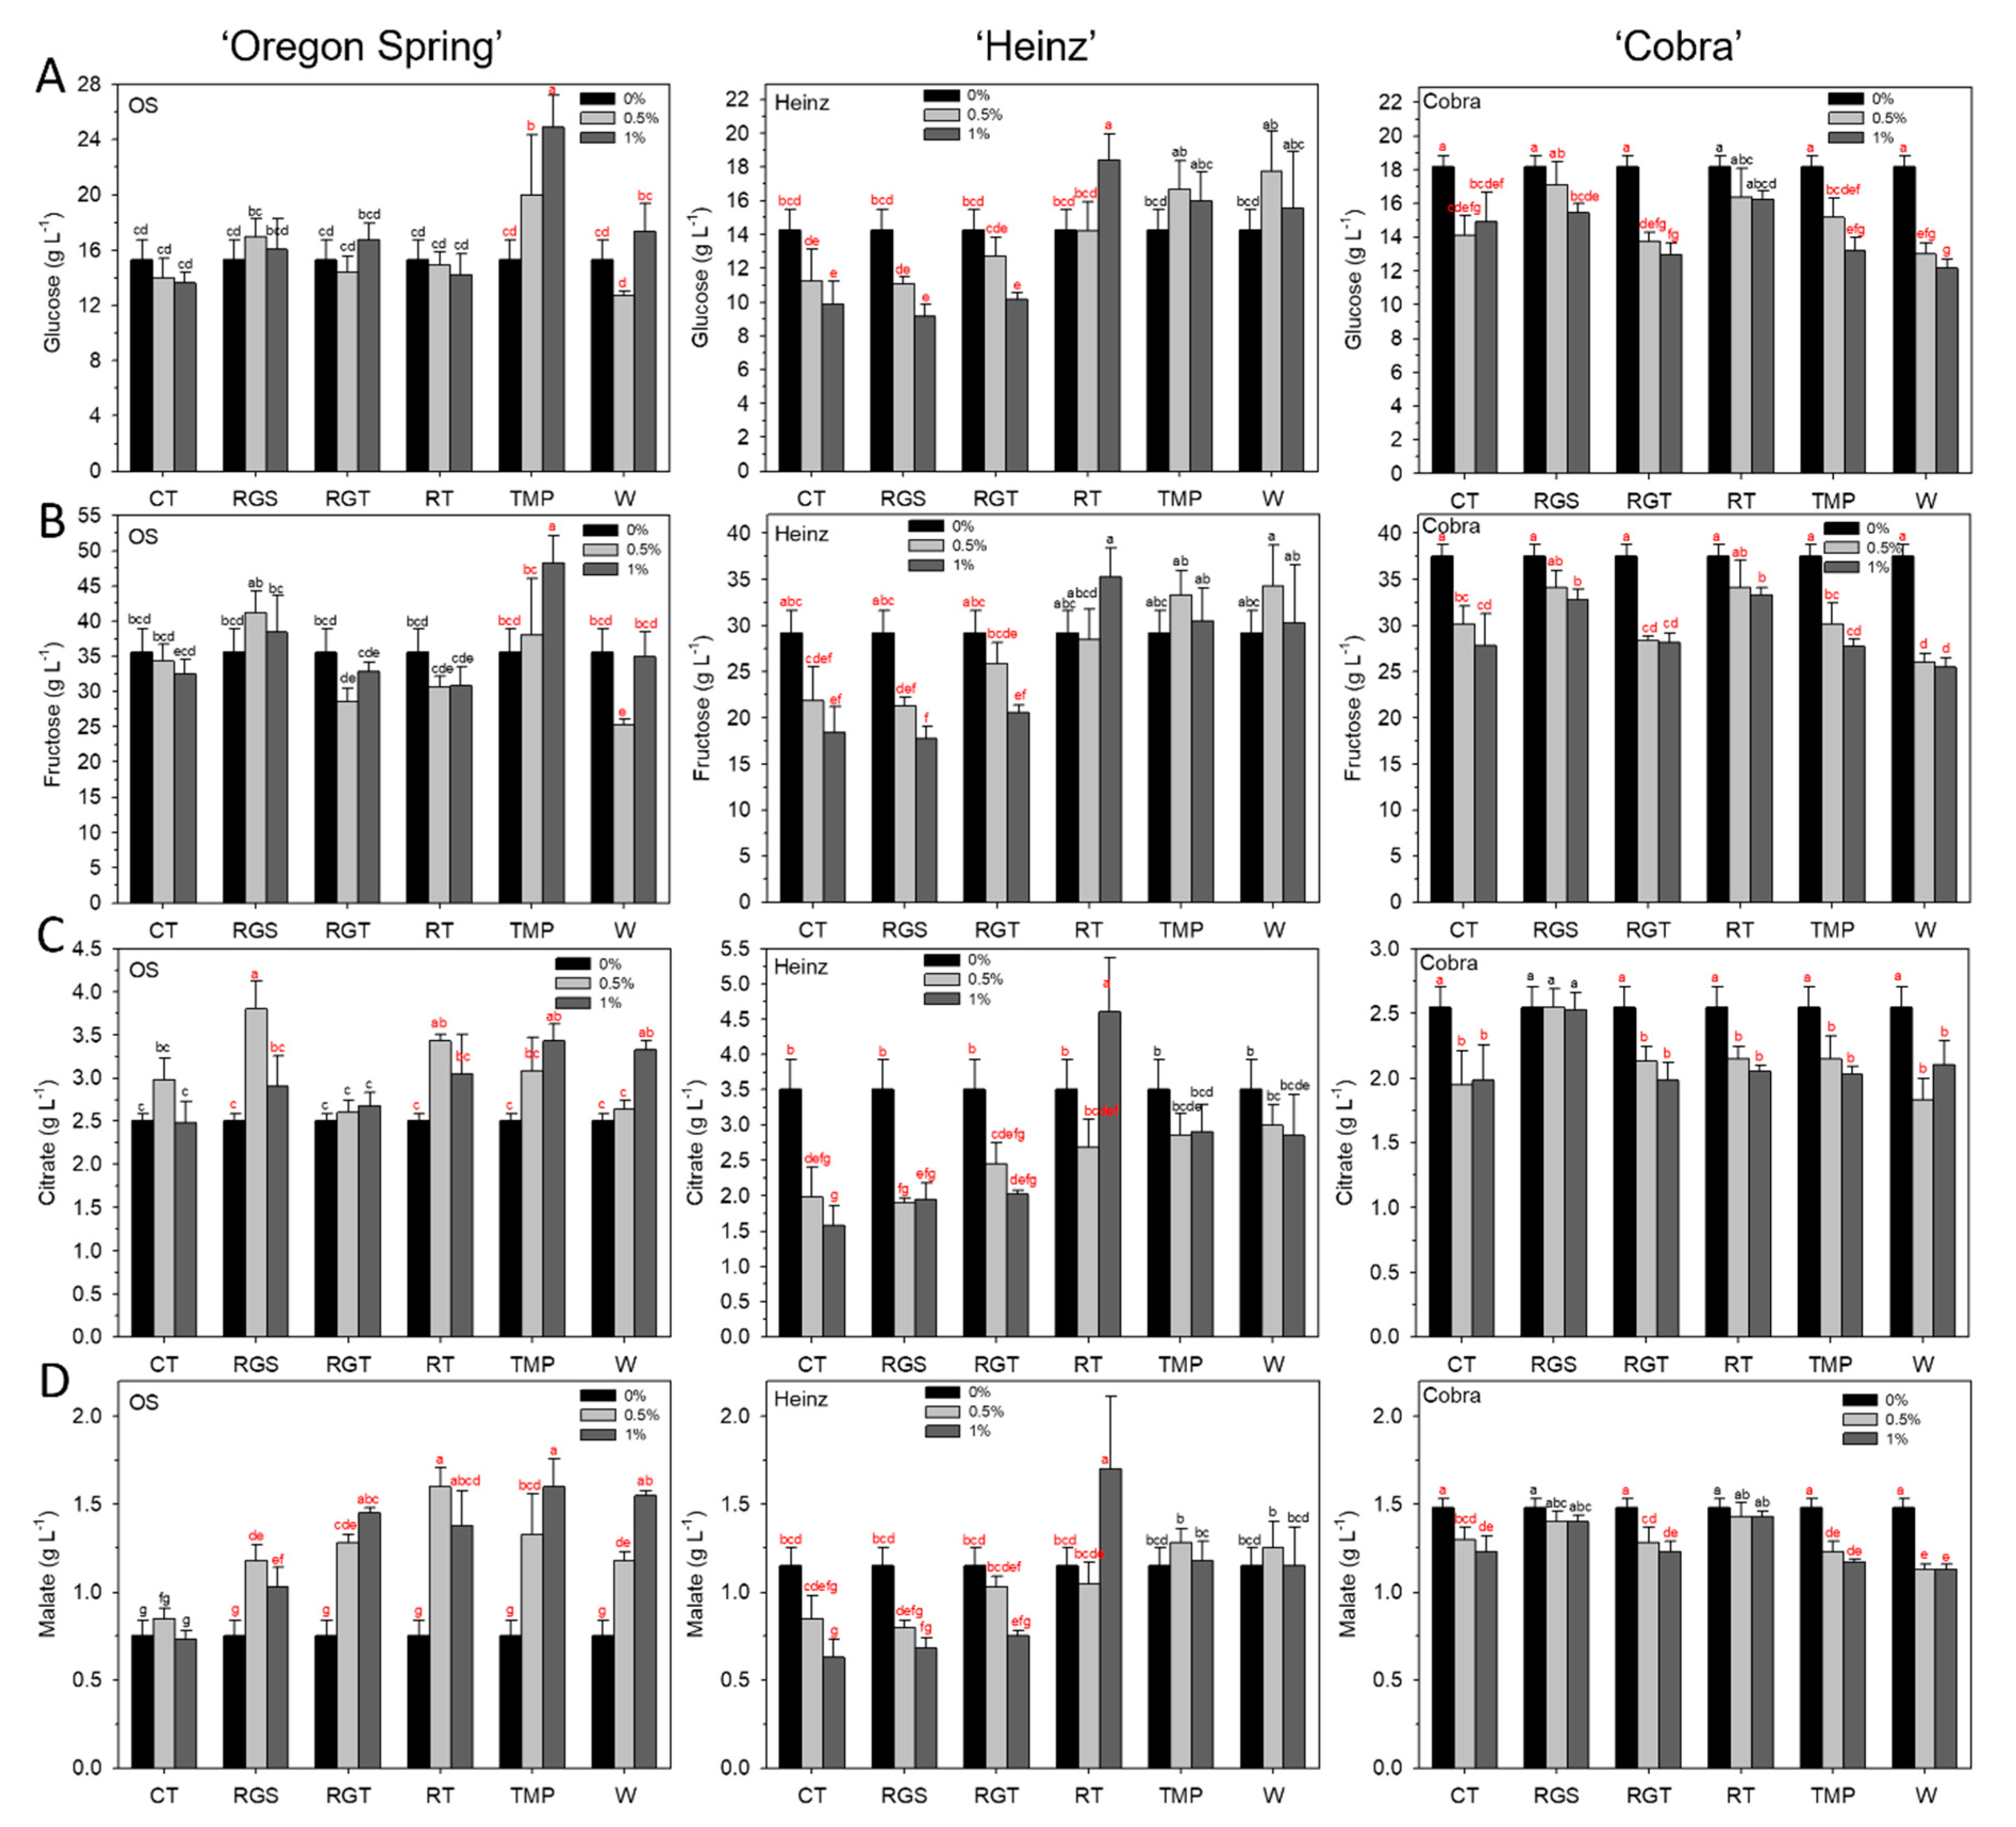
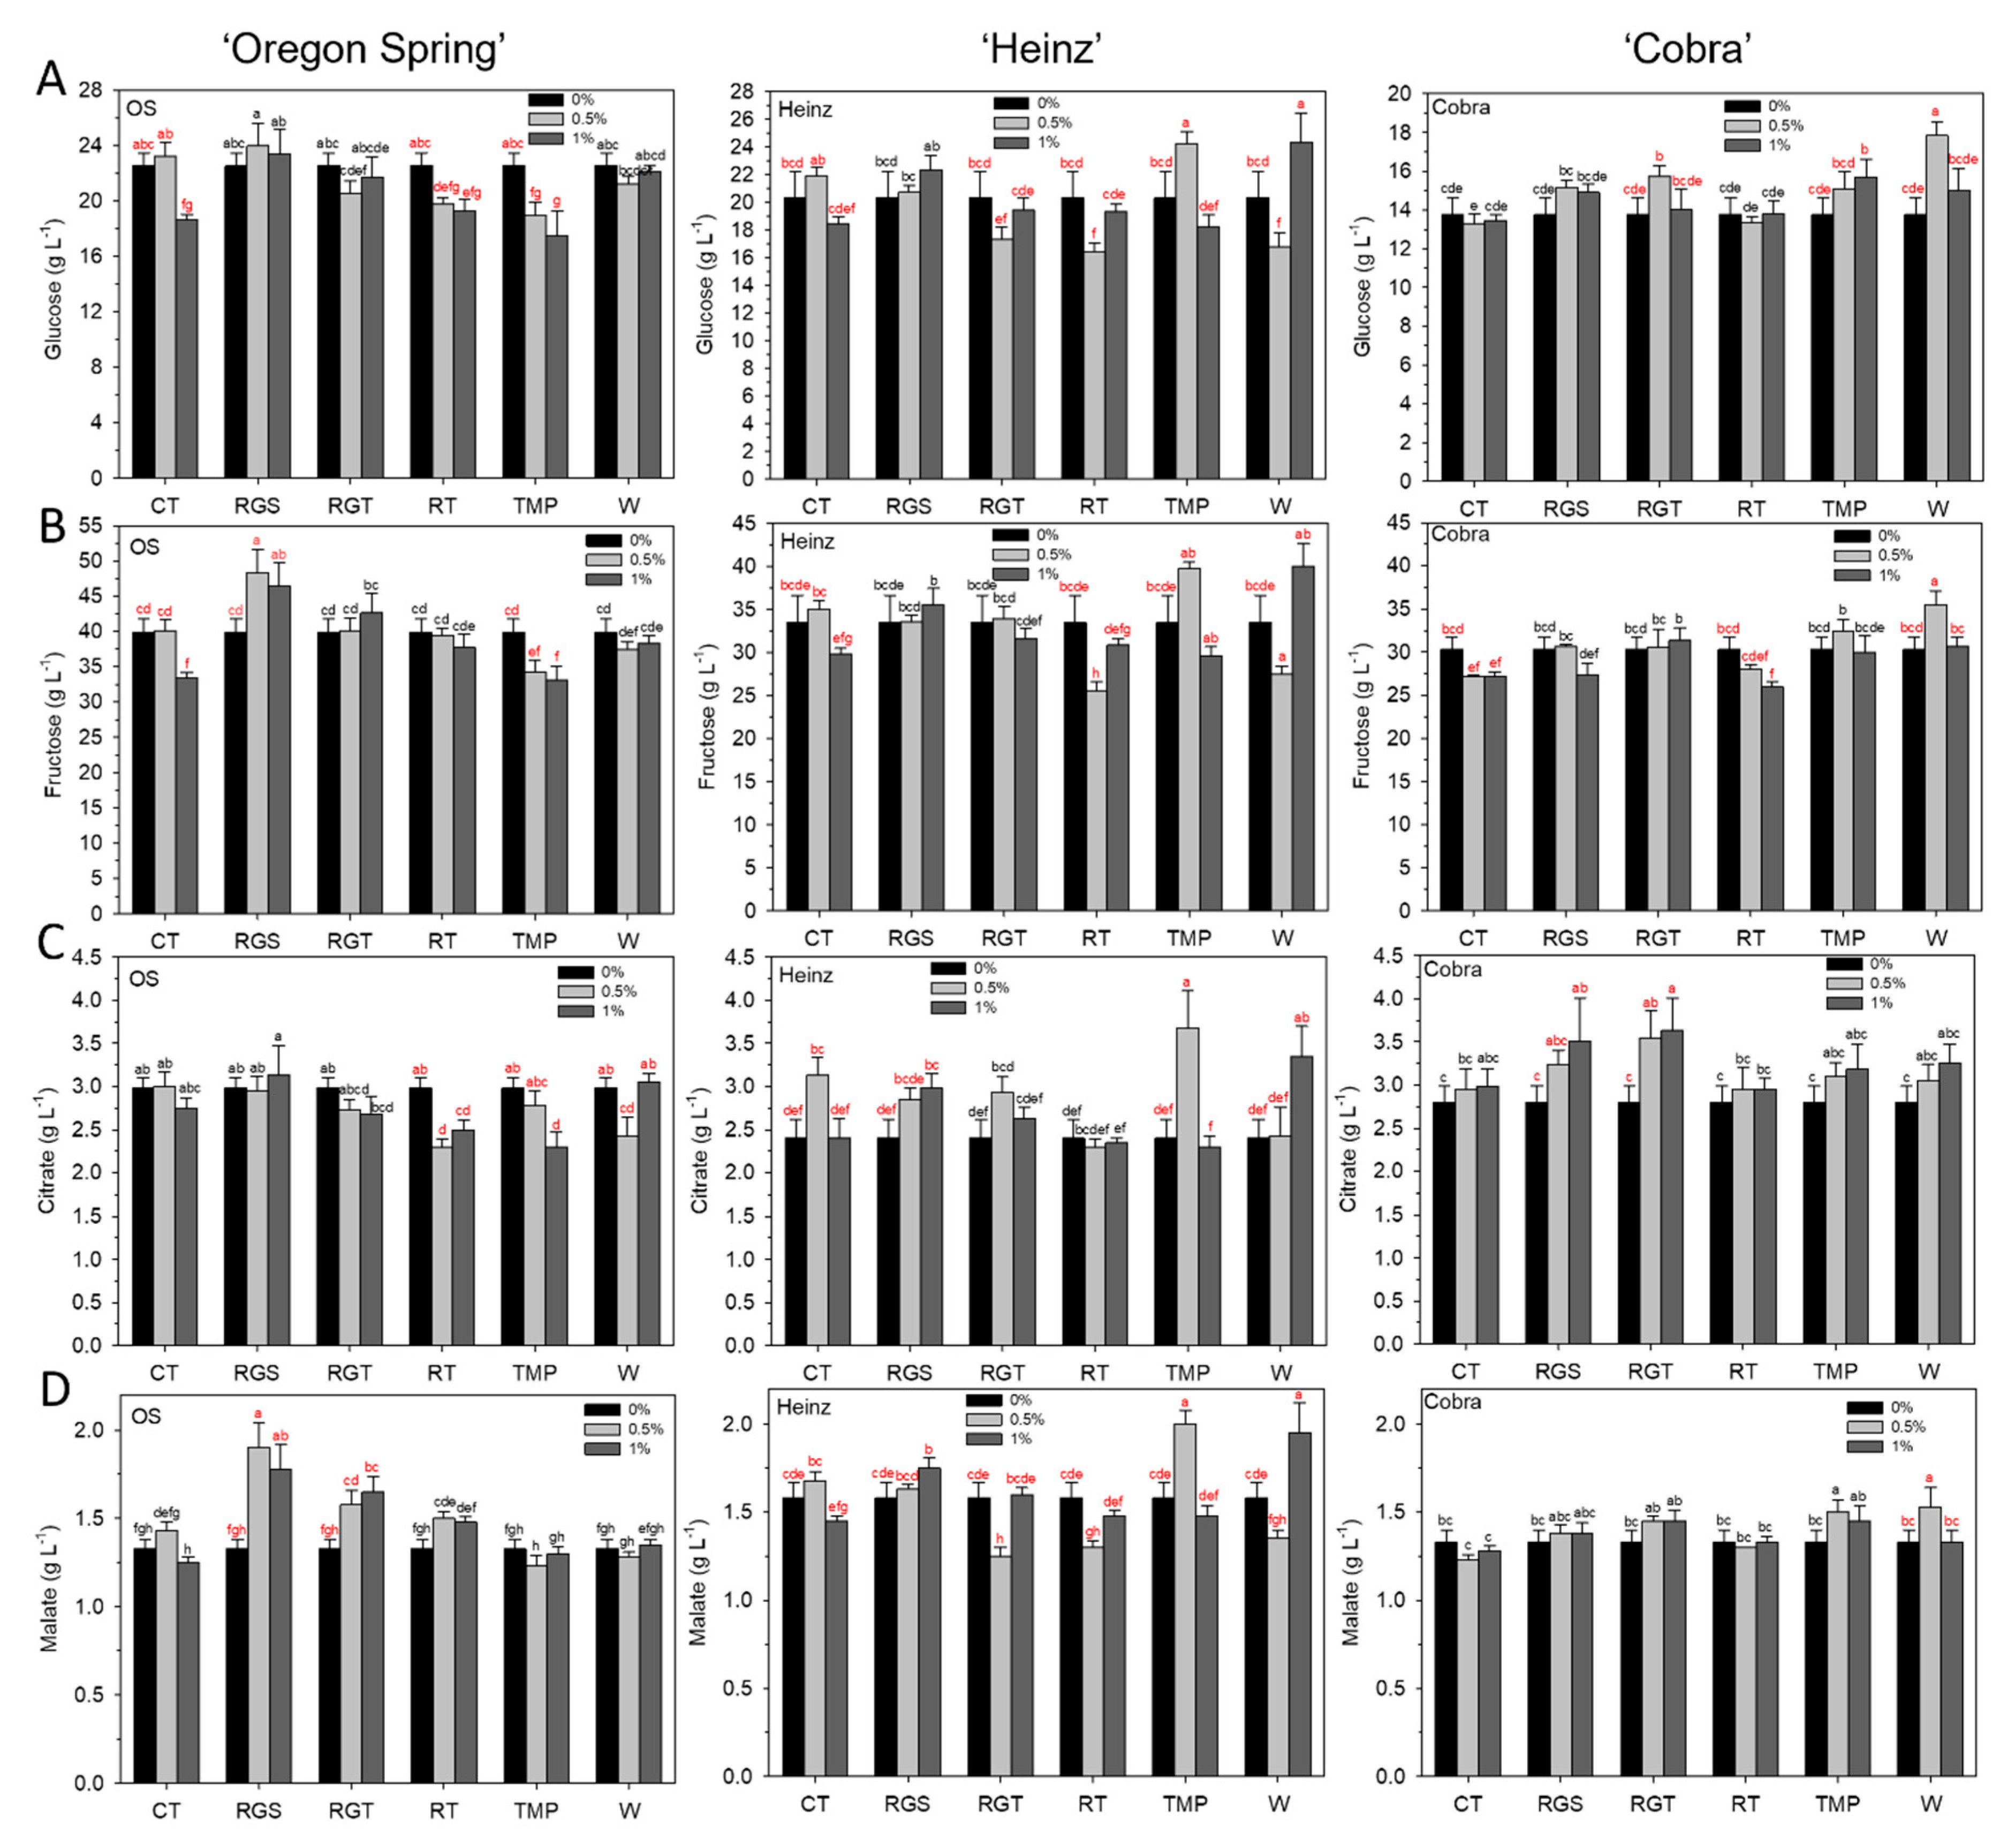
3.3. Fruit Quality: Glucose, Fructose, Citrate, and Malate

In contrast with agronomic traits, fruit quality traits, as judged by representative carbohydrates and organic acids, appeared to have a greater response to BC application. A significant response to cultivar, BC type, and BC rate, and the interactions between these variables were generally observed, even when broken down by cultivar (Table 4 and Table 5). Both highly positive and highly negative outcomes were observed in the trials. While the upside in some trials such as ‘Oregon Spring’ 1% TMP Trial 1 could be a near doubling of fruit carbohydrate and organic acid content, the downside could be as bad as a near halving of fruit carbohydrate and organic acid content as in ‘Heinz’ 1% CT Trial 1 (Figure 4 and Figure 5). Additionally, the response of these traits was highly correlated; an increase or decrease in any of these compounds was generally shared with the other three (Figure 6).
While responses were varied, some general trends could be observed. Malate was generally the most responsive to BC application, while citrate was the least responsive. CT produced far more negative fruit quality outcomes than the other BC types, performing positively in only 1 trial and negatively in 16 trials, while producing some of the most precipitous drops in fruit quality. BC applications with positive outcomes were more varied between trial, BC type, rate, and cultivar. In Trial 1, the best results (or least bad, in the case of the ‘Cobra’ trial) were achieved with RT, along with TMP in the case of ‘Oregon Spring’. In Trial 2, ‘Oregon Spring’ achieved the best results with RGS and RGT, ‘Heinz’ with TMP and W, and ‘Cobra’ with RGT and W. No single BC type emerged as a superior option. Despite the physical and chemical traits that make crop-residue-derived BCs appear superior to woody tissue-derived ones, this did not translate into a significant improvement in quality using crop residue-based BCs. Overall, ‘Oregon Spring’ experienced some of the greatest gains in fruit quality from BC application, while ‘Heinz’ suffered more negative effects than the other two cultivars. While there are various variables at play, under these controlled conditions the genetic variability between the cultivars is the most likely underlying reason for these observations.
Varied impacts on fruit quality depending on BC source and crop genetic background have been previously reported, including both increases and decreases in TSS, organic acid, and protein content, utilizing BCs as diverse as olive, bamboo, and banana in a wide array of fruit crops [60]. These previous results, further supported by this study, indicate a BC-specific effect on fruit quality that is also dependent on the genetic background of the cultivar. For example, the generally positive response to BC amendment in the ‘Oregon Spring’ cultivar in terms of organic acids compared to the other cultivars most likely indicates a more favorable plant–soil–genetic background interaction. These data support both hypotheses as each biochar affected fruit quality differently, and each cultivar had a unique response to each BC.

4. Conclusions

Overall, the impacts on plant dry weight and yield per plant were generally neutral or positive, while the impact on fruit carbohydrate and organic acid content was far more varied and responsive to BC application. The data presented in this study support both hypotheses: (1) BC derived from different feedstock sources will produce unique phenotypes in a single cultivar of tomato, and (2) a single feedstock-derived BC will produce different phenotypes in each of the three tomato cultivars. The use of potting soil and regular fertilization, however, limits the applicability of this study to field production; BC’s positive effects on soil health and agronomic performance may be greater in poorer soils, and the vast majority of crops are not grown in rich potting soils.. Despite this limitation, the results indicate that future studies into biochar application must consider genotype, down to the cultivar level, as well as biochar source and the rate of application to make meaningful recommendations for best agricultural practices. While some cultivars grown on some BC types produced beneficial increases in yield and fruit quality, other combinations produced decidedly negative results. This further substantiates an already understood need to adopt a customized approach for BC application to enhance the yield and quality of the crop [31,39,61,62].
Future BC studies should evaluate multiple crop cultivars in conjunction with different classes of BC (e.g., manure, hardwood, or crop residue), and rates of application, to dissect the nature of the complex interactions. Additionally, the effects of BC must be examined under a wide variety of environmental conditions; for example, ‘Oregon Spring’ with 1% TMP application experienced highly elevated organic acids and carbohydrates in Trial 1, yet these traits were decreased in the same cultivar in Trial 2. One factor that may have contributed to the variance in the results of experiments within the same genotype is seasonality. It has been shown that in a greenhouse with supplemental lighting, seasonal variation in natural light quality, quantity, and photoperiod in northern latitudes impacts the photosynthetic performance of tomatoes [63].
While additional experimentation is required to understand the wide-ranging variability in responses, several possible variables can influence the outcomes, including feedstock, potting mix, BC characteristics, microbiome, environmental factors, and the genetic background of the plant. While responses to BC were incredibly varied between trials, and in some cases harmful, the benefit of BC was enormously positive in some trials, including YPP increases of over 30% (‘Oregon Spring’ Trial 1 RGS 1% and ‘Cobra’ Trial 2 RGS 0.5%) and a near doubling in malate, fructose, and glucose content (‘Oregon Spring’ Trial 1 TMP 1%). BC application can be unpredictable due to gaps in knowledge, but the potential gains are apparent. The BC types studied were produced through the pyrolysis of agricultural waste products (CoolTerra®, ryegrass, and walnut shell), industrial waste products (thermomechanical pulp), and invasive species (Russian thistle); beyond the potential to improve yield and soil health, adding economic incentive to the reuse of waste products and the control of invasive species has the potential to increase sustainability.

Author Contributions

Conceptualization, D.I. and A.D.; methodology, A.D.; formal analysis, N.R.K. and J.L.; investigation, D.I.; resources, A.D.; writing—original draft preparation, E.T., A.H. and R.G.; writing—review and editing, J.L. and A.D.; supervision, A.D.; funding acquisition, A.D. All authors have read and agreed to the published version of the manuscript.

Funding

This research was supported in part by a Washington State University Agriculture Center Research Hatch Grant WNP00011 and startup funds from Texas A&M AgriLife Research, Texas A&M University to A.D. D.I. acknowledges the support received from WSU’s Research Assistantships for Diverse Scholars (RADS) program.

Data Availability Statement

All data used during this study are included in this published article.

Acknowledgments

The authors are grateful to Seanna Hewitt and Evan Stowe for their critical reading of the draft of this manuscript.

Conflicts of Interest

The biochar used in this study was provided as a gift. The CoolTerra biochar was gifted to D.I. by Cool Planet Inc. while he was an undergraduate student at Heritage University, WA. All other biochars were gifted by Ag Energy Solutions, now a part of Qualterra Inc. At the time that the results of the study were being analyzed, A.D. was employed by Qualterra, Inc., which has licensed technologies from the Dhingra Research Program at Washington State University. A.D. serves as their chief scientific officer. The funders had no involvement in the collection, analysis, interpretation of data, writing, or decision to publish the results. The remaining authors declare that the research was conducted in the absence of any commercial or financial relationships that could be construed as a potential conflict of interest.

References

  1. Cotching, W.E. Organic Matter in the Agricultural Soils of Tasmania, Australia—A Review. Geoderma 2018, 312, 170–182. [Google Scholar] [CrossRef]
  2. Hewitt, S.; Ghogare, R.; Troxel, W.; Tenic, E.; Isaac, D.; Dhingra, A. Metatranscriptomic Analysis of Tomato Rhizospheres Reveals Insight into Plant-Microbiome Molecular Response to Biochar-Amended Organic Soil. Front. Anal. Sci. 2023, 3, 1205583. [Google Scholar] [CrossRef]
  3. Lal, R. Soil Health and Carbon Management. Food Energy Secur. 2016, 5, 212–222. [Google Scholar] [CrossRef]
  4. Novotny, E.H.; Hayes, M.H.B.; Madari, B.E.; Bonagamba, T.J.; deAzevedo, E.R.; de Souza, A.A.; Song, G.; Nogueira, C.M.; Mangrich, A.S. Lessons from the Terra Preta de Índios of the Amazon Region for the Utilisation of Charcoal for Soil Amendment. J. Braz. Chem. Soc. 2009, 20, 1003–1010. [Google Scholar] [CrossRef]
  5. Steiner, C.; Teixeira, W.G.; Lehmann, J.; Nehls, T.; De MacÊdo, J.L.V.; Blum, W.E.H.; Zech, W. Long Term Effects of Manure, Charcoal and Mineral Fertilization on Crop Production and Fertility on a Highly Weathered Central Amazonian Upland Soil. Plant Soil 2007, 291, 275–290. [Google Scholar] [CrossRef]
  6. Zech, W.; Haumaier, L.; Reinhold, H. Ecological Aspects of Soil Organic Matter in Tropical Land Use. In Humic Substances in Soil and Crop Sciences: Selected Readings; Wiley Online: Hoboken, NJ, USA, 1990; pp. 187–202. [Google Scholar]
  7. Basso, B.; Dumont, B.; Maestrini, B.; Shcherbak, I.; Robertson, G.P.; Porter, J.R.; Smith, P.; Paustian, K.; Grace, P.R.; Asseng, S.; et al. Soil Organic Carbon and Nitrogen Feedbacks on Crop Yields under Climate Change. Agric. Environ. Lett. 2018, 3, 180026. [Google Scholar] [CrossRef]
  8. Magdoff, F. Ecological Agriculture: Principles, Practices, and Constraints. Renew. Agric. Food Syst. 2007, 22, 109–117. [Google Scholar] [CrossRef]
  9. Doran, J.W.; Zeiss, M.R. Soil Health and Sustainability: Managing the Biotic Component of Soil Quality. Appl. Soil Ecol. 2000, 15, 3–11. [Google Scholar] [CrossRef]
  10. Bender, S.F.; Wagg, C.; van der Heijden, M.G.A. An Underground Revolution: Biodiversity and Soil Ecological Engineering for Agricultural Sustainability. Trends Ecol. Evol. 2016, 31, 440–452. [Google Scholar] [CrossRef]
  11. Spokas, K.A.; Cantrell, K.B.; Novak, J.M.; Archer, D.W.; Ippolito, J.A.; Collins, H.P.; Boateng, A.A.; Lima, I.M.; Lamb, M.C.; McAloon, A.J.; et al. Biochar: A Synthesis of Its Agronomic Impact beyond Carbon Sequestration. J. Environ. Qual. 2012, 41, 973–989. [Google Scholar] [CrossRef]
  12. Laird, D.A. The Charcoal Vision: A Win-Win-Win Scenario for Simultaneously Producing Bioenergy, Permanently Sequestering Carbon, While Improving Soil and Water Quality. Agron. J. 2008, 100, 178–181. [Google Scholar] [CrossRef]
  13. Gurwick, N.P.; Moore, L.A.; Kelly, C.; Elias, P. A Systematic Review of Biochar Research, with a Focus on Its Stability In Situ and Its Promise as a Climate Mitigation Strategy. PLoS ONE 2013, 8, e75932. [Google Scholar] [CrossRef]
  14. Gao, S.; DeLuca, T.H. Wood Biochar Impacts Soil Phosphorus Dynamics and Microbial Communities in Organically-Managed Croplands. Soil. Biol. Biochem. 2018, 126, 144–150. [Google Scholar] [CrossRef]
  15. Xiao, X.; Chen, B.; Chen, Z.; Zhu, L.; Schnoor, J.L. Insight into Multiple and Multilevel Structures of Biochars and Their Potential Environmental Applications: A Critical Review. Envrion. Sci. Technol. 2018, 52, 5027–5047. [Google Scholar] [CrossRef] [PubMed]
  16. Tenic, E.; Ghogare, R.; Dhingra, A. Biochar—A Panacea for Agriculture or Just Carbon? Horticulturae 2020, 6, 37. [Google Scholar] [CrossRef]
  17. Flowers, M.D.; Lal, R. Axle Load and Tillage Effects on Soil Physical Properties and Soybean Grain Yield on a Mollic Ochraqualf in Northwest Ohio. Soil. Tillage Res. 1998, 48, 21–35. [Google Scholar] [CrossRef]
  18. Dai, Z.; Zhang, X.; Tang, C.; Muhammad, N.; Wu, J.; Brookes, P.C.; Xu, J. Potential Role of Biochars in Decreasing Soil Acidification-A Critical Review. Sci. Total Environ. 2017, 581, 601–611. [Google Scholar] [CrossRef]
  19. Thi Thu Hien, T.; Shinogi, Y.; Taniguchi, T.; Hien, T.T.T.; Shinogi, Y.; Taniguchi, T. The Different Expressions of Draft Cherry Tomato Growth, Yield, Quality under Bamboo and Rice Husk Biochars Application to Clay Loamy Soil. Agric. Sci. 2017, 08, 934–948. [Google Scholar] [CrossRef]
  20. Woldetsadik, D.; Drechsel, P.; Marschner, B.; Itanna, F.; Gebrekidan, H. Effect of Biochar Derived from Faecal Matter on Yield and Nutrient Content of Lettuce (Lactuca Sativa) in Two Contrasting Soils. Environ. Syst. Res. 2018, 6, 2. [Google Scholar] [CrossRef]
  21. Velez, T.I.; Moonilall, N.I.; Reed, S.; Jayachandran, K.; Scinto, L.J. Impact of Melaleuca Quinquenervia Biochar on Phaseolus Vulgaris Growth, Soil Nutrients, and Microbial Gas Flux. J. Environ. Qual. 2018, 47, 1487–1495. [Google Scholar] [CrossRef]
  22. Nzediegwu, C.; Prasher, S.; Elsayed, E.; Dhiman, J.; Mawof, A.; Patel, R. Effect of Biochar on Heavy Metal Accumulation in Potatoes from Wastewater Irrigation. J. Environ. Manag. 2019, 232, 153–164. [Google Scholar] [CrossRef]
  23. Li, S.; Shangguan, Z. Positive Effects of Apple Branch Biochar on Wheat Yield Only Appear at a Low Application Rate, Regardless of Nitrogen and Water Conditions. J. Soils Sediments 2018, 18, 3235–3243. [Google Scholar] [CrossRef]
  24. Faloye, O.T.; Alatise, M.O.; Ajayi, A.E.; Ewulo, B.S. Effects of Biochar and Inorganic Fertiliser Applications on Growth, Yield and Water Use Efficiency of Maize under Deficit Irrigation. Agric. Water Manag. 2019, 217, 165–178. [Google Scholar] [CrossRef]
  25. Liu, B.; Cai, Z.; Zhang, Y.; Liu, G.; Luo, X.; Zheng, H. Comparison of Efficacies of Peanut Shell Biochar and Biochar-Based Compost on Two Leafy Vegetable Productivity in an Infertile Land. Chemosphere 2019, 224, 151–161. [Google Scholar] [CrossRef] [PubMed]
  26. Laghari, M.; Naidu, R.; Xiao, B.; Hu, Z.; Mirjat, M.S.; Hu, M.; Kandhro, M.N.; Chen, Z.; Guo, D.; Jogi, Q.; et al. Recent Developments in Biochar as an Effective Tool for Agricultural Soil Management: A Review. J. Sci. Food Agric. 2016, 96, 4840–4849. [Google Scholar] [CrossRef] [PubMed]
  27. Nair, A.; Lang, K.; Snyder, D. Impact of Biochar and Fertility Management on Potato Production. 2018. Available online: https://www.iastatedigitalpress.com/farmreports/article/id/1151/ (accessed on 2 February 2024).
  28. Muhammad, N.; Dai, Z.; Xiao, K.; Meng, J.; Brookes, P.C.; Liu, X.; Wang, H.; Wu, J.; Xu, J. Changes in Microbial Community Structure Due to Biochars Generated from Different Feedstocks and Their Relationships with Soil Chemical Properties. Geoderma 2014, 226–227, 270–278. [Google Scholar] [CrossRef]
  29. Jiang, Z.; Lian, F.; Wang, Z.; Xing, B. The Role of Biochars in Sustainable Crop Production and Soil Resiliency. J. Exp. Bot. 2020, 71, 520–542. [Google Scholar] [CrossRef]
  30. Smith, P. Soil Carbon Sequestration and Biochar as Negative Emission Technologies. Glob. Chang. Biol. 2016, 22, 1315–1324. [Google Scholar] [CrossRef]
  31. Panwar, N.L.; Pawar, A.; Salvi, B.L. Comprehensive Review on Production and Utilization of Biochar. SN Appl. Sci. 2019, 1, 168. [Google Scholar] [CrossRef]
  32. Bruun, E.W.; Petersen, C.T.; Hansen, E.; Holm, J.K.; Hauggaard-Nielsen, H. Biochar Amendment to Coarse Sandy Subsoil Improves Root Growth and Increases Water Retention. Soil. Use Manag. 2014, 30, 109–118. [Google Scholar] [CrossRef]
  33. Chen, Q.; Qin, J.; Sun, P.; Cheng, Z.; Shen, G. Cow Dung-Derived Engineered Biochar for Reclaiming Phosphate from Aqueous Solution and Its Validation as Slow-Release Fertilizer in Soil-Crop System. J. Clean. Prod. 2018, 172, 2009–2018. [Google Scholar] [CrossRef]
  34. Haider, G.; Steffens, D.; Moser, G.; Müller, C.; Kammann, C.I. Biochar Reduced Nitrate Leaching and Improved Soil Moisture Content without Yield Improvements in a Four-Year Field Study. Agric. Ecosyst. Environ. 2017, 237, 80–94. [Google Scholar] [CrossRef]
  35. Murtaza, G.; Ahmed, Z.; Usman, M.; Tariq, W.; Ullah, Z.; Shareef, M.; Iqbal, H.; Waqas, M.; Tariq, A.; Wu, Y. Biochar induced modifications in soil properties and its impacts on crop growth and production. J. Plant Nutr. 2021, 44, 1677–1691. [Google Scholar] [CrossRef]
  36. El-Naggar, A.; Lee, S.S.; Rinklebe, J.; Farooq, M.; Song, H.; Sarmah, A.K.; Zimmerman, A.R.; Ahmad, M.; Shaheen, S.M.; Ok, Y.S. Biochar Application to Low Fertility Soils: A Review of Current Status, and Future Prospects. Geoderma 2019, 337, 536–554. [Google Scholar] [CrossRef]
  37. Ding, Y.; Liu, Y.; Liu, S.; Li, Z.; Tan, X.; Huang, X.; Zeng, G.; Zhou, L.; Zheng, B. Biochar to Improve Soil Fertility. A Review. Agron. Sustain. Dev. 2016, 36, 1–18. [Google Scholar] [CrossRef]
  38. Biederman, L.A.; Harpole, W.S. Biochar and Its Effects on Plant Productivity and Nutrient Cycling: A Meta-Analysis. GCB Bioenergy 2013, 5, 202–214. [Google Scholar] [CrossRef]
  39. Schmidt, H.P.; Kammann, C.; Hagemann, N.; Leifeld, J.; Bucheli, T.D.; Sánchez Monedero, M.A.; Cayuela, M.L. Biochar in agriculture—A systematic review of 26 global meta-analyses. GCB Bioenergy 2021, 13, 1708–1730. [Google Scholar] [CrossRef]
  40. Takaragawa, H.; Yabuta, S.; Watanabe, K.; Kawamitsu, Y. Effects of Application of Bagasse- and Sunflower Residue-Derived Biochar to Soil on Growth and Yield of Oilseed Sunflower. Trop. Agric. Dev. 2017, 61, 32–39. [Google Scholar] [CrossRef]
  41. Vaccari, F.P.; Maienza, A.; Miglietta, F.; Baronti, S.; Di Lonardo, S.; Giagnoni, L.; Lagomarsino, A.; Pozzi, A.; Pusceddu, E.; Ranieri, R.; et al. Biochar Stimulates Plant Growth but Not Fruit Yield of Processing Tomato in a Fertile Soil. Agric. Ecosyst. Environ. 2015, 207, 163–170. [Google Scholar] [CrossRef]
  42. Beauchamp, E.G.; Kannenberg, L.W.; Hunter, R.B. Nitrogen Accumulation and Translocation in Corn Genotypes Following Silking1. Agron. J. 1976, 68, 418. [Google Scholar] [CrossRef]
  43. Siciliano, S.D.; Fortin, N.; Mihoc, A.; Wisse, G.; Labelle, S.; Beaumier, D.; Ouellette, D.; Roy, R.; Whyte, L.G.; Banks, M.K.; et al. Selection of Specific Endophytic Bacterial Genotypes by Plants in Response to Soil Contamination. Appl. Environ. Microbiol. 2001, 67, 2469–2475. [Google Scholar] [CrossRef]
  44. Richard-Molard, C.; Krapp, A.; Brun, F.; Ney, B.; Daniel-Vedele, F.; Chaillou, S. Plant Response to Nitrate Starvation Is Determined by N Storage Capacity Matched by Nitrate Uptake Capacity in Two Arabidopsis Genotypes. J. Exp. Bot. 2008, 59, 779–791. [Google Scholar] [CrossRef]
  45. Choi, K.; Lee, G.; Han, Y.J.; Bunn, J.M. Tomato Maturity Evaluation Using Color Image Analysis. Trans. ASAE 1995, 38, 171–176. [Google Scholar] [CrossRef]
  46. López Camelo, A.F.; Gómez, P.A. Comparison of Color Indexes for Tomato Ripening. Hortic. Bras. 2004, 22, 534–537. [Google Scholar] [CrossRef]
  47. Hewitt, S.L.; Ghogare, R.; Dhingra, A. Glyoxylic Acid Overcomes 1-MCP-Induced Blockage of Fruit Ripening in Pyrus communis L. var. ‘D’Anjou’. Sci. Rep. 2020, 10, 7084. [Google Scholar] [CrossRef] [PubMed]
  48. Ince, P.J. PULPING|Fiber Resources. In Encyclopedia of Forest Sciences; Elsevier: Amsterdam, The Netherlands, 2004; pp. 877–883. [Google Scholar] [CrossRef]
  49. Gondim, R.S.; Muniz, C.R.; Lima, C.E.P.; Santos, C.L.A. Explaining the water-holding capacity of biochar by scanning electron microscope images. Rev. Caatinga 2018, 31, 972–979. [Google Scholar] [CrossRef]
  50. Mukhina, I.M.; Rizhiya, E.Y.; Buchkina, N.P.; Balashov, E.V. Changes in Soil Conditions after Application of Biochar. IOP Conf. Ser. Earth Environ. Sci. 2019, 368, 012037. [Google Scholar] [CrossRef]
  51. Goldstein, J.I.; Newbury, D.E.; Echlin, P.; Joy, D.C.; Lyman, C.E.; Lifshin, E.; Sawyer, L.; Michael, J.R.; Goldstein, J.I.; Newbury, D.E.; et al. X-ray Spectral Measurement: EDS and WDS. In Scanning Electron Microscopy and X-ray Microanalysis; Springer: New York, NY, USA, 2003; pp. 297–353. [Google Scholar]
  52. Ma, X.; Zhou, B.; Budai, A.; Jeng, A.; Hao, X.; Wei, D.; Zhang, Y.; Rasse, D. Study of Biochar Properties by Scanning Electron Microscope—Energy Dispersive X-ray Spectroscopy (SEM-EDX). Commun. Soil. Sci. Plant Anal. 2016, 47, 593–601. [Google Scholar] [CrossRef]
  53. Gascó, G.; Cely, P.; Paz-Ferreiro, J.; Plaza, C.; Méndez, A. Relation between biochar properties and effects on seed germination and plant development. Biol. Agric. Hortic. 2016, 32, 237–247. [Google Scholar] [CrossRef]
  54. Prakongkep, N.; Gilkes, R.J.; Wiriyakitnateekul, W. Forms and Solubility of Plant Nutrient Elements in Tropical Plant Waste Biochars. J. Plant Nutr. Soil Sci. 2015, 178, 732–740. [Google Scholar] [CrossRef]
  55. Sánchez-Monedero, M.A.; Cayuela, M.L.; Sánchez-García, M.; Vandecasteele, B.; D’Hose, T.; López, G.; Martínez-Gaitán, C.; Kuikman, P.J.; Sinicco, T.; Mondini, C. Agronomic Evaluation of Biochar, Compost and Biochar-Blended Compost across Different Cropping Systems: Perspective from the European Project FERTIPLUS. Agronomy 2019, 9, 225. [Google Scholar] [CrossRef]
  56. Dorais, M.; Gagnon, F.; Laurin-Lanctôt, S.; Thériault, M.; Ménard, C.; Pepin, S. Short-Term Improvement of Soil Biological Activity in Biochar-Amended Organic Greenhouse Tomato Crops. Acta Hortic. 2017, 1164, 249–256. [Google Scholar] [CrossRef]
  57. Graber, E.; Meller Harel, Y.; Kolton, M.; Cytryn, E.; Silber, A.; David, D.; Tsechansky, L.; Borenshtein, M.; Elad, Y. Biochar Impact on Development and Productivity of Pepper and Tomato Grown in Fertigated Soilless Media. Plant Soil 2010, 337, 481–496. [Google Scholar] [CrossRef]
  58. Bhattacharjya, S.; Chandra, R.; Pareek, N.; Raverkar, K.P. Biochar and Crop Residue Application to Soil: Effect on Soil Biochemical Properties, Nutrient Availability and Yield of Rice (Oryza sativa L.) and Wheat (Triticum aestivum L.). Arch. Agron Soil Sci. 2016, 62, 1095–1108. [Google Scholar] [CrossRef]
  59. Mukherjee, A.; Lal, R. The Biochar Dilemma. Soil Res. 2014, 52, 217–230. [Google Scholar] [CrossRef]
  60. Sharma, S.; Rana, V.S.; Rana, N.; Prasad, H.; Sharma, U.; Patiyal, V. Biochar from Fruit Crops Waste and Its Potential Impact on Fruit Crops. Sci. Hortic. 2022, 299, 111052. [Google Scholar] [CrossRef]
  61. Yu, H.; Zou, W.; Chen, J.; Chen, H.; Yu, Z.; Huang, J.; Tang, H.; Wei, X.; Gao, B. Biochar Amendment Improves Crop Production in Problem Soils: A Review. J. Environ. Manag. 2019, 232, 8–21. [Google Scholar] [CrossRef] [PubMed]
  62. Al-Rabaiai, A.; Menezes-Blackburn, D.; Al-Ismaily, S.; Janke, R.; Pracejus, B.; Al-Alawi, A.; Al-Kindi, M.; Bol, R. Customized biochar for soil applications in arid land: Effect of feedstock type and pyrolysis temperature on soil microbial enumeration and respiration. J. Anal. Appl. Pyrolysis 2022, 168, 105693. [Google Scholar] [CrossRef]
  63. Ayari, O.; Dorais, M.; Gosselin, A. Daily Variations of Photosynthetic Efficiency of Greenhouse Tomato Plants during Winter and Spring. J. Am. Soc. Hortic. Sci. 2000, 125, 235–241. [Google Scholar] [CrossRef]
Figure 1. Ultrastructural characterization of six different types of biochars derived from different biomass using scanning electron microscopy. (A) Micrographs obtained at 100× resolution demonstrate the variability in the ultrastructure of the biochars. Note the variability in particle size as well as the size of the macro- and micropores. (B) Micrographs obtained at 1000× resolution further accentuate the variability in particle size as well as the size of the macro and micropores.
Horticulturae 10 00368 g001
Figure 2. Trial 1—Effects of six biochar soil amendments on above-ground foliar growth (A) and fruit yield per plant (B) of greenhouse-grown tomato cultivars, Oregon Spring (OS, left), Heinz (middle), and Cobra (right). Data are means of four replicates (±SE). Letters indicate LSD p < 0.1 within a cultivar. Letters in red indicate significant trends (linear, deviations) with the rate of biochar. Note the differences in Y–axis scales. See Table 4 and Table 5 for a summary of the 3–way and 2–way factorial ANOVA, respectively.
Horticulturae 10 00368 g002
Figure 3. Trial 2—Effects of six biochar soil amendments on above-ground foliar growth (A) and fruit yield per plant (B) of greenhouse-grown tomato cultivars, Oregon Spring (OS, left), Heinz (middle), and Cobra (right). Data are means of four replicates (±SE). Letters indicate LSD p < 0.1 within a cultivar. Letters in red indicate significant trends (linear, deviations) with the rate of biochar. Note the differences in Y–axis scales. See Table 4 and Table 5 for a summary of the 3–way and 2–way factorial ANOVA, respectively.
Horticulturae 10 00368 g003
Figure 4. Trial 1—Effects of six biochar soil amendments on the concentrations of glucose (A), fructose (B), citrate (C), and malate (D) of the fruit of greenhouse-grown tomato cultivars, Oregon Spring (OS, left), Heinz (middle), and Cobra (right). Data are means of four replicates (±SE). Letters indicate LSD p < 0.1 within a cultivar. Letters in red indicate significant trends (linear, deviations) with the rate of biochar. Note the differences in Y–axis scales. See Table 4 and Table 5 for a summary of the 3–way and 2–way factorial ANOVA, respectively.
Horticulturae 10 00368 g004
Figure 5. Trial 2—Effects of six biochar soil amendments on the concentrations of glucose (A), fructose (B), citrate (C), and malate (D) of the fruit of greenhouse-grown tomato cultivars, Oregon Spring (OS, left), Heinz (middle), and Cobra (right). Data are means of four replicates (±SE). Letters indicate LSD p < 0.1 within a cultivar. Letters in red indicate significant trends (linear, deviations) with the rate of biochar. Note the differences in Y–axis scales. See Table 4 and Table 5 for a summary of the 3–way and 2–way factorial ANOVA, respectively.
Horticulturae 10 00368 g005
Figure 6. Correlations between tested fruit quality parameters. All significant at least p < 0.001.
Horticulturae 10 00368 g006
Table 1. Planting and harvest dates for each experiment performed with three tomato cultivars.
ExperimentCultivarDate PlantedDate Harvested
1‘Oregon Spring’17 February 20173 June 2017
2‘Oregon Spring’20 January 20187 May 2018
1‘Heinz’17 February 20173 June 2017
2‘Heinz’15 May 201730 August 2017
1‘Cobra’16 May 201710 November 2017
2‘Cobra’8 November 20179 May 2018
Table 2. Experimental layout detailing the biochar treatments and number of plants used for each treatment. CT—CoolTerra, RGS—Ryegrass straw, RGT—Ryegrass tailings, TMP—Thermomechanical pulp, RT—Russian thistle, and W—Walnut. BC—Biochar.
TreatmentsBCControlCTRGSRGTTMPRTW
%00.51.00.51.00.51.00.51.00.51.00.51.0
n8444444444444
Table 3. Qualitative elemental composition of different biochars using EDX spectral analysis. Boxes with Y indicate the presence of elements while boxes with a dash denote that the element was either not detected or below the detection threshold.
Biochar FeedstockNPKCaSMgMoSiClNaAl
CoolTerra® (CT)YYYYY
Ryegrass straw (RGS)YYYYYYY
Ryegrass tailings (RGT)YYYYYYYYY
Thermomechanical pulp waste (TMP)YYYYY
Russian thistle (RT)YYYYYYYY
Walnut (W)YYYY
Table 4. Sources of variation and levels of significance (p–values) for the 3–way ANOVA of the effects of three cultivars and six biochar soil amendments (3 rates) on plant dry weight, fruit yield per plant (YPP), fruit organic acid, and fruit sugar concentrations of tomato cultivars grown in the greenhouse from February 17 2017 to 10 November 2017 (Trial 1, Figure 1 and Figure 2) and 15 May 2017 to 9 May 2018 (Trial 2, Figure 3 and Figure 4).
Trial DatesSources of VariationPlant WtYPP 1CitrateMalateGlcFru
17 February 2017 to 10 November 2017Cultivar (C)0.0010.0010.0010.0010.0010.001
Biochar (B)ns 2ns0.0010.0010.0010.001
Rate (R)0.050.0010.002ns0.040.003
C × Bnsns0.0010.0010.0010.002
C × Rns0.0050.0010.0010.0010.001
B × Rnsns0.020.001nsns
C × B × Rnsns0.0020.0010.040.04
15 May 2017 to 9 May 2018Cultivar (C)0.0010.0010.0010.0010.0010.001
Biochar (B)nsns0.020.0010.0010.001
Rate (R)ns0.030.030.002nsns
C × Bnsnsns0.0010.030.001
C × Rns0.0080.0010.0050.003ns
B × Rnsns0.0010.0010.0010.001
C × B × Rnsnsns0.0010.0010.001
1 Fruit yield (fresh wt) per plant. 2 ns, not significant.
Table 5. Sources of variation and levels of significance (p–values) for the 2–way ANOVA of the effects of three rates of six biochar soil amendments on plant dry weight, fruit yield per plant (YPP), fruit organic acid, and fruit sugar concentrations of tomato cultivars grown in the greenhouse in Trial 1 (Figure 1 and Figure 2) and Trial 2 (Trial 2, Figure 3 and Figure 4).
Trial DatesCultivarSources of VariationPlant WtYPP 1CitrateMalateGlcFru
17 February 2017 to 3 June 2017OSBiochar (B)ns 2ns0.060.0010.0020.008
Ratens0.0010.0010.001nsns
B × Ratensns0.030.0020.09ns
17 February 2017 to 3 June 2017HeinzBiochar (B)0.03ns0.0010.0010.0010.001
Ratens0.020.001nsns0.08
B × Ratens0.090.0070.0040.030.03
16 May 2017 to 10 November 2017CobraBiochar (B)nsns0.020.0010.0090.001
Ratens0.0010.0010.0010.0010.001
B × Ratensnsns0.07nsns
20 January 2018 to 7 May 2018OSBiochar (B)nsns0.040.0010.0050.001
Ratensns0.0090.0010.007ns
B × Ratensns0.050.0010.070.03
15 May 2017 to 30 August 2017HeinzBiochar (B)nsnsns0.0010.070.07
Rate0.02ns0.003nsnsns
B × Ratensns0.0020.0010.0010.001
8 November 2017 to 9 May 2018CobraBiochar (B)nsnsns0.050.020.001
Ratens0.0060.007ns0.020.03
B × Ratens0.08nsns0.100.06
1 Fruit yield (fresh wt) per plant. 2 ns, not significant.
Disclaimer/Publisher’s Note: The statements, opinions and data contained in all publications are solely those of the individual author(s) and contributor(s) and not of MDPI and/or the editor(s). MDPI and/or the editor(s) disclaim responsibility for any injury to people or property resulting from any ideas, methods, instructions or products referred to in the content.

