Abstract
Biochemical changes in the cell wall composition and activity of cell wall-modifying enzymes of five apple cultivars, Royal Gala (Gala), Aurora Golden Gala (Aur), Splendour (Spl), Honeycrisp (HC), and Ambrosia (Amb), collected from the 2016 growing season in the early growth phases, namely 40 and 70 days after full bloom (DAFB), at harvest maturity, and after 20 weeks of storage were investigated in relation to the textural changes at harvest maturity through to 20 weeks of storage. Assessing apple texture with a single-point measurement of firmness using a penetration test to a depth of approximately 8 mm in apples may not be an ideal measurement for assessing apple textural quality. Pectin methyl esterase (PME) activity at early developmental stages may be predictive of textural quality after storage. This work also found that β-D-galactosidase (BGAL) and α-L-arabinofuranosidase (AFAS) activities at early developmental stages may be important factors affecting textural quality after storage. Additionally, the degree of methylesterification (DME) assessed with FTIR on apple flesh material at the early developmental stages was strongly positively correlated (r2 ≥ +0.891 to +0.963, p ≤ 0.05) with textural quality after storage, including crispness, indicating that FTIR could serve as a rapid screening tool for textural quality at early developmental stages on minimally processed starting material.
Keywords:
apple; cell wall; texture; pectin methylesterase; β-D-galactosidase; α-L-arabinofuranosidase; FTIR 1. Introduction
Textural quality is a key factor in the apple breeding process, and apple fruit texture is recognized as a multi-trait feature that is composed of several components, such as firmness, hardness, crispness, and the negative attribute of mealiness [1,2]. Many researchers studying apple texture have used penetration/puncture tests to provide single-point firmness values with the aim of characterizing the textural quality of apples in relation to differences between cultivars and/or storage [3,4,5,6,7,8,9,10]. These works typically employed a penetration distance of ~8 mm to determine firmness values. The Mohr Digi-Test (MDT-1 and MDT-2; Mohr and Associates, Richland, WA, USA) Agricultural Penetrometer and Texture Analyzer, which is a computerized penetrometer for measuring apple texture, provides indices of firmness, hardness, and crispness using a two-region model of a fruit [1,11]. Region 1 (R1) extends to a fixed depth of 8.1 mm from the outermost region of a fruit, which is the region most researchers performing penetration tests use to obtain firmness data. However, Region 2 (R2) extends from R1 to a depth proportional to 30% of the diameter of a fruit, which represents the majority of the edible apple cortex material. Apples soften from the inside out; so, measurements at R2 may be more indicative of fruit textural quality [1]. Some textural parameters generated by the Mohr Digi-Test include average hardness at R1 (A1), average hardness at R2 (A2), maximum hardness at R1 (M1), which would correspond to standard firmness values measured at a penetration depth of 8 mm, and maximum hardness at R2 (M2) [12]. Force at the end of R2 (E2) estimates force at the R2 endpoint and is noted to indicate internal softening and/or integrity of the cortex [12]. Crispness (Cn) is a unitless value calculated from a cubic spline fit through Region 2 data, followed by a Fourier transform of the residual and the sum of a frequency range to obtain the total power in that frequency range (personal communication with Mohr and Associates) [13]. Cn is an estimate of the energy released during fruit tearing, simulating the energy released during a bite [12]. The Mohr Digi-Test has been used to generate meaningful data for apple textural quality as instrumental texture parameters have been correlated with sensory quality [1,11].
Softening in fleshy fruits is a key textural change that occurs during ripening in many fruits. Studies have examined potential linkages between textural quality and biochemical changes with the aim of defining possible relationships between cultivar texture differences and cell wall changes during ripening [5,9]. Nevertheless, the complete mechanism of softening has remained undefined [14]. Cell turgor pressure and the cuticle have been implicated in affecting texture; yet, the cell wall is the primary structure responsible for the textural characteristics of apple fruits [14]. The cell walls of the apple cortex are composed of three types of polysaccharides (pectin, hemicellulose, and cellulose), along with smaller levels of glycoprotein and water, which enable cell adhesion, cell stability, and the maintenance of cell turgor [14,15]. Pectin is a key component of the middle lamella of cell walls and affects the physical and mechanical properties of the cell wall, thus being a key contributor to textural quality [16]. Pectin is comprised of highly complex and heterogeneous polysaccharides, while the linear pectin backbone is composed of a linear chain made of (1→4)-α-D-galacturonic acid, termed homogalacturonan (HG) [2,5]. HG pectin plays a major role in intercellular adhesion via the degree of methylesterification (DME), which is defined as the percentage of carboxyl groups esterified with methanol [17]. DME has been implicated in affecting textural quality [4]. Two other important pectin domains include rhamnogalacturonan I (RG-I) and rhamnogalacturonan II (RG-II), which are neutral sugar side-chains rich in rhamnose, arabinose, and galactose; they are usually polymerized to the main backbones of linear HG [2,5].
To characterize cell wall composition, cell wall material is typically released from fruit material using an aqueous ethanolic extraction, and the resulting residue, termed “alcohol-insoluble residue” (AIR), represents the extracted cell wall polysaccharides [18]. The cell wall material can be subjected to sequential extraction to obtain various polysaccharide fractions classified by different solubilities. These extraction mediums include water, which releases water-soluble pectins, CDTA (cyclohexanediaminetetraacetic acid), which releases pectins held by calcium bonds, sodium carbonate (Na2CO3), which releases highly methylated pectins, 1 M sodium hydroxide (NaOH), which releases pectins held by ester bonds, and 4 M NaOH, which releases concentrated alkali-soluble hemicelluloses and “hairy” region pectins [19].
Changes in fruit texture are mainly influenced by the dissolution of cell wall components and the remodeling of the cell wall structure [20], and literature has shown that substantial differences exist between apple cultivars in both softening behavior [21] and cell wall composition [22]. The coordinated action of hydrolytic enzymes, such as polygalacturonase (PG), beta-D-galactosidase (BGAL), pectin methylesterase (PME), and α-L-arabinofuranosidase (AFAS), play a role in cell wall polysaccharide remodeling and the degradation of the cell wall polysaccharides [2]. PG is thought to depolymerize HG within stretches of unesterified galacturonic acid residues created by PME activity, which occurs during ripening and softening. Although some molecular genetic studies have indicated that PG may not be necessary or sufficient for fruit softening, it is responsible for a substantial component of pectin depolymerization and solubilization [10].
Gwanpua et al. [7] studied pectin modifications and the role of pectin-degrading enzymes during post-harvest softening of Jonagold apples and found that the main changes in pectin composition associated with the loss of firmness included increased water solubility of pectin. Gwanpua et al. [9] noted an extensive loss of galactose and arabinose was related to apple fruit softening, caused by the loss of side chains from rhamnogalacturonan I (RG-1) branching, potentially by the action of side chain enzymes such as β-D-galactosidase and α-L-arabinofuranosidase. Recently, Liu et al. [2] showed that changes in cell wall neutral sugar composition contribute to apple texture loss upon storage and specifically indicated that the loss of galacturonic acid content was higher in cultivars with rapid texture loss. The loss of arabinose has been noted to play an important role in softening and the perception of mealiness [5], and Segonne et al. [3] noted that high α-L-arabinofuranosidase activity levels were related to apples exhibiting mealiness. With respect to PME, Gwanpua et al. [7] indicated that PME activity increased during the ripening of Jonagold cultivar apples upon storage in air conditions at 1 °C, and no significant changes in the degree of methyl esterification (DME) of the cell wall material were observed. However, the work of Gwanpua et al. [10] examining PME activity in Granny Smith and Jonagold apples reported a decrease in PME activity during ripening and noted that PME activity may be more relevant during fruit development when newly synthesized pectin polysaccharides with very high DME are demethylated as the cell wall is assembled.
As such, in the context of post-harvest fruit ripening, changes in pectin and the influence on apple texture have been relatively well studied, while more studies are required to generate additional information on cell wall assembly and changes in cell wall composition during fruit growth (pre-harvest) through post-harvest storage to determine how these developmental processes differ between cultivars with differing textural qualities at harvest and upon storage. Ng et al. [4,5] have performed some work in this area by studying two apple cultivars with different softening behaviors. Ng et al. [4,5] reported that at the early developmental stage of 40 days after the full bloom (DAFB) fruitlet stage, the rapidly softening Royal Gala exhibited two times the yield of water and CDTA soluble pectins compared to the slow-softening Scifresh apples. Alternatively, at the 40 DAFB fruitlet stage, the Na2CO3 soluble pectin fraction of Scifresh exhibited two times as much arabinose and galactose compared to the Royal Gala samples. Also, in the faster-softening Royal Gala, β-galactosidase (BGAL) activity was generally higher than in the Scifresh. In tomato, it has been reported that downregulation of early-expressed BGAL results in firmer fruits; yet, suppression of BGAL at later developmental stages does not affect softening behavior [23]. Further, Segonne et al. [3] noted the importance of PME during early cell wall development during apple fruit growth, indicating that it could be an early marker of unfavorable texture traits in apples. Ng et al. [4] noted that pectin methyl esterase (PME) activity was significantly lower at the 40 DAFB stage of the Scifresh apples compared to the activity measured in Royal Gala apples at the 40 DAFB stage.
Additionally, the degree of methyl esterification (DME) was significantly higher in the cell wall polysaccharides from the fruitlet stage (40 DAFB) of Scifresh apples compared to DME values observed in the cell wall polysaccharides from the 40 DAFB stage of Royal Gala apples. With respect to DME, biochemical methods exist to assess these levels, such as titration with alkali or quantification of methanol via HPLC after saponification [4,6,24]. However, these methods are time-intensive, require larger sample amounts, and can provide results with higher levels of variation [24,25]. Fourier transform infrared spectroscopy (FTIR) has been proven to be a rapid method capable of assessing the DME of pectin [25,26].
Overall, the literature indicates that major differences in pectin occur before ripening-related softening begins. As such, cell wall assembly and composition from early development likely plays an important role in subsequent changes in fruit texture and may have predictive value with respect to apple breeding efforts. This work aimed to investigate the biochemical changes in cell wall composition and activity of cell wall-modifying enzymes of five apple cultivars from early growth phases through to 20 weeks of storage in relation to the textural changes at harvest and at 20 weeks of storage.
2. Materials and Methods
2.1. Samples
Five apple cultivars were tested, namely Royal Gala (Gala), Aurora Golden Gala (Aur), Splendour (Spl), Ambrosia (Amb), and Honeycrisp (HC) apples. The apple cultivars chosen for this study were based on different softening behaviors. HC, Aur, and Spl generally show good textural quality after storage, while Gala and Amb generally show poorer textural quality after storage. Additionally, Gala, Amb, Aur, and HC are cultivars of commercial relevance. Spl and Gala are the hybrid parentages of Aur. The Gala, Aur, and Spl apples were harvested from fields located at the Summerland Research and Development Centre, while the Amb and HC apples were harvested from a local apple orchard located in Summerland, BC. Four growth stages were chosen to analyze the differences in apple chemical components. Preharvest apples of each cultivar were harvested at 40 days and 70 days after full bloom (DAFB). The 40 DAFB developmental stage represented the fruitlet stage, which includes the cell division phase of growth. The 70 DAFB developmental stage represented the expanding fruit and cell expansion phase. Apples of each cultivar were also harvested once ripe (harvest/mature) and sub-sampled into two groups. One group was used for testing as mature fruit at harvest without any storage (harvest), and the other group was put into air storage at 0.5 °C at 95% relative humidity for 20 weeks (20-week samples). Due to susceptibility to storage disorders, as practiced in industry, HC, Amb, Aur, and Spl were preconditioned prior to going into 20 weeks of storage. HC were placed in air storage at 10 °C for 10 days before going into long-term storage conditions. Amb, Aur, and Spl were placed in air storage at 10 °C for 5 days before going into long-term storage conditions.
2.2. Analysis of Internal Ethylene Content on Fresh Harvest and Stored Apples
The harvest and 20-week storage apples were analyzed for internal ethylene content. A total of 15 apples were randomly chosen from each subset of apples at harvest or after 20 weeks of storage. The method employed for determining internal ethylene content was based on the work of Toivonen and Hampson [27]. Briefly, ethylene content was determined using a gas chromatography (GC) system with a flame ionization detector (Model 8610 C, SRI Instruments, Torrance, CA, USA) fitted with a 3 m × 2.1 mm i.d. stainless steel column packed with >0.254 mm/<0.318 mm particle diameter Hayesep D (Supelco, Oakville, ON, Canada). The temperatures of the oven and detector were 80 and 204 °C, respectively. There was no injector temperature as the on-column injection was performed (i.e., the sample was injected directly into the column). A minimum of three calibration tests of one-mL samples of ethylene standard were performed at the beginning of the analysis for each set of apples to ensure readings were within 5% of each individual reading. Afterward, the apples were labeled 1–15, and one milliliter of gas from the core cavity in the center portion of each fruit was taken through the calix end using a side-port needle syringe, which was then injected into a gas chromatograph with a flame ionization detector. The internal value of ethylene content (µL/L) was recorded.
2.3. Determination of Textural Parameters
Texture measurements were performed on all five apple cultivar samples at harvest/maturity and after 20 weeks of storage using a Mohr MDT-2 Digi-Test Computerized Agricultural Penetrometer (Mohr and Associates, Richland, WA, USA) equipped with an 11.1 mm Magness-Taylor probe. For each sample type, 15 apples were tested. Apples were warmed to room temperature overnight prior to testing. On each of these apples, the two sun–shade transition zones in the equatorial region of the apples were peeled and then subjected to penetration tests to obtain an average for five different values: maximum hardness in Region 1 (M1), maximum hardness in Region 2 (M2), average hardness in Region 2 (A2), integrity of the cortex (E2), and crispness (Cn). As such, only the flesh material of the apple was subjected to texture testing. The peel material was not tested. Penetration of Region 1 with the Mohr MDT-2 was performed at a fixed rate of speed of 24.2 mm/s starting from the surface to a depth of 8.1 mm, according to the manufacturer’s instructions [28,29,30]. Penetration of Region 2 was also performed at 24.2 mm/s. As reported by Teh et al. [1], Region 2 extends from the boundary of Region 1 to a depth proportional to 30% of the diameter of the fruit, which is measured by the Mohr MDT-2. The penetration endpoint of Region 2 for an average-sized apple was approximately 22.95 mm, with the evaluated tissue layer being 14.85 mm in depth.
2.4. Stabilization of Apple Flesh Starting Material
Two hundred fruitlets (~3.5 kg) at 40 DAFB, sixty-four fruitlets (~3.5 kg) at 70 DAFB, thirty apples (~6 kg) at harvest/maturity, and thirty apples (~6 kg) after 20 weeks of storage were sampled, and the apple flesh was stabilized for use as starting material for further experiments. Apple processing was performed using a modified procedure adapted from the method of Fischer and Amado [18]. The apples were warmed to room temperature overnight and then peeled, cored, sliced, and frozen in liquid nitrogen for 1 min. or until the bubbling of liquid nitrogen decreased, and then, frozen apple flesh material was transferred into labeled bags and weighed. Then, the frozen apple flesh material was freeze-dried. After freeze-drying, the apple starting material was weighed again, which allowed for the determination of the apple flesh dry matter content and the mass of the starting apple flesh material. The freeze-dried apple flesh samples were ground with a Retsch Mill SM2000 (Retsch GmbH, Haan, Germany) using a 2 mm screen to obtain the starting material used for all experimental work. The samples were stored at −80 °C until used.
2.5. Sequential Extraction of Pectin Fractions
To obtain alcohol-insoluble residue (AIR), the extraction method used was a modified version of the procedure used by Renard and Ginies [14]. The starting material was rehydrated in 85 °C ultrapure water, extracted with 70% ethanol, and then washed with 95% ethanol, followed by acetone, to remove the colored compounds from the starting material. Adapting the methods of Wrolstad et al. [31], the AIR served as a substrate to perform sequential water, trans-1, 2-diaminoacyclohexane-N, N, N′, N′-tetra acetic acid (CDTA—cyclohexanediaminetetraacetic acid), and sodium carbonate (Na2CO3) extractions to obtain the water-soluble pectins, pectins held by calcium bonds, and highly methylated pectins, respectively. All extractions were performed in duplicate. Yields of each fraction were determined. AIR yield (%) was calculated on a starting material dry matter basis, while the water, CDTA, and Na2CO3 soluble fractions (%) were calculated on an AIR dry matter basis.
2.6. Neutral Sugar Monomer Content, Uronic Acid Determination, and Starch Content
The neutral sugar monomer content was determined using the methods of Ross et al. [32] and Blakeney et al. [33]. Briefly, the polysaccharides (60 mg) from the AIR, water-soluble, CDTA, and Na2CO3 fractions were first hydrolyzed into monosaccharides with 1 M H2SO4 (12 mL) at 100 °C for 3 h in glass pressure tubes (ACE glass #8648-30 tube with plug #5845-47, ACE Glass Inc., Vineland, NJ, USA) in a convection laboratory oven. Different concentrations of neutral sugar standard solutions (rhamnose, fucose, arabinose, xylose, mannose, galactose, and glucose) were prepared in 1 M H2SO4, and each standard solution (12 mL) was also subjected to the hydrolysis procedure. Subsamples of all the hydrolysates obtained were centrifuged in 2 mL tubes in an Eppendorf Minispin (Eppendorf, Mississauga, ON, Canada) at 13,400 rpm for 5 min, and the supernatant was filtered through a 0.2 µm PVDF filter. The filtered supernatants were used for both sugar content and uronic acid determination.
For derivitization to alditol acetates, 1 mL of filtered supernatant was neutralized with 0.24 mL of NH4OH, and 50 µL of 20 mg/mL myo-inositol was added as an internal standard. A 0.1 mL sample of the neutralized solution was placed in a test tube, and 1 mL of NaBH4 in DMSO (0.02 g/mL) was added. The capped tubes were incubated at 40 °C for 90 min in a shaking water bath (VWR, Radnor, PA, USA). Additions of 0.1 mL acetic acid, 0.2 mL 1-methylimidazole, and 2 mL of acetic anhydride were added sequentially to the tubes, mixing after each addition. Ultrapure water (5 mL), followed by 1 mL of dichloromethane, was then added, being mixed after each addition. The dichloromethane layer containing the alditol acetate derivatives was taken out and then analyzed by gas-liquid chromatography on an Agilent DB-225 glass-capillary column (30 m × 0.32 mm, i.d., film: 0.25 μm) in an Agilent 6890 N Network GC System (Agilent Technologies, Mississauga, ON, Canada), equipped with a flame ionization detector (FID). Sugar concentrations were calculated from sugar standard curves relative to the myo-inositol internal standard. Experiments were performed in duplicate, and results were expressed on a dry-weight basis.
Uronic acid content was quantified by the Scott method [34] using the centrifuged filtered acid hydrolysate as described for neutral sugar monomer content. The uronic acid content was determined by averaging the absorbance at 400 and 450 nm and comparing it to a standard curve of galacturonic acid (MilliporeSigma, Burlington, MA, USA). Experiments were performed in duplicate, and results were expressed on a dry weight basis of each fraction.
Starch content was determined using a Megazyme Total Starch Kit (AA/AMG, K-TSTA, Wicklow, Ireland) on polysaccharides (100 mg) from the AIR, water-soluble, CDTA, and Na2CO3 fractions, as well as freeze-dried apple flesh samples. The values of glucose in the non-starch polysaccharides were corrected for the starch content [18,35].
2.7. Fourier Transform Infrared Spectroscopy (FTIR) Analysis
Canteri et al. [24] and Liu et al. [36] indicated that the DME of pectin homogalacturonans can readily be determined using FTIR by measuring the relative height of the two bands around 1740 and 1600 cm−1. Absorbance around 1720–1740 cm−1 is associated with C=O bonds of esterified carboxylic groups, and absorbance around 1600–1630 cm−1 is associated with COO−1 bonds of carboxylate groups [17,24,25,36]. Our DME calculations were based on the peak height of absorbance at 1740 cm−1 (associated with C=O bonds of esterified carboxylic groups) and the peak height of absorbance at 1630 cm−1 (associated with COO−1 bonds of carboxylate groups). As such, absorbance values from FTIR data were used in the following expression to determine DME % [25]:
Typically, DME determination with FTIR has been performed on AIR cell wall material. The work of Manrique et al. [25] indicated that other structural polysaccharides and components soluble in 80% ethanol or acetone (i.e., soluble sugars, organic acids, pigments, etc.) do not interfere with DME evaluation, which removed the necessity of pectin extraction from the cell wall. There is value in utilizing an FTIR method with a minimum of sample preparation [25,37]. Manrique et al. [25] recommended using unextracted fruit mesocarp/flesh for DME determination, and Canterri et al. [24] performed FTIR on raw/unextracted fruit and vegetable material to obtain DME values. Therefore, in this study, DME was measured on freeze-dried apple flesh samples denoted as “starting material”. For due diligence, DME values were obtained for all AIR samples too. AIR DME values and starting material DME values were in agreement and exhibited ≤4% variation in values.
FTIR analysis was performed using the methods of Ross et al. [32]. Briefly, the Fourier transform mid-infrared (FTIR) spectra were measured using a Nicolet 380 spectrometer (Thermo Fisher Scientific Inc., Waltham, MA, USA) with SMART iTR diamond attenuated total reflectance (ATR) with a 45° incident angle generating one bounce. The spectrometer was equipped with a deuterated triglycine sulfate detector scanning over the wavenumber range of 4000–650 cm−1 at a resolution of 4 cm−1. For each spectrum, a total of 32 repetitive scans were accumulated using OMNIC 8.0 software (Thermo Fisher Scientific Inc., Waltham, MA, USA). For analysis, approximately 30 mg of sample was placed on the head of the ATR crystal to cover the crystal such that none of the crystal was visible and then pressed using a pressure tower lowered until three clicks were felt. Spectra were collected in triplicate for each test sample and pectin standard. Spectra were then averaged to one spectrum.
Based on the methods of Wu et al. [17] and Kyomugasho et al. [26], the degree of esterification was determined from a standard curve equation created from known esterified standards. Calibration samples of different DME were obtained by mixing commercial pectin standards in various ratios to create a standard curve with nine points. The following commercial standards were used: apple pectin (#76282, MilliporeSigma, Burlington, MA, USA) with 70.2% esterification, esterified citrus fruit pectin (P9561, MilliporeSigma, Burlington, MA, USA) with 87% esterification, and esterified potassium salt citrus fruit pectin (#P9436, Millipore Sigma, Burlington, MA, USA) with 56.1% esterification. A calibration curve was created with the following DME (%) values: 56.1, 59.63, 63.15, 66.68, 70.2, 74.40, 78.60, 82.60, and 87.00%. A linear trend line equation was determined to calculate the DME (%) of experimental samples. A coefficient of determination (r2) of 0.94 was obtained, indicating a strong goodness of fit. Further, Agussabti et al. [38] noted that an r2 above 0.75 is characteristic of a good predictive model.
2.8. Protein Quantification and Analysis of Cell Wall Enzyme Activity
Proteins including BGAL, AFAS, and PME enzymes were extracted and assayed for all freeze-dried apple flesh samples from all apple cultivars (Gala, Aur, Spl, Amb, and HC) at all developmental stages (40 DAFB, 70 DAFB, harvest, and 20-week storage). Freeze-dried material was used for enzyme analysis as the fruitlet material showed high polyphenol oxidase (browning) activity during experimentation. Freezing the apple samples in liquid nitrogen, followed by freeze-drying, effectively stabilized the material. The work of Sundari and Adholeya [39] indicated that freeze-drying maintained enzyme activity, which included β-glucosidase activity. Further, if enzyme activity in the apple samples was affected by the freeze-drying procedure, the enzyme activity in all samples would be affected similarly and trends would hold true. The authors are confident in presenting the data based on freeze-dried material. Three replicates were taken for each cultivar and time point, in which the protein including the enzymes was extracted and assayed separately.
2.9. Protein and Enzyme Extraction
Proteins including BGAL, AFAS, and PME enzymes were extracted using a method adapted from the work of Ng et al. [5]. The method used two sequential extractions with 0.1 M sodium phosphate buffer at pH 7.5 with sodium chloride, first at a concentration of 2.992 g/L (buffer-soluble extraction medium, BSEM) and then at 35.064 g/L (salt-soluble extraction medium, SSEM). A complete, EDTA-free protease inhibitor tablet (# 11873580001, Roche Diagnostics, Indianapolis, IN, USA) was added for every 50 mL of these extraction mediums on the day used. BSEM extraction contained free proteins or enzymes, while SSEM extraction contained cell-bound proteins or enzymes. Briefly, the extraction procedure consisted of adding a freeze-dried apple sample (0.4 g) and polyvinylpolypyrorrolidone (PVPP) (0.225 g) to a 15 mL centrifuge tube. To the tube, 4.5 mL of cold BSEM was added. During all steps in the extraction procedure, samples were kept on ice or put in a refrigerator to keep them cold. The tube was capped and shaken for 1 min on an orbital shaker (VWR, Radnor, PA, USA). The tube was then centrifuged for 10 min at 5000 rpm at 4 °C in a Sorvall ST16R centrifuge (Thermo Fisher Scientific, Waltham, MA, USA). The supernatant was transferred into a clean 15 mL centrifuge tube. To clarify the supernatant further, a subsample of the supernatant from the top was transferred into a 2 mL centrifuge tube. The 2 mL tube was centrifuged for 5 min at 13,400 rpm in an Eppendorf Minispin centrifuge (Eppendorf, Mississauga, ON, Canada). The clarified supernatant was then transferred to a clean 2 mL centrifuge tube and used as the BSEM extract. The precipitate from the original centrifuge tube was sequentially extracted with 2 mL of cold SSEM. The capped tube was shaken on ice on an orbital shaker (VWR, Mississauga, ON, Canada) for 60 min and then centrifuged for 10 min at 5000 rpm at 4 °C in a Sorvall ST16R centrifuge (Thermo Fisher Scientific, Waltham, MA, USA). To clarify the supernatant further, the supernatant was transferred into a 2 mL centrifuge tube and centrifuged for 5 min at 13,400 rpm for 5 min in an Eppendorf Minispin centrifuge (Eppendorf, Mississauga, ON, Canada). The clarified supernatant was then transferred to a clean two mL centrifuge tube and used as the SSEM extract. The BSEM and SSEM extracts obtained were then analyzed on the same day they were extracted for the determination of protein content, β-D-galactosidase activity, α-L-arabinofuranosidase, and pectin methyl esterase activity.
2.10. Protein Quantification
Buffer-soluble protein and salt-soluble protein were quantified using the Bio-Rad Protein Assay (Mississauga, ON, Canada). Bovine serum albumin (BSA) was used as the protein standard at various concentrations up to 250 µg/mL, prepared in both the BSEM and SSEM. In brief, a solution of 1:4 BioRad Protein Reagent: ultrapure water was prepared. Twenty-five µL of standard or sample was added to wells in triplicate in a 96-well visible microplate; then, 250 µL of diluted BioRad Reagent was added to all wells. The system was incubated for 5 min, and absorbance was measured at 595 nm to determine protein content using a standard curve. Protein levels were expressed in µg BSA/g freeze-dried starting material.
2.11. β-D-Galactosidase (BGAL) Activity
BGAL activity was determined by adapting the method used by Ng et al. [5]. In brief, 4-nitrophenol (MilliporeSigma, Burlington, MA, USA) was prepared in both BSEM and SSEM at different concentrations up to 1.6 mM to be used as standards. Then, 25 µL of extract (BSEM or SSEM) or standard (4-nitrophenol in either BSEM or SSEM) was added to wells, in triplicate, in a 96-well visible microplate. To the wells, 200 uL of 0.20 mM 4-Nitrophenyl-B-D-galactopyranoside (4NPGP), prepared in 0.1 M citric buffer at pH 5.0, was added. The microplate was covered with Platemax Axyseal Sealing Film (#PCR-SP, Millipore Sigma, Burlington, MA, USA) and incubated at 37 °C for 2 h. The microplate was removed and cooled for 2 min, and 25 µL of 1 M Na2CO3 was added to terminate the reaction. Sample extracts were also added into wells (in triplicate) containing 4NPGP and Na2CO3 after incubation time to serve as blanks since some samples had color. BGAL enzyme standards at different concentrations were also run in triplicate (25 µL) to check for a reaction. The absorbance of microplates was read at 405 nm on a SpectraMax M2e microplate reader (Molecular Devices, San Jose, CA, USA). The absorbance of the blanks was subtracted from values obtained using the active enzyme extracts. BGAL enzyme activity was expressed as nmol 4-nitrophenol per min per ug protein. BGAL activity values were obtained for both buffer-soluble and salt-soluble extracts.
2.12. α-L-Arabinofuranosidase (AFAS) Activity
AFAS activity was determined by adapting the method used by Ng et al. [5]. In brief, 4-nitrophenol (MilliporeSigma, Burlington, MA, USA) was prepared in both BSEM and SSEM at different concentrations up to 1.6 mM to be used as standards. Then, 25 µL of extract (BSEM or SSEM) or standard (4-nitrophenol in either BSEM or SSEM) was added to wells, in triplicate, in a 96-well visible microplate. To the wells, 200 uL of 0.20 mM 4-Nitrophenyl-α-L-arabinofuranoside (4NPAF), prepared in 0.1 M citric buffer at pH 5.0, was added. The microplate was covered with Platemax Axyseal Sealing Film (#PCR-SP, Millipore Sigma, Burlington, MA, USA) and incubated at 37 °C for 3 h. The microplate was removed and cooled for 2 min, and 25 µL of 1 M Na2CO3 was added to terminate the reaction. Sample extracts were also added into wells (in triplicate) containing 4NPGP and Na2CO3 after incubation time to serve as blanks since some samples had color. AFAS enzyme standards at different concentrations were also run in triplicate (25 µL) to check for a reaction. The absorbance of microplates was read at 405 nm on a SpectraMax M2e microplate reader (Molecular Devices, San Jose, CA, USA). The absorbance of the blanks was subtracted from values obtained using the active enzyme extracts. AFAS enzyme activity was expressed as nmol 4-nitrophenol per min per ug protein. AFAS activity values were obtained for both buffer-soluble and salt-soluble extracts.
2.13. Pectin Methylesterase (PME) Activity
PME activity was determined by adapting the methods of Grsic-Rausch and Rausch [40] and Mueller et al. [41]. In brief, 1.8 mM NADH (#N8129-1G, MilliporeSigma, Burlington, MA, USA) was prepared in 0.1 M phosphate buffer at pH 7.5 and diluted to various concentrations to be used as standards. PME activity was determined by adding (in triplicate) 25 µL of BSEM or SSEM for standards, 25 µL of BSEM or SSEM extracts for samples, and 25 µL of PME at different concentrations to check reactions in a 96-well UV-Vis microplate. For samples and PME, additional wells were dispensed to use as blanks. To all wells, 50 µL of 1.5 U/mL alcohol oxidase solution from Pichia pastoris (250 units, #A2404-250UN, MilliporeSigma, Burlington, MA, USA) was added. Then, 50 µL of NADH standard solution was added to wells for standards, and 50 µL of 1.8 mM NAD (#N8410-15VL, MilliporeSigma, Burlington, MA, USA) prepared in 0.1 M sodium phosphate buffer at pH 7.5 was added to all other wells. Next, 50 µL of 0.1 M sodium phosphate buffer at pH 7.5 was added to all wells containing NADH standard or blanks, and 50 µL of 1.5 U/mL formaldehyde dehydrogenase (F1879-50UN, MilliporeSigma, Burlington, MA, USA) prepared in 0.1 M sodium phosphate buffer at pH 7.5 was added to wells with a sample or PME to be tested. To start the reaction, 50 µL of 0.225% pectin (citrus pectin, #P9135-100G, Millipore Sigma, Burlington, MA, USA) prepared in 0.1 M sodium phosphate buffer at pH 7.5 was added to all the wells. A kinetics run was immediately monitored on a SpectraMax M2e (Molecular Devices, San Jose, CA, USA) microplate reader measuring absorbance at 340 nm for 30 min of reading every 2 min with an initial 5-s shake before the first read. PME activity was expressed as µmoles of NADH released per min per ug protein calculated from the NADH standard curve after correcting for blanks. PME activity values were obtained for both BSEM and SSEM extracts.
2.14. Statistical Analysis
Statistical analysis was conducted using SAS Institute Inc. software, version 9.04.01 (2012–2020, SAS Institute Inc., Cary, NC, USA). Data were subjected to analysis of variance (ANOVA) with replication using the SAS PROC GLM procedure, followed by the least significant difference (LSD) Fisher’s test at p ≤ 0.05 to determine statistically significant differences between means. Correlation coefficients were determined using Pearson’s correlation coefficient statistical function in Excel (version 2306, Microsoft, Redmond, WA, USA). Significance was detected at p ≤ 0.05.
3. Results and Discussion
3.1. Ethylene Content
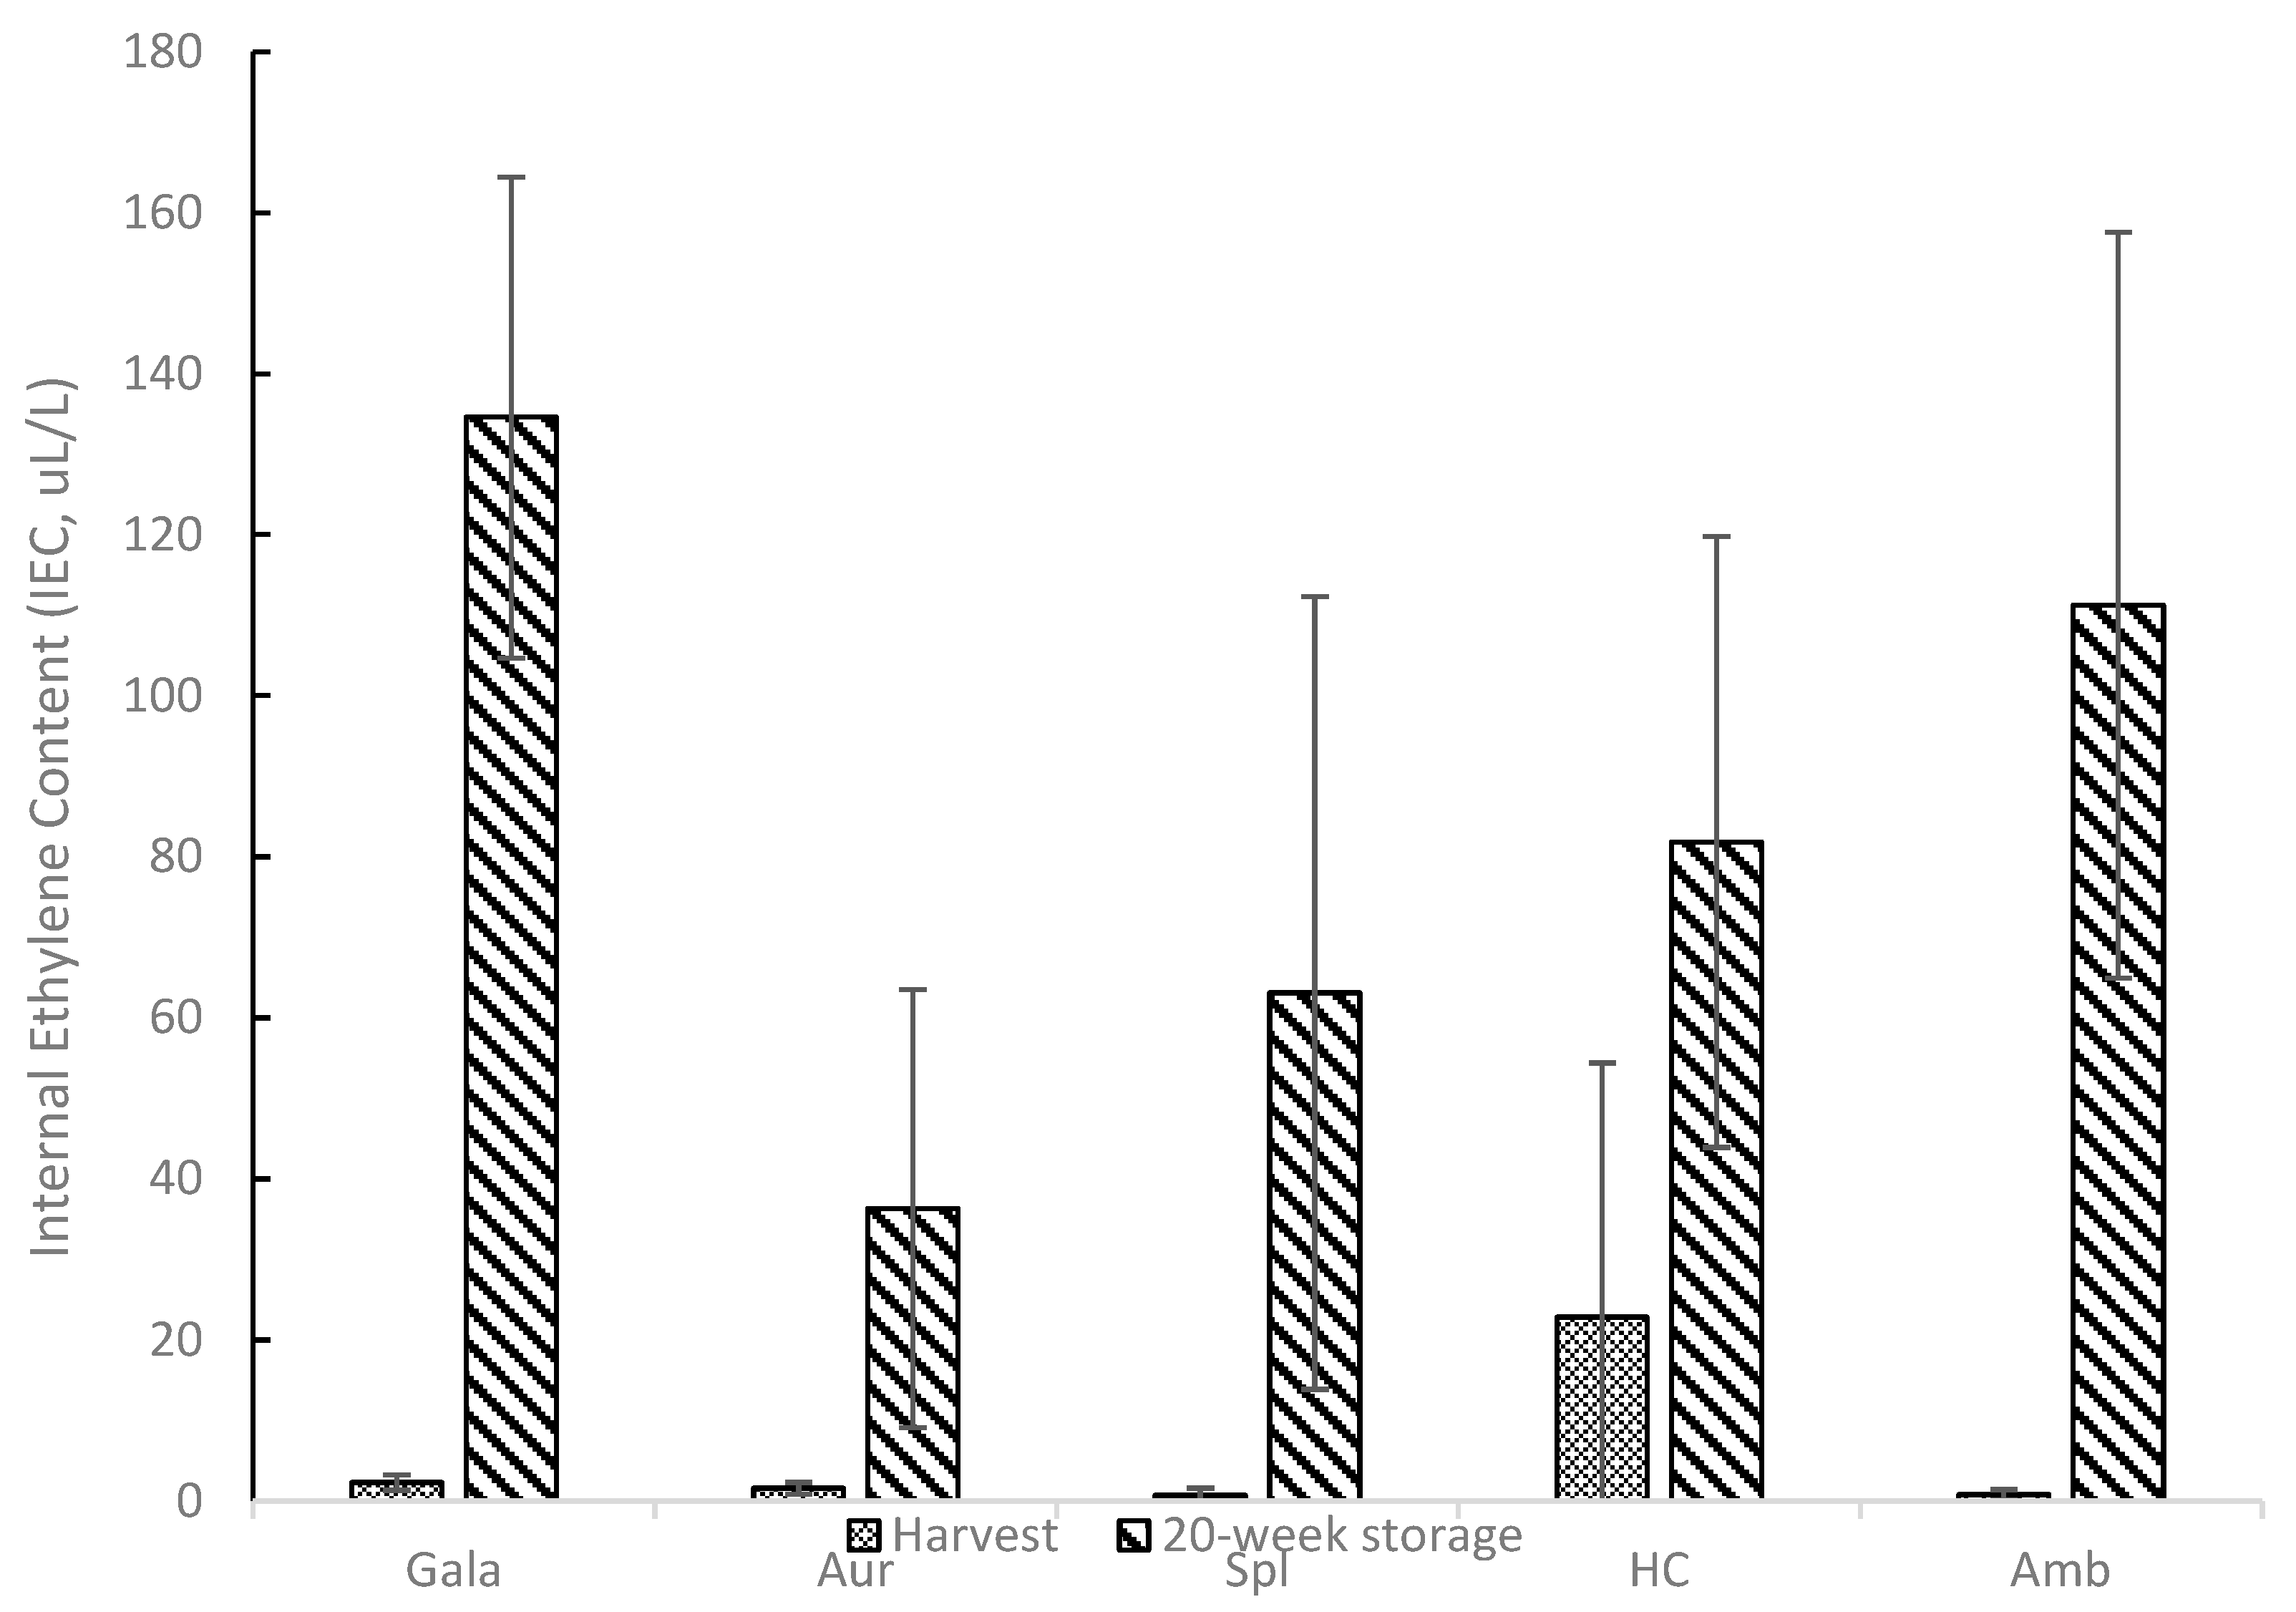
Table 1 shows the apple sample collection dates for the 40 and 70 Days After Full Bloom (DAFB) samples and the collection dates for the harvest/mature samples. Maturity was assessed using a Cornell Generic Starch chart for Royal Gala (Gala), Aurora Golden Gala (Aur), Splendour (Spl), and Honeycrisp (HC) apples, while an Ambrosia Starch Chart was used to determine the starch content for Ambrosia (Amb) apples. The 40 DAFB collection date for Gala, Aur, and Spl apples was 31 May 2016, while the 40 DAFB collection date for Amb and HC apples was 26 May 2016. The 70 DAFB collection date for the Gala and Spl apples was 28 June 2016. The 70 DAFB collection date for the Aur apples was 29 June 2016, while the 70 DAFB collection date for the Aur and HC apples was 23 June 2016. Harvest dates for the Gala, Aur, Spl, Amb, and HC apples were 30 August 2016, 14 September 2016, 13 October 2016, 3 October 2016, and 6 September 2016, respectively. Figure 1 shows the internal ethylene content (IEC) values for harvest (IEC0) and 20-week storage (IEC20) samples for all apple cultivars. Ethylene is a plant hormone implicated in the ripening of climacteric fruit, such as apples, and it has been reported that ethylene causes a series of physiological changes, including a decrease in firmness and crispness [42]. All apple cultivars tested appeared to increase in IEC after 20 weeks of storage compared to harvest levels. At harvest, Spl and Amb showed lower internal ethylene content (<1 µL/L), while Gala, Aur, and HC showed higher values: 2.31, 1.58, and 22.84 µL/L, respectively. It should be noted that IEC values at harvest for HC showed very high variability compared to the other samples. The standard deviation for the harvest HC sample was higher than the mean value. Although zero is the lowest range value on the y-axis value in Figure 1, the error bar for the harvest HC would extend into a negative value due to the high variability. Gala, Aur, Spl, HC, and Amb showed higher IEC values after 20 weeks of storage: 134.58, 36.31, 63.10, 81.84, and 111.28 µL/L, respectively. For reference, HC, Amb, and Spl are all considered cultivars with low ethylene concentrations during ripening [42,43,44], while Gala is considered a cultivar with higher ethylene concentrations during ripening [4].

Table 1.
Apple Sample Collection Dates.

Figure 1.
Internal Ethylene Content (IEC) for Royal Gala (Gala), Aurora Golden Gala (Aur), Splendour (Spl), Honeycrisp (HC), and Ambrosia (Amb) Apple Cultivars at Harvest and 20-Week Storage.
3.2. Textural Parameters
Table 2 presents the textural parameters for the Gala, Aur, Spl, HC, and Amb apple cultivars at harvest and 20-week storage. Overall, for M1 at harvest, Gala samples showed the highest values, while Amb samples showed the lowest value (p ≤ 0.05). For M1, after storage, HC samples showed the lowest values (p ≤ 0.05). For M1, all cultivars showed a decrease in values upon storage, except for the Amb cultivar (p ≤ 0.05). For the M2 values at harvest, all apple cultivars tested showed similarly high values, while differences became apparent after storage. Amb and Gala apples showed the lowest values, while HC samples showed the highest values (p ≤ 0.05). For M2, all apple cultivars tested exhibited a decrease in values after storage, except HC (p ≤ 0.05). For both A2 and E2 texture parameters at harvest, all apple cultivars tested showed relatively high values. At harvest, Spl, Aur, HC, and Amb apples showed the highest A2 and E2 values; yet, after storage, Gala and Amb apples exhibited much lower texture values. HC retained high A2 and E2 values, which were not significantly different than values measured at harvest (p ≤ 0.05). Again, only HC cultivar samples did not show a decrease in A2 and E2 values upon storage (p ≤ 0.05). For crispness (Cn) values measured at harvest, there were no differences observed based on cultivar (p ≤ 0.05); yet, upon storage, HC apples maintained their crisp texture as Cn values at harvest and after storage were not significantly different (p ≤ 0.05). Aur, Gala, and Amb samples showed the poorest Cn values after storage. The results indicate that HC shows excellent textural quality upon storage, while Amb and Gala are poor at retaining textural quality. HC cultivar is a low producer of ethylene, which has been attributed to the retention of good textural quality upon storage; however, Amb cultivar is also a low producer of ethylene and did not demonstrate good textural quality retention. Additionally, IEC20 values for HC and Amb were not significantly different (p ≤ 0.05). Interestingly, M1 was the only textural parameter where HC showed a decrease upon storage and showed the lowest M1 value upon storage (p ≤ 0.05) compared to Gal, Amb, Aur, and Spl. These results indicate M1 may not be an ideal marker of texture, which is an important finding as, again, R1 extends to a fixed depth of 8.1 mm from the outermost region of the fruit [1], which is the region used by most researchers performing penetration tests to obtain firmness data [3,4,6,7,8,9,10].
Table 2.
Textural Parameters for Apple Cultivars at Harvest and 20-Week Storage.
3.3. Degree of Methlesterification (DME) and Fourier Transform Infrared Spectroscopy (FTIR) Analysis
Table 3 shows data on the degree of methylesterification (DME) for apple cultivars tested at different developmental stages. The results show that within cultivars, Gala apple DME (~63%) peaked at 70 DAFB and harvest. Both Aur apple DME (~66%) and Spl apple DME (~66%) peaked at 70 DAFB; HC apple DME (~71%) peaked at 70 DAFB, and Amb apple DME (~63%) peaked at 70 DAFB and harvest. At the developmental stage for 40 DAFB, HC samples showed highest DME values (60.43%), while Amb samples presented the lowest values (57.37%); Aur (62.43%) and Spl (62.32%) apples exhibited the second highest levels, while Gala showed the second lowest DME values at 60.43% (p ≤ 0.05). For 70 DAFB samples, HC again showed the highest values (70.48%); Aur (66.33%) and Spl (66.34%) exhibited the second lowest DME values, while Gala and Amb had the lowest DME values, which were 63.19 and 62.13%, respectively (p ≤ 0.05). For harvest samples, HC showed the highest DME (67.96%), and Gala, Amb, and Aur all showed the lowest DME values, which were 63.26, 62.81, and 64.25%, respectively. Notably, DME for Aur samples was significantly higher than Amb, but not Gala (p ≤ 0.05) samples. For the 20-week storage samples, HC apples showed the highest DME value (65.16%), Amb apples showed the lowest DME value (59.8%), Gala apples showed the second lowest DME value (61.05%), and Aur (62.4%) and Splendor (62.41%) apples showed the second highest DME values; this was the same trend observed for the 40 DAFB samples. The work of Ng et al. [4] also showed that DME was significantly higher in the cell wall polysaccharides from the fruitlet stage (40 DAFB) of Scifresh apples (good textural quality after storage) compared to DME values observed in the cell wall polysaccharides from the 40 DAFB stage of Royal Gala apples (poor textural quality after storage). Differences in DME became insignificant at harvest and after storage. The work of Dheilly et al. [6] examined differences in DME over apple fruit development and did not observe any significant differences in DME values over developmental stages. DME values reported in the work of Dheilly et al. [6] exhibited coefficients of variation ranging from 7 to nearly 30%, which may have masked any statistical significance. Both Ng et al. [4] and Dheilly et al. [6] determined DME using a method based on the quantification of methanol after saponification, and the work of Manrique and Lajolo [25] showed lower coefficients of variation in DME values determined with FTIR compared to the method of methanol quantification after saponification.
Table 3.
Degree of Methylesterification (DME) for Apple Cultivars at Different Developmental Stages.
3.4. Yields of Cell Wall Material and Fractions
Table 4 presents the yields of cell wall material and fractions of apple cultivars at different developmental stages. For the AIR fraction, comparing between developmental stages, the highest yields were seen in the 40 DAFB samples, and lower yields were seen in the harvest and 20-week storage samples (p ≤ 0.05). At the developmental stage, at 40 DAFB, AIR yield values were not substantially different; yet, Amb apples showed the highest yield at 32.66% (p ≤ 0.05). This result is consistent with the work of Ng et al. [4], which noted that Royal Gala with poor textural quality after storage showed a higher yield of cell wall material compared to Scifresh, which exhibited good textural quality after storage. At 70 DAFB, the highest AIR yield was observed in the Spl samples (23.72%), followed by Gala (22.13%) and Amb (22.38%) samples (p ≤ 0.05). HC samples showed the lowest AIR yield (19.38%) at 70 DAFB. The harvest and 20-week storage HC samples showed the lowest AIR yields of 8.84 and 8.38%, respectively (p ≤ 0.05), while Gala and Spl samples presented the highest AIR yields at harvest (11.45 and 11.69%, respectively) and after 20 weeks of storage (10.17 and 10.62%, respectively). It seems that HC, the cultivar with the best textural quality after storage, showed lower AIR yields at all developmental stages.
Table 4.
Yields of Cell Wall Material and Fractions of Apple Cultivars at Different Developmental Stages.
For water fraction yields, comparing between developmental stages and within cultivars, Gala and Amb apple samples after 20 weeks of storage showed considerably higher yields of the water-soluble fraction at 12.94 and 13.60%, respectively. Aur samples showed higher yields of the water-soluble fraction at the 40 DAFB and 20-week stages and lower yields at the 70 DAFB and harvest stages. Spl samples showed comparable yields of the water-soluble fraction at 40 DAFB, 70 DAFB, and 20-week storage, with 7.34, 7.81, and 8.49%, respectively. For Spl samples, the lowest yields of the water-soluble fraction were seen in harvest samples (5.85%). HC apples showed lower water fraction yield at 20-week storage (6.53%) compared to other developmental stages, except for the 40 DAFB stage, which yielded a 7.18% water-soluble fraction. At the common developmental stage, Amb and HC apples have comparable yields of the water-soluble fraction at 40 and 70 DAFB; yet, at harvest and upon storage, the yield of the water-soluble fraction in the Amb samples, which demonstrated poor textural quality after storage, was nearly double the level of water-soluble fraction yield (p ≤ 0.05) in HC samples, which exhibited good textural quality after storage. Ng et al. [5] also reported that the yield of the water-soluble fraction was lower in the samples with good textural quality after storage (Scifresh). Additionally, the work of Gwanpua et al. [7] also noted that increased water solubility of pectin was associated with the loss of firmness upon ripening.
For the CDTA fraction, overall yields were higher in the 40 and 70 DAFB samples compared to yields measured in the harvest and 20-week storage samples. At 40 DAFB, the Amb and HC samples showed the highest CDTA yields (15.38 and 16.58%, respectively), while at 70 DAFB, the Gala samples showed the highest CDTA yields (10.21%). For all developmental stages, differences in CDTA yields between Amb and HC samples were not substantially different. For the Na2CO3 fraction, overall yields were lowest in the 70 DAFB samples. At 40 DAFB and harvest, Amb samples showed the highest Na2CO3 yields of 19.98 and 19.71%, respectively, while at 70 DAFB and upon 20-week storage, HC samples showed the highest Na2CO3 yields of 14.02 and 22.41%, respectively.
3.5. Dry Matter, Protein Content, β-D-Galactosidase (BGAL), α-L-Arabinfuranosidase (AFAS), and Pectin Methylesterase (PME) Activity
Table 5 presents dry matter, protein content, β-D-galactosidase (BGAL), α-L-arabinfuranosidase (AFAS), and pectin methylesterase (PME) activity as affected by apple cultivar and developmental stage. For all cultivars, dry matter (DM) values increased as the development stage increased up to harvest. Amb, Aur, and Gala samples presented higher DM values at 40 DAFB: 13.89, 13.78, and 13.01%, respectively. At 70 DAFB, Gala and HC showed lower DM values of 13.18 and 14.95%, respectively, while Aur, Spl, and Amb showed higher DM values of 15.84, 15.11, and 15.22%, respectively. Interestingly, at harvest and upon 20-week storage, HC values exhibited the highest DM values (17.18 and 17.59%, respectively), while Amb showed the lowest DM values of 16 and 15%, respectively (p ≤ 0.05).
Table 5.
Dry Matter, Protein Content, β-D-Galactosidase (BGAL), α-L-Arabinfuranosidase (AFAS), and Pectin Methylesterase (PME) Activity as Affected by Apple Cultivar and Developmental Stage.
For protein content in the buffer-soluble fraction, generally, as the developmental stage increased, protein content increased for all cultivars tested, ranging from 270.89 to 3858.88 µg BSA/g. For protein content in the salt-soluble fraction, the harvest and 20-week storage samples showed higher protein levels than the 40 and 70 DAFB samples. At the 40 DAFB stage, salt-soluble protein levels were comparable for all samples. At the 70 DAFB developmental stage, the HC samples presented higher soluble protein levels (250.84 µg BSA/g) compared to the Aur, Spl, and Amb samples, which ranged from 135.32 to 183.17 µg BSA/g. At harvest, both the HC and Amb samples showed the highest salt-soluble protein levels of 891.59 and 924.2 µg BSA/g, respectively. Upon 20-week storage, Amb showed significantly higher salt-soluble protein levels (1168.00 µg BSA/g) compared to HC (844.12 µg BSA/g) (p ≤ 0.05), while the Spl samples showed the lowest salt-soluble protein levels (362.88 µg BSA/g).
For the buffer-soluble β-galactosidase activity expressed on a protein basis (BGALBSp) in the 40 DAFB samples, no activity was detected, while at 70 DAFB, Gala (0.012 nmol 4 NP/min/µg protein) and Amb (0.04 nmol 4 NP/min/µg protein) samples showed higher levels of BGALBSp activity. Amb and Gala apples showed poor texture upon storage. In the harvest and 20-week storage samples, the highest BGALBSp activity was measured in the Amb samples, with values of 0.018 and 0.012 nmol 4 NP/min/µg protein, respectively. For the salt-soluble β-galactosidase activity expressed on a protein basis (BGALSSp) in the 40 DAFB samples, only the Gala and Amb apples presented measurable BGALSSp activity levels. In the 70 DAFB samples, the Amb samples showed the highest levels of BGALSSp activity (0.161 nmol 4 NP/min/µg protein), while the HC samples showed the lowest BGALSSp activity (0.0096 nmol 4 NP/min/µg protein) level (p ≤ 0.05). Again, the Amb apples showed poor textural quality after storage, while the HC apples showed good textural quality after storage. In the harvest and 20-week storage samples, the highest BGALBSp activity was measured in the Amb, Aur, and Spl samples, while lower BGALSSp activity levels were observed in the Gala and HC samples (p ≤ 0.05). These results seem to indicate the importance of BGAL activity at the early developmental stage versus levels at harvest or upon storage and are in agreement with the work of Ng et al. [5].
For the buffer-soluble α-arabinofuranosidase activity expressed on a protein basis (AFASBSp) in the 40 DAFB samples, higher activity levels were observed in the Aur and Spl samples, while in the 70 DAFB harvest and 20-week storage samples, no significant differences were found (p ≤ 0.05). For the salt-soluble α-arabinofuranosidase (AFASSSp) activity expressed on a protein basis in the 40 DAFB samples, the Amb apples (0.0028 nmol 4 NP/min/µg protein) presented measurable activity, while in the 70 DAFB samples, all values were similar; yet, the Amb apples showed the highest values of protein (0.0015 nmol 4 NP/min/µg; p ≤ 0.05). No significant differences in AFASSSp activity levels were determined in the harvest samples (p ≤ 0.05). For the 20-week storage samples, the Spl samples showed the lowest AFASSSp activity levels (p ≤ 0.05). Segonne et al. [3] noted that high α-L-arabinofuranosidase activity levels were related to apples exhibiting mealiness, and the current work seems to point to the relevance of AFASSSp activity at the early developmental stage with respect to textural quality after storage.
For the buffer-soluble pectin methyl esterase activity expressed on a protein basis (PMEBSp) in the 40 DAFB samples, the highest and only detectable activity was observed in the Amb samples (0.1105 µmol/NADH/min/µg protein). In the 70 DAFB samples, the highest PMEBSp activity was determined in Amb samples (0.9706 µmol/NADH/min/µg protein), followed by the Gala samples (0.5853 µmol/NADH/min/µg protein), which both exhibited poor texture upon storage. In the harvest samples, the Aur and Spl apples showed the highest PMEBSp activity levels. At 20-week storage, the highest levels of PMEBSp activity were seen in the Aur, Spl, and Gala samples. Salt-soluble pectin methyl esterase activity, expressed on a protein basis, (PMESSp) was higher than PMEBSp activity at common cultivar and developmental stages. PMESSp values ranged from 0–2.65 µmol/NADH/min/µg protein, while the PMEBSp values ranged from 0–0.97 µmol/NADH/min/µg protein. In the 40 DAFB samples, the highest PMESSp activity level was measured in the Amb, Gala, and Spl apples (2.65, 2.18, and 2.04 µmol/NADH/min/µg protein, respectively), while no detectable PMESSp activity was detected for the HC apples. In the 70 DAFB samples, the highest PMESSp activity was determined in the Aur, Spl, and Amb apples (2.18, 1.89, and 1.68 µmol/NADH/min/µg protein, respectively), and lower PMESSp activity levels were observed in the HC and Gala samples (1.07 and 1.20 µmol/NADH/min/µg protein, respectively). In the harvest samples, higher PMESSp activity levels were seen in the Aur and Spl apples. At 20-week storage, the highest levels of PMESSp activity levels were measured in the Aur, Spl, and Gala samples. These results seem to point to the importance of PME activity at the early developmental stages impacting textural quality upon storage.
3.6. Linking Biochemical Properties with Textural Parameters
With the aim of identifying associations between the biochemical data and textural data provided in Table 2, Table 3, Table 4 and Table 5, correlation analysis was performed to generate Pearson’s correlation coefficients, which were then summarized in correlation plots to determine patterns. Supplementary Figure S1a–d presents correlation plots for the 40 DAFB, 70 DAFB, harvest, and 20-week storage data, respectively, for all cultivars. Significant correlations (p ≤ 0.05) are discussed.
Correlation data for the biochemical properties of the 40 DAFB samples and textural quality at harvest and after 20 weeks of storage are shown in Figure S1a. DME was positively correlated with textural properties after storage (StoreM2, StoreA2, StoreE2, and StoreCn) but not StoreM1. DME was negatively correlated with BGALSSp, AFASSSp, PMEBSp, and PMESSp. DME was negatively correlated with AIR yield. DM was negatively correlated with storage texture (StoreM1, StoreM2, and StoreCn). DM was positively correlated with water fraction amount. BGALSSp was negatively correlated with storage texture (StoreA2 and StoreE2). AFASSSp was negatively correlated with storage texture (StoreM1 and StoreA2). PMEBSp was negatively correlated with storage texture (StoreM1 and StoreA2), and PMESSp was negatively correlated with storage texture (StoreM2, StoreA2, StoreE2, and StoreCn).
Correlation data for the biochemical properties of the 70 DAFB samples and textural quality at harvest and upon storage are shown in Figure S1b. DME was positively correlated with StoreM2, StoreA2, StoreE2, StoreCn, AFASBSp, and Na2CO3 fraction yield levels. There was no observed correlation between DM and DME data. BGALSSp, AFASSSp, and PMEBSp were all negatively correlated with all storage textural parameters (StoreM1, StoreM2, StoreA2, StoreE2, and StoreCn). Na2CO3 yield was positively correlated with StoreM2, StoreE2, and StoreCn.
Correlation data for biochemical properties of the harvest samples and textural quality at harvest and upon storage are shown in Figure S1c. DME was positively correlated with DM. DME was positively correlated with StoreM2, StoreA2, StoreE2, and StoreCn. DME was negatively correlated with water fraction yield. Water fraction yield was negatively correlated with textural quality after storage (StoreM2, StoreA2, StoreE2, and StoreCn). BGALBSp was negatively correlated with StoreM1, StoreA2, and StoreCn but positively correlated with water fraction yield. AFASBSp was positively correlated with AFASSSp but negatively correlated with StoreM1. PMESSp was positively correlated with StoreM1. IEC0 was positively correlated with DME and textural properties upon storage (StoreM2, StoreE2, and StoreCn), which may be due to the high variability seen in the IEC values in HC samples as HC does retain good textural properties upon storage.
Correlation data for biochemical properties of the 20-week storage samples and textural quality are shown in Figure S1d. DME was positively correlated with DM, StoreM2, StoreE2, StoreA2, StoreCn, and Na2CO3 fraction yield. DME was negatively correlated with BGALBSp, water fraction yield, and CDTA fraction yield. DM was negatively correlated with BGALBSp but positively correlated with StoreM2, StoreA2, StoreCn, and Na2CO3 fraction yield. BGALBSp was negatively correlated with StoreM1, StoreA2, and StoreCn. Water fraction yield was negatively correlated with StoreM2, StoreA2, StoreE2, and StoreCn. CDTA fraction yield was negatively correlated with StoreM2, StoreE2, and StoreCn. Na2CO3 fraction yield was positively correlated with StoreM2, StoreA2, StoreE2, and StoreCn.
Overall, at all developmental stages, DME was positively correlated with the textural storage parameters M2, A2, E2, and Cn but not M1, which corresponds to a texture parameter measured at a penetration depth (8.1 mm) commonly used by researchers assessing apple firmness. At 40 and 70 DAFB, PMESSp and PMEBSp activities, respectively, were negatively correlated with storage texture (M2, A2, E2, and Cn). At harvest and 20-week storage, PMESSp was positively correlated with StoreM1. These results seem to indicate that DME and PME activities at early developmental stages may be predictive of textural quality upon storage. Additionally, at the 70 DAFB developmental stage, BGALSSp and AFASSSp activities were negatively correlated with storage textural quality, while these strong correlations were not observed in the harvest and 20-week storage samples. These results also seem to indicate that BGAL and AFAS activities at early developmental stages may be important factors affecting textural quality upon storage. Nevertheless, it should be cautioned that this work was performed on only five cultivars with similar ethylene production levels. Although early cellular events are thought to be less dependent on ethylene [3], to ensure these correlations are sustained, more cultivars should be tested to cover a wide range of genetic variability and ethylene production levels.
Table 6 presents the composition of the cell wall material and fractions of apple cultivars at the different developmental stages. Correlation plots (Supplementary Figure S2a–d) were used to summarize the large dataset of biochemical properties of the apple cultivars in terms of enzyme activities, sugars composing the cell wall material and fractions of the different developmental stages, and textural quality at harvest (M1, M2, A2, E2, and Cn) and upon storage (SM1, SM2, SA2, SE2, and SCn). Significant correlations (p ≤ 0.05) are discussed. At 40 DAFB, higher levels of galactose and glucose measured in the water-soluble pectin were correlated with better textural quality upon storage (SM1, SM2, SA2, SE2, and SCn), which may be attributed to the substantially different levels of galactose and glucose measured in HC (11.24 and 16.83%, respectively) compared to Amb (9.53 and 7.55%, respectively). For the Na2CO3 fraction, rhamnose content was positively correlated with SM2, SA2, SE2, and SCn, while fucose content was negatively correlated with these parameters (Figure S2a).
Table 6.
Composition of Cell Wall Material and Fractions of Apple Cultivars at Different Developmental Stages.
At 70 DAFB (Figure S2b), for the water fraction, arabinose and galactose levels were negatively correlated with SM1, SM2, SA2, and SCn. Higher levels of arabinose and galactose in water-soluble pectin were associated with poorer textural quality after storage, which was likely due to higher levels of these sugars in Amb samples (13.13 and 15.79%, respectively) and lower levels in HC samples (7.23 and 8.46%, respectively). Ng et al. (2013, 2015) [4,5] indicated that higher levels of galactose and arabinose were present at early developmental-stage cell wall material/AIR of the apple cultivar (Scifresh) with better textural quality after storage at the early developmental stage. The results seem to point to the importance of cell wall fractions and the dynamic nature of cell wall assembly at early developmental stages. In the CDTA fraction from the 70 DAFB samples, xylose and glucose levels were negatively correlated with SM1, SM2, SA2, SE2, and SCn, while in the Na2CO3 fraction from the 70 DAFB samples, rhamnose, arabinose, and mannose levels were negatively correlated with SM2, SE2, SA2, and SCn.
Higher levels of uronic acid in the water-soluble fraction in the harvest samples were negatively correlated with SM2, SA2, SE2, and SCn, which may be due to high levels of uronic acid measured in Amb (40.48%) and low levels measured in HC (27.10%). In the CDTA fraction from the harvest samples, high levels of xylose were negatively correlated with SM1, SM2, SA2, SE2, and SCn (Figure S2c).
At 20-week storage (Figure S2d), the AIR fraction showed that uronic acid was negatively correlated with SM1, SM2, SA2, and SCn. For the water-soluble fraction from the 20-week storage samples, fucose, xylose, galactose, and arabinose levels were positively correlated with SM1, SM2, SA2, SE2, and SCn, while uronic acid content was negatively correlated with SM2, SA2, and SCn. Liu et al. [2] showed changes in cell wall composition and noted that cultivars with rapid texture loss showed lower levels of galacturonic acid. The water fraction from the HC samples after 20 weeks of storage contained two times the level of arabinose and galactose compared to the corresponding Amb samples. For the CDTA fraction obtained from the samples stored for 20 weeks, xylose content was positively correlated with SM2, SA2, SE2, and SCn, while uronic acid was negatively correlated with SA2, SE2, and SCn.
4. Conclusions
This work has shown that the use of a single measurement penetrometer test to determine firmness in apples may not be an ideal measurement for assessing apple textural quality. This work has shown that for five apple cultivars (Gala, Aur, Spl, Amb, and HC) collected from the 2016 growing season at 40 and 70 DAFB, PMESSp and PMEBSp activities, respectively, were negatively correlated with storage texture; yet, at harvest and 20-week storage, PMESSp was positively correlated with StoreM1, which indicates that PME activity at early developmental stages may impact textural quality after storage. Further, at the 70 DAFB developmental stage, BGALSSp and AFASSSp activities were negatively correlated with storage textural quality, while these strong correlations were not observed in the harvest and 20-week storage samples. These results also indicate that BGAL and AFAS activities at early developmental stages may be important factors affecting textural quality upon storage. Additionally, DME assessed with FTIR for cell wall material at early developmental stages was strongly positively correlated with textural quality after storage. FTIR could serve as a rapid screening tool for textural quality at early developmental stages on minimally processed starting material. Overall, this work has shown that the biochemical properties at the early developmental stages of apples may be important factors affecting textural quality after storage.
Supplementary Materials
The following supporting information can be downloaded at: https://www.mdpi.com/article/10.3390/horticulturae10040379/s1.
Author Contributions
Conceptualization, K.R.; methodology, K.R., N.D., L.F., A.L. and K.Z.-T.; formal analysis, K.R.; investigation, K.R., N.D., L.F., A.L. and K.Z.-T.; resources, K.R.; data curation, K.R., N.D., L.F., A.L. and K.Z.-T.; writing—original draft preparation, K.R.; writing—review and editing, K.R., N.D. and L.F.; supervision, K.R.; project administration, K.R.; funding acquisition, K.R. All authors have read and agreed to the published version of the manuscript.
Funding
We gratefully acknowledge funding support from Agriculture and Agri-Food Canada’s AgriInnovation Program and British Columbia Fruit Growers’ Association.
Data Availability Statement
The data presented in this study are available upon request from the corresponding author. The data are not publicly available.
Acknowledgments
We are thankful for the technical contributions of Levi Goddard in this work.
Conflicts of Interest
The authors declare no conflicts of interest.
References
- Teh, S.L.; Brutcher, L.; Schonberg, B.; Evans, K. Eleven-year correlation of physical fruit texture traits between computerized penetrometers and sensory assessment in an apple breeding program. HortTechnology 2020, 30, 719–724. [Google Scholar] [CrossRef]
- Liu, H.; Lin, S.; Zhang, M.; Lv, Y.; Ma, Y.; Rao, J.; Zhu, Q. Changes in Cell Wall Sugar Neutral Composition Contribute to Apple Texture Loss during Storage among Cultivars. Horticulturae 2023, 9, 292. [Google Scholar] [CrossRef]
- Segonne, S.M.; Bruneau, M.; Celton, J.M.; Le Gall, S.; Francin-Allami, M.; Juchauc, M.; Laurens, F.; Orsel, M.; Renou, J.-P. Multiscale investigation of mealiness in apple: An atypical role for a pectin methylesterase during fruit maturation. BMC Plant Biol. 2014, 14, 375. [Google Scholar] [CrossRef] [PubMed]
- Ng, J.K.T.; Schroder, R.; Sutherland, S.; Hallett, I.; Hall, M.; Prakash, R.; Smith, B.; Melton, L.; Johnston, J. Cell wall structures leading to cultivar differences in softening rates develop early during apple (Malus × domestica) fruit growth. BMC Plant Biol. 2013, 13, 183–199. [Google Scholar] [CrossRef] [PubMed]
- Ng, J.K.; Schröder, R.; Brummell, D.A.; Sutherland, P.W.; Hallett, I.C.; Smith, B.G.; Melton, L.D.; Johnston, J.W. Lower cell wall pectin solubilisation and galactose loss during early fruit development in apple (Malus × domestica) cultivar ‘Scifresh’ are associated with slower softening rate. J. Plant Physiol. 2015, 176, 129–137. [Google Scholar] [CrossRef]
- Dheilly, E.; Le Gall, S.; Guillou, M.-C.; Renou, J.-P.; Bonnin, E.; Orsel, M. Cell wall dynamics during apple development and storage involves hemicellulose modifications and related expressed genes. BMC Plant Biol. 2016, 16, 201. [Google Scholar] [CrossRef]
- Gwanpua, S.G.; Van Buggenhout, S.; Verlinden, B.E.; Christiaens, S.; Shpigelman, A.; Vicent, V.; Jamsazzadeh Kermani, Z.; Nicolai, B.M.; Hendrickx, M. Pectin modifications and the role of pectin degrading enzymes during postharvest softening of Jonagold apples. Food Chem. 2014, 158, 282–291. [Google Scholar] [CrossRef] [PubMed]
- Gwanpua, S.G.; Mellidou, I.; Boechx, J.; Kyomugasho, C.; Bessemans, N.; Verlinden, B.E.; Hertog, M.L.A.T.M.; Hendrickx, M.; Nicolai, B.M.; Geeraerd, A.H. Expression analysis of candidate cell wall-related genes associated with changes in pectin biochemistry during postharvest apple softening. Postharvest Biol. Technol. 2016, 112, 176–185. [Google Scholar] [CrossRef]
- Gwuanpua, S.G.; Verlinden, B.E.; Hertog, M.L.A.T.M.; Nicolai, B.M.; Hendrickx, M.; Geeraerd, A. Slow softening of Kanzi apples (Malus × domesitca L.) is associated with preservation of pectin integrity in middle lamella. Food Chem. 2016, 211, 883–891. [Google Scholar] [CrossRef]
- Gwanpua, S.G.; Mellidou, I.; Boeckx, J.; Kyomugasho, C.; Bessemans, N.; Verlinden, B.E.; Hertog, M.L.A.T.M.; Hendrickx, M.; Nicolai, B.M.; Geeraerd, A. A transcriptomics-based kinetic model for enzyme-induced pectin degradation in apple (Malus × domeistica) fruit. Postharvest Biol. Technol. 2017, 130, 64–74. [Google Scholar] [CrossRef]
- Evans, K.; Brutcher, L.; Konishi, B.; Barritt, B. Correlation of sensory analysis with physical textural data from a computerized penetrometer in the Washington State University apple breeding program. HortTechnology 2010, 20, 1026–1029. [Google Scholar] [CrossRef]
- Mohr, B.C.; Mohr, C.L. MOHR DIGI-TEST Computer-Controlled Fruit Quality Testing System: Manual for Software Version 1.25. 2007. Available online: http://www.mohr-engineering.com/download.php?download_file=MDT-1%20Operators%20Manual (accessed on 5 July 2016).
- Mohr and Associates (Mohr Test and Measurement LLC., Richland, WA, USA). Discussion on crispness (Cn) measurement. Crispness (Cn) measurement; Mohr Test and Measurement LLC. Personal communication. 2018. [Google Scholar]
- Su, Q.; Li, X.; Wang, L.; Wang, B.; Feng, Y.; Yang, H.; Zhao, Z. Variation in cell wall metabolism and flesh firmness of four apple cultivars during fruit development. Foods 2022, 11, 3518. [Google Scholar] [CrossRef] [PubMed]
- Wang, D.; Yeats, T.H.; Uluisik, S.; Rose, J.K.C.; Seymour, G.B. Fruit softening: Revisiting the role of pectin. Trends Plant Sci. 2018, 23, 302–310. [Google Scholar] [CrossRef] [PubMed]
- Shin, Y.; Chane, A.; Jung, M.; Lee, Y. Recent advances in understanding the roles of pectin as an active participant in plant signaling networks. Plants 2021, 10, 1712. [Google Scholar] [CrossRef] [PubMed]
- Wu, Y.; Cui, S.W.; Wu, J.; Ai, L.; Wang, Q.; Tang, J. Structure characteristics and rheological properties of acidic polysaccharide from boat-fruited sterculia seeds. Carbohydr. Polym. 2012, 88, 926–930. [Google Scholar] [CrossRef]
- Fischer, M.; Amado, R. Changes in the pectic substances of apples during development and postharvest ripening. Part 1: Analysis of the alcohol-insoluble residue. Carbohydr. Polym. 1994, 25, 161–166. [Google Scholar] [CrossRef]
- Renard, C.; Ginies, C. Comparison of the cell wall composition for flesh and skin from five different plums. Food Chem. 2009, 114, 1042–1049. [Google Scholar] [CrossRef]
- Brummell, D.A.; Harpster, M.H. Cell wall metabolism in fruit softening and quality and its manipulation in transgenic plants. Plant Mol. Biol. 2001, 47, 311–339. [Google Scholar] [CrossRef] [PubMed]
- Oraguzie, N.C.; Volz, R.K.; Whitworth, C.J.; Bassett, H.C.M.; Hall, A.J.; Gardiner, S.E. Influence of Md-ACS1 allelotype and harvest season within an apple germplasm collection on fruit softening during cold air storage. Postharvest Biol. Technol. 2007, 44, 212–219. [Google Scholar] [CrossRef]
- Galvez-Lopez, D.; Laurens, F.; Quemener, B.; Lahaye, M. Variability of cell wall polysaccharides composition and hemicellulose enzymatic profile in an apple progeny. Int. J. Biol Macromol. 2011, 49, 1104–1109. [Google Scholar] [CrossRef]
- Smith, D.L.; Abbott, J.A.; Gross, K.C. Down-regulation of tomato beta-galactosidase 4 results in decreased fruit softening. Plant Physiol. 2002, 129, 1755–1762. [Google Scholar] [CrossRef] [PubMed]
- Canteri, M.H.G.; Renard, C.M.G.C.; Le Bourvellec, C.; Bureau, S. ATR-FTIR spectroscopy to determine cell wall composition: Application on a large diversity of fruits and vegetables. Carbohydr. Polym. 2019, 212, 186–196. [Google Scholar] [CrossRef] [PubMed]
- Manrique, G.D.; Lajolo, F.M. FT-IR spectroscopy as a tool for measuring degree of methyl esterification in pectins isolated from ripening papaya fruit. Postharvest Biol. Technol. 2002, 25, 99–107. [Google Scholar] [CrossRef]
- Kyomugasho, C.; Christiaens, S.; Shpigelman, A.; Van Loey, A.M.; Hendrickx, M.E. FT-IR spectroscopy, a reliable method for routine analysis of the degree of methylesterification of pectin in different fruit- and vegetable-based matrices. Food Chem. 2015, 176, 82–90. [Google Scholar] [CrossRef]
- Toivonen, P.M.A.; Hampson, C.R. Relationship of IAD index to internal quality attributes of apples treated with 1-methylcyclopropene and stored in air or controlled atmospheres. Postharvest Biol. Biotechnol. 2014, 91, 90–95. [Google Scholar] [CrossRef]
- Mohr, B.C. The Mohr Digi-Test (MDT) Computerized Agricultural Penetrometer as an Apple Maturity Tool; Mohr and Associates, Inc.: Richland, WA, USA, 2002. [Google Scholar]
- Mohr and Associates Inc. Apple Quality Testing in Five Market Centres Using the Mdt-1 Agricultural Penetrometer; Mohr and Associates, Inc.: Richland, WA, USA, 2002. [Google Scholar]
- Mohr Test and Measurement LLC. MOHR Digi-Test MDT-2 Operator Manual; Mohr Test and Measurement LLC.: Richland, WA, USA, 2012. [Google Scholar]
- Wrolstad, R.; Acree, T.; Decker, E.; Penner, M.; Reid, D.; Schwartz, S.; Shoemaker, C.; Smith, D.; Sporns, P. Handbook of Food Analytical Chemistry: Water, Proteins, Enzymes, Lipids, and Carbohydrates; John Wiley & Sons: Hoboken, NJ, USA, 2005. [Google Scholar]
- Ross, K.A.; Siow, Y.; Brown, D.; Isaak, C.; Fukumoto, L.; Godfrey, D.V. Characterization of water extractable crude polysaccharides from cherry, raspberry, and ginseng berry fruits: Chemical composition and bioactivity. Int. J. Food Prop. 2015, 18, 670–689. [Google Scholar] [CrossRef]
- Blakeney, A.B.; Harris, P.J.; Henry, R.J.; Stone, B.A. A simple and rapid preparation of alditol acetates for monosaccharide analysis. Carbohydr. Res. 1983, 113, 291–299. [Google Scholar] [CrossRef]
- Scott, R.W. Colorimetric determination of hexuronic acids in plant materials. Anal. Chem. 1979, 51, 936–941. [Google Scholar] [CrossRef]
- Fisher, M.; Arrigoni, E.; Amado, R. Changes in the pectic substances of apples during development and postharvest ripening. Part 2. Analysis of pectic fractions. Carbohydr. Polym. 1994, 25, 167–175. [Google Scholar] [CrossRef]
- Liu, X.; Renard, C.M.; Bureau, S.; Le Bourvellec, C. Revisiting the contribution of ATR-FTIR spectroscopy to characterize plant cell wall polysaccharides. Carbohydr. Polym. 2021, 262, 117935. [Google Scholar] [CrossRef]
- Baum, A.; Dominiak, M.; Vidal-Melgosa, S.; Willats, W.G.T.; Sondergaard, K.M.; Hansen, P.W.; Meyer, A.S.; Mikkelsen, J.D. Prediction of pectin yield and quality by FTIR and carbohydrate microarray analysis. Food Bioprocess Technol. 2017, 10, 143–154. [Google Scholar] [CrossRef]
- Satriyo, P.; Munawar, A.A. Data analysis on near infrared spectroscopy as a part of technology adoption for cocoa farmer in Aceh Province, Indonesia. Data Brief 2020, 29, 105251. [Google Scholar] [CrossRef]
- Sundari, S.K.; Adholeya, A. Retention of enzyme activity following freeze-drying the mycelium of ectomycorrhizal isolates. World J. Microbiol. Biotechnol. 2000, 16, 865–868. [Google Scholar] [CrossRef]
- Grsic-Rausch, S.; Rausch, T. A coupled spectrophotometric enzyme assay for the determination of pectin methylesterase. activity and its inhibition by proteinaceous inhibitors. Anal. Biochem. 2004, 333, 14–18. [Google Scholar] [CrossRef] [PubMed]
- Mueller, K.; Bartels, S.; Kermode, A.R. Pectin methylesterase activity assay for plant material. Bio-Protocol 2013, 3, e894. [Google Scholar] [CrossRef]
- Chang, H.Y.; Tong, C.B.S. Identification of candidate genes involved in fruit ripening and crispness retention through transcriptome analyses of a ‘Honeycrisp’ population. Plants 2020, 9, 1335. [Google Scholar] [CrossRef] [PubMed]
- Barritt, B.H. Apple Tree Named ‘WA 5’. U.S. Patent US PP24,054 P3, 3 December 2013. [Google Scholar]
- Ontario Ministry of Agriculture Food and Rural Affairs. Commercial Production of Ambrosia™ Apples in Ontario. 2009. Available online: https://www.ontario.ca/page/commercial-production-ambrosiatm-apples-ontario (accessed on 7 August 2023).
Disclaimer/Publisher’s Note: The statements, opinions and data contained in all publications are solely those of the individual author(s) and contributor(s) and not of MDPI and/or the editor(s). MDPI and/or the editor(s) disclaim responsibility for any injury to people or property resulting from any ideas, methods, instructions or products referred to in the content. |
© 2024 by the authors. Licensee MDPI, Basel, Switzerland. This article is an open access article distributed under the terms and conditions of the Creative Commons Attribution (CC BY) license (https://creativecommons.org/licenses/by/4.0/).