

Xylem Hydraulic Conductance Role in Kiwifruit Decline Syndrome Occurrence
 , ,
, ,  , and
, and 
Abstract
1. Introduction
2. Materials and Methods
2.1. Trial Set Up
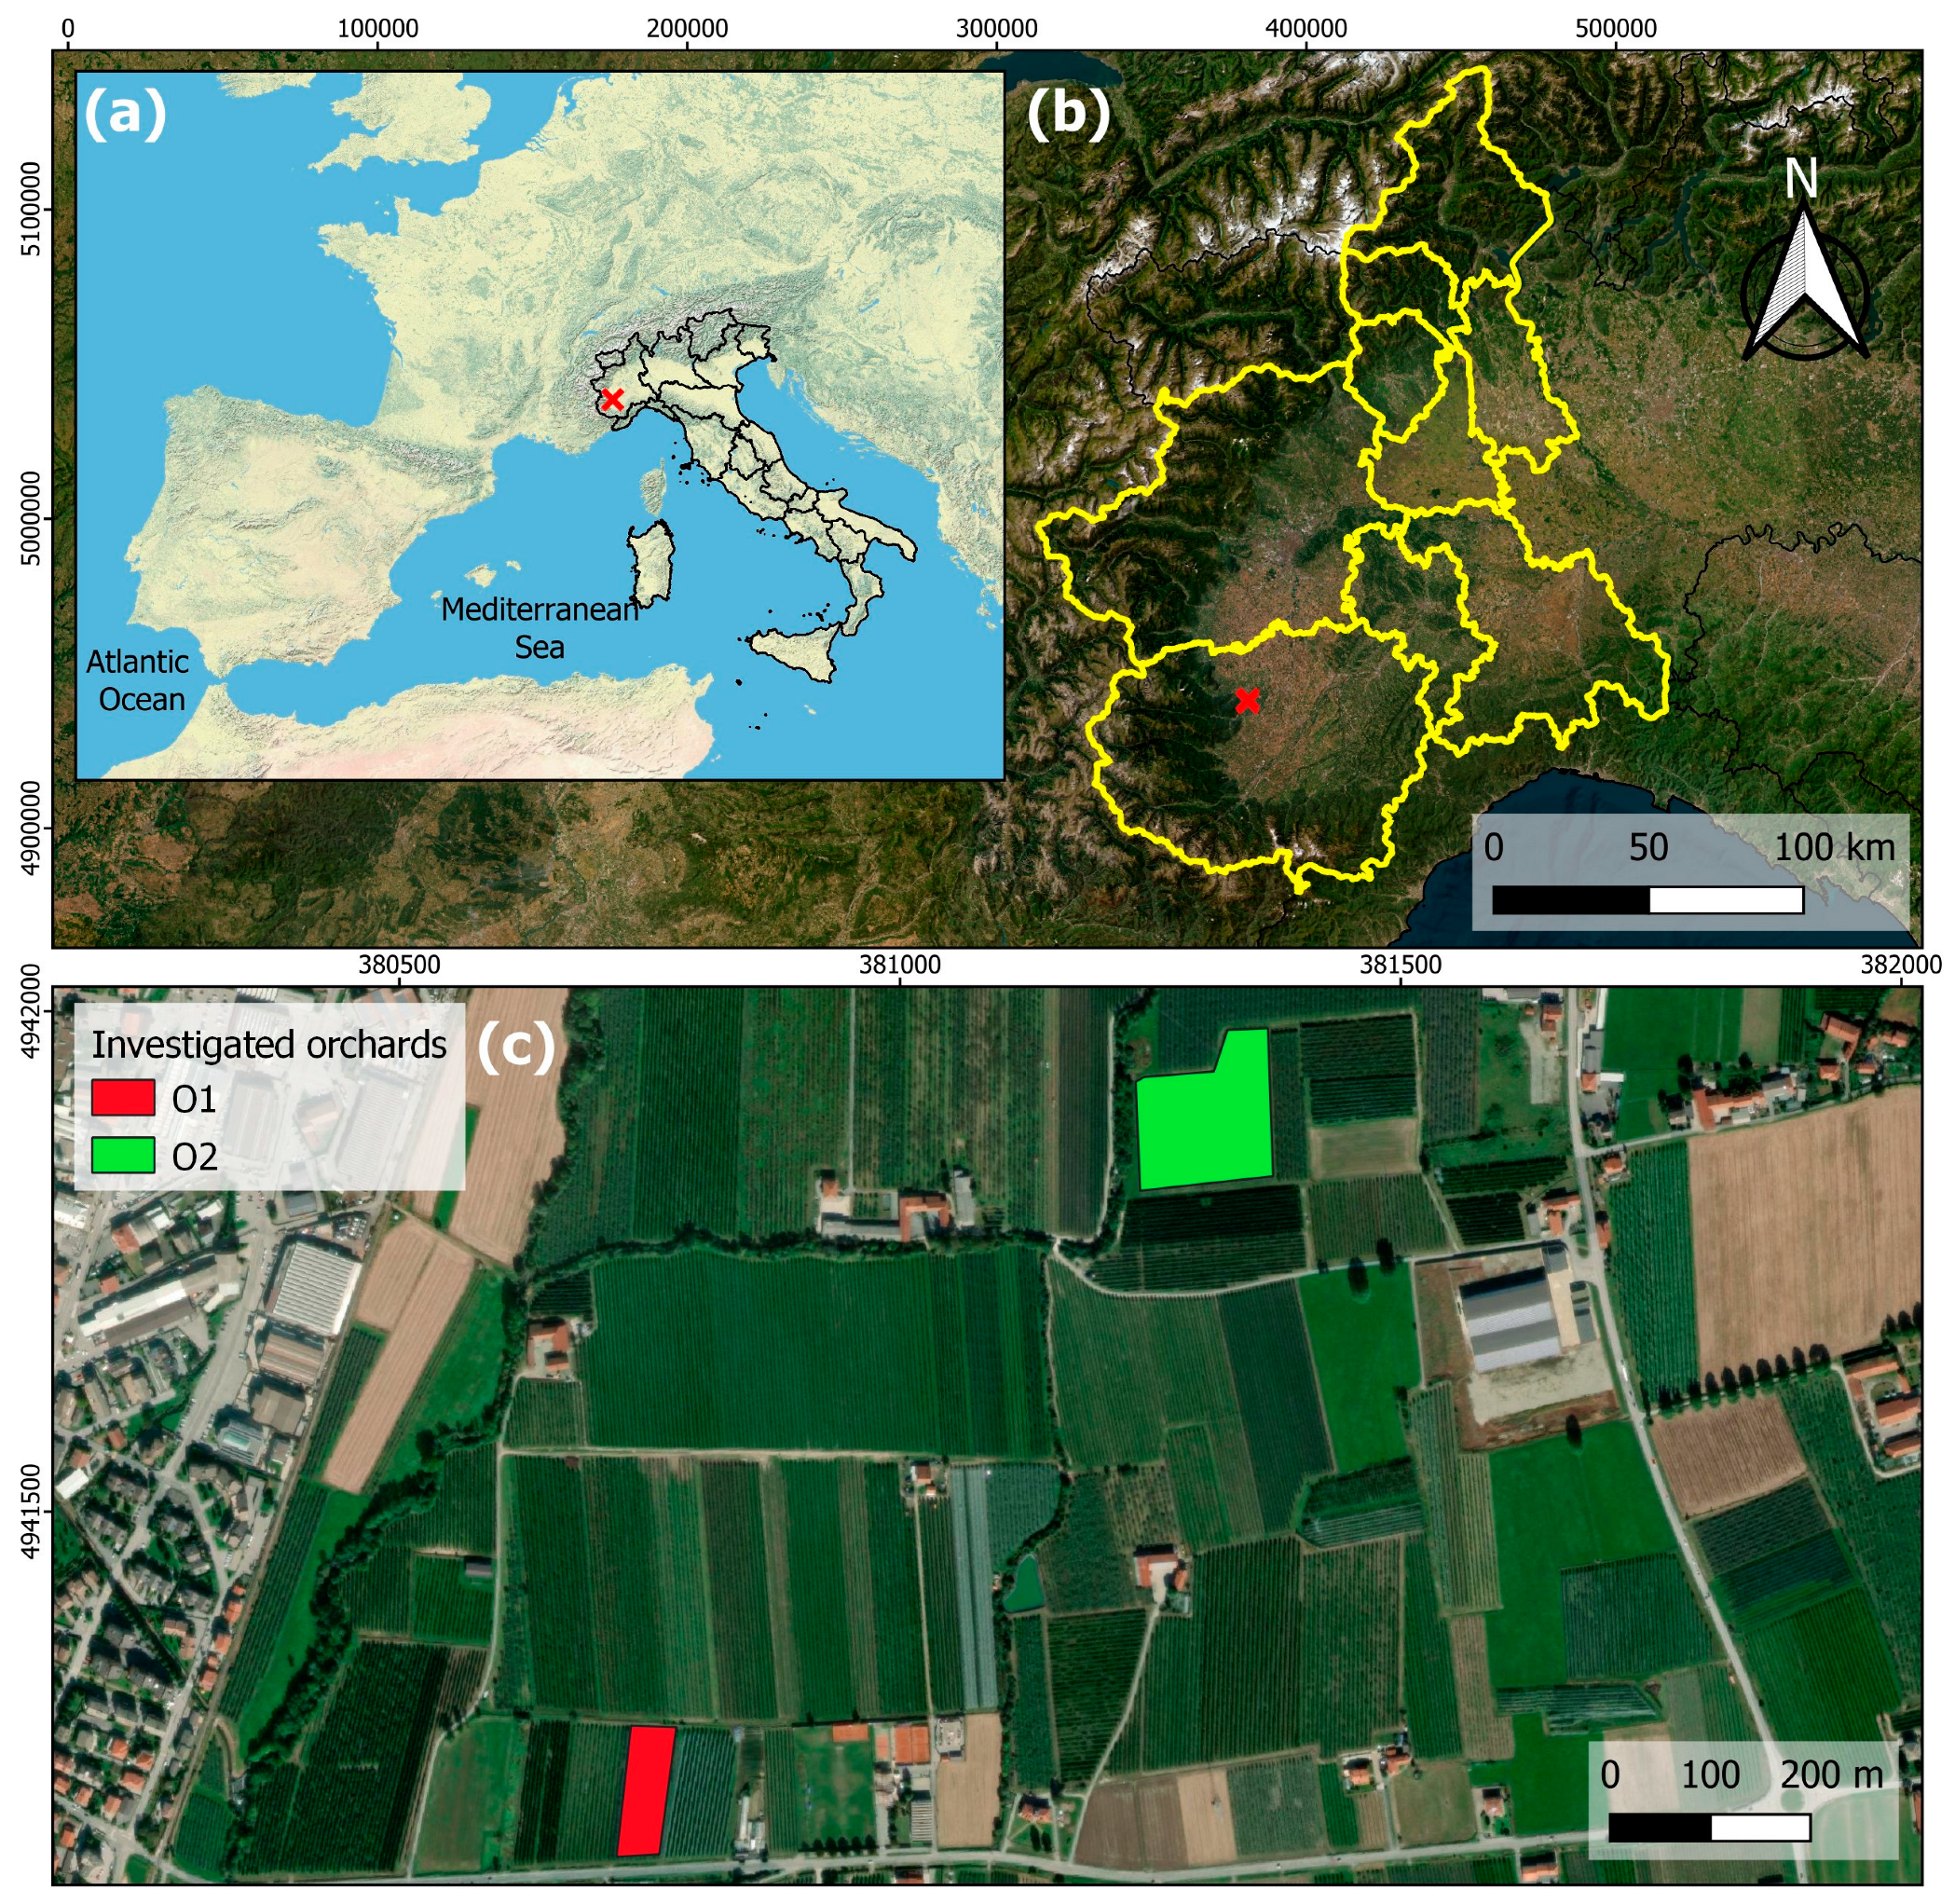
2.2. Field Site Description and Management
2.3. Environmental Measures
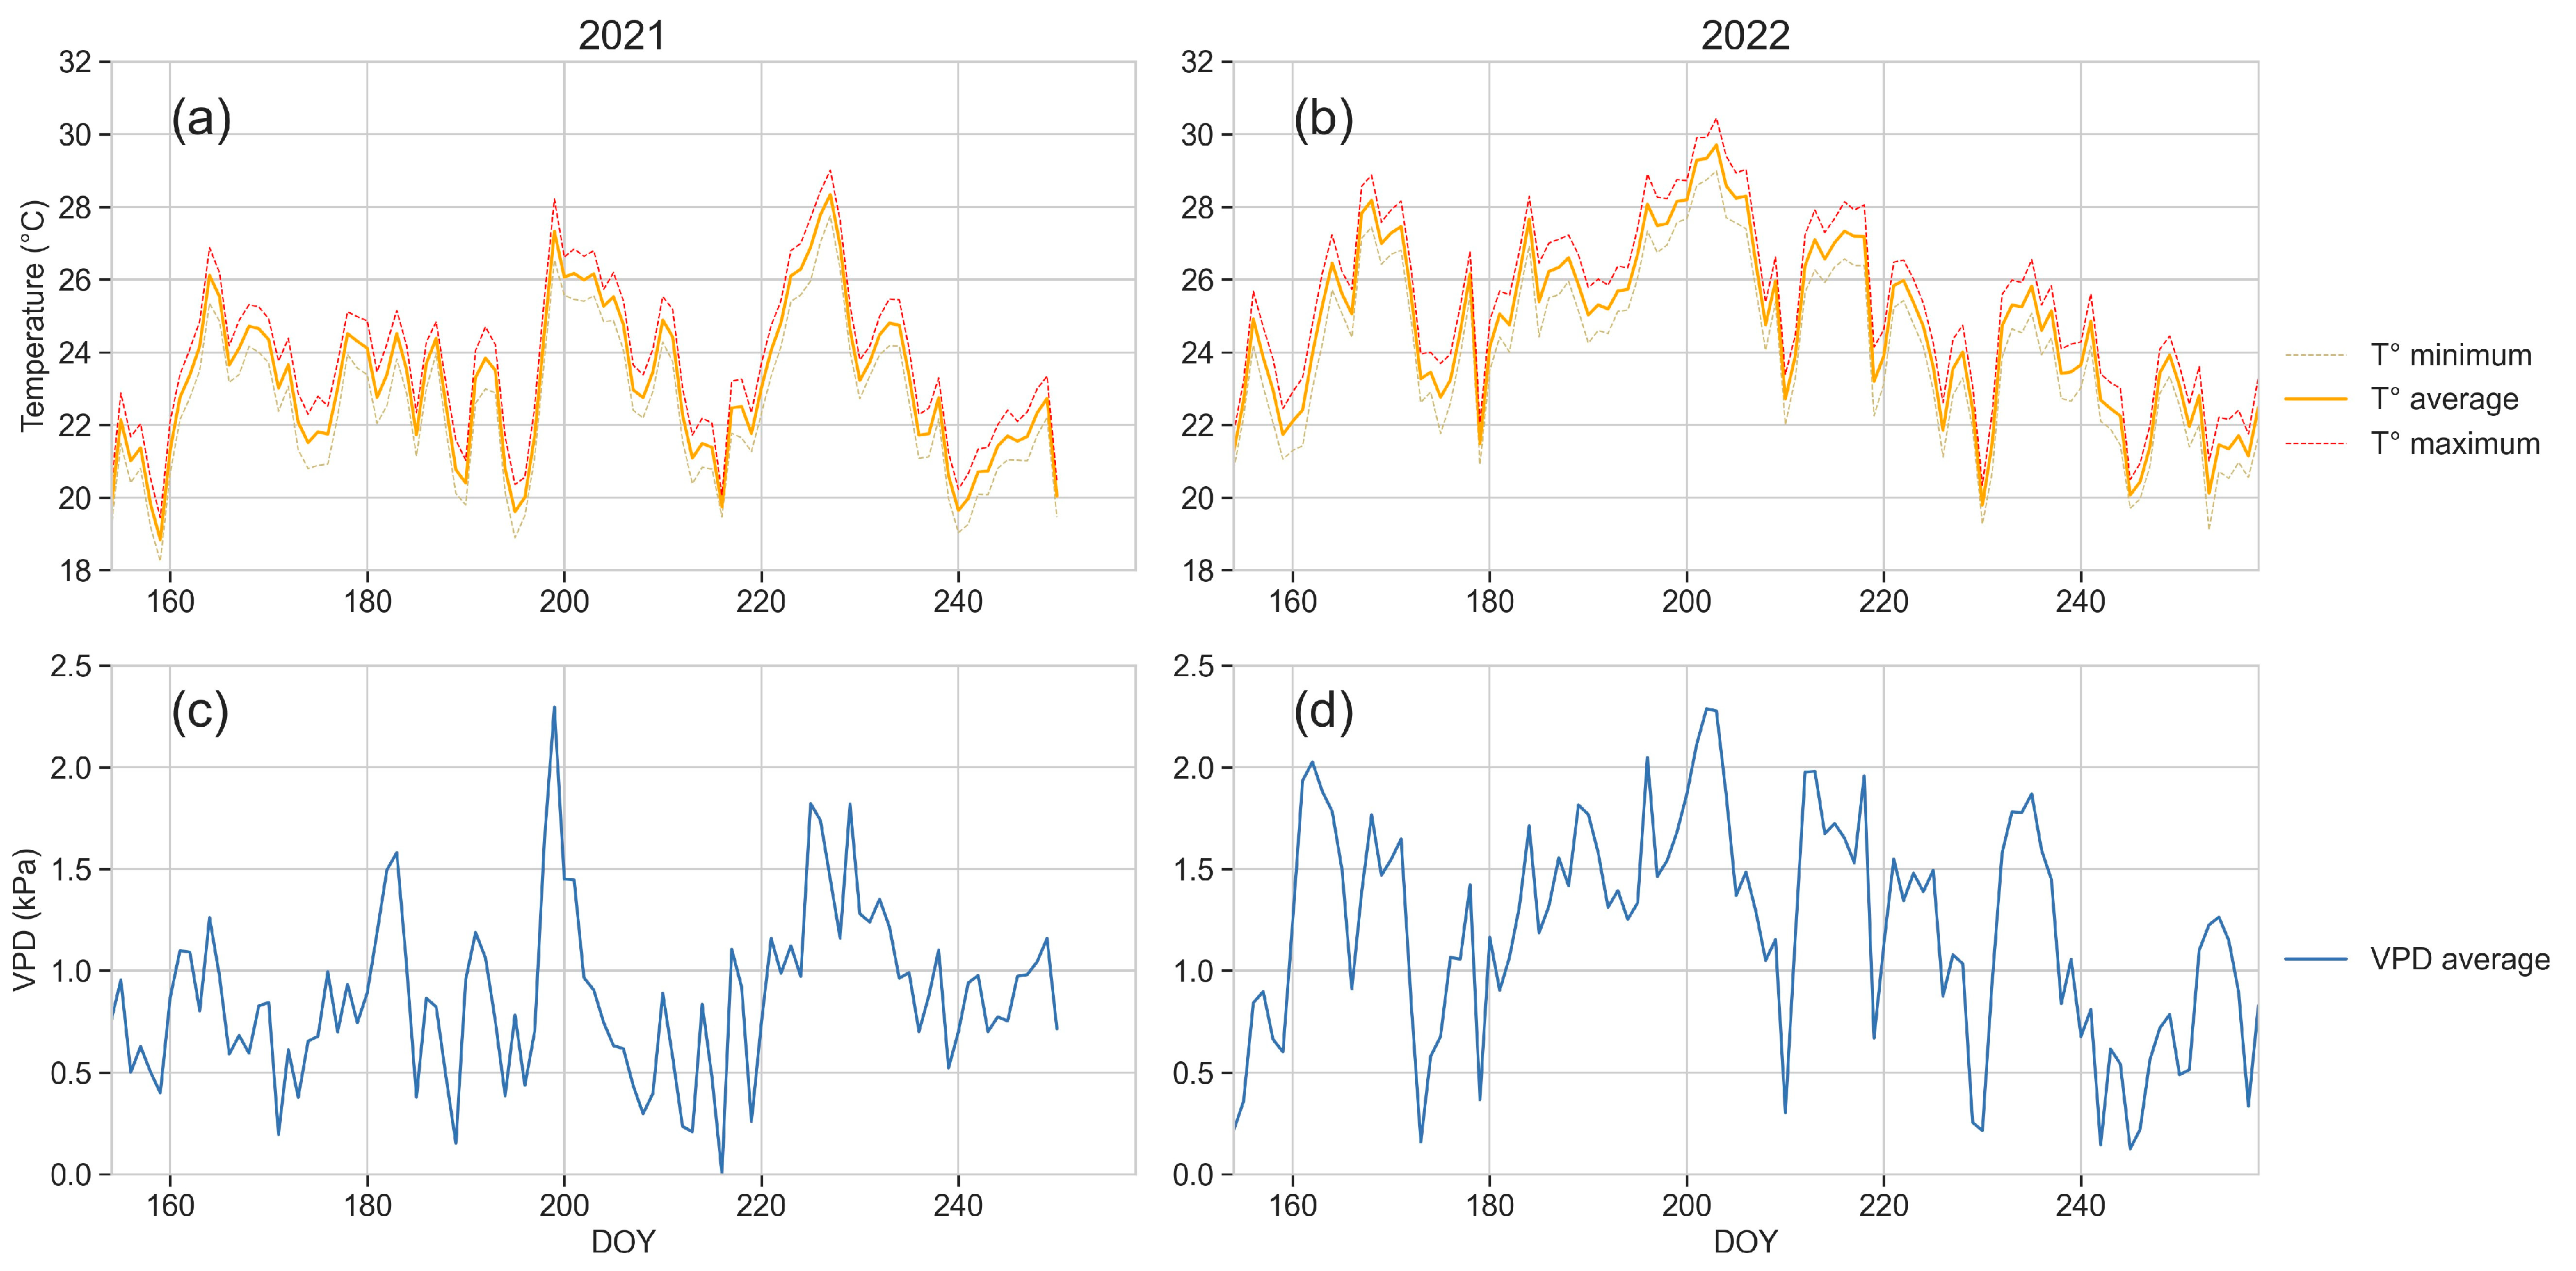
2.3.1. Weather Data
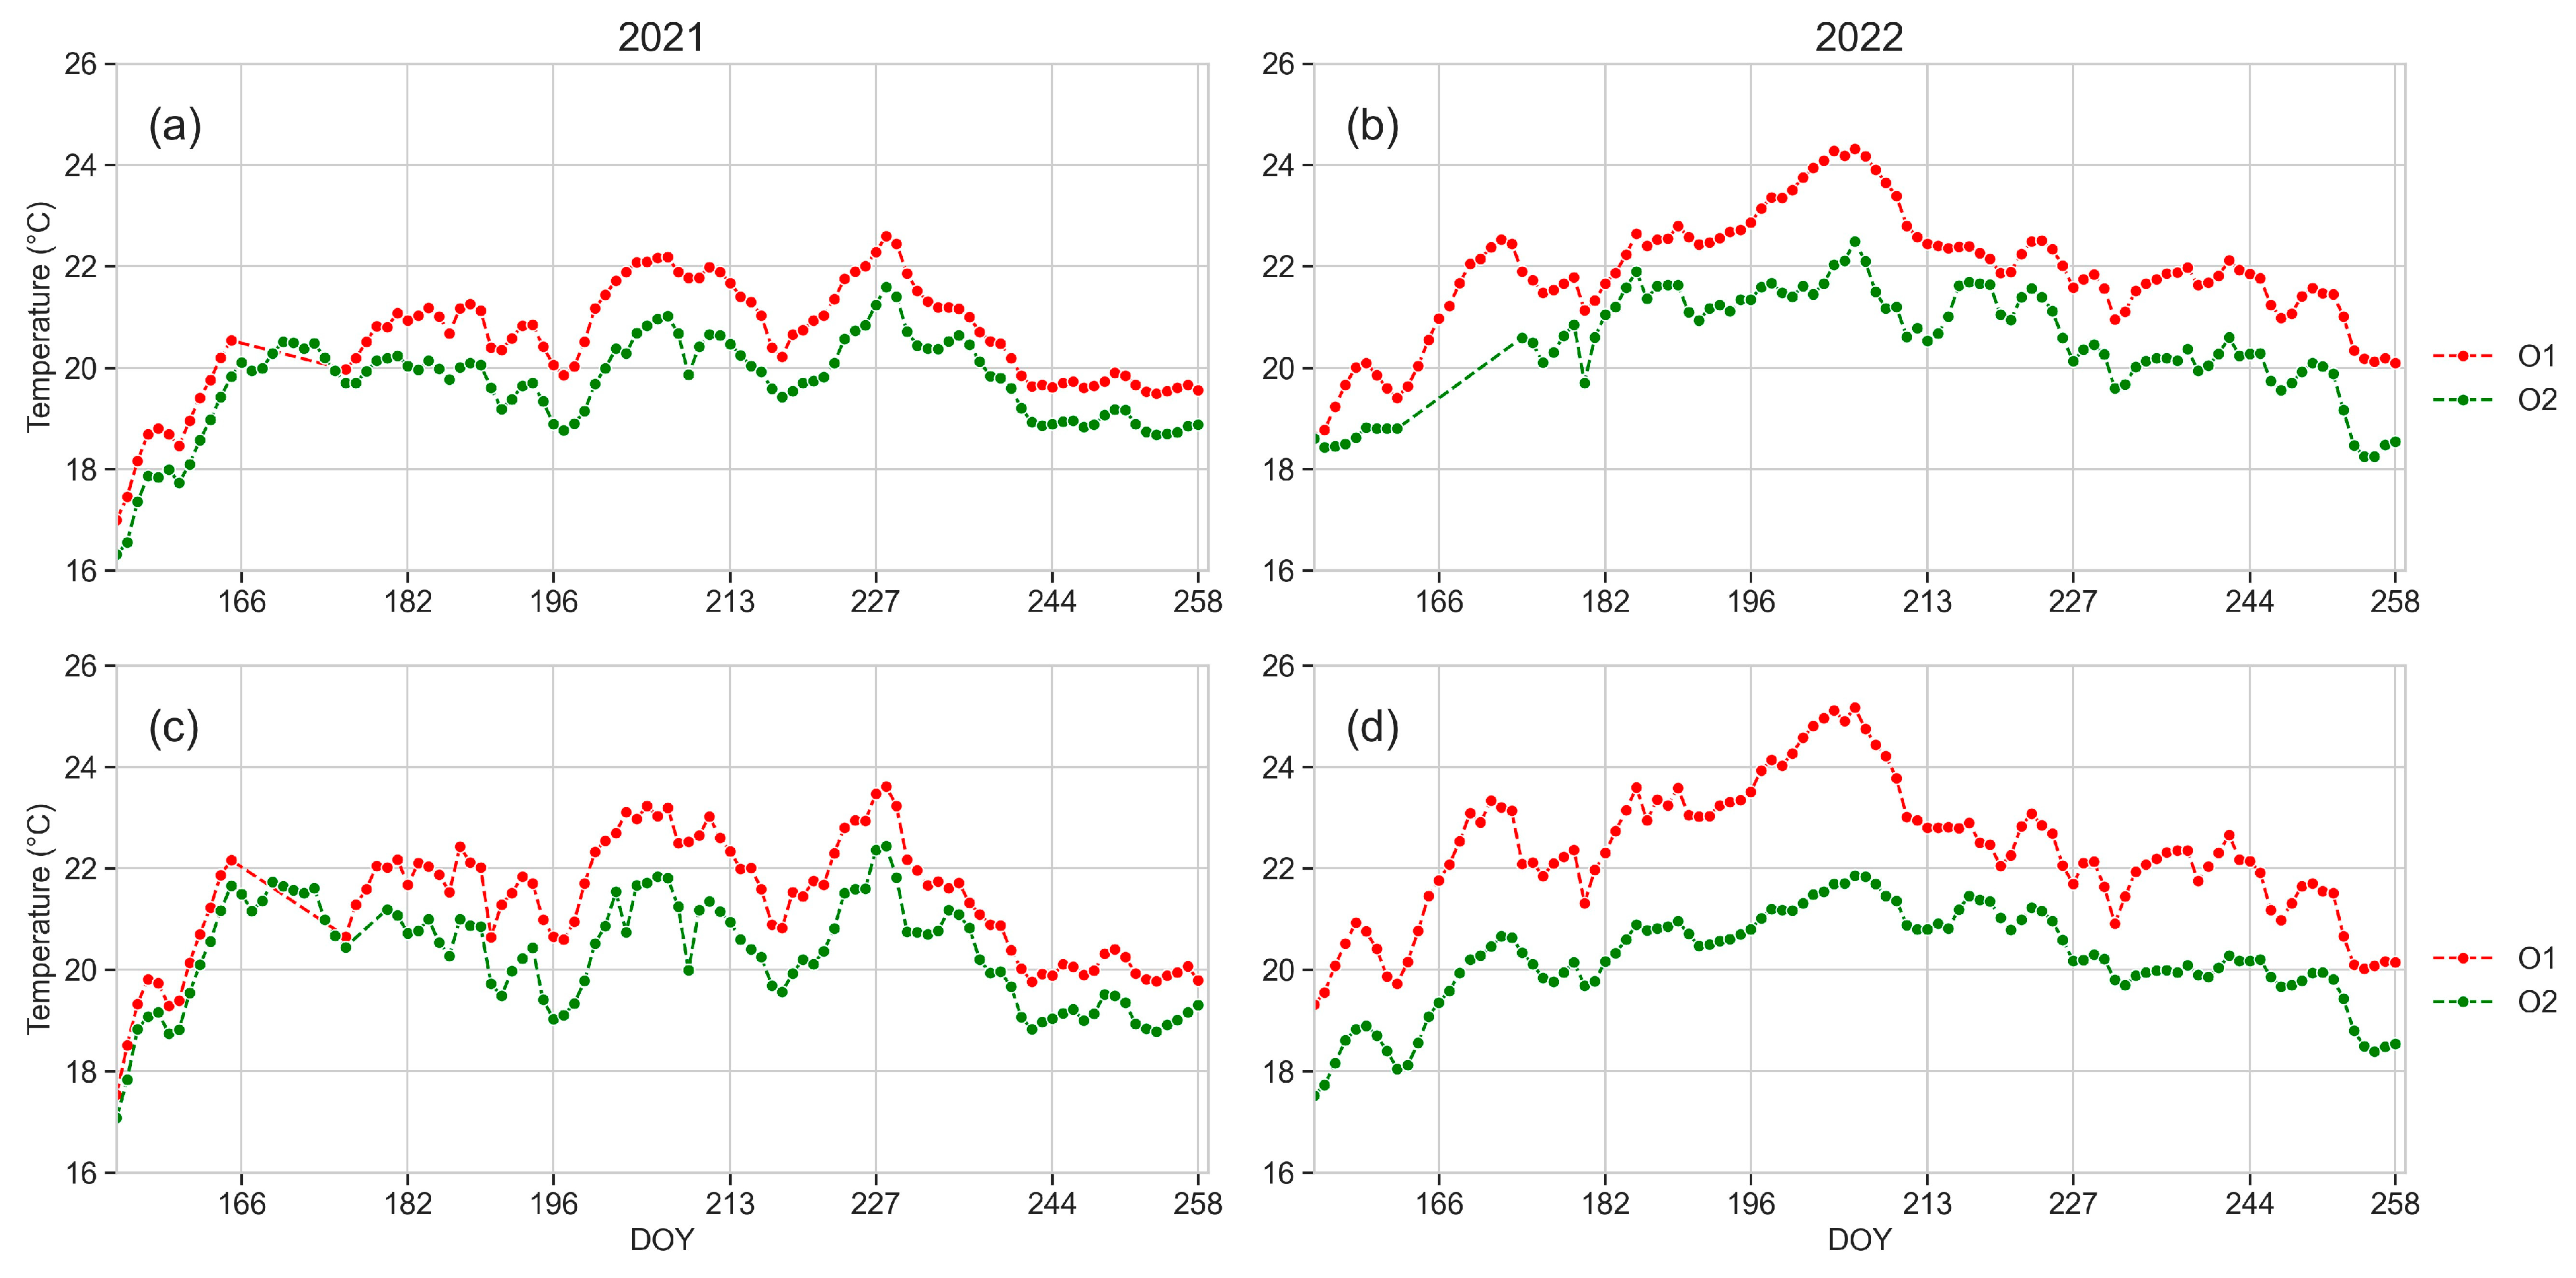
2.3.2. Soil Temperature
2.4. Physiological and Biometric Measures
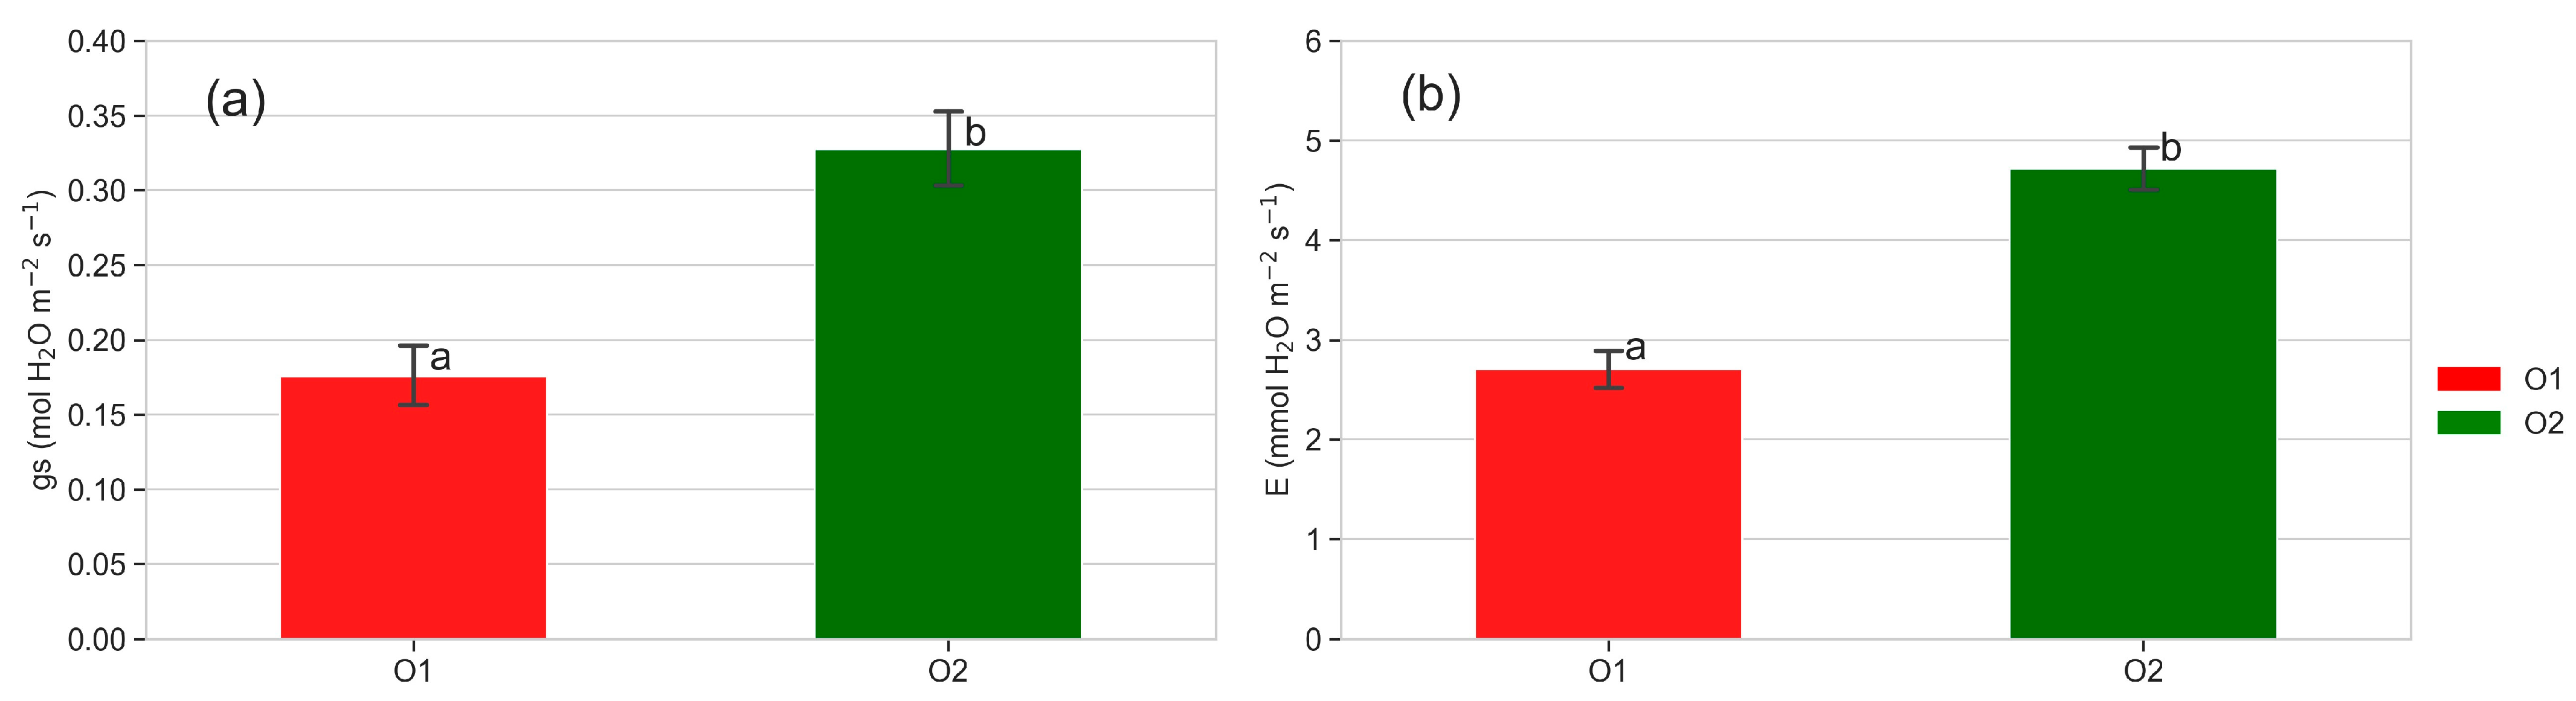
2.4.1. Leaf Gas Exchanges
2.4.2. Stem Water Potential
2.4.3. Leaf Temperature
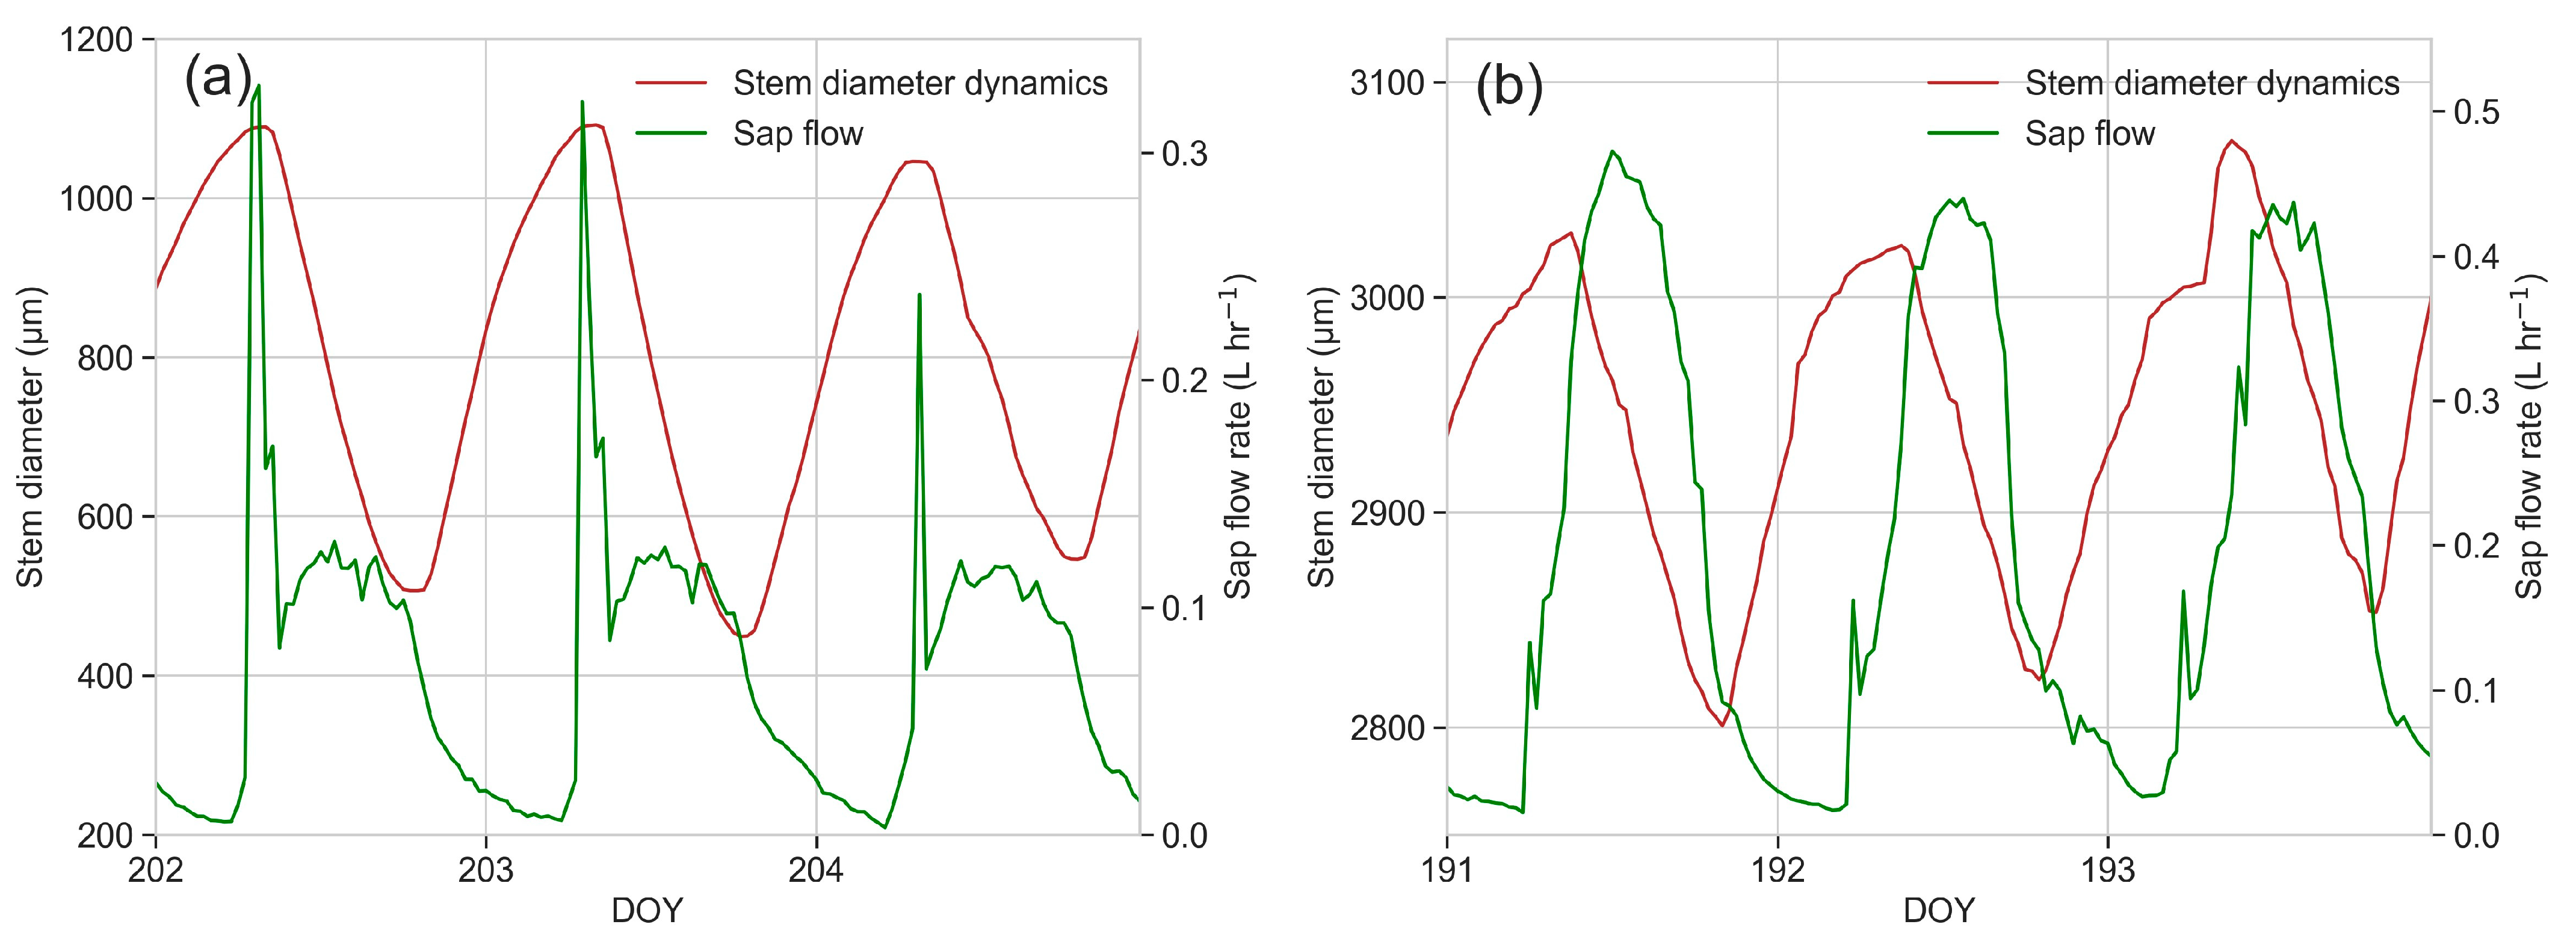
2.4.4. Sap Flow
2.4.5. Dendrometric Measurements
2.5. Anatomical Analyses of Roots
2.5.1. Slice Preparation for Light Microscopy
2.5.2. Image Analysis and Scripting and Xylem Vessel Measurements
2.5.3. Xylem Vessel Vulnerability to Cavitation Index (VI)
2.6. Statistical Analysis
3. Results
3.1. Weather Data
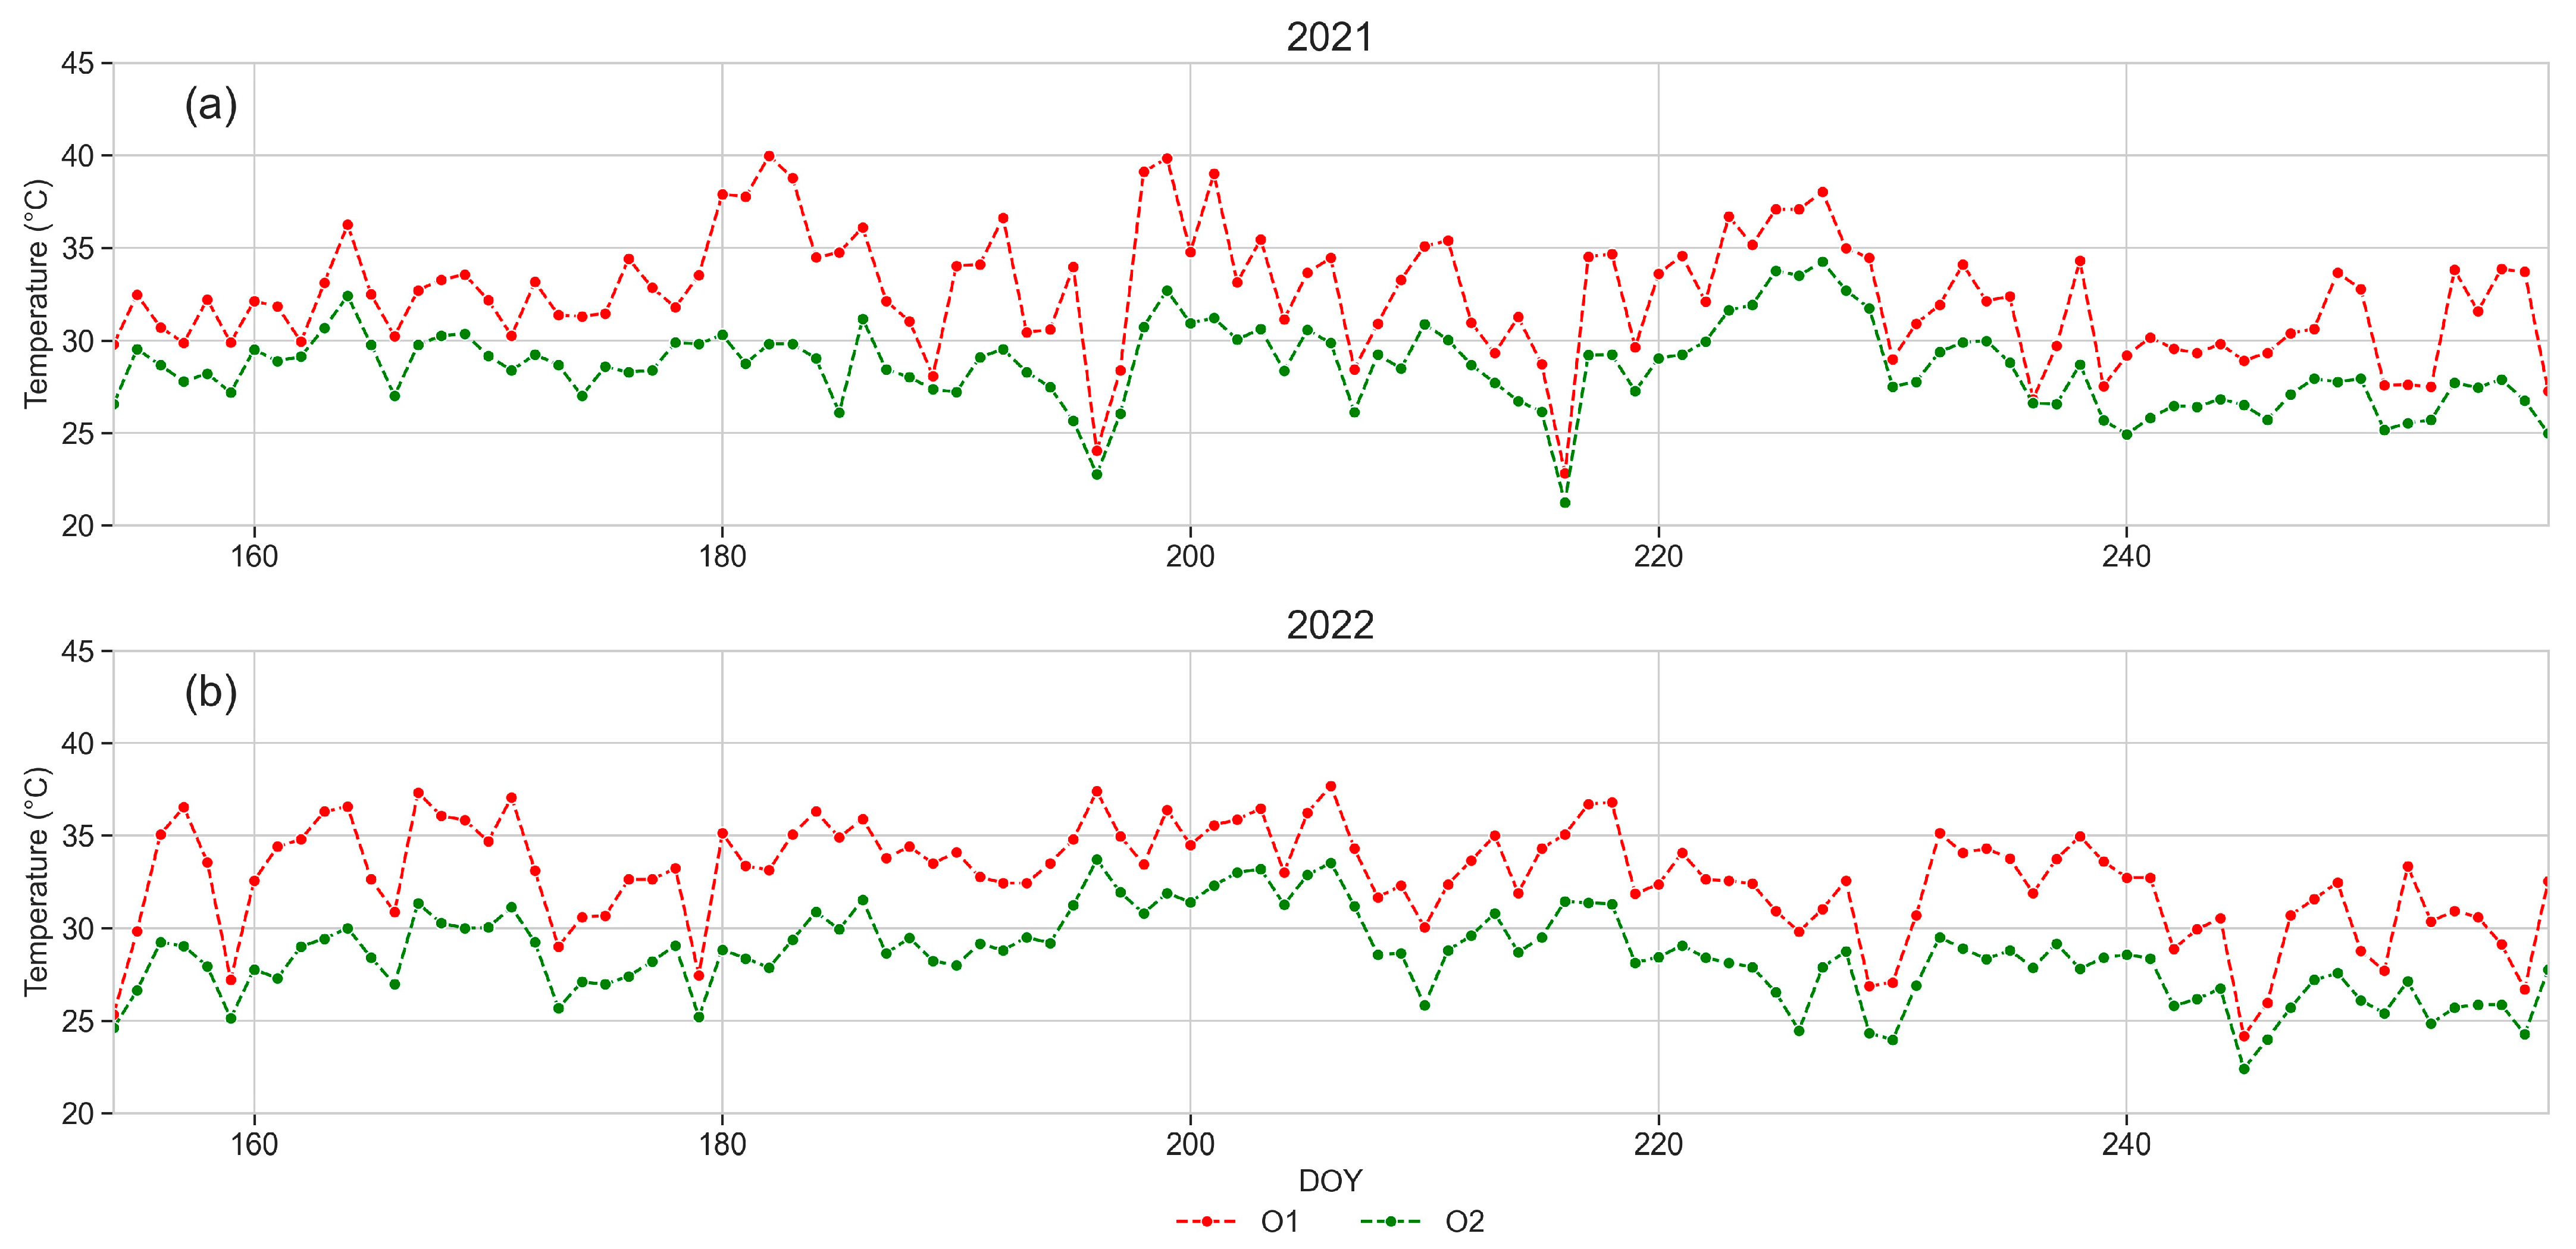
3.2. Soil Temperature
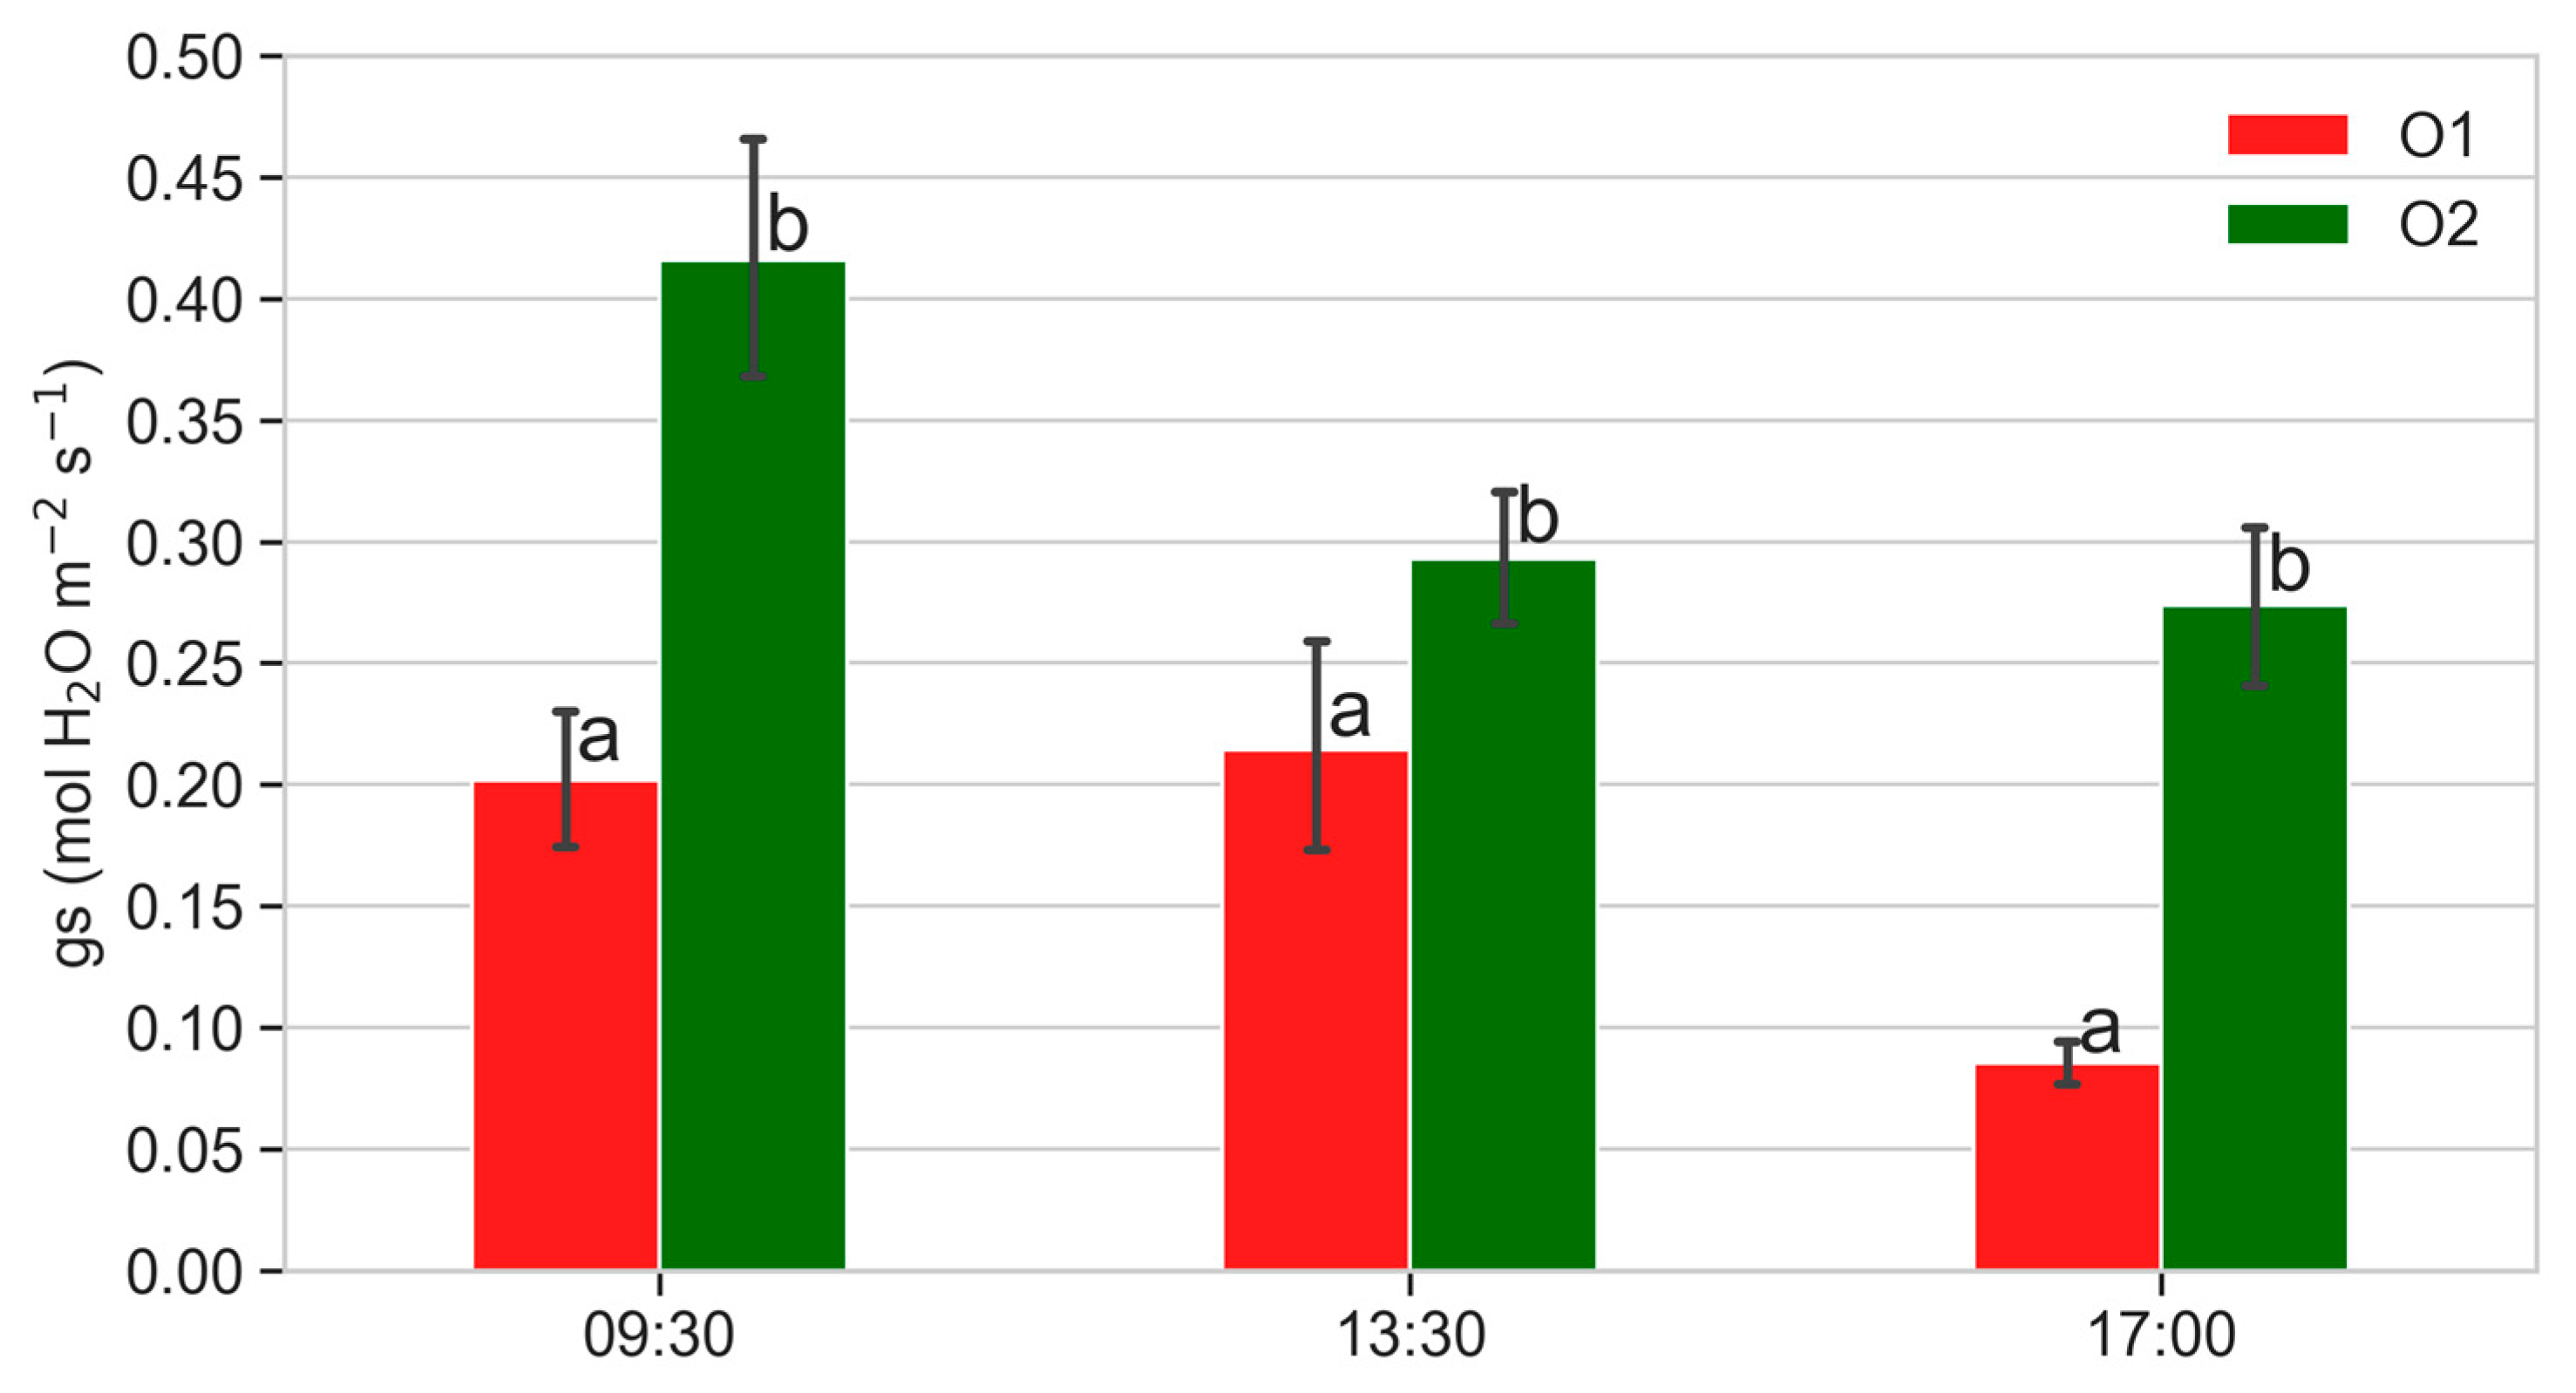
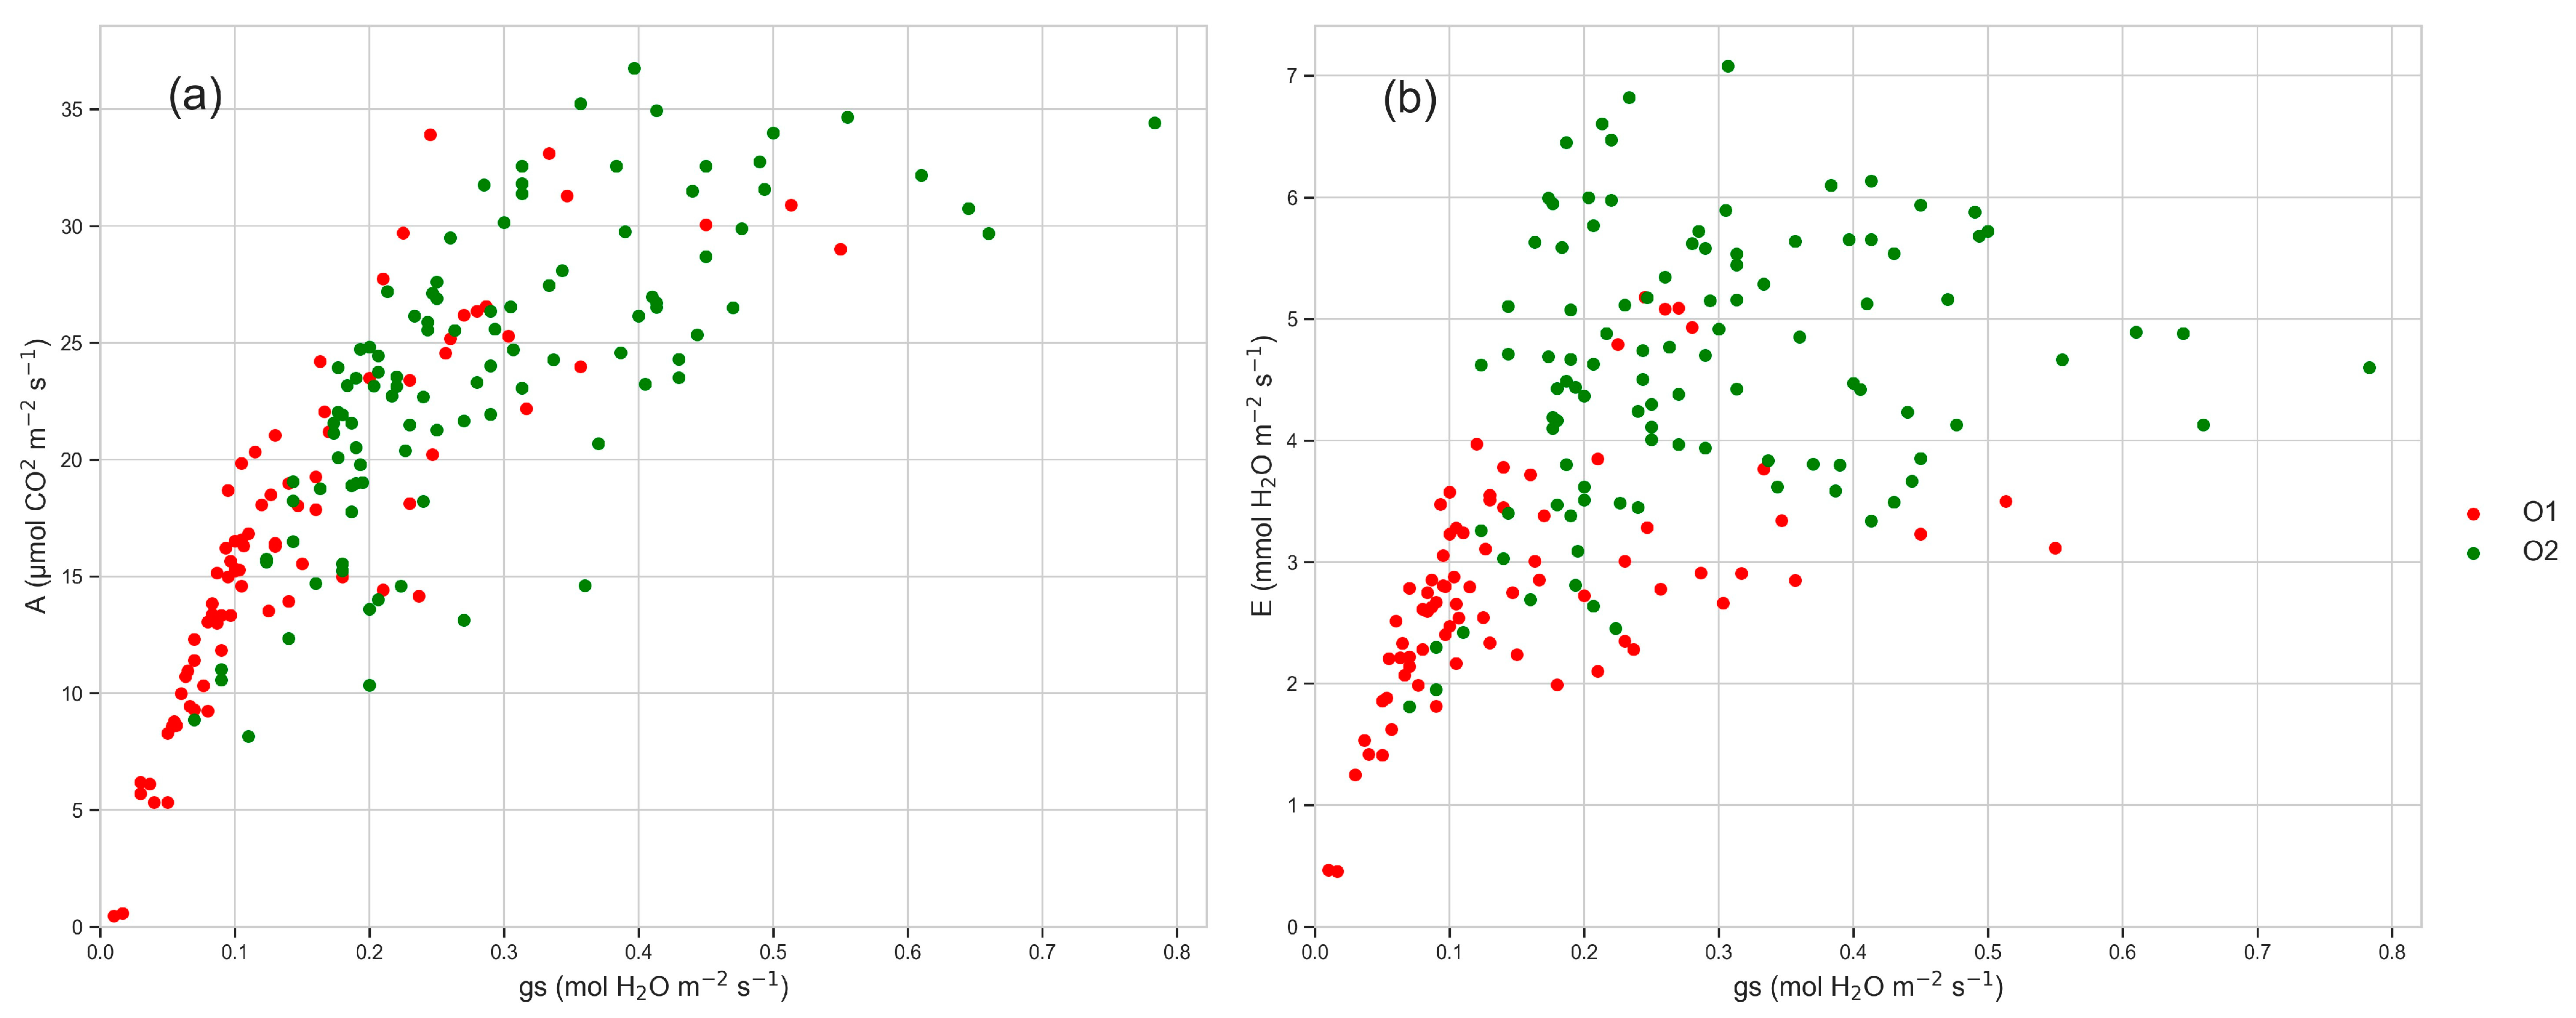
3.3. Leaf Gas Exchanges
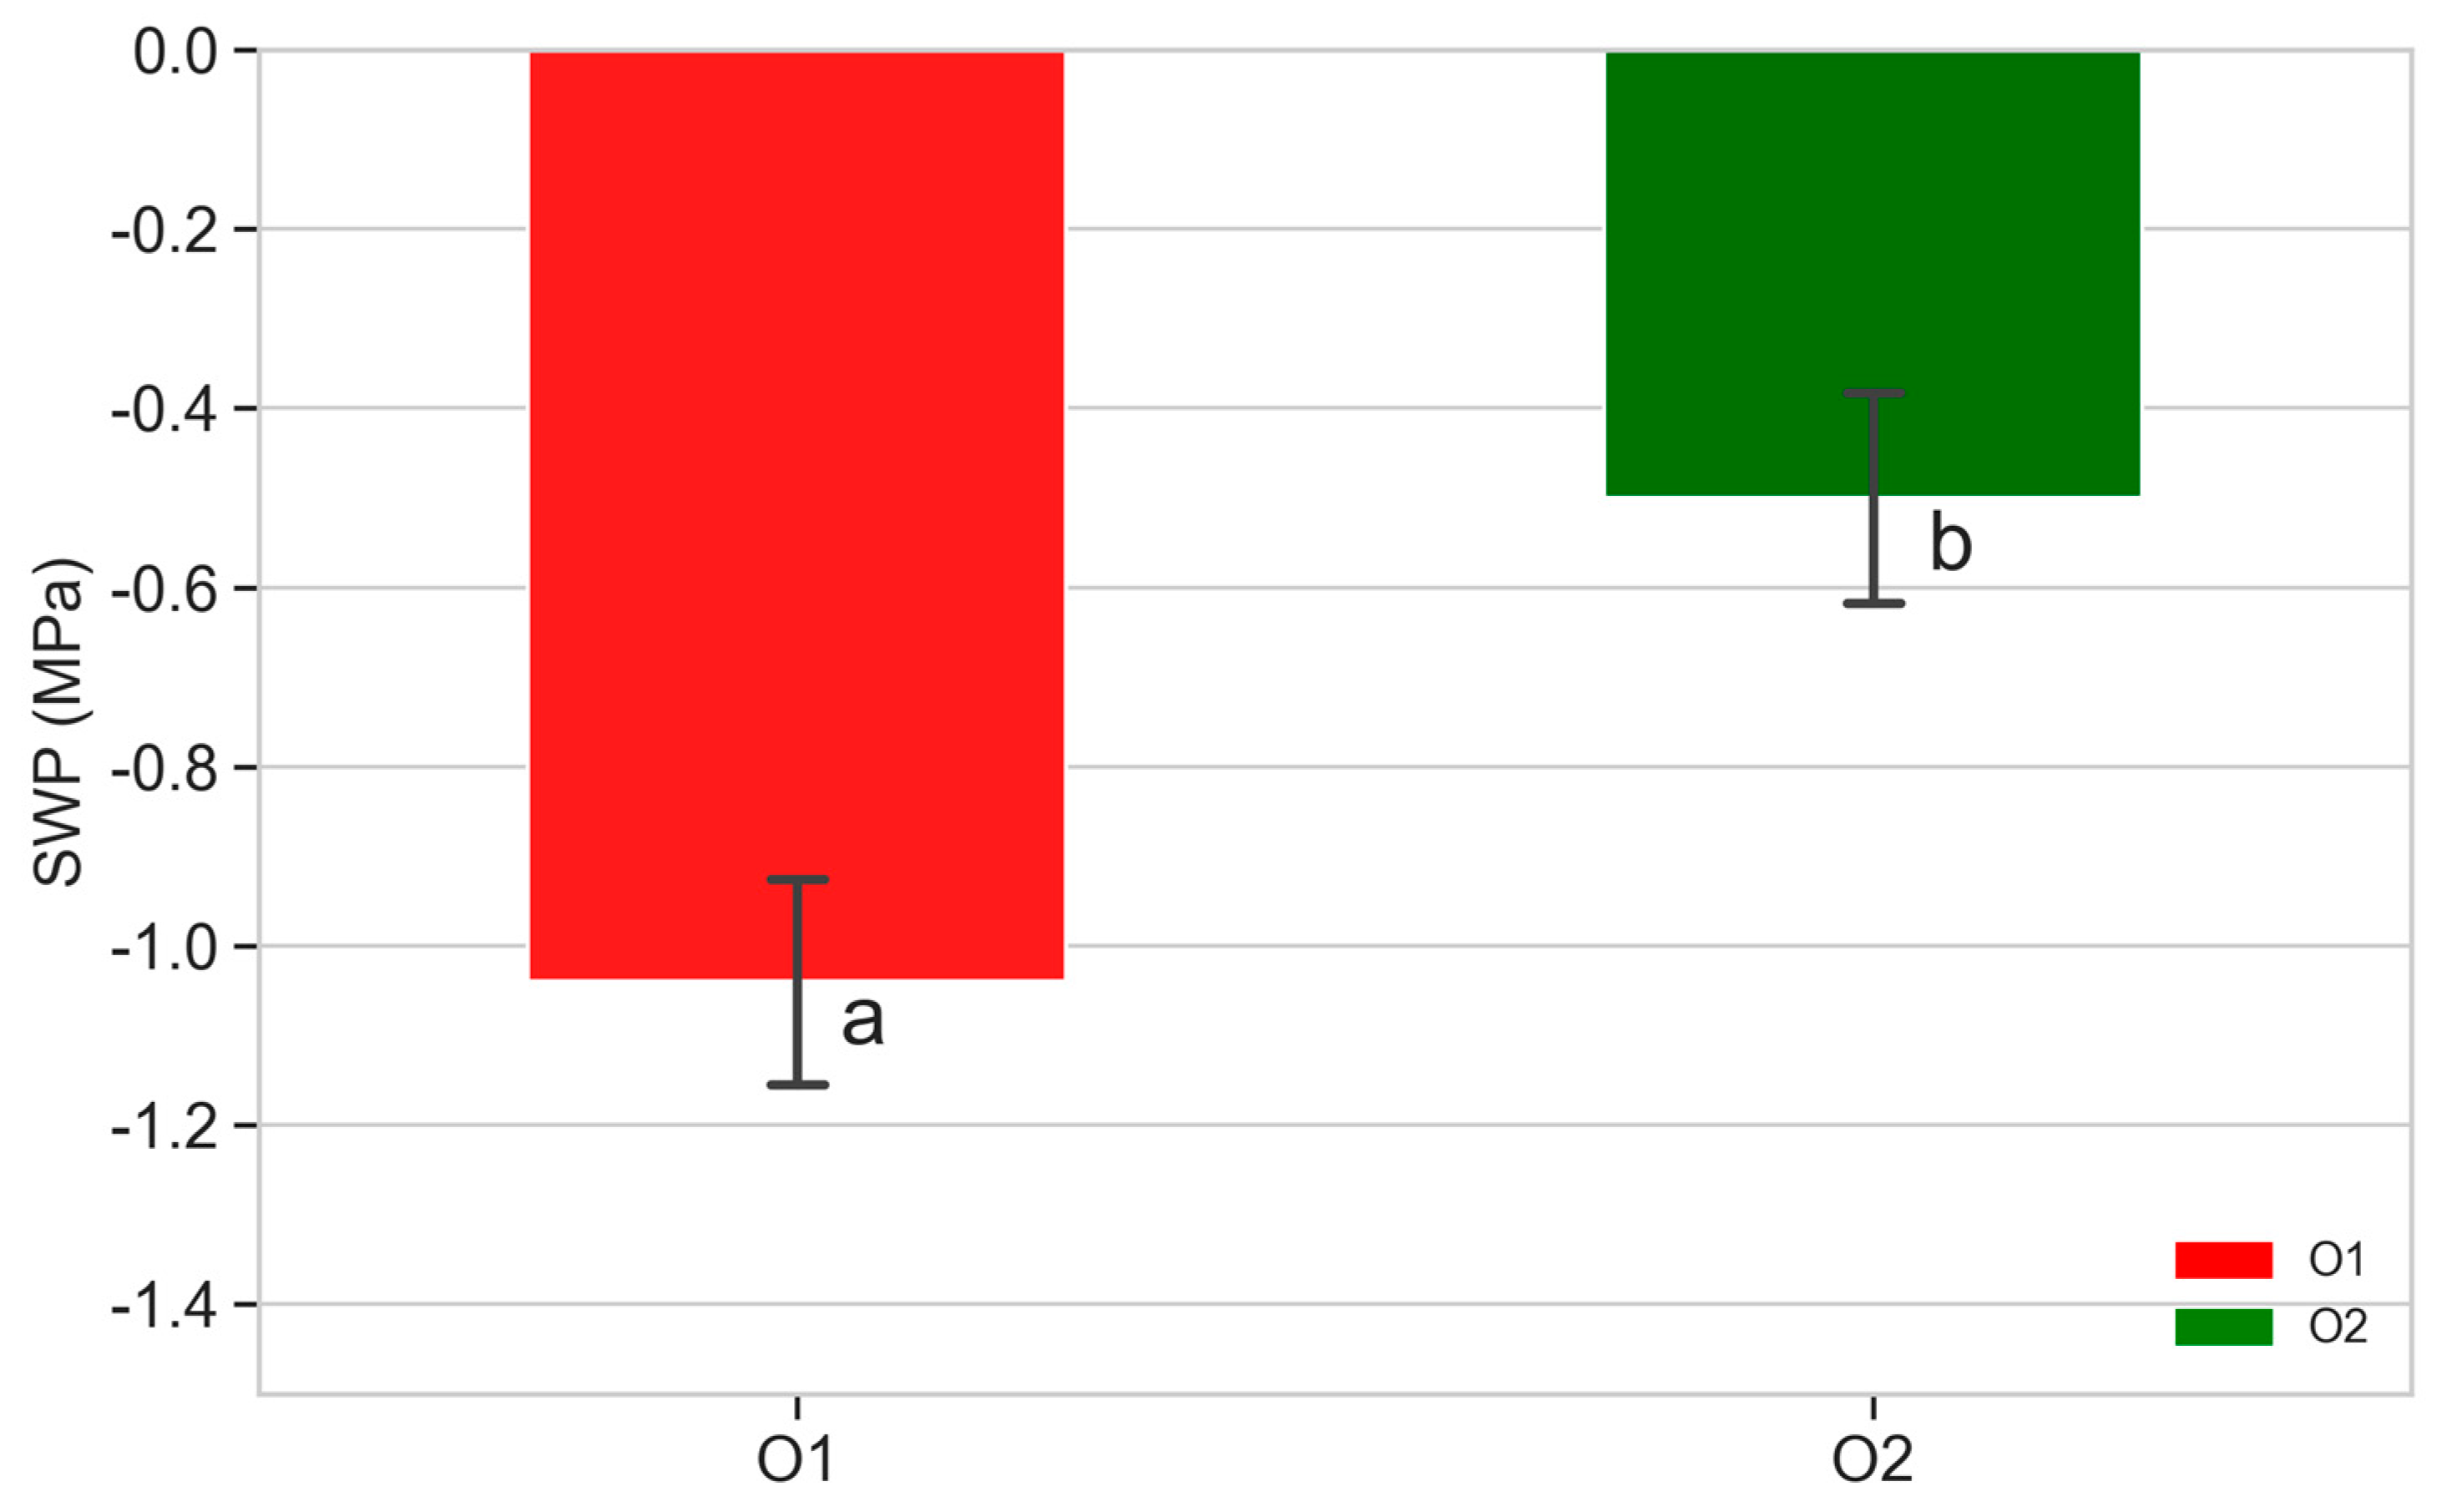
3.4. Stem Water Potential (SWP)
3.5. Leaf Temperature
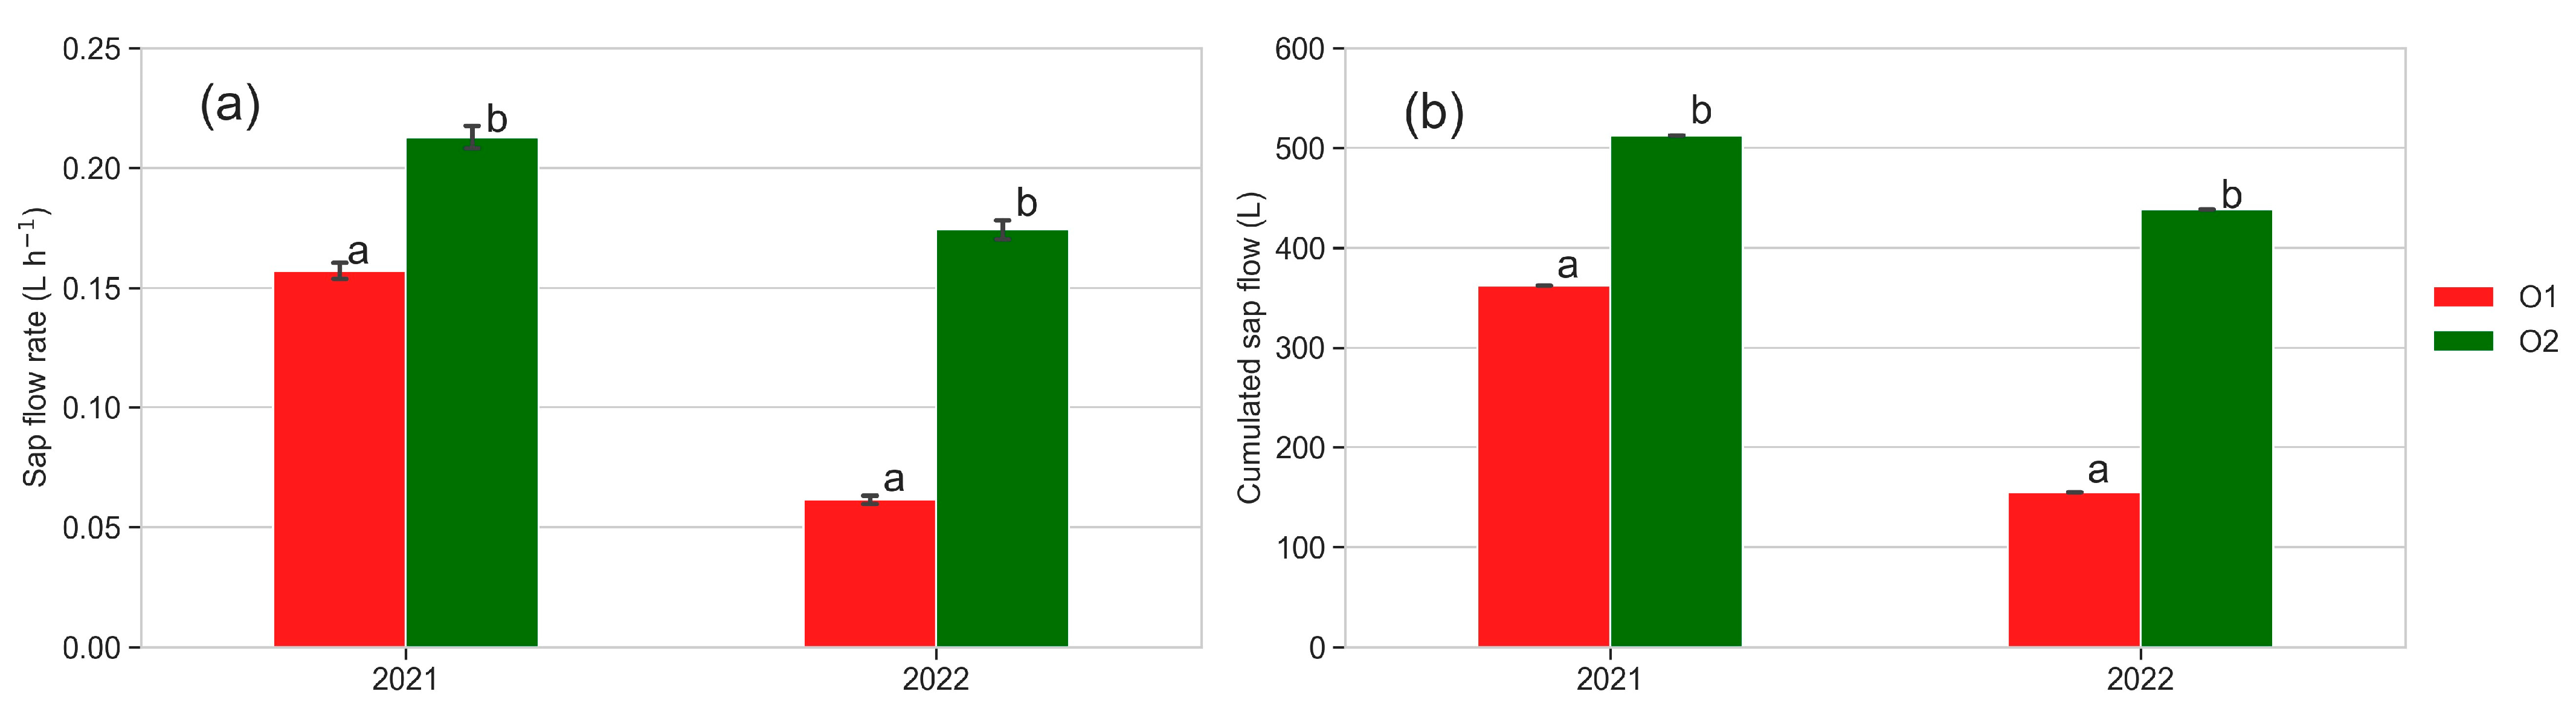
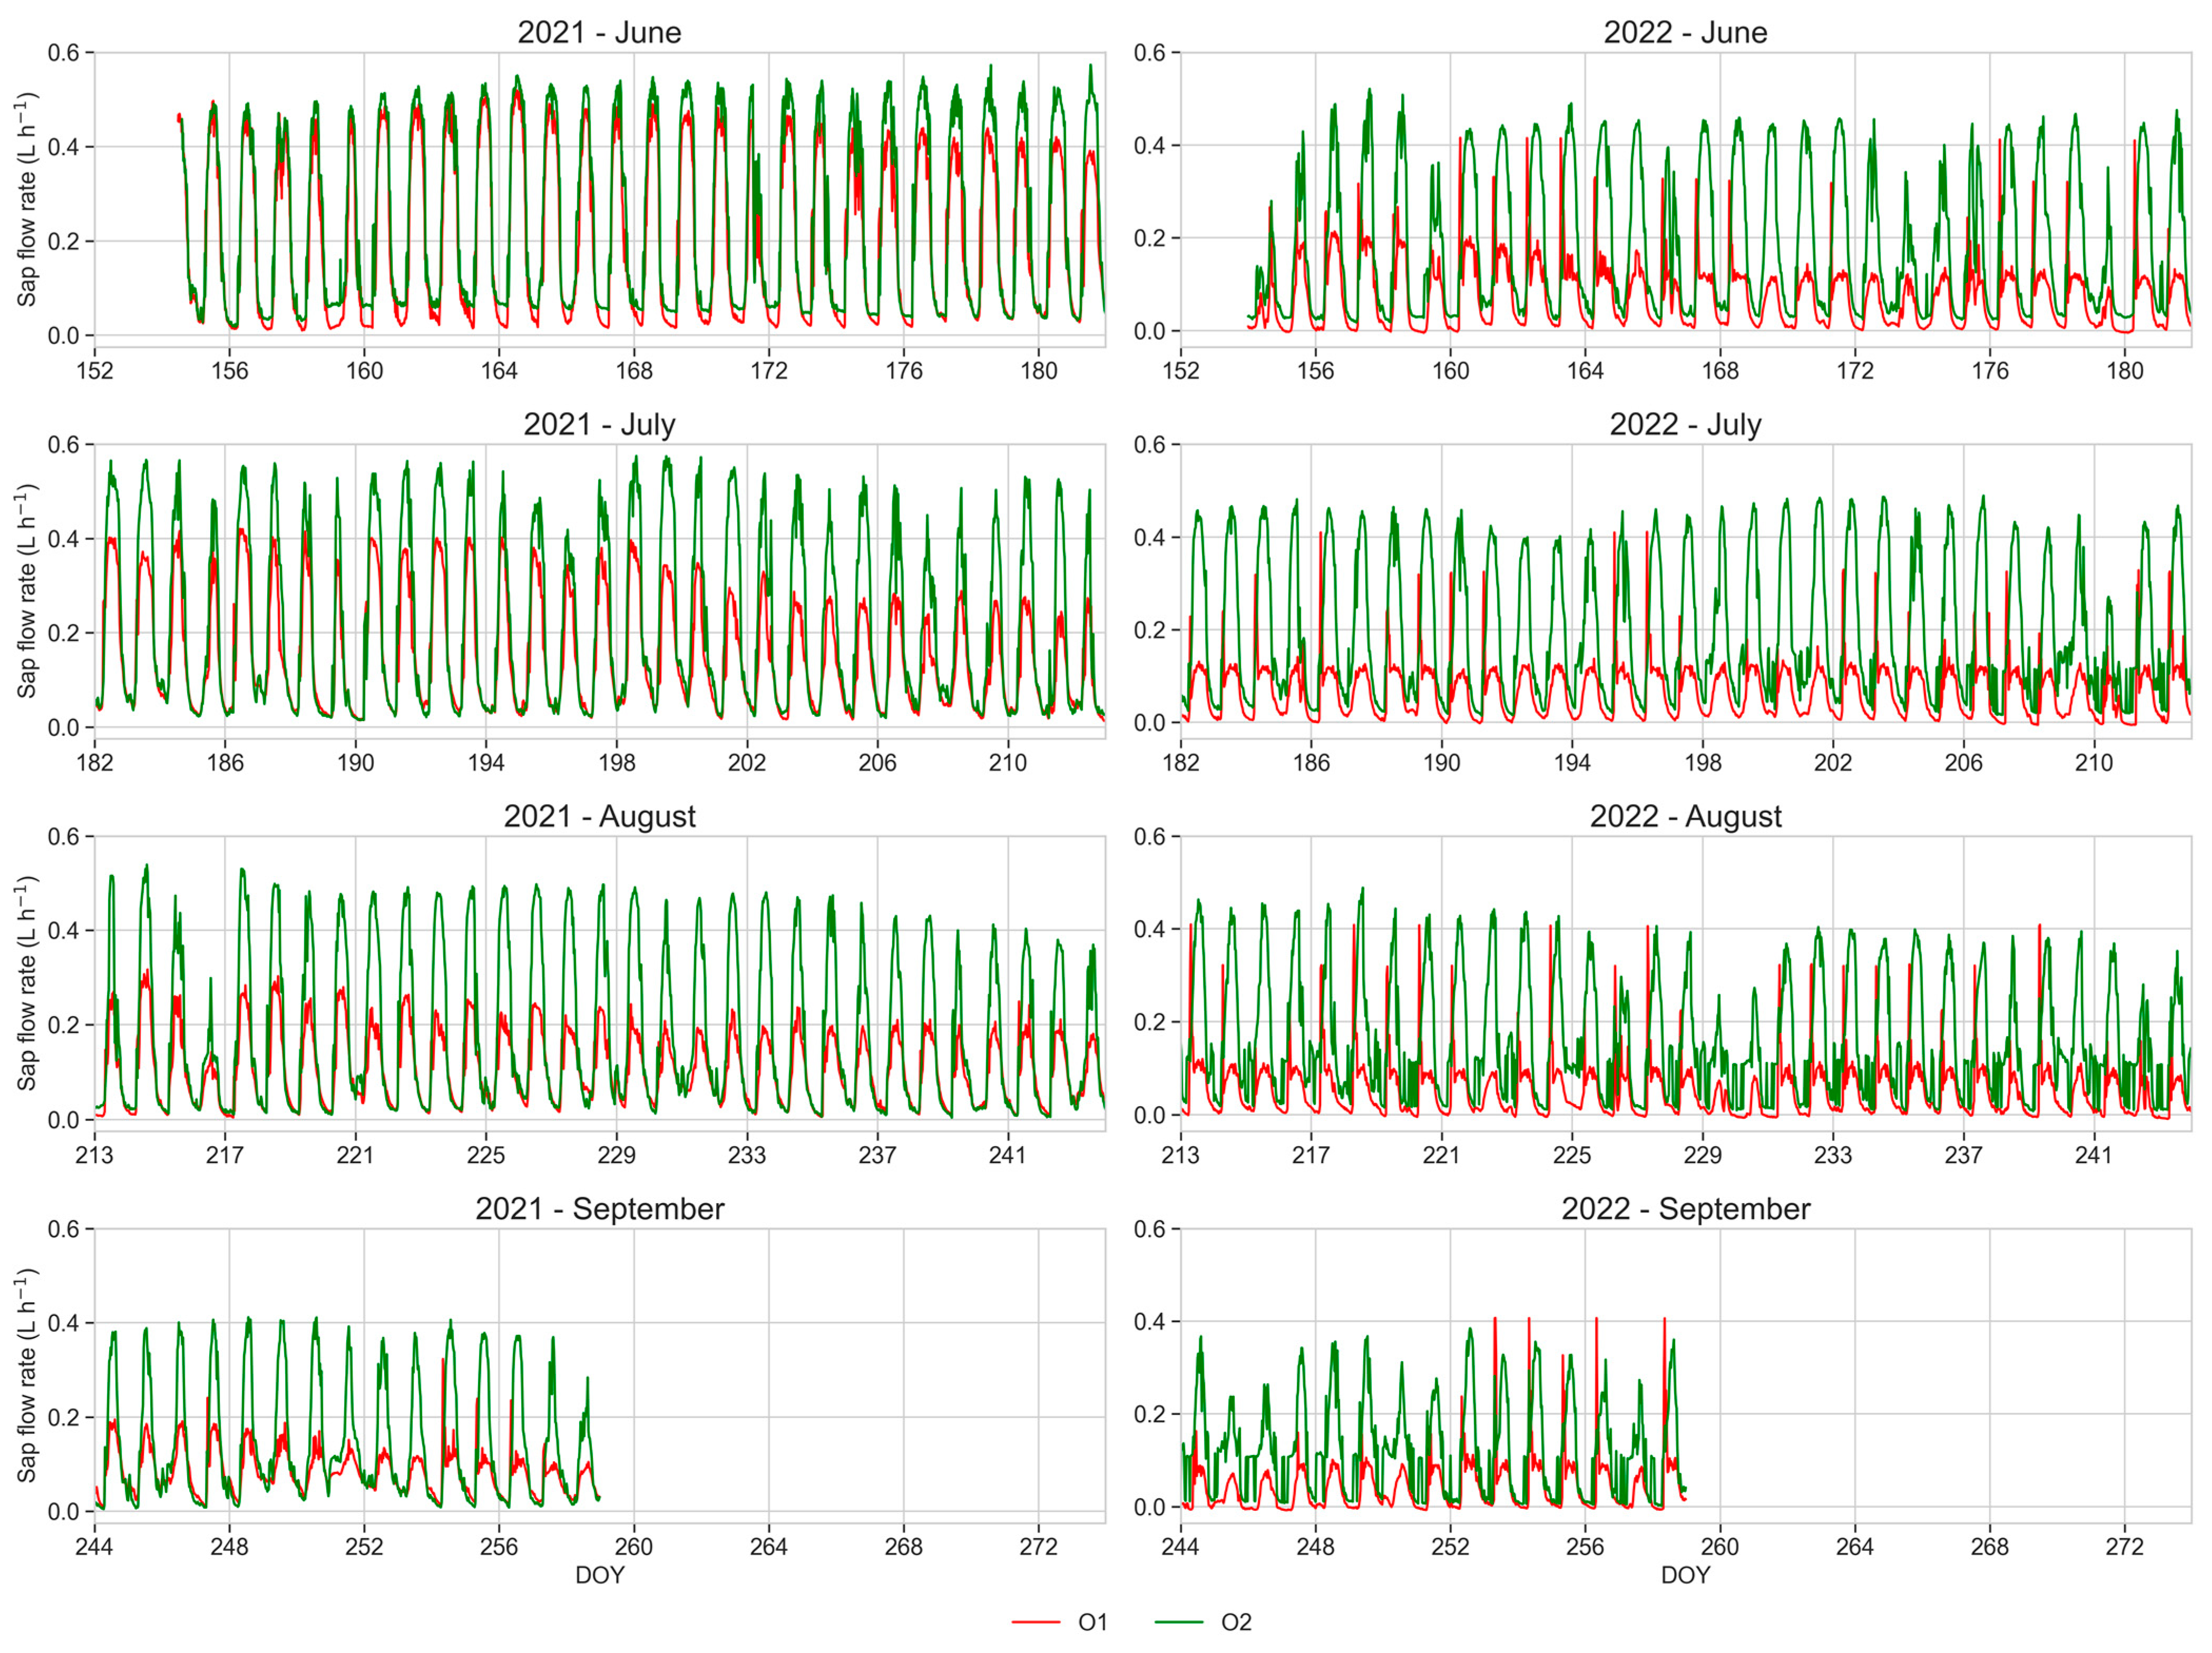
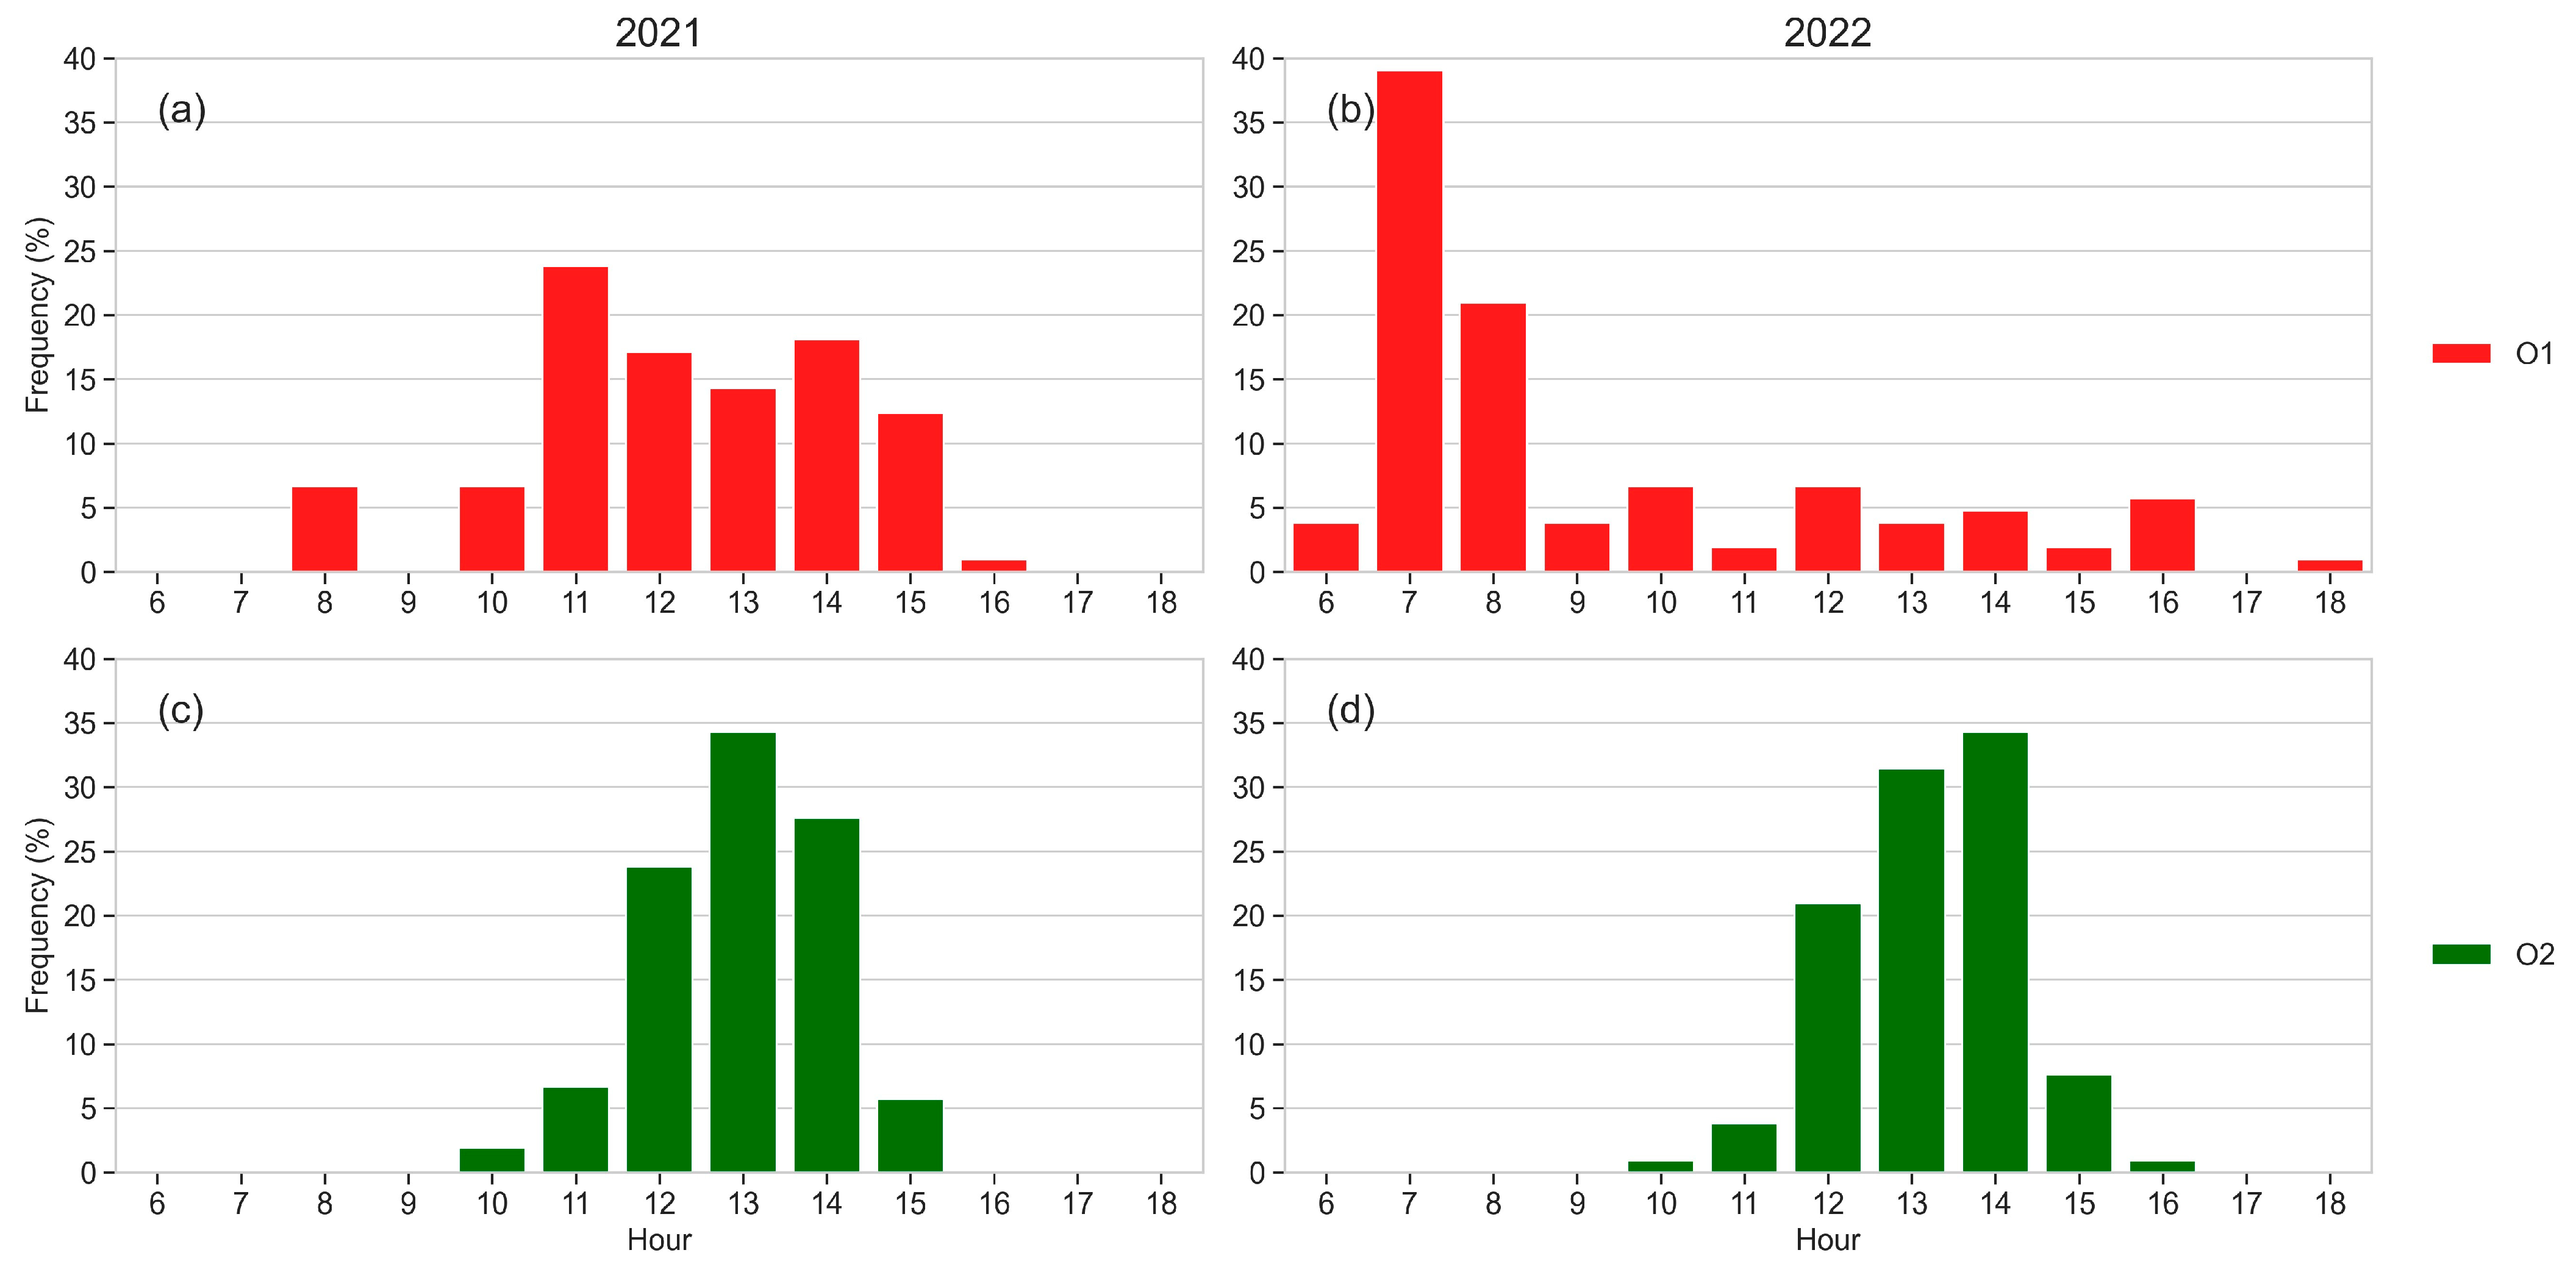
3.6. Sap Flow
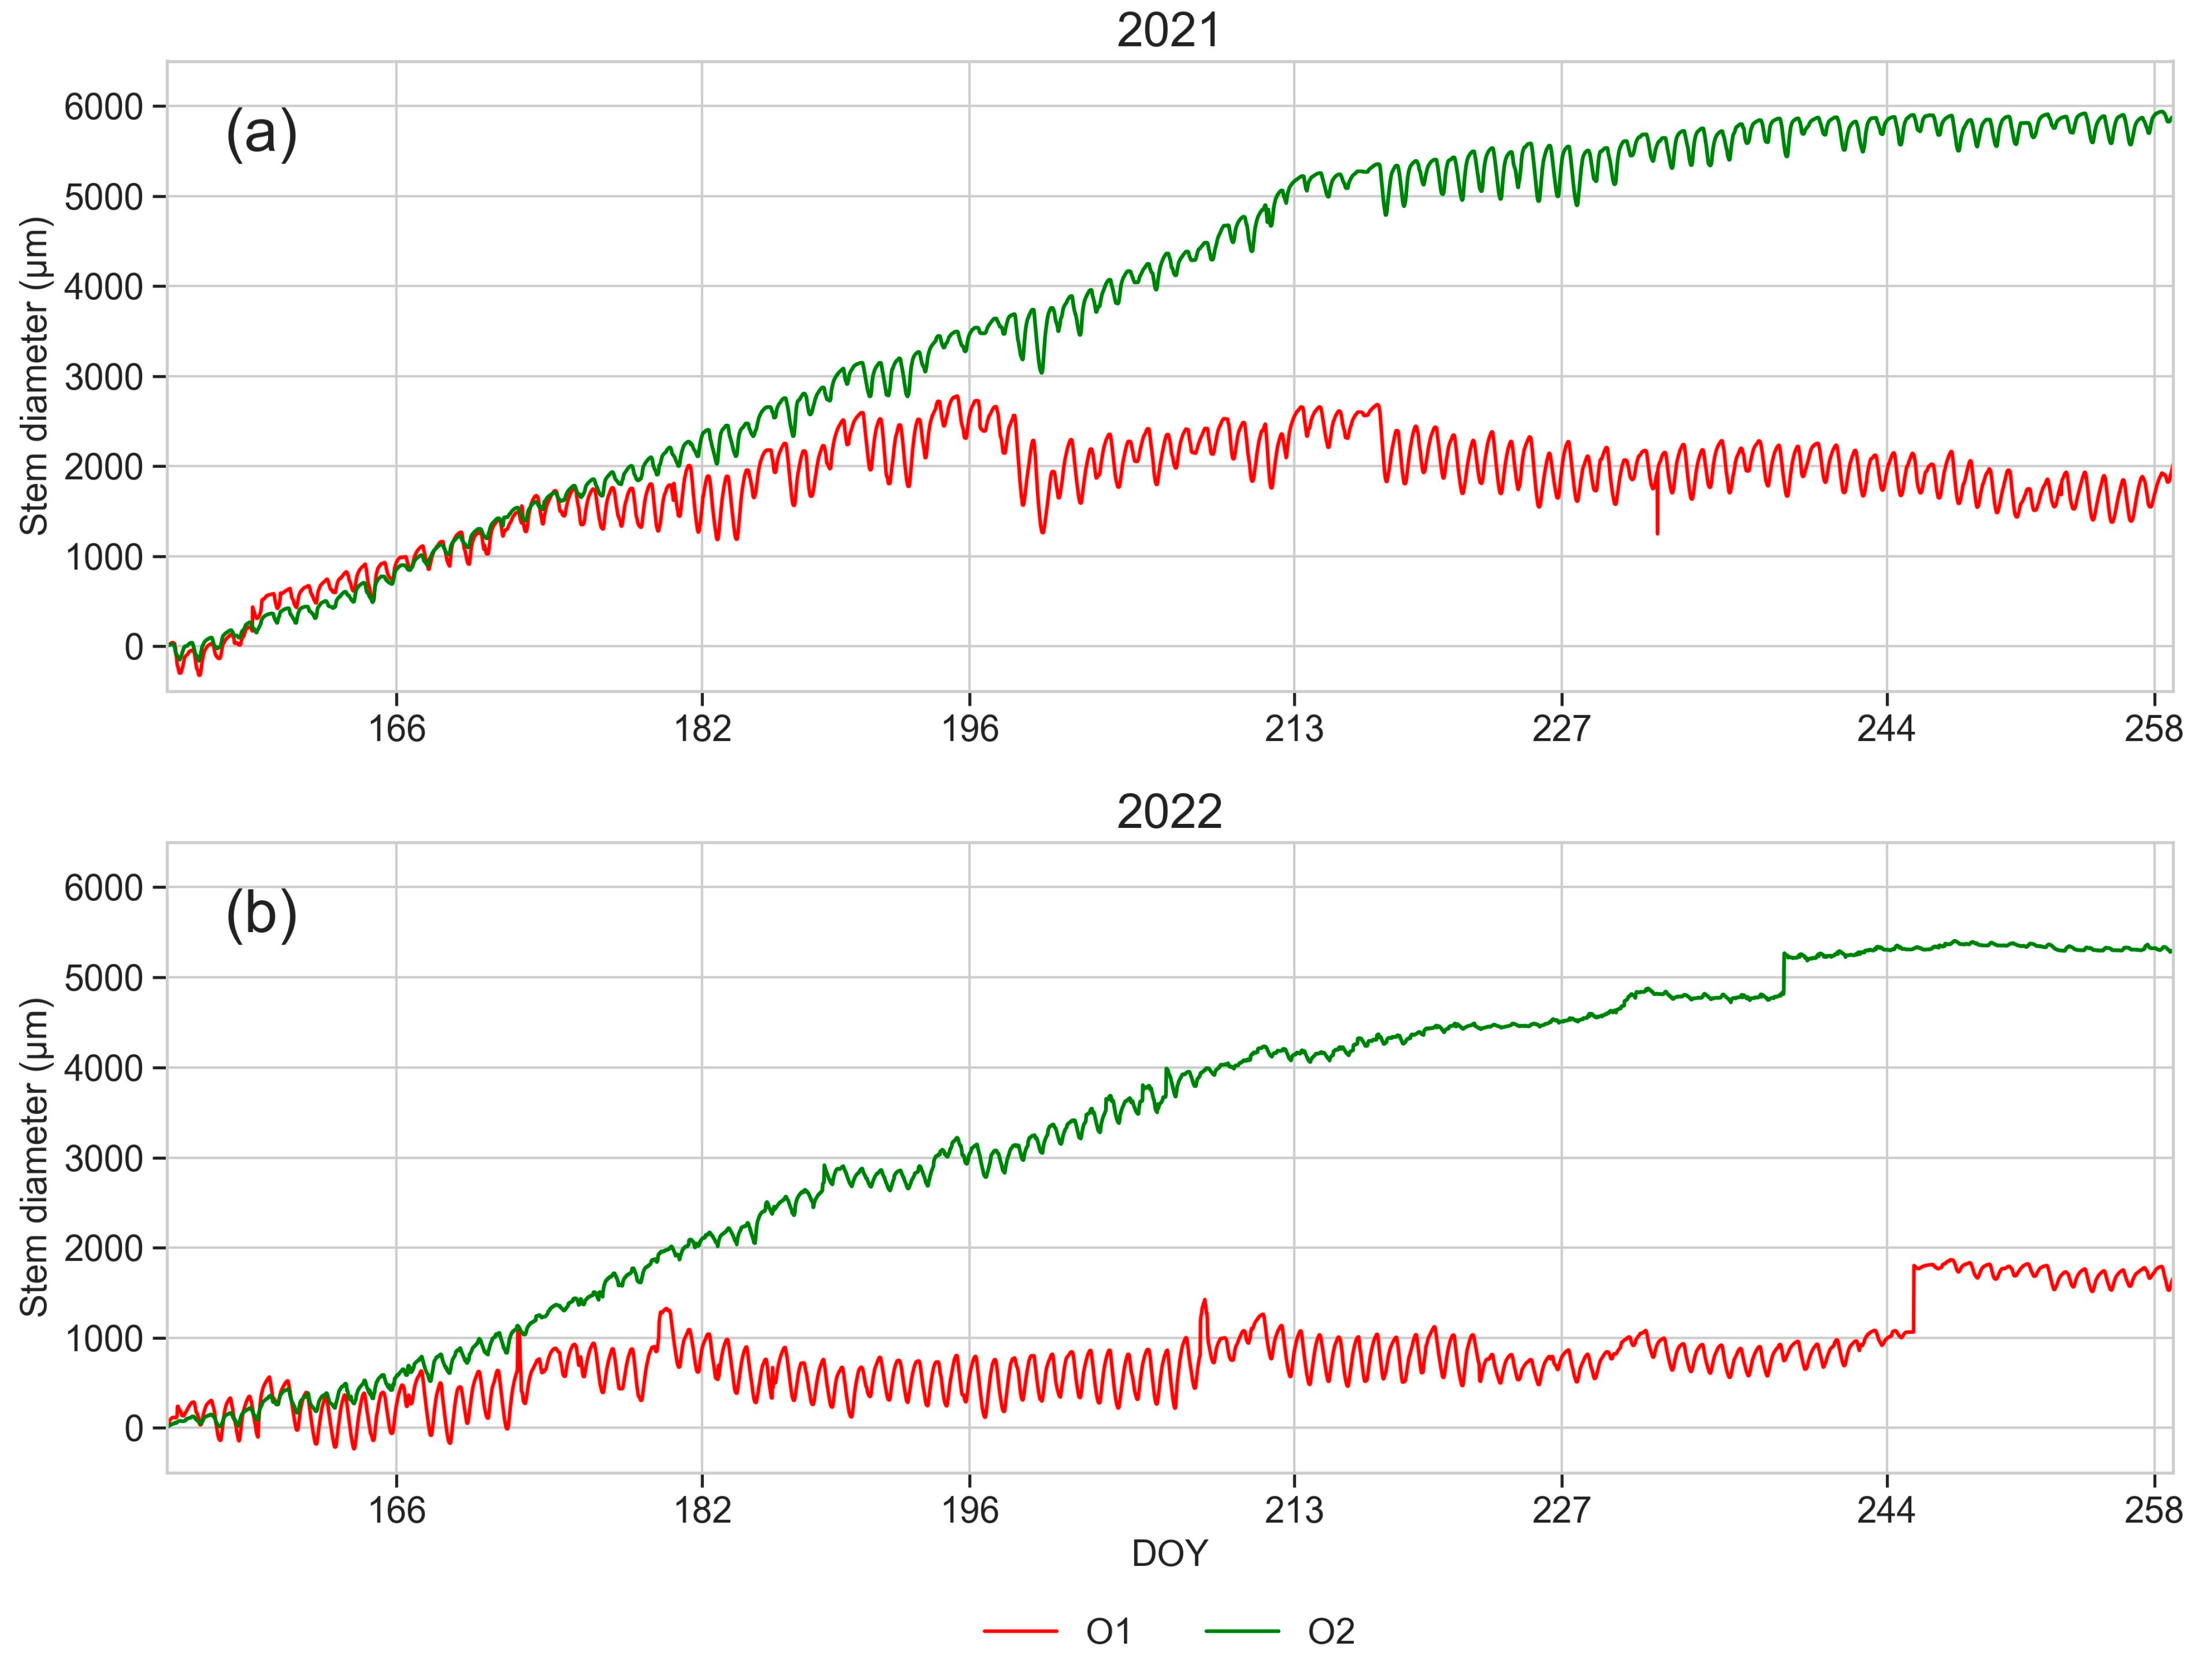
3.7. Dendrometric Measurements
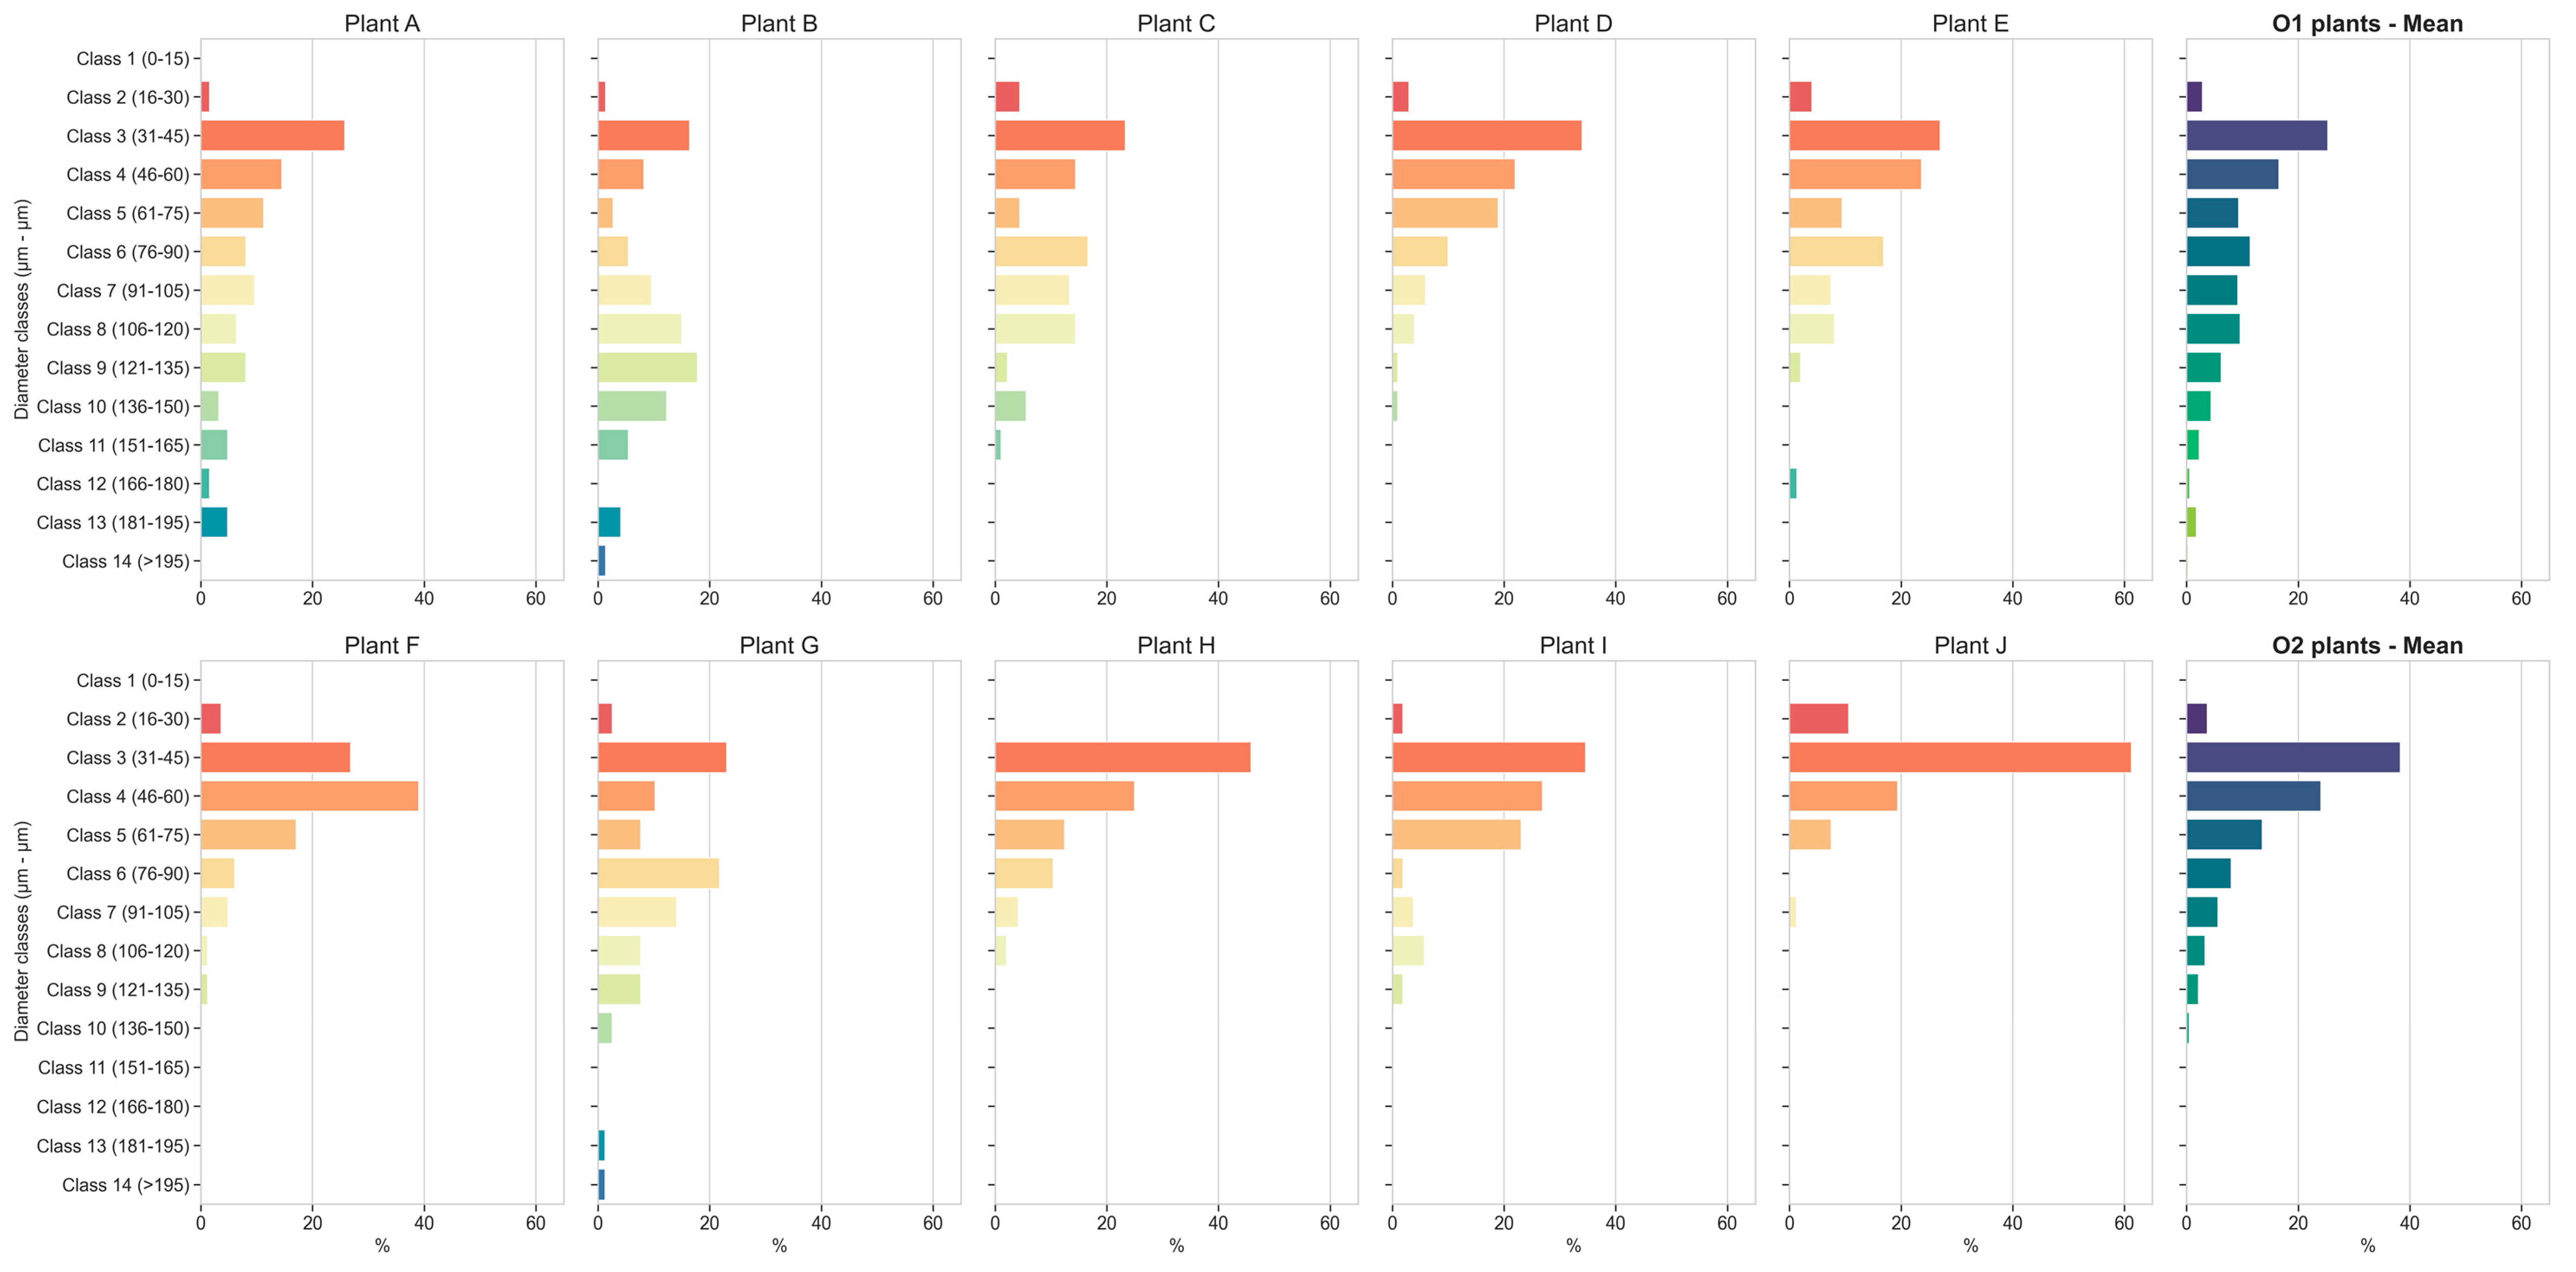
3.8. Root Xylem Vessel Diameters
3.9. Root Xylem Vessel Density, Vessel Area and Vulnerability to Cavitation
4. Discussion
5. Conclusions
Author Contributions
Funding
Data Availability Statement
Acknowledgments
Conflicts of Interest
References
- FAO. FAOSTAT—Food and Agriculture Organization of the United Nations. Rome, Italy. Available online: https://www.fao.org/faostat/en/#home (accessed on 10 November 2023).
- Scortichini, M.; Marcelletti, S.; Ferrante, P.; Petriccione, M.; Firrao, G. Pseudomonas Syringae Pv. Actinidiae: A Re-Emerging, Multi-Faceted, Pandemic Pathogen. Mol. Plant Pathol. 2012, 13, 631–640. [Google Scholar] [CrossRef]
- Haye, T.; Weber, D.C. Special Issue on the Brown Marmorated Stink Bug, Halyomorpha Halys: An Emerging Pest of Global Concern. J. Pest Sci. 2017, 90, 987–988. [Google Scholar] [CrossRef]
- Tacconi, G.; Tosi, L.; Giacopini, A.; Nari, L.; Berra, L.; Spadaro, D.; Prencipe, S.; Rosati, M.; Savian, F.; Saro, S.; et al. La Moria Del Kiwi al 2020: Lungi Dalla Soluzione! Kiwi Inf. 2020, 16, 6–16. [Google Scholar]
- Savian, F.; Marroni, F.; Ermacora, P.; Firrao, G.; Martini, M. A Metabarcoding Approach to Investigate Fungal and Oomycete Communities Associated with Kiwifruit Vine Decline Syndrome in Italy. Phytobiomes J. 2022, 6, 290–304. [Google Scholar] [CrossRef]
- Donati, I.; Cellini, A.; Sangiorgio, D.; Caldera, E.; Sorrenti, G.; Spinelli, F. Pathogens Associated to Kiwifruit Vine Decline in Italy. Agriculture 2020, 10, 119. [Google Scholar] [CrossRef]
- Savian, F.; Martini, M.; Ermacora, P.; Paulus, S.; Mahlein, A.-K. Prediction of the Kiwifruit Decline Syndrome in Diseased Orchards by Remote Sensing. Remote Sens. 2020, 12, 2194. [Google Scholar] [CrossRef]
- Tosi, L.; Tacconi, G.; Giacopini, A. La Moria Del Kiwi, Situazione e Prospettive. L’informatore Agrar. 2015, 44, 67–70. [Google Scholar]
- Sorrenti, G.; Toselli, M.; Reggidori, G.; Spinelli, F. Implicazioni della gestione idrica nella “moria del kiwi” del veronese. Riv. Fruttic. Ortofloric. 2016, 78, 45–51. [Google Scholar]
- Tacconi, G.; Paltrinieri, S.; Mejia, J.F.; Fuentealba, S.P.; Bertaccini, A.; Tosi, L.; Giacopini, A.; Mazzucchi, U.; Favaron, F.; Sella, L.; et al. Vine Decline in Kiwifruit: Climate Change and Effect on Waterlogging and Phytophthora in North Italy. Acta Hortic. 2015, 1096, 93–97. [Google Scholar] [CrossRef]
- Tacconi, G.; Giacopini, A.; Vittone, G.; Nari, L.; Spadaro, D.; Savian, F.; Ermacora, P.; Saro, S.; Morone, C.; Bardi, L.; et al. Il Punto Sulla Moria Del Kiwi a 8 Anni Dalla Sua Comparsa. L’informatore Agrar. 2019, 75, 34–36. [Google Scholar]
- Bardi, L. Early Kiwifruit Decline: A Soil-Borne Disease Syndrome or a Climate Change Effect on Plant–Soil Relations? Front. Agron. 2020, 2, 3. [Google Scholar] [CrossRef]
- Manici, L.M.; Saccà, M.L.; Scotti, C.; Caputo, F. Quantitative Reduction of Soil Bacteria and Qualitative Microbial Changes: Biotic Components Associated to Kiwifruit Decline. Plant Soil 2022, 477, 613–628. [Google Scholar] [CrossRef]
- Spigaglia, P.; Barbanti, F.; Marocchi, F.; Mastroleo, M.; Baretta, M.; Ferrante, P.; Caboni, E.; Lucioli, S.; Scortichini, M. Clostridium bifermentans and C. subterminale Are Associated with Kiwifruit Vine Decline, Known as moria, in Italy. Plant Pathol. 2020, 69, 765–774. [Google Scholar] [CrossRef]
- Prencipe, S.; Schiavon, G.; Rosati, M.; Nari, L.; Schena, L.; Spadaro, D. Characterization of Phytopythium Species Involved in the Establishment and Development of Kiwifruit Vine Decline Syndrome. Microorganisms 2023, 11, 216. [Google Scholar] [CrossRef]
- Di Biase, R.; Calabritto, M.; Sofo, A.; Reyes, F.; Mininni, A.N.; Mastroleo, M.; Xylogiannis, E.; Dichio, B. Assessment of Kiwifruit Physiological Decline: Irrigation and Soil Management Strategy to Recover from Waterlogging. Acta Hortic. 2023, 1373, 11–18. [Google Scholar] [CrossRef]
- D’Ippolito, I.; Mang, S.M.; Elshafie, H.S.; Camele, I.; Scillitani, G.; Mastrodonato, M.; Sofo, A.; Mininni, A.N.; Xylogiannis, E. Morpho-Anatomical and Microbiological Analysis of Kiwifruit Roots with KVDS Symptoms. Acta Hortic. 2022, 1332, 131–136. [Google Scholar] [CrossRef]
- Sofo, A.; Mininni, A.N.; Dichio, B.; Mastroleo, M.; Xylogiannis, E. Physical Structure and Chemical Quality of Waterlogged Soils in an Italian Kiwifruit Orchard. Acta Hortic. 2022, 1332, 195–202. [Google Scholar] [CrossRef]
- Bardi, L.; Nari, L.; Morone, C.; Faga, M.G.; Malusà, E. Possible Role of High Temperature and Soil Biological Fertility on Kiwifruit Early Decline Syndrome. Front. Agron. 2020, 2, 580659. [Google Scholar] [CrossRef]
- Bardi, L.; Nari, L.; Morone, C.; Solomita, M.; Mandalà, C.; Faga, M.G.; Migliori, C.A. Kiwifruit Adaptation to Rising Vapor Pressure Deficit Increases the Risk of Kiwifruit Decline Syndrome Occurrence. Horticulturae 2022, 8, 906. [Google Scholar] [CrossRef]
- Reid, J.B.; Tate, K.G.; Brown, N.S.; Cheah, L.H. Effects of Flooding and Alluvium Deposition on Kiwifruit (Actinidia deliciosa): 1. Early Vine Decline. N. Z. J. Crop Hortic. Sci. 1991, 19, 247–257. [Google Scholar] [CrossRef]
- Smith, G.S.; Judd, M.J.; Miller, S.A.; Buwalda, J.G. Recovery of Kiwifruit Vines from Transient Waterlogging of the Root System. New Phytol. 1990, 115, 325–333. [Google Scholar] [CrossRef] [PubMed]
- Savé, R.; Serrano, L. Some Physiological and Growth Responses of Kiwi Fruit (Actinidia chinensis) to Flooding. Physiol. Plant. 1986, 66, 75–78. [Google Scholar] [CrossRef]
- Smith, G.S.; Buwalda, J.G.; Green, T.G.A.; Clark, C.J. Effect of Oxygen Supply and Temperature at the Root on the Physiology of Kiwifruit Vines. New Phytol. 1989, 113, 431–437. [Google Scholar] [CrossRef]
- Reid, J.B.; Tate, K.G.; Brown, N.S. Effects of Flooding and Alluvium Deposition on Kiwifruit (Actinidia deliciosa): 2. Vine Performance the Following Season. N. Z. J. Crop Hortic. Sci. 1992, 20, 283–288. [Google Scholar] [CrossRef]
- Servizio Fitosanitario Nazionale. Ministro Dell’agricoltura. della Sovranità Alimentare e delle Foreste Relazione del Progetto “Consulenza Tecnica Relativa All’elaborazione Dati di Monitoraggio Sulla Moria del Kiwi”. 2022. Available online: https://www.protezionedellepiante.it/wp-content/uploads/2022/09/220927_report-indagine-2021_moria_def (accessed on 8 February 2024).
- Khan, M.U.A.; Khan, M.A.; Abbasi, U.A.; Amin, M.; Kalsoom, T.; Basit, A.; Shahzad, B. Kiwi Plant Growth Monitoring with Soil and Climatic Conditions in the Semi-Arid Region of Pakistan. Environ. Sci. Proc. 2023, 23, 36. [Google Scholar] [CrossRef]
- Kataoka, I.; Matsuoka, M.; Beppu, K.; Ohtani, M. High Temperature Tolerance of Sanuki Kiwicco® Kiwifruit Interspecific Hybrid Actinidia Rufa × A. Chinensis Var. Chinensis. Acta Hortic. 2022, 1332, 23–30. [Google Scholar] [CrossRef]
- Richardson, A.; Eyre, V.; Rebstock, R.; Popowski, E.; Nardozza, S. Factors Influencing Flower Development in Kiwifruit Vines. Acta Hortic. 2022, 1332, 141–154. [Google Scholar] [CrossRef]
- Vetharaniam, I.; Van Den Dijssel, C.; Stanley, J.; Richardson, A.; Müller, K. Projecting Suitability of Kiwifruit by Chill Requirements for Different Locations in New Zealand under Climate Change. Acta Hortic. 2022, 1332, 455–462. [Google Scholar] [CrossRef]
- Grossiord, C.; Buckley, T.N.; Cernusak, L.A.; Novick, K.A.; Poulter, B.; Siegwolf, R.T.W.; Sperry, J.S.; McDowell, N.G. Plant Responses to Rising Vapor Pressure Deficit. New Phytol. 2020, 226, 1550–1566. [Google Scholar] [CrossRef] [PubMed]
- Grossiord, C.; Sevanto, S.; Borrego, I.; Chan, A.M.; Collins, A.D.; Dickman, L.T.; Hudson, P.J.; McBranch, N.; Michaletz, S.T.; Pockman, W.T.; et al. Tree Water Dynamics in a Drying and Warming World. Plant Cell Environ. 2017, 40, 1861–1873. [Google Scholar] [CrossRef]
- Ferguson, A.R. Kiwifruit: A Botanical Review. In Horticultural Reviews; John Wiley & Sons, Ltd.: Hoboken, NJ, USA, 1984; pp. 1–64. ISBN 978-1-118-06079-7. [Google Scholar]
- Domec, J.-C.; Palmroth, S.; Ward, E.; Maier, C.A.; Thérézien, M.; Oren, R. Acclimation of Leaf Hydraulic Conductance and Stomatal Conductance of Pinus taeda (Loblolly Pine) to Long-Term Growth in Elevated CO2 (Free-Air CO2 Enrichment) and N-Fertilization. Plant Cell Environ. 2009, 32, 1500–1512. [Google Scholar] [CrossRef] [PubMed]
- Jacobsen, A.L.; Ewers, F.W.; Pratt, R.B.; Paddock, W.A.; Davis, S.D. Do Xylem Fibers Affect Vessel Cavitation Resistance? Plant Physiol. 2005, 139, 546–556. [Google Scholar] [CrossRef] [PubMed]
- Carlquist, S. Ecological Strategies of Xylem Evolution. In Ecological Strategies of Xylem Evolution; University of California Press: Berkeley, CA, USA, 1975; ISBN 978-0-520-32056-7. [Google Scholar]
- Hacke, U.G.; Sperry, J.S. Functional and Ecological Xylem Anatomy. Perspect. Plant Ecol. Evol. Syst. 2001, 4, 97–115. [Google Scholar] [CrossRef]
- Donaldson, L.A. Abnormal Lignin Distribution in Wood from Severely Drought Stressed Pinus Radiata Trees. IAWA J. 2002, 23, 161–178. [Google Scholar] [CrossRef]
- Cochard, H.; Froux, F.; Mayr, S.; Coutand, C. Xylem Wall Collapse in Water-Stressed Pine Needles. Plant Physiol. 2004, 134, 401–408. [Google Scholar] [CrossRef] [PubMed]
- Brodribb, T.J.; Holbrook, N.M. Water Stress Deforms Tracheids Peripheral to the Leaf Vein of a Tropical Conifer. Plant Physiol. 2005, 137, 1139–1146. [Google Scholar] [CrossRef] [PubMed]
- Sperry, J.S.; Nichols, K.L.; Sullivan, J.E.M.; Eastlack, S.E. Xylem Embolism in Ring-Porous, Diffuse-Porous, and Coniferous Trees of Northern Utah and Interior Alaska. Ecology 1994, 75, 1736–1752. [Google Scholar] [CrossRef]
- Santiago, L.S.; Goldstein, G.; Meinzer, F.C.; Fisher, J.B.; Machado, K.; Woodruff, D.; Jones, T. Leaf Photosynthetic Traits Scale with Hydraulic Conductivity and Wood Density in Panamanian Forest Canopy Trees. Oecologia 2004, 140, 543–550. [Google Scholar] [CrossRef] [PubMed]
- Vilagrosa, A.; Bellot, J.; Vallejo, V.R.; Gil-Pelegrín, E. Cavitation, Stomatal Conductance, and Leaf Dieback in Seedlings of Two Co-occurring Mediterranean Shrubs during an Intense Drought. J. Exp. Bot. 2003, 54, 2015–2024. [Google Scholar] [CrossRef]
- Fernández, J.E.; Cuevas, M.V. Irrigation Scheduling from Stem Diameter Variations: A Review. Agric. For. Meteorol. 2010, 150, 135–151. [Google Scholar] [CrossRef]
- Dietrich, L.; Zweifel, R.; Kahmen, A. Daily Stem Diameter Variations Can Predict the Canopy Water Status of Mature Temperate Trees. Tree Physiol. 2018, 38, 941–952. [Google Scholar] [CrossRef] [PubMed]
- Bardi, L.; Mandalà, C.; Monaco, S.; Nari, L.; Morone, C.; Neri, D. Per Rilevare Gli Stress Nel Kiwi Il Monitoraggio è Essenziale. L’informatore Agrar. 2023, 15, 41–45. [Google Scholar]
- Beck, H.E.; Zimmermann, N.E.; McVicar, T.R.; Vergopolan, N.; Berg, A.; Wood, E.F. Present and Future Köppen-Geiger Climate Classification Maps at 1-Km Resolution. Sci. Data 2018, 5, 180214. [Google Scholar] [CrossRef] [PubMed]
- Kottek, M.; Grieser, J.; Beck, C.; Rudolf, B.; Rubel, F. World Map of the Köppen-Geiger Climate Classification Updated. Meteorol. Z. 2006, 15, 259–263. [Google Scholar] [CrossRef] [PubMed]
- USDA. Keys to Soil Taxonomy, 11th ed.; United States Department of Agriculture, Natural Resources Conservation Service: Washington, DC, USA, 2010.
- FAO/ISRIC/ISSS. World Reference Base for Soil Resources; FAO: Rome, Italy, 1998. [Google Scholar]
- Deloire, A.; Pellegrino, A.; Rogiers, S. A Few Words on Grapevine Leaf Water Potential. IVES Tech. Rev. Vine Wine 2020, 1–2. [Google Scholar] [CrossRef]
- Scholander, P.F.; Bradstreet, E.D.; Hemmingsen, E.A.; Hammel, H.T. Sap Pressure in Vascular Plants. Science 1965, 148, 339–346. [Google Scholar] [CrossRef] [PubMed]
- Schneider, C.A.; Rasband, W.S.; Eliceiri, K.W. NIH Image to ImageJ: 25 Years of Image Analysis. Nat. Methods 2012, 9, 671–675. [Google Scholar] [CrossRef]
- Schindelin, J.; Arganda-Carreras, I.; Frise, E.; Kaynig, V.; Longair, M.; Pietzsch, T.; Preibisch, S.; Rueden, C.; Saalfeld, S.; Schmid, B.; et al. Fiji: An Open-Source Platform for Biological-Image Analysis. Nat. Methods 2012, 9, 676–682. [Google Scholar] [CrossRef] [PubMed]
- Van Rossum, G.; Drake, F.L. Python 3: Reference Manual; SohoBooks: New York, NY, USA, 2009; ISBN 978-1-4414-1269-0. [Google Scholar]
- Zack, G.W.; Rogers, W.E.; Latt, S.A. Automatic Measurement of Sister Chromatid Exchange Frequency. J. Histochem. Cytochem. 1977, 25, 741–753. [Google Scholar] [CrossRef] [PubMed]
- Tajima, R.; Kato, Y. Comparison of Threshold Algorithms for Automatic Image Processing of Rice Roots Using Freeware ImageJ. Field Crops Res. 2011, 121, 460–463. [Google Scholar] [CrossRef]
- Cox, E.P. A Method of Assigning Numerical and Percentage Values to the Degree of Roundness of Sand Grains. J. Paleontol. 1927, 1, 179–183. [Google Scholar]
- Feret, L.R. La Grosseur des Grains des Matières Pulvérulentes; Eidgen. Materialprüfungsanstalt a. d. Eidgen. Technischen Hochschule: Zürich, Switzerland, 1931. [Google Scholar]
- Walton, W.H. Feret’s Statistical Diameter as a Measure of Particle Size. Nature 1948, 162, 329–330. [Google Scholar] [CrossRef]
- Lemaire, C.; Quilichini, Y.; Brunel-Michac, N.; Santini, J.; Berti, L.; Cartailler, J.; Conchon, P.; Badel, É.; Herbette, S. Plasticity of the Xylem Vulnerability to Embolism in Populus Tremula x Alba Relies on Pit Quantity Properties Rather than on Pit Structure. Tree Physiol. 2021, 41, 1384–1399. [Google Scholar] [CrossRef] [PubMed]
- Carlquist, S. Ecological Factors in Wood Evolution: A Floristic Approach. Am. J. Bot. 1977, 64, 887–896. [Google Scholar] [CrossRef]
- Scholz, A.; Klepsch, M.; Karimi, Z.; Jansen, S. How to Quantify Conduits in Wood? Front. Plant Sci. 2013, 4, 56. [Google Scholar] [CrossRef] [PubMed]
- Hammer, Ø.; Harper, D.A.T.; Ryan, P.D. PAST: Paleontological Statistics Software Package for Education and Data Analysis. Palaeontol. Electron. 2021, 4, 4. [Google Scholar]
- ARPA Piemonte Regional Agency for Environmental Protection. Available online: https://www.arpa.piemonte.it/ (accessed on 4 December 2023).
- Offenthaler, I.; Hietz, P.; Richter, H. Wood Diameter Indicates Diurnal and Long-Term Patterns of Xylem Water Potential in Norway Spruce. Trees 2001, 15, 215–221. [Google Scholar] [CrossRef]
- Sevanto, S.; Hölttä, T.; Markkanen, T.; Perämäki, M.; Nikinmaa, E.; Vesala, T. Relationships between Diurnal Xylem Diameter Variation and Environmental Factors in Scots Pine. Boreal Environ. Res. 2005, 10, 447. [Google Scholar]
- Herzog, K.M.; Häsler, R.; Thum, R. Diurnal Changes in the Radius of a Subalpine Norway Spruce Stem: Their Relation to the Sap Flow and Their Use to Estimate Transpiration. Trees 1995, 10, 94–101. [Google Scholar] [CrossRef]
- Condon, J.M. Aspects of Kiwifruit Stem Structure in Relation to Transport. Acta Hortic. 1992, 297, 419–426. [Google Scholar] [CrossRef]
- Gould, N.; Clearwater, M.J. Vine Canopy and Root Physiology. In Kiwifruit; CABI: Oxfordshire, UK, 2023; pp. 255–272. [Google Scholar] [CrossRef]
- Richardson, A.C.; Marsh, K.B.; Boldingh, H.L.; Pickering, A.H.; Bulley, S.M.; Frearson, N.J.; Ferguson, A.R.; Thornber, S.E.; Bolitho, K.M.; Macrae, E.A. High Growing Temperatures Reduce Fruit Carbohydrate and Vitamin C in Kiwifruit. Plant Cell Environ. 2004, 27, 423–435. [Google Scholar] [CrossRef]
- Davis, S.D.; Ewers, F.W.; Sperry, J.S.; Portwood, K.A.; Crocker, M.C.; Adams, G.C. Shoot Dieback during Prolonged Drought in Ceanothus (Rhamnaceae) Chaparral of California: A Possible Case of Hydraulic Failure. Am. J. Bot. 2002, 89, 820–828. [Google Scholar] [CrossRef] [PubMed]
- Woodrum, C.L.; Ewers, F.W.; Telewski, F.W. Hydraulic, Biomechanical, and Anatomical Interactions of Xylem from Five Species of Acer (Aceraceae). Am. J. Bot. 2003, 90, 693–699. [Google Scholar] [CrossRef]
- Yang, S.; Tyree, M.T. A Theoretical Model of Hydraulic Conductivity Recovery from Embolism with Comparison to Experimental Data on Acer Saccharum. Plant Cell Environ. 1992, 15, 633–643. [Google Scholar] [CrossRef]
- Venturas, M.D.; Sperry, J.S.; Hacke, U.G. Plant Xylem Hydraulics: What We Understand, Current Research, and Future Challenges. J. Integr. Plant Biol. 2017, 59, 356–389. [Google Scholar] [CrossRef] [PubMed]
- Zimmermann, M.H.; Milburn, J.A. Transport and Storage of Water. In Physiological Plant Ecology II: Water Relations and Carbon Assimilation; Lange, O.L., Nobel, P.S., Osmond, C.B., Ziegler, H., Eds.; Encyclopedia of Plant Physiology; Springer: Berlin/Heidelberg, Germany, 1982; pp. 135–151. ISBN 978-3-642-68150-9. [Google Scholar]
- Tyree, M.; Zimmermann, M. Xylem Structure and the Ascent of Sap; Springer: Berlin/Heidelberg, Germany, 2002; ISBN 978-3-642-07768-5. [Google Scholar]
- Pratt, R.B.; Ewers, F.W.; Lawson, M.C.; Jacobsen, A.L.; Brediger, M.M.; Davis, S.D. Mechanisms for Tolerating Freeze–Thaw Stress of Two Evergreen Chaparral Species: Rhus ovata and Malosma laurina (Anacardiaceae). Am. J. Bot. 2005, 92, 1102–1113. [Google Scholar] [CrossRef] [PubMed]
- Anguita-Maeso, M.; Trapero-Casas, J.L.; Olivares-García, C.; Ruano-Rosa, D.; Palomo-Ríos, E.; Jiménez-Díaz, R.M.; Navas-Cortés, J.A.; Landa, B.B. Verticillium Dahliae Inoculation and in Vitro Propagation Modify the Xylem Microbiome and Disease Reaction to Verticillium Wilt in a Wild Olive Genotype. Front. Plant Sci. 2021, 12, 632689. [Google Scholar] [CrossRef] [PubMed]
- Prencipe, S.; Savian, F.; Nari, L.; Ermacora, P.; Spadaro, D.; Martini, M. First Report of Phytopythium Vexans Causing Decline Syndrome of Actinidia Deliciosa ‘Hayward’ in Italy. Plant Dis. 2020, 104, 2032. [Google Scholar] [CrossRef]


| O1 | O2 | |
|---|---|---|
| Coordinates | N 44.614417, E 7.497665 | N 44.620674, E 7.503988 |
| Farm management | Integrated Farming System | Integrated Farming System |
| Year of establishment | 2017 | 2017 |
| Cultivar | Actinidia chinensis var. deliciosa (Hayward) | Actinidia chinensis var. deliciosa (Hayward) |
| Training system | T-Bar (pergola) | T-Bar (pergola) |
| Planting distance | 4.4 m × 3 m | 5 m × 4 m |
| Plant number per ha | 760 | 500 |
| Protection nets | Black anti-hail net | Black anti-hail net |
| Irrigation system | Drip system | Drip system |
| Propagation material | Micropropagation through meristem culture | Cuttings |
| Soil preparation | Flat soil | Soil ridging |
| Previous crop | Peach | Grass |
| Physical Parameters | Unit | O1 | O2 |
|---|---|---|---|
| Clay | % | 10.78 | 8.18 |
| Silt | % | 49.02 | 48.10 |
| Sand | % | 40.20 | 43.72 |
| Chemical Parameters | |||
| pH (water) | - | 6.71 | 6.24 |
| Total limestone | % | 0.39 | 0.39 |
| Organic matter | % | 1.389 | 2.047 |
| Organic carbon concentration | % | 0.807 | 1.190 |
| Total N content | % | 0.1008 | 0.1551 |
| C/N ratio | - | 8.0 | 7.7 |
| CEC—Cation exchange capacity | meq/100 g | 11.8 | 15.1 |
| Exchangeable calcium | ppm | 1496 | 1709 |
| Exchangeable calcium | meq/100 g | 7.46 | 8.53 |
| Exchangeable calcium as percentages of CEC | % | 63.5 | 56.6 |
| Exchangeable magnesium | ppm | 159 | 157 |
| Exchangeable magnesium | meq/100 g | 1.31 | 1.29 |
| Exchangeable magnesium as percentages of CEC | % | 11.1 | 8.6 |
| Exchangeable potassium | ppm | 99 | 76 |
| Exchangeable potassium | meq/100 g | 0.254 | 0.195 |
| Exchangeable potassium as percentages of CEC | % | 0.022 | 0.013 |
| Ca/Mg ratio | - | 5.7 | 6.6 |
| Ca/K ratio | - | 29.4 | 43.7 |
| Mg/K ratio | - | 5.1 | 6.6 |
| Base saturation | - | 76.7 | 66.4 |
| Assimilable phosphorus | ppm | 43.7 | 17.2 |
| Assimilable phosphorus pentoxide | ppm | 100 | 39.3 |
| Assimilable iron | ppm | 86 | 150 |
| Assimilable manganese | ppm | 15.2 | 12.8 |
| Assimilable zinc | ppm | 3.6 | 2.6 |
| Assimilable copper | ppm | 5.7 | 4.7 |
| Year | Month | O1 [m3 ha−1] | O2 [m3 ha−1] |
|---|---|---|---|
| 2021 | May | 0 | 0 |
| June | 121 | 162.8 | |
| July | 344.4 | 344.1 | |
| August | 319.2 | 266.4 | |
| September | 218.4 | 140.6 | |
| October | 48.7 | 0 | |
| Total | 1052 | 914 | |
| 2022 | May | 29.4 | 0 |
| June | 222.6 | 555 | |
| July | 193.2 | 643.8 | |
| August | 193.2 | 414.4 | |
| September | 119.7 | 329.3 | |
| October | 0 | 0 | |
| Total | 758.1 | 1942.5 |
| Vessel Density [n mm−2] | Vessel Area [μm2 mm−2] | Vulnerability Index (VI) [μm mm−2] | Cumulative Sap Flow [L] | ||
|---|---|---|---|---|---|
| O1 | A | 15.5 | 3777.05 | 5.45 | 90.66 |
| B | 18.3 | 6022.54 | 5.90 | 119.52 | |
| C | 30.0 | 3749.98 | 2.57 | 188.64 | |
| D | 25.0 | 1757.91 | 2.77 | 171.72 | |
| E | 37.0 | 2509.74 | 1.79 | 204.68 | |
| Mean value | 25.2 | 3563.44 | 3.70 | 155.04 | |
| O2 | F | 27.3 | 1415.41 | 2.02 | 263.11 |
| G | 26.0 | 3371.57 | 3.05 | 332.33 | |
| H | 24.0 | 1190.74 | 2.21 | 653.50 | |
| I | 26.0 | 1773.09 | 2.28 | 400.76 | |
| J | 53.3 | 685.06 | 0.82 | 543.14 | |
| Mean value | 31.3 | 1687.69 | 2.08 | 438.7 | |
Disclaimer/Publisher’s Note: The statements, opinions and data contained in all publications are solely those of the individual author(s) and contributor(s) and not of MDPI and/or the editor(s). MDPI and/or the editor(s) disclaim responsibility for any injury to people or property resulting from any ideas, methods, instructions or products referred to in the content. |
© 2024 by the authors. Licensee MDPI, Basel, Switzerland. This article is an open access article distributed under the terms and conditions of the Creative Commons Attribution (CC BY) license (https://creativecommons.org/licenses/by/4.0/).
Share and Cite
Mandalà, C.; Monaco, S.; Nari, L.; Morone, C.; Palazzi, F.; Bencresciuto, G.F.; Bardi, L. Xylem Hydraulic Conductance Role in Kiwifruit Decline Syndrome Occurrence. Horticulturae 2024, 10, 392. https://doi.org/10.3390/horticulturae10040392
Mandalà C, Monaco S, Nari L, Morone C, Palazzi F, Bencresciuto GF, Bardi L. Xylem Hydraulic Conductance Role in Kiwifruit Decline Syndrome Occurrence. Horticulturae. 2024; 10(4):392. https://doi.org/10.3390/horticulturae10040392
Chicago/Turabian StyleMandalà, Claudio, Stefano Monaco, Luca Nari, Chiara Morone, Francesco Palazzi, Grazia Federica Bencresciuto, and Laura Bardi. 2024. "Xylem Hydraulic Conductance Role in Kiwifruit Decline Syndrome Occurrence" Horticulturae 10, no. 4: 392. https://doi.org/10.3390/horticulturae10040392
APA StyleMandalà, C., Monaco, S., Nari, L., Morone, C., Palazzi, F., Bencresciuto, G. F., & Bardi, L. (2024). Xylem Hydraulic Conductance Role in Kiwifruit Decline Syndrome Occurrence. Horticulturae, 10(4), 392. https://doi.org/10.3390/horticulturae10040392