
Analysis of Vine Nutrition and Productivity Based on Statistical Indicators

1
Department of Soil Science, University of Life Sciences “King Mihai I” from Timisoara, 300645 Timisoara, Romania
2
Laboratory of Plants Biotechnology, Agricultural Research and Development Station Lovrin, 307250 Lovrin, Romania
3
Department of Genetic Engineering, University of Life Sciences “King Mihai I” from Timisoara, 300645 Timisoara, Romania
4
Department of Sustainable Development and Environmental Engineering, University of Life Sciences “King Mihai I” from Timisoara, 300645 Timisoara, Romania
5
Padureni City Hall, 307236 Padureni, Romania
*
Author to whom correspondence should be addressed.
Horticulturae 2024, 10(4), 397; https://doi.org/10.3390/horticulturae10040397
Submission received: 19 February 2024
/
Revised: 22 March 2024
/
Accepted: 25 March 2024
/
Published: 13 April 2024
(This article belongs to the Section Viticulture)
Abstract
:Different fertilization systems, methods and techniques result in differences in plant nutrition, with variations in the mineral element contents in the leaves and values of physiological, yield, and production quality indices. This results in large datasets that are often relatively difficult to interpret. Starting from these aspects, the present study analyzed data on the state of plant nutrition (N, P, K, Ca, and Mg content in leaves, in % of dry matter; Fe, Mn, Cu, and Zn content in leaves, in mg/kg of dry matter), physiological indices (chlorophyll leaf content—Chl; leaf area—LA), yield (kg/vine, t/ha), and grape berry quality (sugar and acidity content in berries) of the ‘Burgund mare’ grape cultivar in relation to organic, mineral and foliar fertilization. According to a PCA multivariate analysis, four groups of components were obtained: PC1 including five factors, with positive action in the case of K (r = 0.963), P (r = 0.770) and Cu (r = 0.752), and negative action in the case of Mg (r = −0.940) and Mn (r = −0.759); PC2 including three factors, with positive action for Chl (r = 0.938), LA (r = 0.938) and Ca (r = 0.722); PC3 including one factor (N), with negative action (r = −0.916); and PC4 including two factors, with positive action for Fe (r = 0.869) and Zn (r = 0.761). Based on the one-sample t test (parametric) and the Wilcoxon test (non-parametric) and a threshold value of α = 0.05, the differences between the index values for fertilization variants T2–T13 compared with those for the control variant (T1) were verified. Significant differences were recorded in PC1 for P, Mg and Cu; in PC2 for Chl, LA and Ca; and in PC3 for N. Insignificant differences were recorded in PC1 for K and Mn and in PC4 for Fe and Zn. In the case of the productivity elements and quality indices, significant differences were recorded.
1. Introduction
Grapevine is a horticultural crop that attracts great interest worldwide due to its highly valued products and by-products and wide range of viable growing areas, surfaces, genotypes and production methods [1,2,3]. The content of mineral elements in grapevine leaves has been previously studied from the perspective of plant nutrition, production and grape quality, as well as from the perspective of using the leaves in certain diets. The dynamics of nutritional elements in vines are varied, with high mobility for some elements (e.g., nitrogen, phosphorus, potassium and boron) and reduced or no mobility for other elements (e.g., calcium and magnesium). Mineral elements also undergo differentiated elimination from the plant through the grapes and leaves, as well as through the plant material, as a result of maintenance cuts [4].
The variable mineral element content in vine leaves (K, P, Mg, Fe, Cu, Pb, Ni, Cr and Al) has been recorded in relation to that in the soil, and positive correlations have been recorded between most of the elements in the leaves and the grape berry [5]. The essential roles of certain macroelements (P, K, Ca and Mg) and microelements (Mn, Fe, Cu, Zn and B) in the general physiology of vines and in the quality of the grapes and resulting wine have been identified [6].
Varied and contrasting concentrations of macroelements (K, Ca and Mg), microelements (Mn, Cu and Zn) and heavy metals (Pb, Cd and As) have been found in vine leaves and grapes in relation to those in the soil by the authors of [7]. Based on the differences in the recorded concentrations (bioconcentrations for K, Ca and Mg; no accumulation was found for microelements), the authors considered a possible “disconnection” in the process of accumulation of the studied elements. Variations in the concentration of mineral elements (K, Ca, Mg, Zn and Fe) in grapevine and in some biophysical indices and phenological parameters of the flowers and fruits were recorded in relation to foliar treatments with calcium sulfate, potassium sulfate and oil minerals used for vegetable treatments [8]. Reductions in the Mn content in the leaves and berries of grapes (Vitis vinifera L. cv. Mencía) were recorded, as were variations in the quality parameters of the berries, which are associated with the excessive application of calcareous amendments (overliming using dolomite lime) to the acidic soils planted with vines [9].
Some variations in the availability of nutrients for vines have been associated with climatic changes, with some genotypes being more prone to nutrient deficits, which are also correlated with soil conditions [10]. The concentration of elements in vine leaves (e.g., Mg, Mn and Zn) was studied in relation to the use of wastewater for irrigation, without any nutritional imbalances being identified [11]. Some studies have evaluated the physiological state of plants and the identification of early warning signals in relation to potentially damaging thresholds, in response to stress factors and in relation to water and mineral nutrition [12]. Nutrient management and precision fertilization have been studied in relation to machine learning (ML) and ML-based systems for precise, sustainable, environmentally friendly agriculture yielding high-quality products [13].
Moreover, the relationship between grapevine nutrition and fungal infections has been studied, and potassium has been highlighted as a reference element regarding grapevine’s resistance to some pathogens [14]. Statistically significant differences were recorded for the bioactivity of some grape leaf extracts and the content of mineral elements, and potassium had the highest content among the 15 determined elements [15]. Mineral elements are increasingly being studied in relation to the quality of plant resources for human nutrition. From the perspective of the sustainability of food diets, a set of nutritional indicators of sustainability was formulated, associated with areas of interest such as health, education, agriculture and the environment [16]. In addition to classic grapevine products, vines represent a resource of dietary interest and are relevant to the trend of “green menus”. Moreover, “sustainable healthy diets” are a concern of interest, and studies on health-related, socio-economic and environmental indicators under this perspective are underway [17].
From the perspective of the nutritional importance of vine leaves as food, various concentrations of mineral elements have been determined in vine leaf samples (K >> Mg > Ca > > Fe > Zn) in relation to the quality of the soil, irrigation method and climatic and environmental conditions [18]. The contents and profiles of minerals, fatty acids and pigments have been studied recently from the perspective of food consumption in Mediterranean diets and “green diets” by the authors of [19]. The authors identified 21 elements, of which K, Ca and Na were well represented in all seven grape cultivars studied, and Zn was predominant in only some cultivars (e.g., “Pinot Noir” and “Cabernet Sauvignon”). Varied fatty acid and pigment contents were also recorded across the cultivars studied.
Starting from the potential of vines (leaves, grapes and wine) as a source of nutrients in the human diet, Richardson et al. (2021) [7] analyzed the content of mineral elements in leaves, grapes and wine from five vineyards in the USA under differing soil and climate conditions. Transfer factors in the soil–plant relationship and bioconcentration indicated the accumulation of some elements (K, Ca and Mg) in the fruits, while other elements did not accumulate (Fe, Mn, Cu, Zn and Pb).
In the context of the circular economy, the nutritional value of vine leaves was studied from the perspective of valorization in food systems, functional foods and sustainable agriculture [20]. The concentration of metals in different plant food resources, including vine leaves, has been studied from the perspective of food safety [21]. In the case of vine leaves, the authors of the study reported values greater than one only for Ba under the study conditions, raising caution for food consumption. The content of mineral elements in vine leaves has been analyzed from various perspectives, but more important is the presence of certain elements in relation to the productivity and grape quality [22].
The present study stemmed from previous research, but has since taken on a new vision. The aim of the study was the use of mathematical indicators in the analysis of the nutritional status of vines and some elements of productivity and quality in grapes. The objectives of the study are as follows: (i) identifying the relationships between the elements that define plant nutrition using principal components analysis; (ii) investigating the degree of the variation in the content of some elements, understanding these contents as factors that describe the state of nutrition (the content of mineral elements; physiological indices), under the action of different fertilization methods; (iii) investigating the degree of variation in some elements in relation to productivity and grape quality under the action of different fertilization methods.
2. Materials and Methods
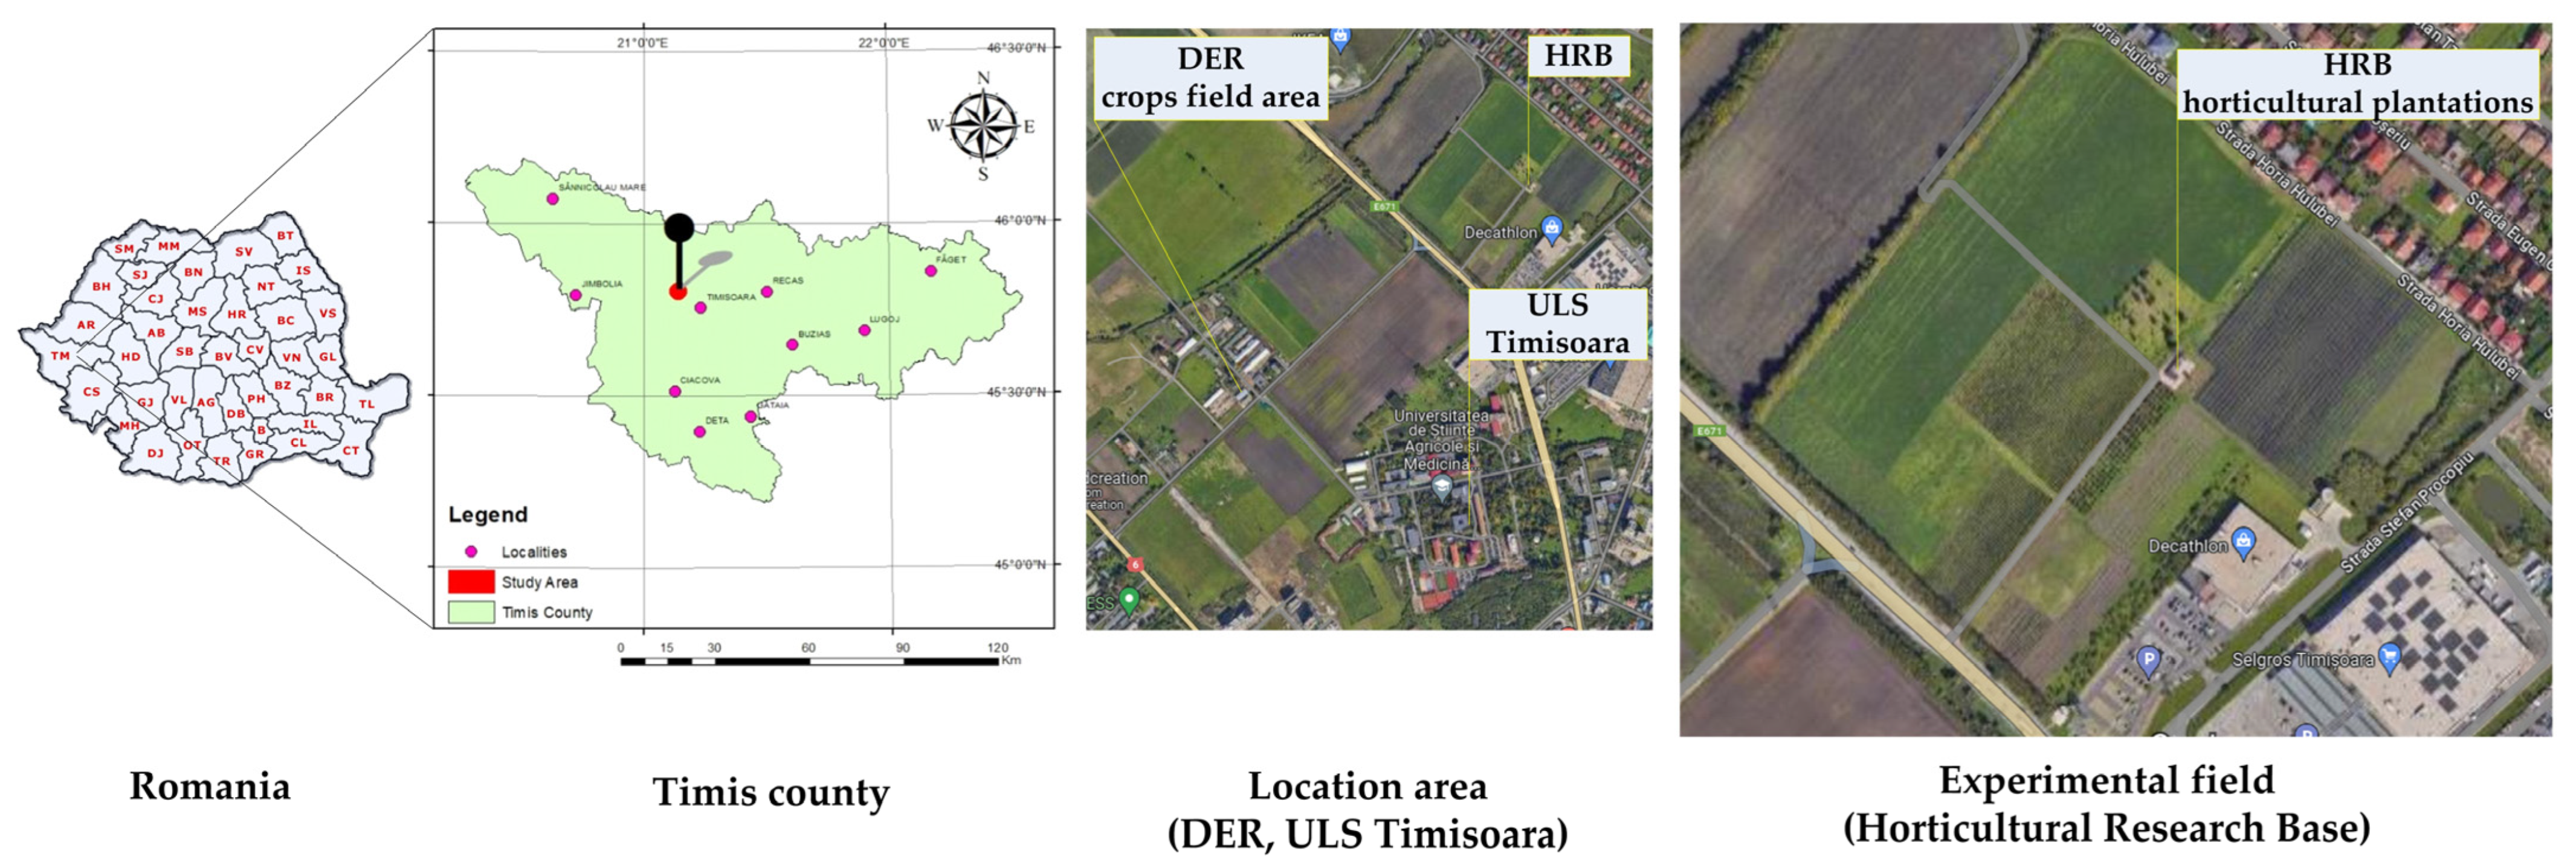
This study was conducted at the Horticultural Research Base (HRB), Didactic and Experimental Resort (DER), University of Life Sciences “King Mihai I” from Timisoara (ULS), Timis County (Banat region), Romania (Figure 1). This research took place over several years, and for the present paper, results from the 2011 to 2013 agricultural years were considered.
2.1. Soil and Climate Conditions
The vineyard of the Didactic Experimental Resort, Horticultural Research Base, is located on cambic, bathygleic, orthocalcic chernozem, clay loam/clay loam soil on medium-fine loessoid deposits, with groundwater at a depth of 1.5–2.0 m. The main agrochemical soil properties at depths of 0−20 cm and 20−40 cm are presented in Table 1. Determinations were made within the Timisoara OSPA Laboratory, a RENAR-accredited laboratory.
Timisoara primarily registers air currents from the northwest (13%) and west (9.8%) winds, a reflection of the activity of the Azores anticyclone, with maximum extension in the summer months. In April–May, southerly winds also have a high frequency (8.4% of the total). The annual average number of sunshine hours in Timisoara is around 2244.97 h, ensuring the necessary light is available for grapevine cultivation. The average date of the first frost (minimum temperature < 0 °C), according to the Timisoara Meteorological Station, is 29 October, and that of the last spring frost is 11 April.
2.2. Biological Material and the Plantation System
The biological material in this study was grapevines of the ‘Burgund mare’ vine cultivar. The ‘Burgund mare’ cultivar is part of the same group as ‘Pinot noir’, the “Proles occidentalis” group. The adult leaf is entirely or slightly trilobed and dark green in color. The grapes are medium and cylindrical–conical, with dense berries. The berries are medium-sized, spherical, and violet-red in color; they are covered with a thick skin and uncolored flesh. The ‘Burgund mare’ cultivar has great vigor compared with ‘Pinot noir’. The planting distance was 2 m between rows and 1 m between plants per row, with a nutrition surface of 2 m−2 plt−1. The plantation did not use an irrigation system. Soil was maintained through repeated passes with the tiller between the rows, and manual corrections per row as needed [24].
2.3. Fertilization Variants
To generate differentiated plant nutrition, organic fertilizations (manure), mineral fertilizations (NKP complex fertilizers) and foliar fertilizations (Fertitel, Cropmax and Waterfert; foliar fertilizers were used alone and combined with Ca) were applied. Manure (fermented) was applied in the fall and incorporated into the soil through tillage in doses of 30 t ha−1 (T2), 40 t ha−1 (T3) and 50 t ha−1 (T4). The complex mineral fertilizers (N:P:K:Zn = 15:15:15:1%) were applied in autumn and incorporated into the soil in doses of 50 kg ha−1 a.s. (a.s.—active substance, based on 15% of the macronutrient) (T5), 100 kg ha−1 a.s. (T6) and 150 kg ha−1 a.s. (T7). The foliar fertilizers were applied during the vegetation period, in three treatments. The first treatment was applied before flowering (code BBCH 5, Inflorescence emergence) [25], and the following two treatments were applied in intervals of 10 days. Foliar fertilizers were applied alone and in the following combinations with foliar Ca (Calcio Plus): Fertitel (T8) and Fertitel + Ca (T9); Cropmax (T10) and Cropmax + Ca (T11); Waterfert (T12) and Waterfert + Ca (T13). Three rows of each variant were planted, with ten plants in each row, in three repetitions, with randomized placement.
According to the leaflets of the foliar fertilizers used, brief characterization was conducted. Fertitel: The product contained the following elements: nitrogen (N)—6.7%, of which amino nitrogen made up 2.5% and urea nitrogen made up 3.3%; phosphoric anhydride (P2O5)—6.0%; potassium oxide (K2O)—4.2%; copper (Cu)—0.025%; iron (Fe)—0.100%; manganese (Mn)—0.010%; zinc (Zn)—0.008%, chelated with EDTA; boron (B)—0.020%; and molybdenum (Mo)—0.001%. The product was applied in a concentration of 2 L ha−1. Cropmax: The contents per 1 L of the product were as follows: nitrogen (N)—0.2%; phosphorus (P)—0.4%; potassium (K)—0.02%; iron (Fe)—220 mg L−1 ; magnesium (Mg)—550mg L−1; zinc (Zn)—49 mg L−1; copper (Cu)—35 mg L−1; manganese (Mn)—54 mg L−1; boron (B)—70 mg L−1; Ca, Mo, Co and Ni—10 mg L−1 of each; plant growth stimulants—auxins, chitokinins and gibberellins; organic amino acids; vegetable vitamins; and plant enzymes. The product was used in a concentration of 0.5 L ha−1. Waterfert: The product consisted of NPK (Mg-S) 8-12-24 (3-32) with trace elements obtained by mixing; it was a crystalline product, soluble in water. The trace elements in the product were as follows: total nitrogen (N)—8%, of which nitric nitrogen () accounted for 2.7% and ammoniacal nitrogen () accounted for 5.3%; phosphoric anhydride (P2O5), soluble in water—12%; potassium oxide (K2O), soluble in water—14%; magnesium oxide (MgO), soluble in water—3%; sulfuric anhydride (SO3), soluble in water—32% (the pH range that guarantees the good stability of the chelated fraction is 3–8); boron (B), soluble in water—0.01%; copper (Cu), chelated with EDTA—0.01%; iron (Fe), chelated with EDTA—0.02%; manganese (Mn), chelated with EDTA—0.01%; molybdenum (Mo), soluble in water—0.005%; and zinc (Zn), chelated with EDTA—0.01%. The product was used in a concentration of 4 kg ha−1. Calcio Plus: The product contained the following elements: total calcium (Ca)—10.7% P/P, equivalent to 15.9% P/V, 159 g L−1; complexed calcium (Ca)—8.7% P/P, equivalent to 12.8% P/V, 128 g L−1. The product was applied in a concentration of 250 ml hl−1.
2.4. Leaf Sampling and Determination
Vine leaf samples were taken 10 days after the third foliar treatment. Leaves opposite the cluster were randomly harvested (ten leaves) for each experimental variant and repetition. Fresh leaf samples were used to determine physiological indices (leaf area—LA; chlorophyll—Chl). Dried leaf samples were later used to determine the content of mineral elements.
2.4.1. Physiological Indices
The leaf area was determined based on the dimensions of the leaves (L, w) and a correction factor (CF = 0.92), as shown in Equation (1):
where LA—leaf area (cm2); L—leaf length (cm); w—leaf width (cm); and CF—correction factor (CF = 0.92).
Chlorophyll content (SPAD units) was determined with a portable chlorophyll meter, SPAD 502Plus (Konica Minolta Sensing Inc., Tokyo, Japan).
2.4.2. Mineral Element Contents in Leaves
Dry leaf samples (blades without the petiole) were used to determine the of mineral element contents (in total forms) in the leaves (N, P, K, Ca, Mg, Fe, Mn, Cu and Zn). The determinations were obtained via certified laboratory methods at Minear Laboratoare, a RENAR-accredited laboratory (https://www.minearlaboratoare.ro/, accessed on 17 October 2023).
2.5. Elements of Productivity and Quality
When the grapes were ripe for harvesting, random samples of grapes were taken from each variant to determine the production of grapes per plant (full harvest of grapes from 10 plants, random). Based on the recorded data, the production of grapes per unit of area (t ha−1) was calculated. The sugar content and acidity were determined using the harvested samples of grapes. The sugar content (g L−1) and the acidity of the grape berry (H2SO4 g L−1) were also determined for fresh extract from the berry (must).
2.6. Statistical Analysis of Experimental Data
The experimental data were processed in accordance with the objectives of the study using principal component analysis in JASP software version 0.16.4 [26]. Statistical tests were applied to evaluate the differences between the data series and the calculation of other indicators using PAST software version 4.02 [27]. The source files used in data processing as well as for the purpose of tabular calculation were processed using Microsoft Excel.
3. Results
The type of fertilization applied (organic, mineral or foliar) resulted in the differentiated nutrition of the vine under the study conditions. The values resulting from the analysis of the mineral element content (macro- and micro-elements) and the physiological indices (LA; Chl) of the leaf samples are presented in Table 2.
The macro-element content varied between 1.78 and 2.56 ± 0.071% in the case of nitrogen (N), between 0.19 and 0.51 ± 0.030% in the case of phosphorus (P), between 0.24 and 0.68 ± 0.028% in the case of potassium (K), between 0.26 and 0.48 ± 0.020% in the case of calcium (Ca), and between 0.16 and 0.37 ± 0.015% in the case of magnesium (Mg). The trace element content varied between 6.20 and 11.20 ± 0.385 mg kg−1 in the case of copper (Cu), between 60.80 and 143.00 ± 5.921 mg kg−1 in the case of iron (Fe), between 14.90 and 86.20 ± 5.764 mg kg−1 in the case of manganese (Mn), and between 5.60 and 14.60 ± 0.811 mg kg−1 in the case of zinc (Zn). In the case of physiological indices, the leaf area (LA) varied between 99.96 and 150.86 ± 3.131 cm2, and the chlorophyll content (Chl) varied between 30.35 and 38.08 ± 0.560 SPAD units.
At harvest maturity, grape production per plant (kg/vine) and production per surface unit (Y/ha) were determined. Sugar content (Gb-Sug) and acidity (Gb-Ac) were determined as quality indices for grape berries (Table 3). Grape production per plant (kg/vine) varied between 1.84 and 2.93 ± 0.105 kg plt−1, and production per surface unit (t/ha) varied between 8.15 and 11.91 ± 0.360 t ha−1. The content of sugars in the grape berries (Gb-Sug) varied between 212.43 and 227.22 ± 1.377 g L−1, and the acidity (Gb-Ac) varied between 4.63 and 4.81 ± 0.015 g L−1 H2SO4.
3.1. Factors Hierarchy—Nutritional Elements and Physiological Indices
Plant nutrition is determined by a large number of mineral elements (macro- and micro-elements), and the contents of these elements in a fertilizer experiment vary with the number of variants. The analysis of the state of nutrition through foliar diagnosis (leaf samples) results in large data sets that are often relatively difficult to interpret. There is therefore a need to use methods that can reduce the dimensionality of large data sets, in other words, simplification without loss of information, to obtain a clearer interpretation of the data. In the context of such situations, multivariate analysis (PCA—principal component analysis) is an appropriate method.
PCA can be performed extremely quickly. It involves three main stages: data correlation analysis, the interpretation of eigenvectors and the calculation of the synthetic (combined) values of the principal components. PCA yields precise diagrams showing sets of parameters that can often be affected by uncertainties. The application of organic, mineral and foliar fertilizations generated differentiated nutritional contents in the experimental vine plants, which were quantified via the content of nutritional elements in the leaves (macro- and micro-elements) and via the physiological indices (LA, Chl). In the comparison of the group of factors that define the nutritional status of the vine plants (quantitative—nutrient content; functional—LA and Chl), multivariate PCA analysis was used to highlight groups of factors (items) that behave similarly.
The analyzed factors (n = 11) are represented by the mineral elements from the leaves (N, P, K, Ca, Mg, Fe, Mn, Cu and Zn) and physiological indices (LA; Chl). Table 4 presents the factors grouped within four components in the form of component loadings (in terms of the Chi-squared test, model value = 34.980, df = 17, p = 0.006).
Table 4 contains the loadings of each factor for a particular component. Positive values indicate direct action and negative values indicate reverse action. High absolute value loadings (close to +/−1) have very strong action in that component, while values close to 0 indicate low action in that component.
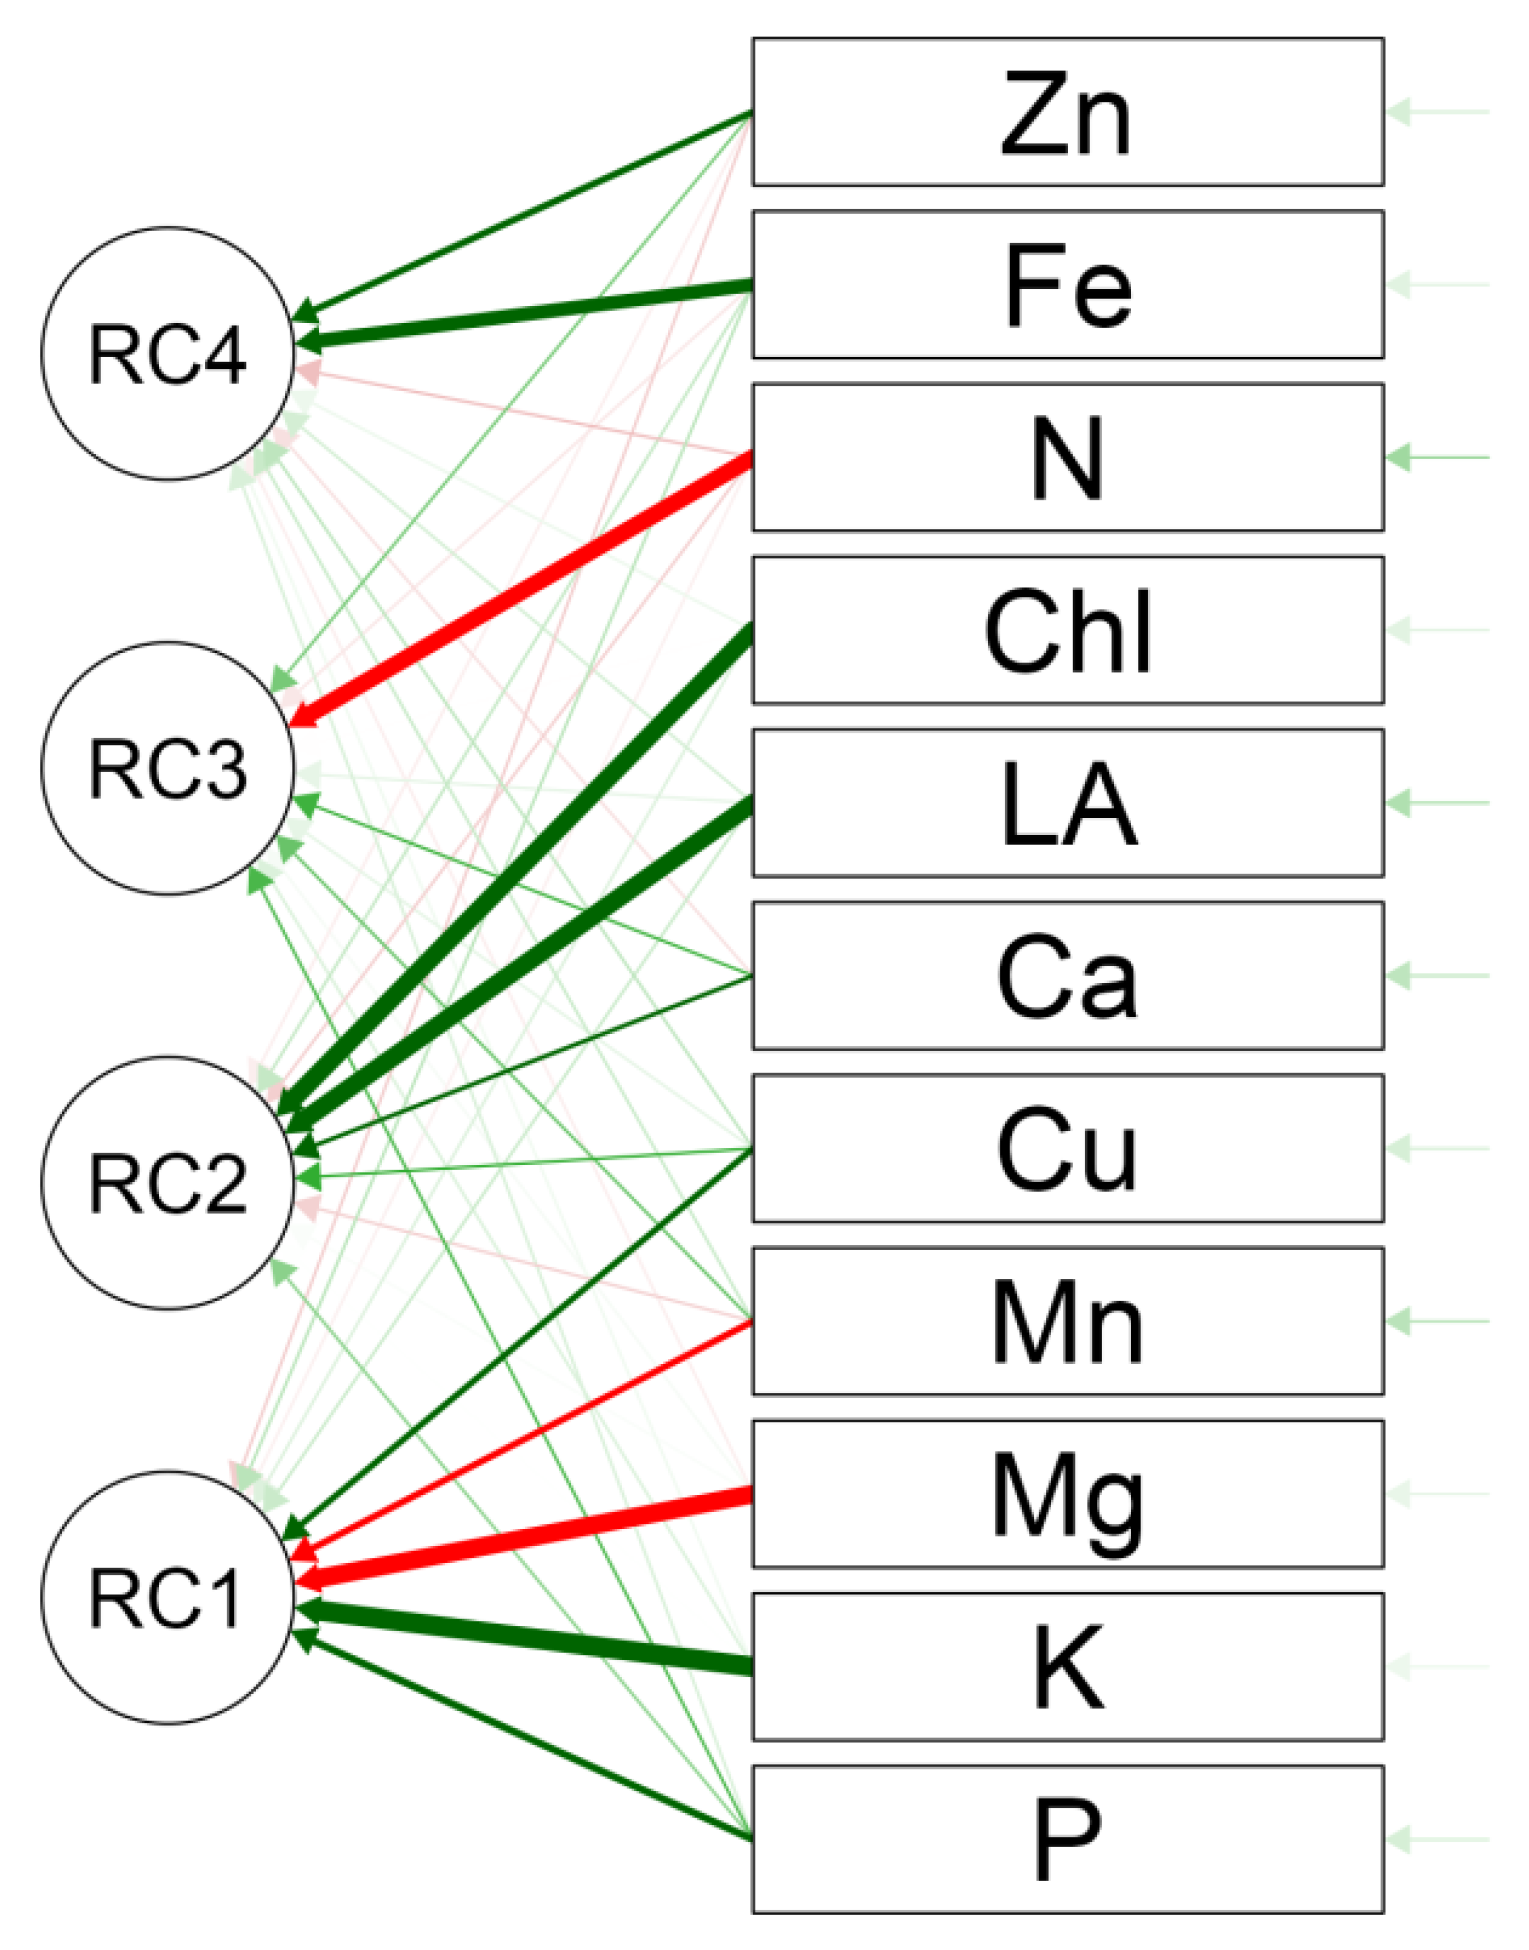
Table 5 shows the component characteristics generated via the PCA. The table indicates the proportion of variation explained by the determined components. The tracked values are those from the rotated solution group. The orthogonal Varimax rotation method was used. Based on the PCA, the path diagram in Figure 2 was generated.
The factorial analysis diagram (multiparameter) facilitated the visual representation of the correlations between the variables expressing the state of nutrition and physiological functionality in the vines in a space with n dimensions (n = 11 in the case of this study). The obtained representation facilitated the identification of a possible model of the proximity and relationships of the groups of variables (four groups, RC1 to RC4), as well as possible relationships between them and the components (nutritional elements and physiological indices as factors).
3.2. Factor Value Verification Tests
Starting from the clarification of the factors in each component (i.e., the loadings of each factor for a specific component), analyses were conducted for the data series of each factor for each experimental variant in relation to the control variant (T1). An evaluation of the differences between the results obtained at the level of the control variant (T1) and the results obtained at level of the variants (T2–T13) was carried out using the parametric one-sample t test, as well as the non-parametric Wilcoxon test. For each data series related to T1-T13 regarding the values of P, K, Mg, Mn, Cu, Chl, LA, Ca, N, Fe and Zn, the null hypothesis stated that the mean/median values do not differ from the control variant T1. A threshold value of α = 0.05 was used. To visually reveal the responses at the level of the T1–T13 variants, boxplot diagrams were used. To construct boxplots, along with the statistical summary, the Past 4.0 application was used. The variability in the series was evaluated starting from the calculated coefficients of variation, using the following expression: 0–20%, homogeneous series; 20–30%, relatively heterogeneous; and values greater than 30%, heterogeneous.
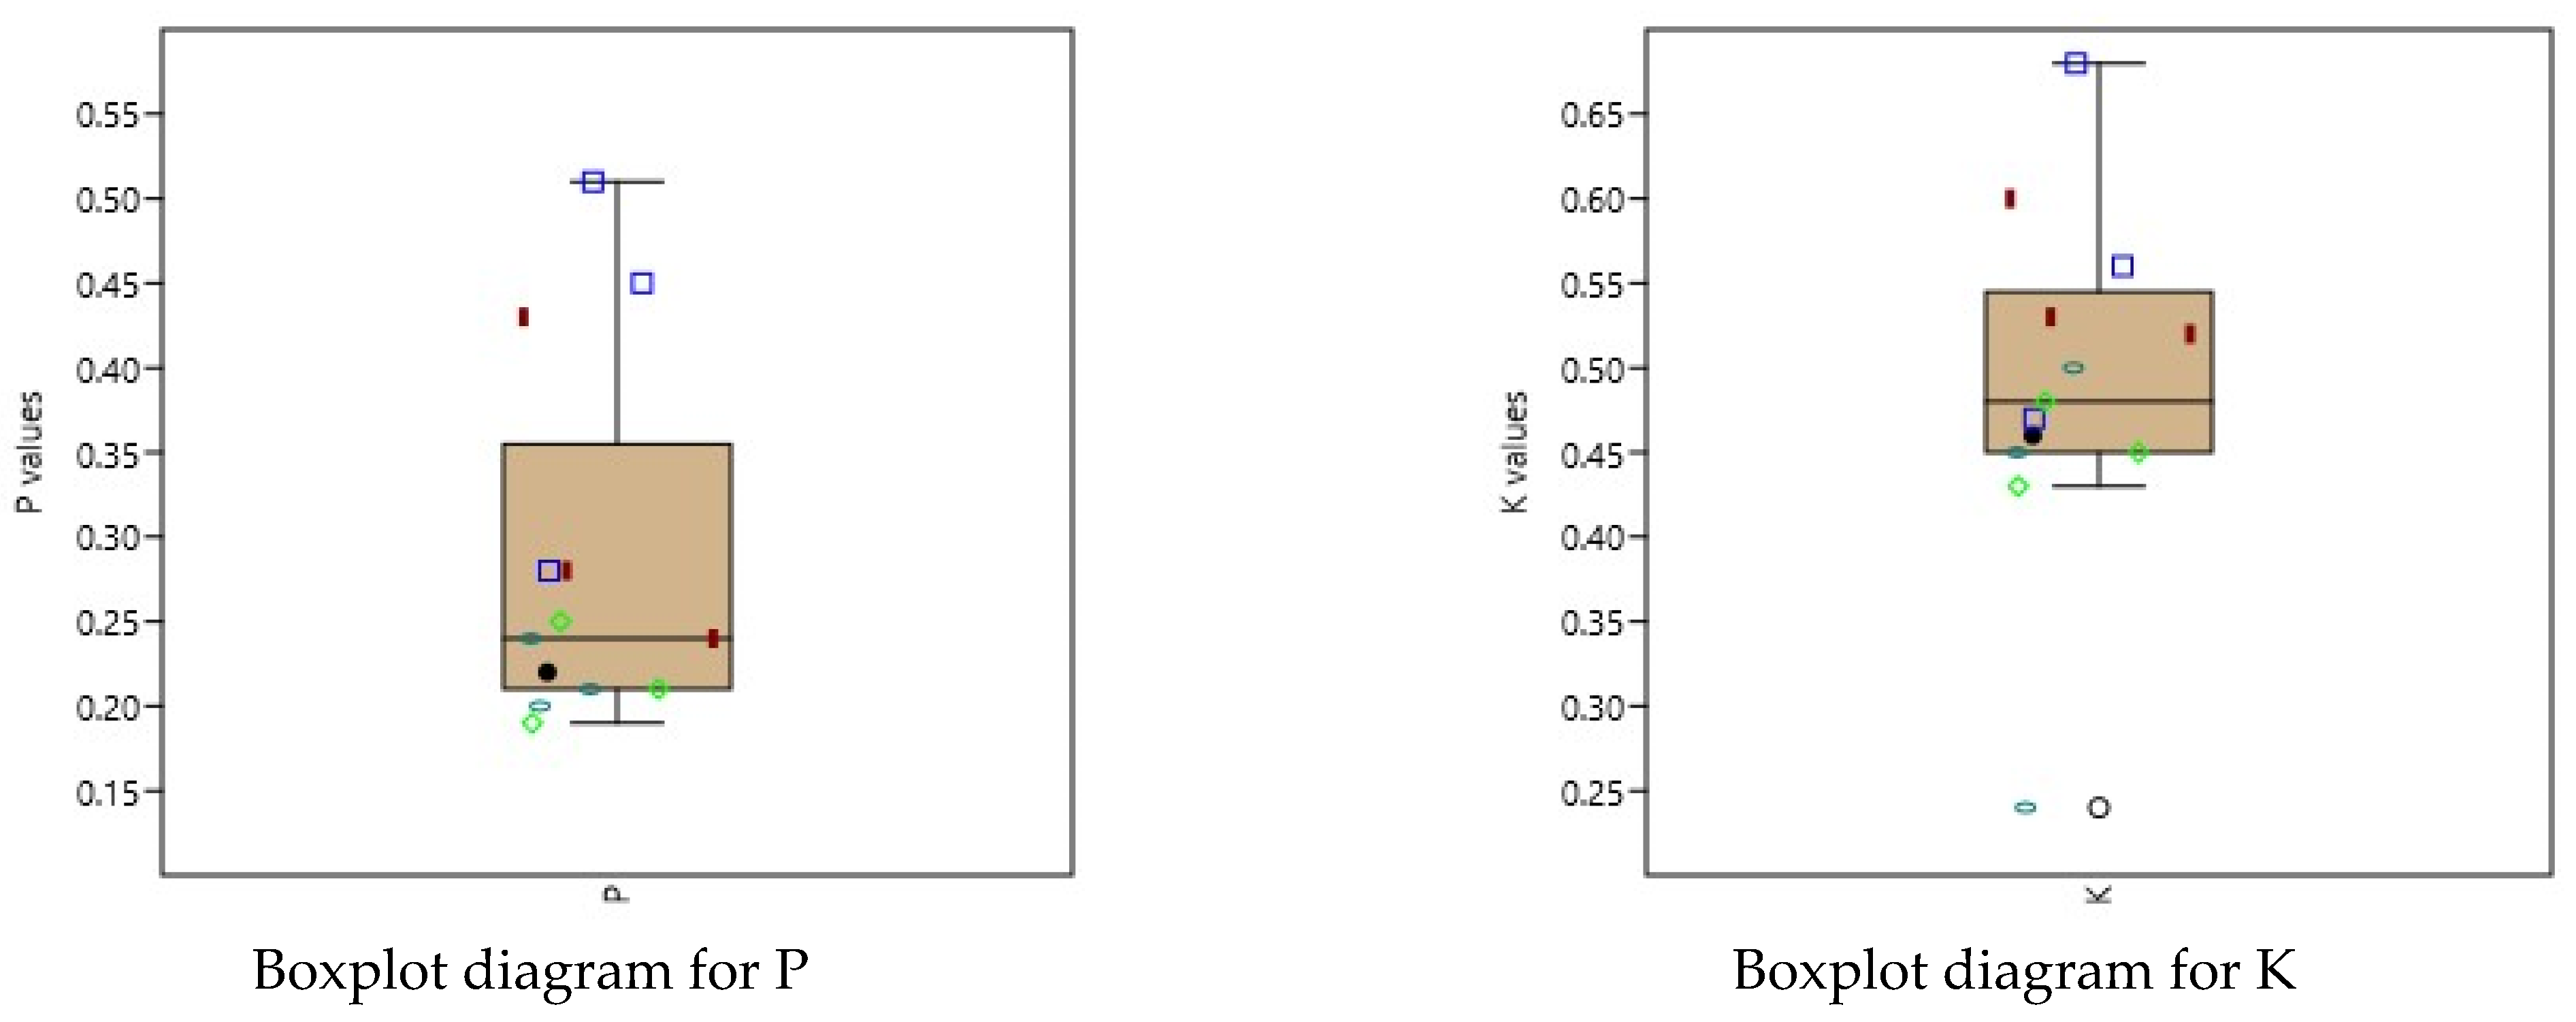
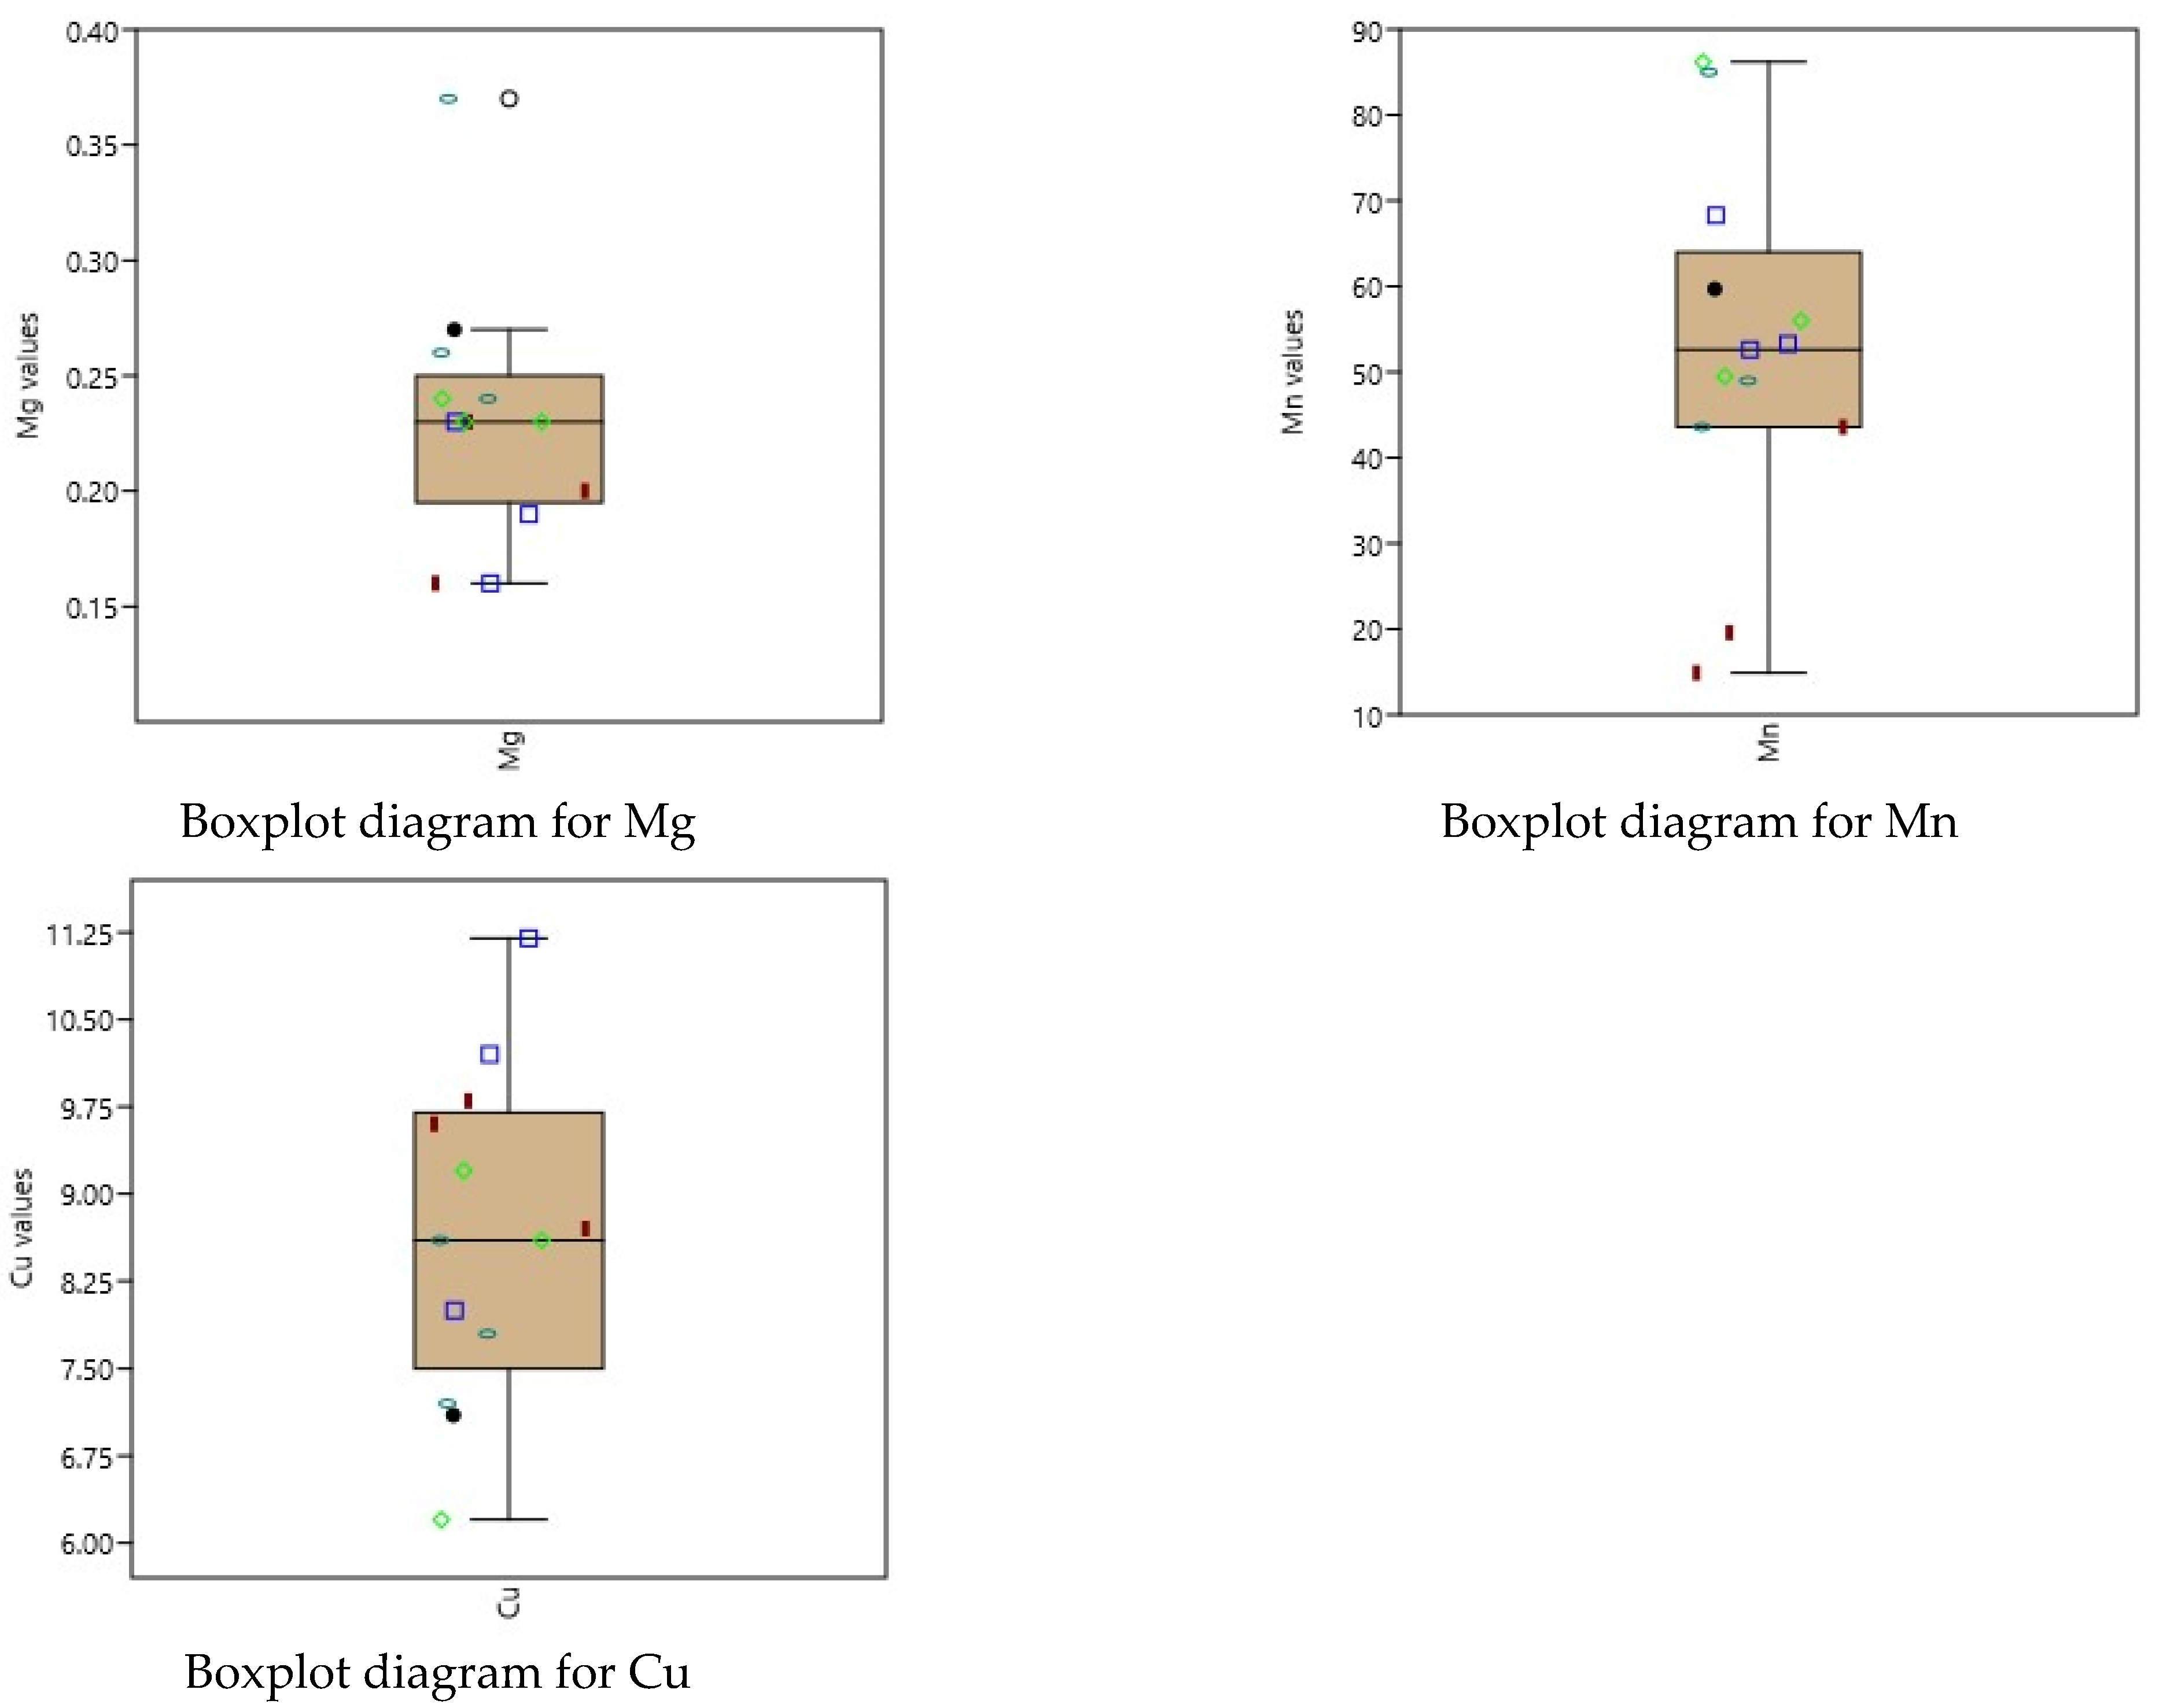
Concerning the elements from the first component, PC1, the potassium content, with the values t = 1.05 and p = 0.31, and the Mn content, with t = −1.26 and p = 0.22, showed insignificant differences compared with the control variant (T1). In the case of the other elements in PC1, namely P, Mg and Cu, the null hypothesis was rejected, as significant differences compared with T1 were indicated. Specifically, regarding the phosphorus content, the mean of the results was Pm = 0.28, which was significantly different from the control value of 0.22, with the significance of the differences being given by t = 2.21 and p = 0.04. With the null hypothesis being rejected, we found that the control variant led to a different response in relation to the phosphorus content series obtained for all fertilization variants. Likewise, in the case of Mg, the result was t = −2.58 and p = 0.02, with the average of the series being different from the control value of Mgm = 0.23 ≠ 0.27. In the case of Cu, the result was t = 3.97 and p = 0.0001, with the average of the series also being different compared with the control value of Cum = 8.63 ≠ 7.1. The statistical data related to the elements in PC1, namely P, K, Mg and Mn, showed responses related to fertilization variants T1–T13 characterized by high variability, and were determined to be in a heterogeneous series with a coefficient of variation greater than 20%. Only the Cu values from PC1 did not present a heterogenous series, the responses being homogeneous, as indicated by the coefficient of variation of 16.07% (Table 6).
Within the boxplot diagrams related to PC1 (Figure 3), an approximately similar grouping was noted in the value axis of the elements from the control variant (T1), the organic fertilization variants (T2, T3 and T4), the complex mineral fertilization variants (T5, T6 and T7), the foliar fertilization without calcium variants (T8, T10 and T12) and the foliar fertilization with Ca variants (T9, T11 and T13).
In the case of the elements from the second component, PC2, namely Chl, LA and Ca, the null hypothesis was rejected in all instances; that is, the responses of the control variants were different from the tested series. More specifically, in the case of Chl, the response values were t = 6.37 and p < 0.001, with the mean of the series being different from the control value of Chlm = 33.92 ≠ 30.35. In the case of LA, the response values were t = 7.27 and p < 0.001, with the average of the series being different from the control value of LAm = 122.74 ≠ 99.96. Finally, in the case of Ca, the response values were t = 4.74 and p < 0.001, with the average of the series being different from the control value of Cam = 0.35 ≠ 0.26. The statistical data of the elements in PC2, namely Chl and LA, have a homogeneous characteristic, except for Ca, where the coefficient of variation is CV = 20.63, a value that indicates a relatively heterogeneous series (Table 6). The boxplot diagrams in Figure 4 show an approximately similar grouping in the value axis of the elements in relation to similar fertilization variants.
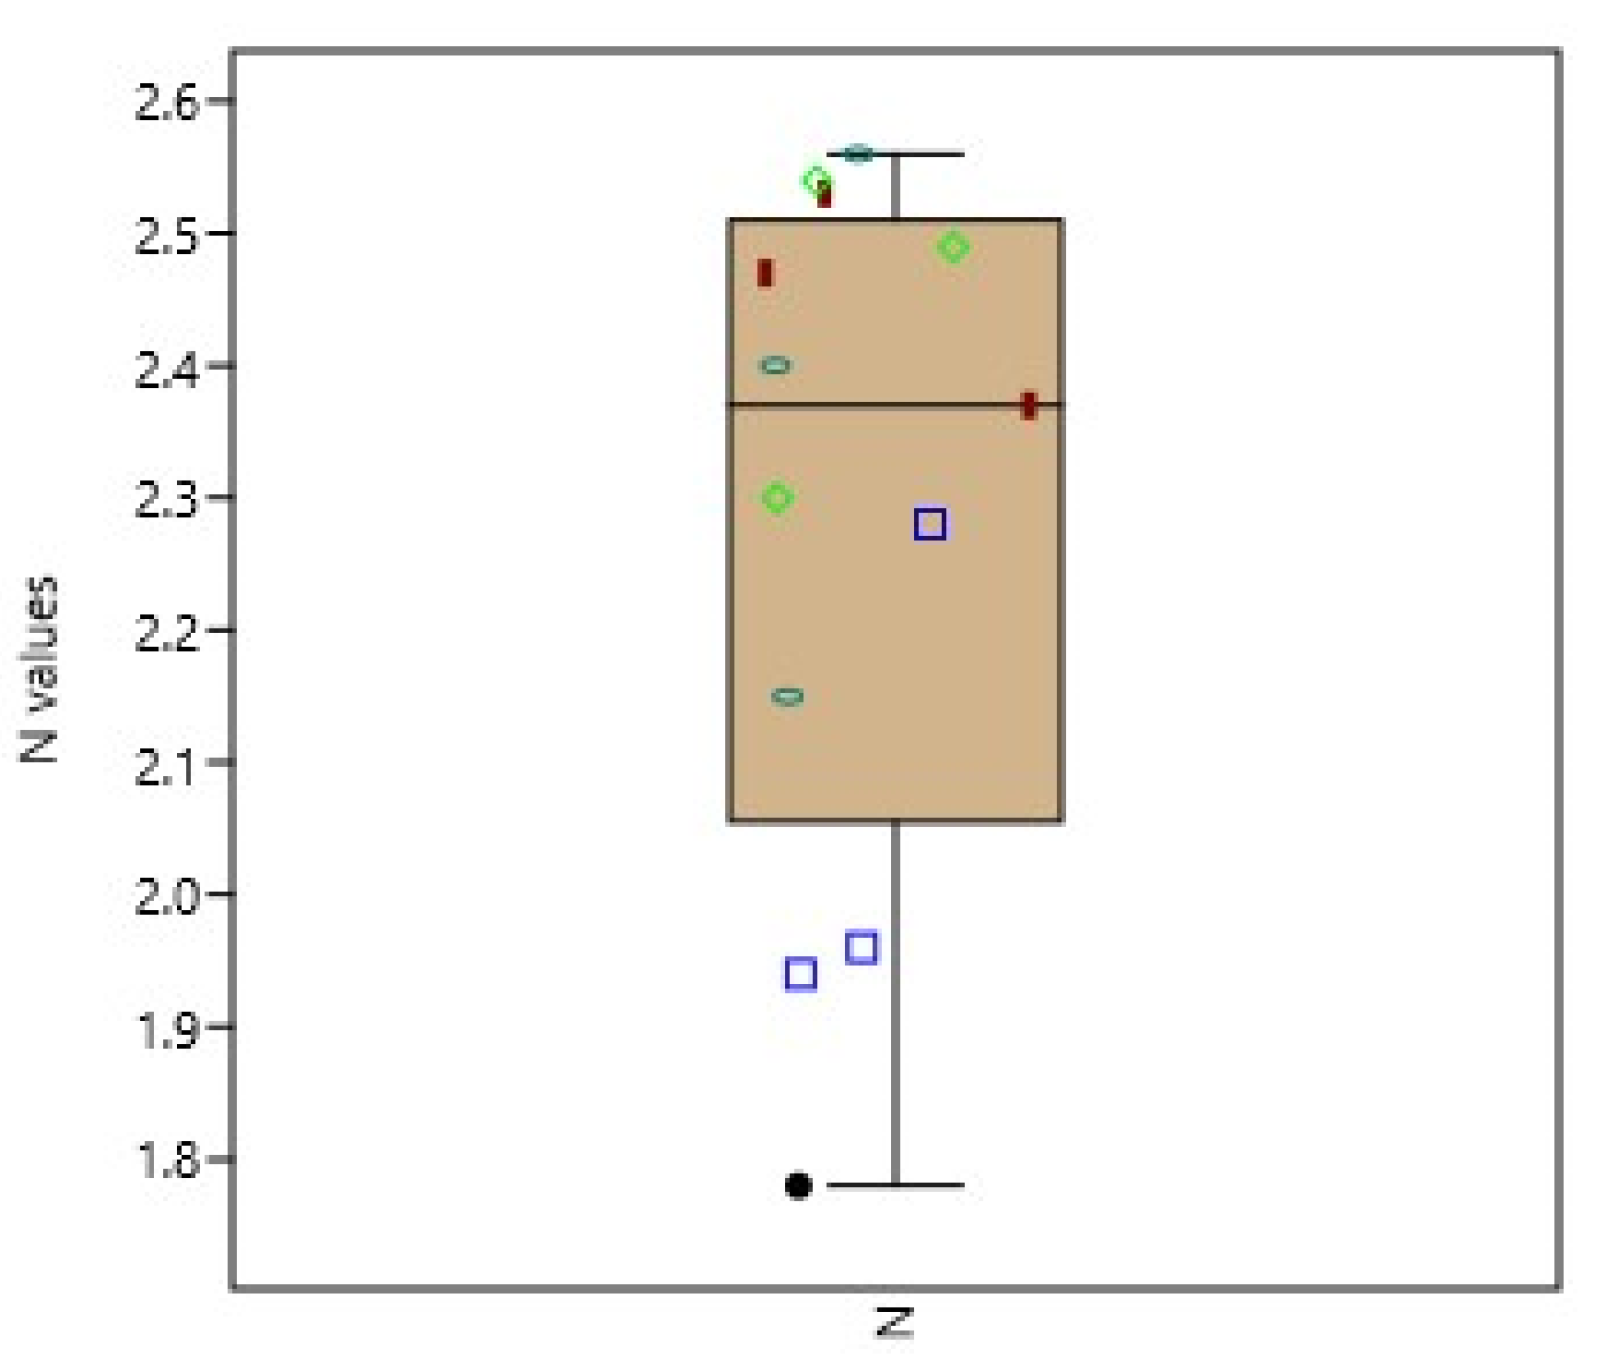
In the PC3 component, nitrogen presented significant differences compared with the control value of Nm = 2.29 ≠ 1.78, indicated by t = 7.14 and p < 0.001. The series of N values is homogeneous, having a coefficient of variation equal to 11.24% (Table 6). At the PC3 level, the boxplot diagram indicates an approximately similar grouping in the value axis of the elements in relation to the fertilization variants (Figure 5).
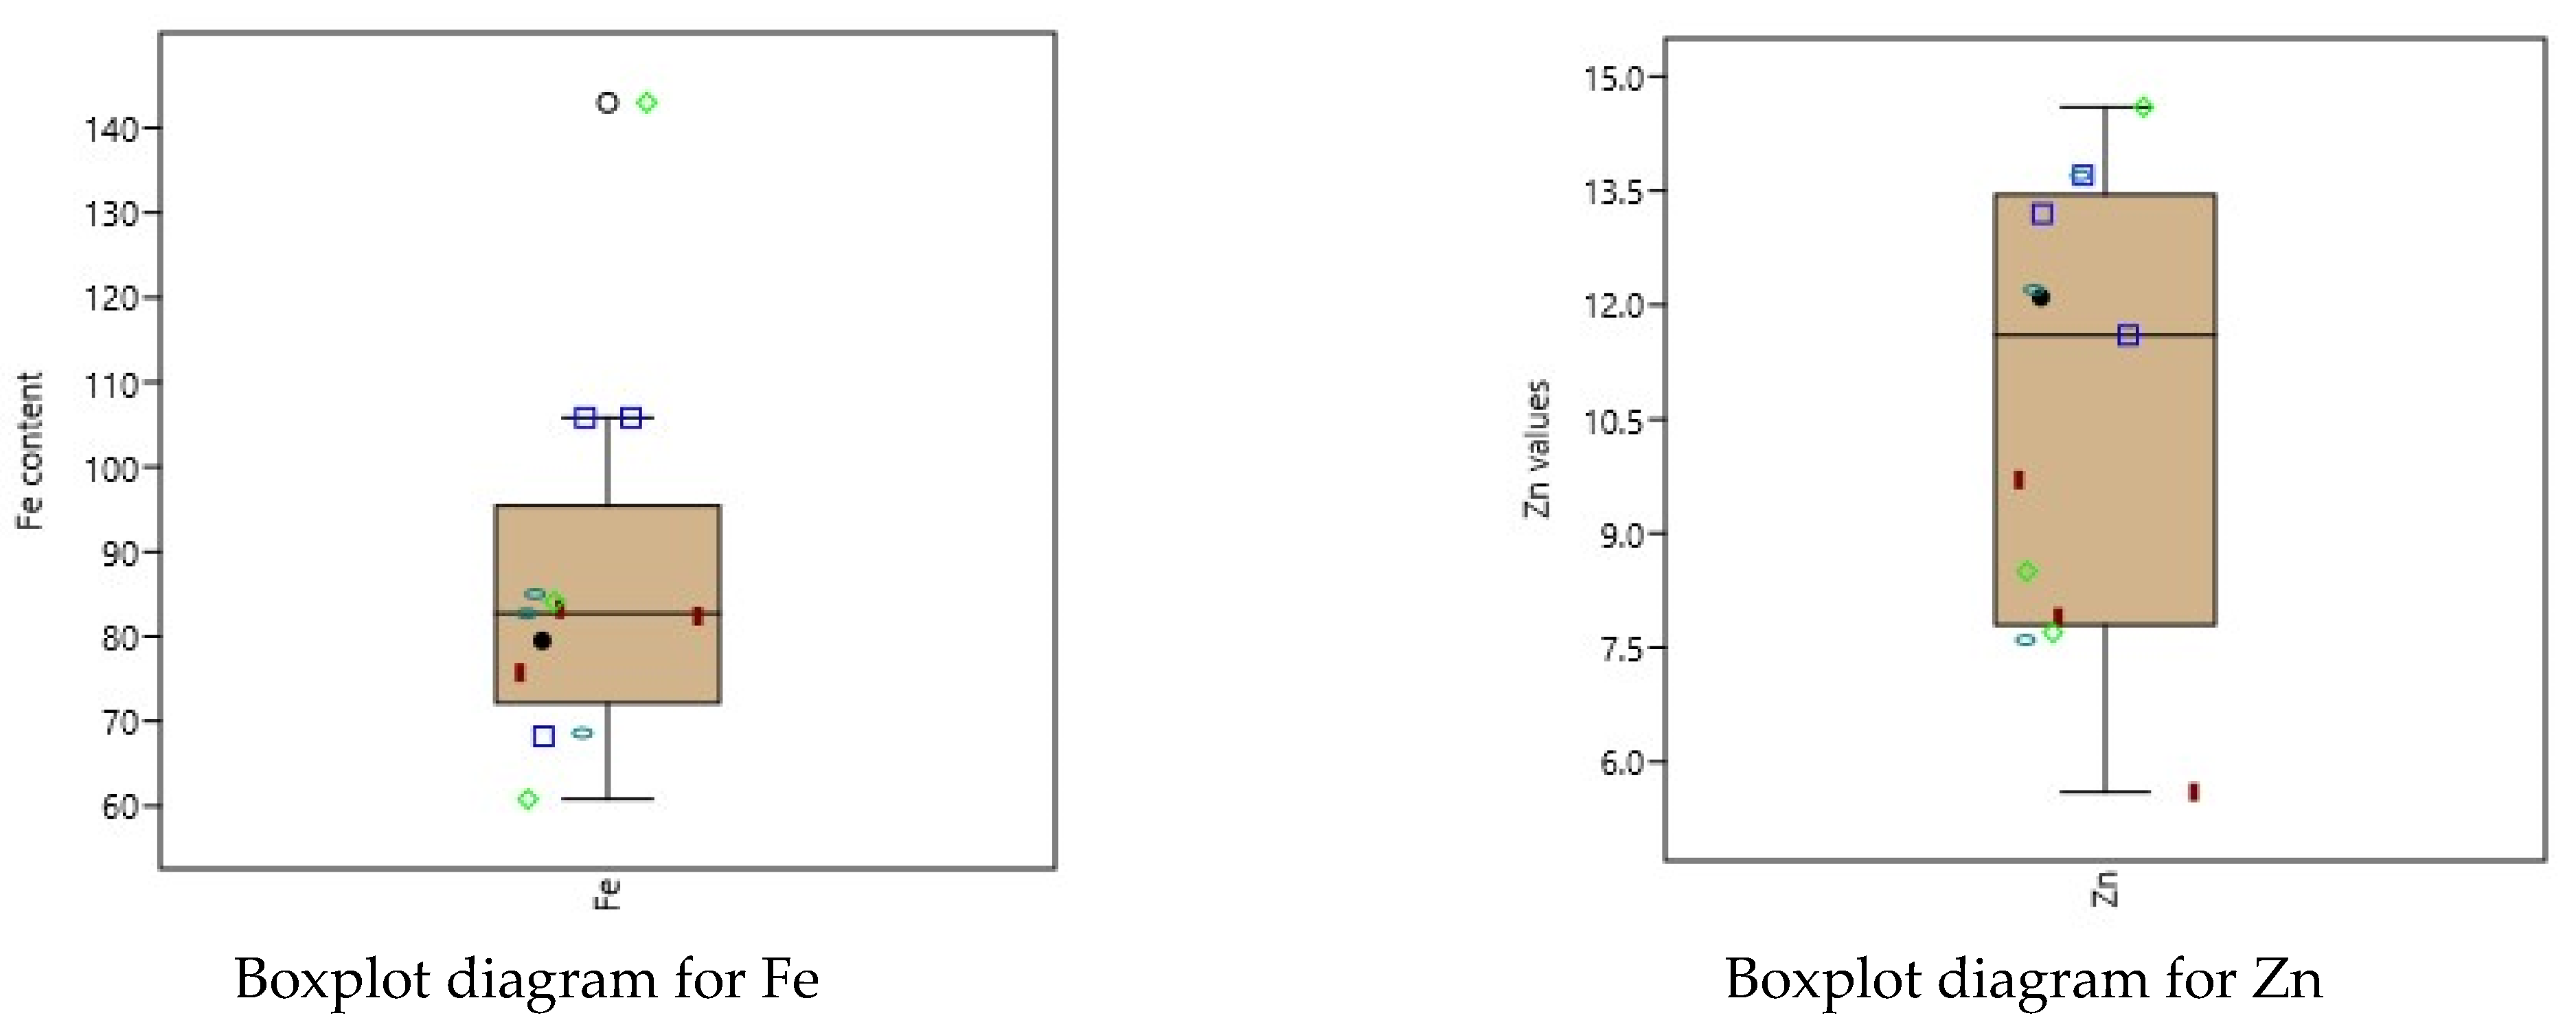
In the fourth main component, PC4, the mean values of Fe and Zn do not show significant differences compared with the reference values. The values of the Fe and Zn series are relatively heterogeneous, as indicated by the coefficients of variation of 24.6% for Fe and 27.5% for Zn (Table 6). The elements from PC4 shown in the boxplot diagram indicate similarly positioned groups for the elements from similar fertilization variants (Figure 6).
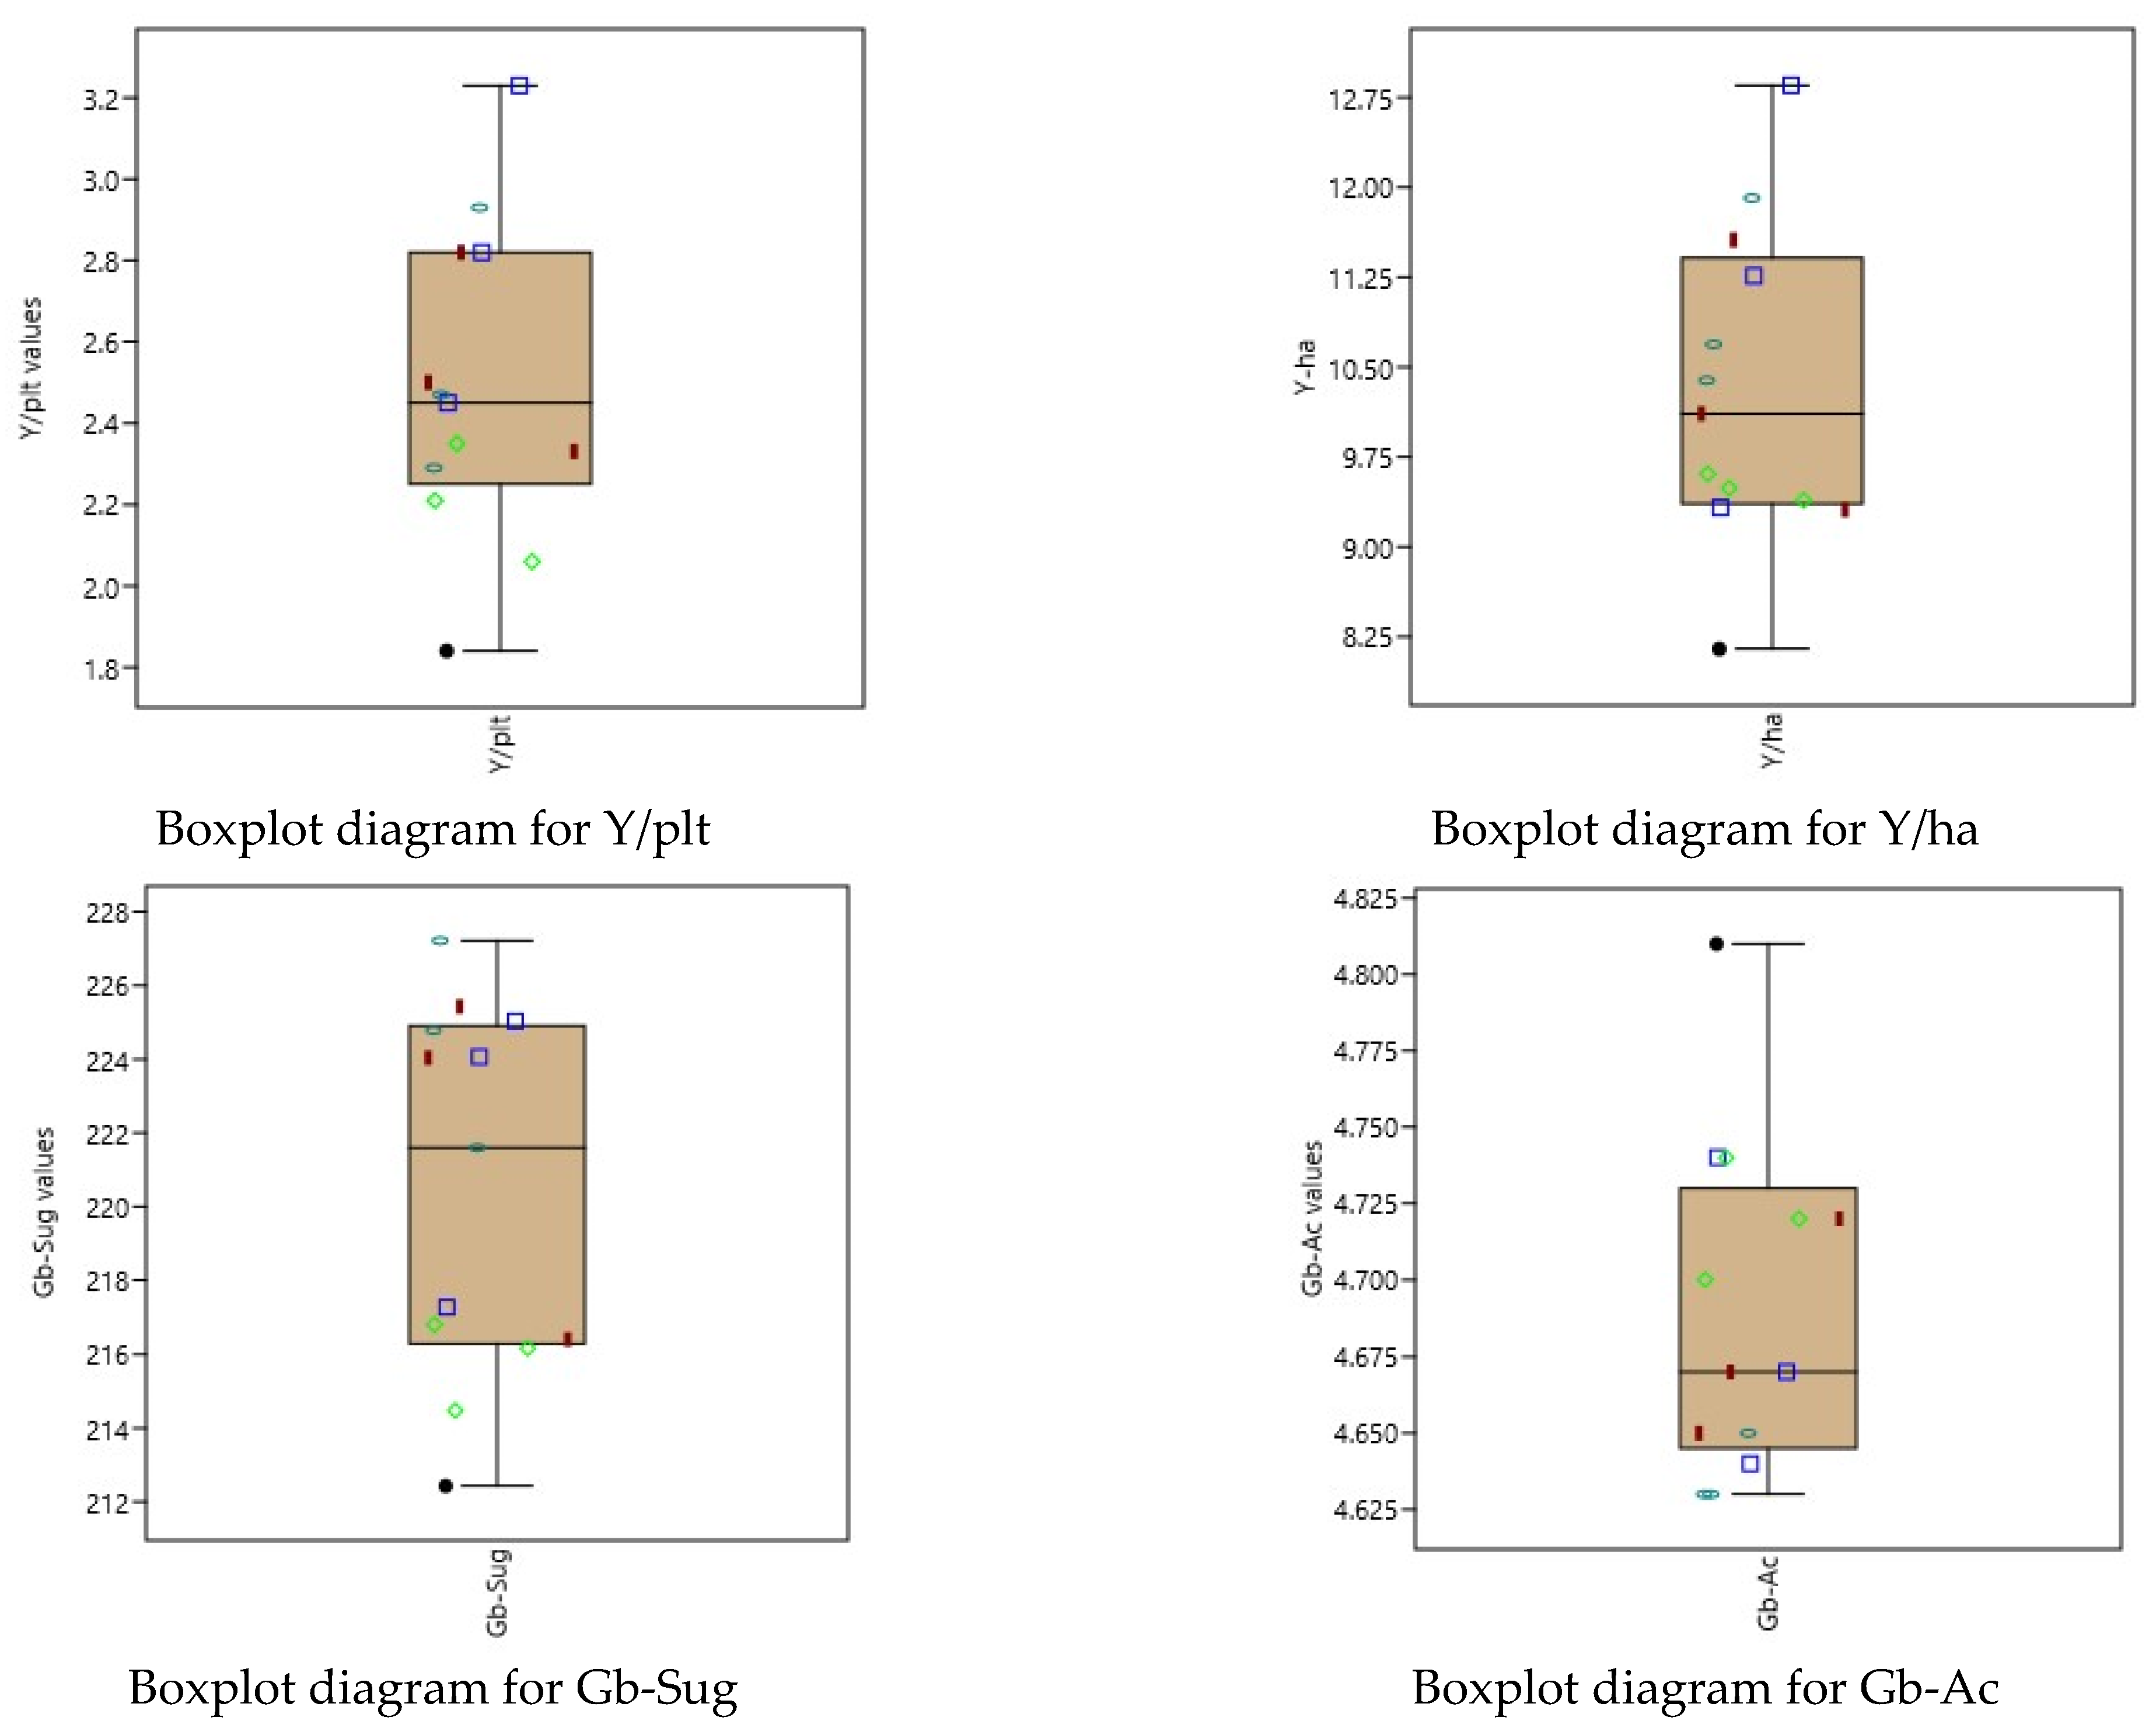
The production and quality elements studied, namely Y/plt (kg plt−1), Y/ha (t ha−1), Gb-Sug and Gb-Ac, all present significant differences compared with the control variant. More precisely, in the case of Y/plt, the response values were t = 6.11 and p < 0.001, with the mean of the series being different from the control value of Y/pltm = 2.48 ≠ 1.84. In the case of Y/ha, the response values were t = 5.99 and p < 0.001, with the mean of the series being different from the control value of Y/ham = 10.31 ≠ 8.15. In the case of Gb-Sug, the response values were t = 5.81 and p < 0.001, with the mean of the series being different from the control value of Gb-Sugm = 220.44 ≠ 212.43. Finally, in the case of Gb-Ac, the response values were t = −8.01 and p < 0.001, with the mean of the series being different from the control value of Gb-Acm = 4.69 ≠ 4.81. All series showed a homogeneous character, according to the coefficients of variation (Table 6). The boxplot diagrams also indicate similarities in the case of the production and quality elements in relation to the types of fertilization variants applied (Figure 7).
For all the previously indicated items, the use of the non-parametric Wilcoxon test led to results similar to those of the parametric version of the one-sample t test.
4. Discussion
Given that agriculture is essential for the economy, and that soil is essential for sustainable agricultural production, models and techniques that describe the distribution of elements in the soil and plants, and the functional relationship of the soil–plant system, have proven to be useful [28]. Furthermore, photosynthesis, as a process of converting solar energy into biochemical energy, indicates the productivity of plant systems and agricultural crops; moreover, along with other factors, mineral elements play different roles in photosynthesis [29,30].
The contents of mineral elements in plants were analyzed in relation to the quality of plant production using different data-processing methods, algorithms, models and predictions [31].
Determining a general profile of the chemical contents of different parts of a plant is often a difficult undertaking that involves the use of specific and detailed tests. Often, a large portion of the obtained information is not entirely useful, and the amount of data generated can be difficult to use [32]. Studies at the level of the entire living world have unequivocally indicated interdependent relationships between certain chemical elements, biochemical compounds, etc. [33,34]. The presence of some elements influences the presence/absence of other elements and the form in which they appear; these quantitative aspects can be estimated by following well-defined target elements. Groups identified in this way can provide a simplified image that leads to the identification of possible summary elements. The utility, however, is not limited to the reduction in the dimensionality of the statistical data: the grouping of the tracked elements in plants also allows for a better understanding of their characteristics and the interactions between those elements.
The statistical analysis carried out generated information about the positions, variations in and indicators of the shape of the distribution of the statistical series that correspond to the contents of certain elements depending on the fertilization options. The calculation of the coefficients of variation, that is, the ratio of the standard deviation to the arithmetic mean, provided a picture of the spread of the data. Low coefficients of variation express the homogeneity of the statistical data, indicating a stability in the responses, showing the quantitative presence of some elements, and more precisely, their invariable character, independent of the type of fertilization used. Conversely, a high coefficient of variation represents a heterogeneous statistical data series, indicating important quantitative changes in the presence of the studied elements in the plants when different methods of fertilization are used. The boxplot diagrams generated provide a clearer picture of the variability in the responses induced by the different types of fertilization.
The set of elements outlined in the first component, PC1 (Table 4, Figure 2), includes P, K, Mg, Mn and Cu. It is worth nothing that the first four mineral elements in the leaves (phosphorus, potassium, magnesium and manganese) all share a similar characteristic, a high correlation coefficient over 20%, which is frequently associated with the absence of homogeneity of the series. They are therefore elements with variable quantitative presence and are all strongly influenced by the type of fertilization used. Even the coefficient of variation for the variable Cu, which is about 16%, places copper in an area close to the limit at which the series is considered homogeneous or heterogeneous. Considering the usefulness of such mineral elements, as indicated by their biological and even economic value, an idea that emerges immediately is the need to use the appropriate fertilization option that leads to the presence of useful contents of one or more specific elements. Mineral fertilization using complex fertilizers led to a quantitatively expressed presence of phosphorus, as indicated by response values placed above the median value. Moreover, organic fertilization had similar characteristics, also placing the response values in the area above the median line. Finally, the presence of potassium, an element placed in the same component, shared similar characteristics. Concerning the magnesium and manganese contents, organic fertilization placed their response values in a lower quantitative area below the median line (Table 6, Figure 3).
Even if the variable Ca was found in the second component, PC2 (Table 4, Figure 2), along with Chl and LA, it still presented a coefficient of variation of over 20%, but at the limit of the heterogeneity of the series. In the case of this element, its quantitative presence can be significantly influenced by the type of fertilization used. The other variables, chlorophyll (Chl) and leaf area (LA), presented low coefficients of variation, CV = 5.9% and CV = 9.1%, respectively. The data series of both the Chl and LA factors appear to be characterized by homogeneity, and the application of different fertilization methods under the study conditions did not seem to affect them quantitatively. The boxplot diagrams confirmed these values’ stability, as shown in Figure 4. The diagrams indicate that for both the chlorophyll content (Chl) and the leaf area (LA), the fertilization variants mostly led to value responses within the “box”, indicating a fit between the first and third quartiles. For all PC2 elements, the control fertilization variant led to the lowest value response (Table 6, Figure 4).
Macro-elements (P, K, Ca and Mg) and micro-elements (Mn, Fe, Cu, Zn and B) have an essential role in the general physiology of vines, as well as in the quality of grapes and wine, as described in [6]. The authors of this study used methods based on NIR spectroscopy, combined with chemometric methods, and obtained models for the rapid prediction of the nutrient content in leaves and petioles, with high statistical certainty in the case of calcium and magnesium (R2 = 0.88).
The nitrogen content (N), identified as a distinct factor (Table 4, Figure 2), had a coefficient of variation of approximately 11.2%, which indicated a series of homogeneous statistical data (Table 6). The different fertilization variants that were applied in the experiments did not lead to a substantial change in the nitrogen content under the study conditions, with its variation being quite low. Nitrogen plays an essential role in plants, as it induces and influences the structure of the plant and its development. The obtained result can also be attributed to the fact that the fertilization schemes applied experimentally all contained nitrogen. Therefore, from a quantitative point of view, the presence of nitrogen in the leaves was not influenced exclusively by the methods of fertilization applied under the study conditions.
Photosynthesis and the choice of cultivated plant genotype can be elements indicating the remediation of a nitrogen deficiency [35,36]. The identification of mineral deficiencies is also a continuous concern in the field of viticulture [37]. The lowest nitrogen content was induced by the control fertilization variant (T1). In variants T2–T4, which involve organic fertilization, the responses related to the nitrogen content were found in an area higher than, greater than or equal to the median value of the responses. Complex mineral fertilization, represented by variants T5–T7, led to lower nitrogen contents below the median line.
Iron and zinc are mineral elements found in another component, PC4 (Table 4, Figure 2). Both are characterized by a high coefficient of variation of over 20%, which indicates the absence of homogeneity in the series. The different types of fertilization methods applied led to a statistically high variation in the Fe and Zn content (Table 6, Figure 6).
The factors related to productivity (Y/plt, Y/ha) and quality (sugar content, Gb-Sug; acidity, Gb-Ac) led to fertilization in a homogeneous series. Concerning the monitored productivity elements, the coefficient of variation was placed in the range of 12−15% and indicated changes in production in response to the fertilization options, even if not to an important extent. Concerning the sugar content and acidity, the coefficients of variation were low to very low (15–2.25%), indicating their stability regardless of the fertilization variant applied under the study conditions (Table 6, Figure 7). In the case of acidity, the fertilization control variant (T1) placed the value response at the maximum level. On the other hand, the factors of productivity (Y/plt and Y/ha) and sugar (Gb-Sug) were found to be at their lowest values in the control fertilization.
The mineral element content and the pigment contents (chlorophyll and carotenoids) in the leaves were used to predict quality indices in grapes through linear regression analysis in [38]. The authors of the study developed two indices to estimate the quality of grapes, one based on the content of macro-elements (N, P, K, Ca and Mg comprising the combination of mineral elements), and the second based on the content of microelements in the petiole (Fe, Cu, Mn, Zn and B); both models led to statistically significant results. According to the authors, total chlorophyll held the highest weight for the estimation of quality attributes.
5. Conclusions
Considering the ‘Burgund mare’ vine cultivar grown in the region of Timisoara (Romania), the elements that form a mutual relationship can be described by four components: (PC1) K, Mg, P, Mn and Cu; (PC2) Chl, LA and Ca; (PC3) N; and (PC4) Fe and Zn.
The elements in the first component (PC1, K, Mg, P and Mn) are characterized by important variability. Under the action of the 13 fertilization variants tested in the present study, the series of values related to these elements underwent important changes in their coefficients of variation, having values between approximately 23 and 40%. The presence of phosphorus and manganese underwent the greatest changes in the vine leaves.
Regarding the second component (PC2), the chlorophyll content (Chl) and the leaf area (LA) were not sensitive to the different actions from the tested fertilization variants under the study conditions. The coefficients of variation did not exceed the value of 10% for these two factors.
Elemental nitrogen in the vine leaves constituted a distinct component (PC3). Its presence was stable across the fertilization methods tested under the study conditions. Moreover, iron and zinc, the elements that define the fourth component (PC4), showed noticeable changes under the action of the different types of fertilization applied.
The variation was indicated by coefficients with values between 24 and 27%. The productivity elements presented a variability described by average values, the coefficients of variation being between 12 and 16%. On the other hand, sugar and acidity showed stable values, regardless of the fertilization method under the study conditions, the coefficients of variation being lower than 2.5%. The results obtained suggest the fertilization methods discussed in this paper should also be tested on other varieties, in different areas and in different years.
Author Contributions
Conceptualization, F.S.; methodology, F.S. and C.B.; software, M.V.H.; validation, F.S. and D.C.; formal analysis, F.S.; investigation, F.S. and C.B.; resources, M.V.H.; data curation, F.S. and D.C.; writing—original draft preparation, F.S.; writing—review and editing, M.V.H.; visualization, D.C.; supervision, F.S. and D.C. All authors have read and agreed to the published version of the manuscript.
Funding
This research received no external funding.
Data Availability Statement
Data are contained within the article.
Acknowledgments
The authors thank the GEOMATICS Research Laboratory, ULS “King Mihai I” from Timisoara for the use of the software in this study. This research paper is supported by the project “Increasing the impact of excellence research on the capacity for innovation and technology transfer within USAMVB Timișoara”, code 6PFE, submitted to the competition Program 1—Development of the national system of research development, Subprogram 1.2—Institutional performance, Institutional development projects—Development projects of excellence in RDI.
Conflicts of Interest
The authors declare no conflicts of interest.
References
- Maia, M.; Ferreira, A.E.; Laureano, G.; Marques, A.P.; Torres, V.M.; Silva, A.B.; Matos, A.R.; Cordeiro, C.; Figueiredo, A.; Silva, M.S. Vitis vinifera “Pinot noir” leaves as a source of bioactive nutraceutical compounds. Food Funct. 2019, 10, 3822–3827. [Google Scholar] [CrossRef] [PubMed]
- Insanu, M.; Karimah, H.; Pramastya, H.; Fidrianny, I. Phytochemical compounds and pharmacological activities of Vitis vinifera L.: An updated review. Biointerface Res. Appl. Chem. 2021, 11, 13829–13849. [Google Scholar] [CrossRef]
- Li, H.; Wei, Y.; Zhang, H.; Chen, H.; Meng, J. Fine-grained classification of grape leaves via a pyramid residual convolution neural network. Int. J. Agric. Biol. Eng. 2022, 15, 197–203. [Google Scholar] [CrossRef]
- Arrobas, M.; Ferreira, I.Q.; Freitas, S.; Verdial, J.; Rodrigues, M.Â. Guidelines for fertilizer use in vineyards based on nutrient content of grapevine parts. Sci. Hortic. 2014, 172, 191–198. [Google Scholar] [CrossRef]
- Niemiec, M.; Chowaniak, M.; Zuzek, D.; Komorowska, M.; Mamurovich, G.S.; Gafurovich, K.K.; Usmanov, N.; Kamilova, D.; Rahmonova, J.; Rashidov, N. Evaluation of the chemical composition of soil as well as vine leaves and berries from selected commercial farms in the Republic of Tajikistan. J. Elem. 2020, 25, 675–686. [Google Scholar] [CrossRef]
- Cuq, S.; Lemetter, V.; Kleiber, D.; Levasseur-Garcia, C. Assessing macro- (P, K, Ca, Mg) and micronutrient (Mn, Fe, Cu, Zn, B) concentration in vine leaves and grape berries of vitis vinifera by using near-infrared spectroscopy and chemometrics. Comput. Electron. Agric. 2020, 179, 105841. [Google Scholar] [CrossRef]
- Richardson, J.B.; Chase, J.K. Transfer of macronutrients, micronutrients, and toxic elements from soil to grapes to white wines in uncontaminated vineyards. Int. J. Environ. Res. Public Health 2021, 18, 13271. [Google Scholar] [CrossRef]
- Karimi, R.; Saberi, A.; Khadivi, A. Effects of foliar spray of agricultural grade mineral oil in springtime, in combination with potassium and calcium sulfates on the phenological and biophysical indices of clusters, and foliar nutritional levels in grapevine (Vitis vinifera L.) cv. Sultana (Id. Thompson seedless, Sultanina). Biol. Res. 2021, 54, 28. [Google Scholar] [CrossRef]
- Olego, M.A.; Quiroga, M.J.; Sánchez-García, M.; Cuesta, M.; Cara-Jiménez, J.; Garzón-Jimeno, G.-J. Effects of overliming on the nutritional status of grapevines with special reference to micronutrient content. OENO One 2021, 55, 2. [Google Scholar] [CrossRef]
- Porro, D.; Bertoldi, D.; Bottura, M.; Pedò, S. Five-year period of evaluation of leaf mineral concentrations in resistant varieties in Trentino (Northeastern Italy). BIO Web Conf. 2022, 44, 01002. [Google Scholar] [CrossRef]
- Ramírez, P.M.; Ibáñez, J.D.l.H. Nutrient content of vineyard leaves after prolonged treated wastewater irrigation. Agronomy 2023, 13, 620. [Google Scholar] [CrossRef]
- Schönbeck, L.; Arteaga, M.; Mirza, H.; Coleman, M.; Mitchell, D.; Huang, X.; Ortiz, H.; Santiago, L.S. Plant physiological indicators for optimizing conservation outcomes. Conserv. Physiol. 2023, 11, 073. [Google Scholar] [CrossRef]
- Ennaji, O.; Vergütz, L.; Allali, A.E. Machine learning in nutrient management: A review. Artif. Intell. Agric. 2023, 9, 1–11. [Google Scholar] [CrossRef]
- Calzarano, F.; Amalfitano, C.; Seghetti, L.; Cozzolino, V. Nutritional status of vines affected with esca proper. Phytopathol. Mediterr. 2009, 48, 20–31. [Google Scholar]
- Yildiz, H.; Cakir, O.; Kubra, C.; Karatas, N. The effect of grapevine (Vitis vinifera L.) Varieties on the Bioactive Properties and Mineral Content of Various Vine Leaves Cultivated in Turkey. Available online: https://ssrn.com/abstract=4206725 (accessed on 18 February 2024). [CrossRef]
- Donini, L.M.; Dernini, S.; Lairon, D.; Serra-Majem, L.; Amiot, M.-J.; del Balzo, V.; Giusti, A.-M.; Burlingame, B.; Belahsen, R.; Maiani, G.; et al. A consensus proposal for nutritional indicators to assess the sustainability of a healthy diet: The mediterranean diet as a case study. Front. Nutr. 2016, 3, 37. [Google Scholar] [CrossRef] [PubMed]
- Aldaya, M.M.; Ibañez, F.C.; Domínguez-Lacueva, P.; Murillo-Arbizu, M.T.; Rubio-Varas, M.; Soret, B.; Beriain, M.J. Indicators and recommendations for assessing sustainable healthy diets. Foods 2021, 10, 999. [Google Scholar] [CrossRef]
- Albakaa, A.R.M.; Ameen, D.S.M.; Abed, N.K.; Jabbar, Z.A.; Musaa, L.A. Quantification of Ca, K, Mg, Zn and Fe elements in grape leaves from different regions of Iraq by atomic absorption spectroscopy. J. Phys. Conf. Ser. 2021, 1853, 012018. [Google Scholar] [CrossRef]
- Maia, M.; Cavaco, A.R.; Laureano, G.; Cunha, J.; Eiras-Dias, J.; Matos, A.R.; Duarte, B.; Figueiredo, A. More than just wine: The nutritional benefits of grapevine leaves. Foods 2021, 10, 2251. [Google Scholar] [CrossRef]
- Singh, J.; Rasane, P.; Kaur, R.; Kaur, H.; Garg, R.; Kaur, S.; Ercisli, S.; Choudhary, R.; Skrovankova, S.; Mlcek, J. Valorization of grape (Vitis vinifera) leaves for bioactive compounds: Novel green extraction technologies and food-pharma applications. Front. Chem. 2023, 11, 1290619. [Google Scholar] [CrossRef]
- Sadee, B.A.; Ali, R.J. Determination of essential and trace elements in various vegetables using ICP-MS. Baghdad Sci. J. 2023, 20, 0715. [Google Scholar] [CrossRef]
- Malik, A.R.; Mushtaq, R.; Kirmani, S.N.; Bhat, K.M.; Ganie, M.A.; Wani, S.M.; Bhat, R.; Soundri, A.S.; Banday, S.; El-Serehy, H. Nutrient changes in berries of “Anab-e-Shahi” and “Perllete” varieties of grapes with advancing phenology in the growing season. Horticulturae 2023, 9, 178. [Google Scholar] [CrossRef]
- ESRI. ArcGIS Desktop: Release 10; Environmental Systems Research Institute: Redlands, CA, USA, 2011. [Google Scholar]
- Blidariu, C. Nutrition Management of Wine and Viti-Wine Product Quality. Ph.D. Thesis, Banat University of Agricultural Sciences and Veterinary Medicine “King Mihai I of Romania” from Timisoara, Timisoara, Romania, 25 September 2013. [Google Scholar]
- Lorenz, D.H.; Eichhorn, K.W.; Bleiholder, H.; Klose, R.; Meier, U.; Weber, E. Phänologische Entwicklungsstadien der Weinrebe (Vitis vinifera L. ssp. vinifera). Vitic. Enol. Sci. 1994, 49, 66–70. [Google Scholar]
- Silva, E.G.E.; Couto, C.; de Melo, S.B.; Neiva, E.R. Análises Estatísticas com Jasp—Um Guia Introdutório. Available online: https://jasp-stats.org/wp-content/uploads/2023/04/v.2-Analises-Estatisticas-com-JASP-Um-Guia-Introdutorio.pdf (accessed on 15 January 2023).
- Hammer, Ø.; Harper, D.A.T.; Ryan, P.D. PAST: Paleontological Statistics software package for education and data analysis. Palaeontol. Electron. 2001, 4, 1–9. [Google Scholar]
- Folorunso, O.; Ojo, O.; Busari, M.; Adebayo, M.; Joshua, A.; Folorunso, D.; Ugwunna, C.O.; Olabanjo, O.; Olabanjo, O. Exploring machine learning models for soil nutrient properties prediction: A systematic review. Big Data Cogn. Comput. 2023, 7, 113. [Google Scholar] [CrossRef]
- Tränkner, M.; Tavakol, E.; Jákli, B. Functioning of potassium and magnesium in photosynthesis, photosynthate translocation and photoprotection. Physiol. Plant. 2018, 163, 414–431. [Google Scholar] [CrossRef] [PubMed]
- Therby-Vale, R.; Lacombe, B.; Rhee, S.Y.; Nussaume, L.; Rouached, H. Mineral nutrient signaling controls photosynthesis: Focus on iron deficiency-induced chlorosis. Trends Plant Sci. 2022, 27, 502–509. [Google Scholar] [CrossRef] [PubMed]
- Zhang, X.; Liang, T.; Gao, J.; Zhang, D.; Liu, J.; Feng, Q.; Wu, C.; Wang, Z. Mapping the forage nitrogen, phosphorus, and potassium contents of alpine grasslands by integrating Sentinel-2 and Tiangong-2 data. Plant Methods 2023, 19, 48. [Google Scholar] [CrossRef] [PubMed]
- De Leeuw, J. History of nonlinear principal component analysis. In Visualization and Verbalization of Data, 1st ed.; Blasius, J., Greenacre, M., Eds.; Chapman and Hall/CRC: New York, NY, USA, 2014; p. 392. [Google Scholar] [CrossRef]
- Roorkiwal, M.; Pandey, S.; Thavarajah, D.; Hemalatha, R.; Varshney, R.K. Molecular mechanisms and biochemical pathways for micronutrient acquisition and storage in legumes to support biofortification for nutritional security. Front. Plant Sci. 2021, 12, 682842. [Google Scholar] [CrossRef] [PubMed]
- Zahnit, W.; Smara, O.; Bechki, L.; Bensouici, C.; Messaoudi, M.; Benchikha, N.; Larkem, I.; Awuchi, C.G.; Sawicka, B.; Simal-Gandara, J. Phytochemical profiling, mineral elements, and biological activities of Artemisia campestris L. grown in Algeria. Horticulturae 2022, 8, 914. [Google Scholar] [CrossRef]
- Vos, J.P.; van der Putten, P.E.; Birch, C.J. Effect of nitrogen supply on leaf appearance, leaf growth, leaf nitrogen economy and photosynthetic capacity in maize (Zea mays L.). Field Crops Res. 2005, 93, 64–73. [Google Scholar] [CrossRef]
- Mu, X.; Chen, Y. The physiological response of photosynthesis to nitrogen deficiency. Plant Physiol. Biochem. 2021, 158, 76–82. [Google Scholar] [CrossRef] [PubMed]
- Rustioni, L.; Grossi, D.; Brancadoro, L.; Failla, O. Iron, magnesium, nitrogen and potassium deficiency symptom discrimination by reflectance spectroscopy in grapevine leaves. Sci. Hortic. 2018, 241, 152–159. [Google Scholar] [CrossRef]
- Abdel-Sattar, M.; Al-Saif, A.M.; Aboukarima, A.M.; Eshra, D.H.; Sas-Paszt, L. Quality attributes prediction of flame seedless grape clusters based on nutritional status employing multiple linear regression technique. Agriculture 2022, 12, 1303. [Google Scholar] [CrossRef]
Figure 1.
Experimental field location. Horticultural Research Base (HRB), ULS Timisoara [23].
Figure 1.
Experimental field location. Horticultural Research Base (HRB), ULS Timisoara [23].

Figure 2.
Path diagram. RC explanation: RC1, RC2, RC3 and RC4 (automatically generated by the application) are similar to PC1, PC2, PC3 and PC4. Line color explanation: the green the arrows express the factors with positive action (positive values of the coefficients in Table 4); the red arrows express the factors with negative action (negative values of the coefficient values in Table 4). Explanation of RC components: each RC component includes the factors as they are associated with the main components (n = 11; mineral elements and physiological indices).

Figure 3.
Boxplots for factors in PC1. Legend: dot—control (T1); reddish-brown bar—T2, T3 and T4 (organic fertilizer); blue square—T5, T6 and T7 (mineral fertilizer); light-green diamond—T8, T10 and T12 (foliar fertilizers without Ca); blue-green oval—T9, T11 and T13 (foliar fertilizers + Ca).
Figure 3.
Boxplots for factors in PC1. Legend: dot—control (T1); reddish-brown bar—T2, T3 and T4 (organic fertilizer); blue square—T5, T6 and T7 (mineral fertilizer); light-green diamond—T8, T10 and T12 (foliar fertilizers without Ca); blue-green oval—T9, T11 and T13 (foliar fertilizers + Ca).


Figure 4.
Boxplots of factors in PC2. Legend: dot—control (T1); reddish-brown bar—T2, T3 and T4) (organic fertilizer); blue square—T5, T6 and T7 (mineral fertilizer); light green diamond—T8, T10 and T12 (foliar fertilizers without Ca); blue-green oval—T9, T11 and T13 (foliar fertilizers + Ca).
Figure 4.
Boxplots of factors in PC2. Legend: dot—control (T1); reddish-brown bar—T2, T3 and T4) (organic fertilizer); blue square—T5, T6 and T7 (mineral fertilizer); light green diamond—T8, T10 and T12 (foliar fertilizers without Ca); blue-green oval—T9, T11 and T13 (foliar fertilizers + Ca).
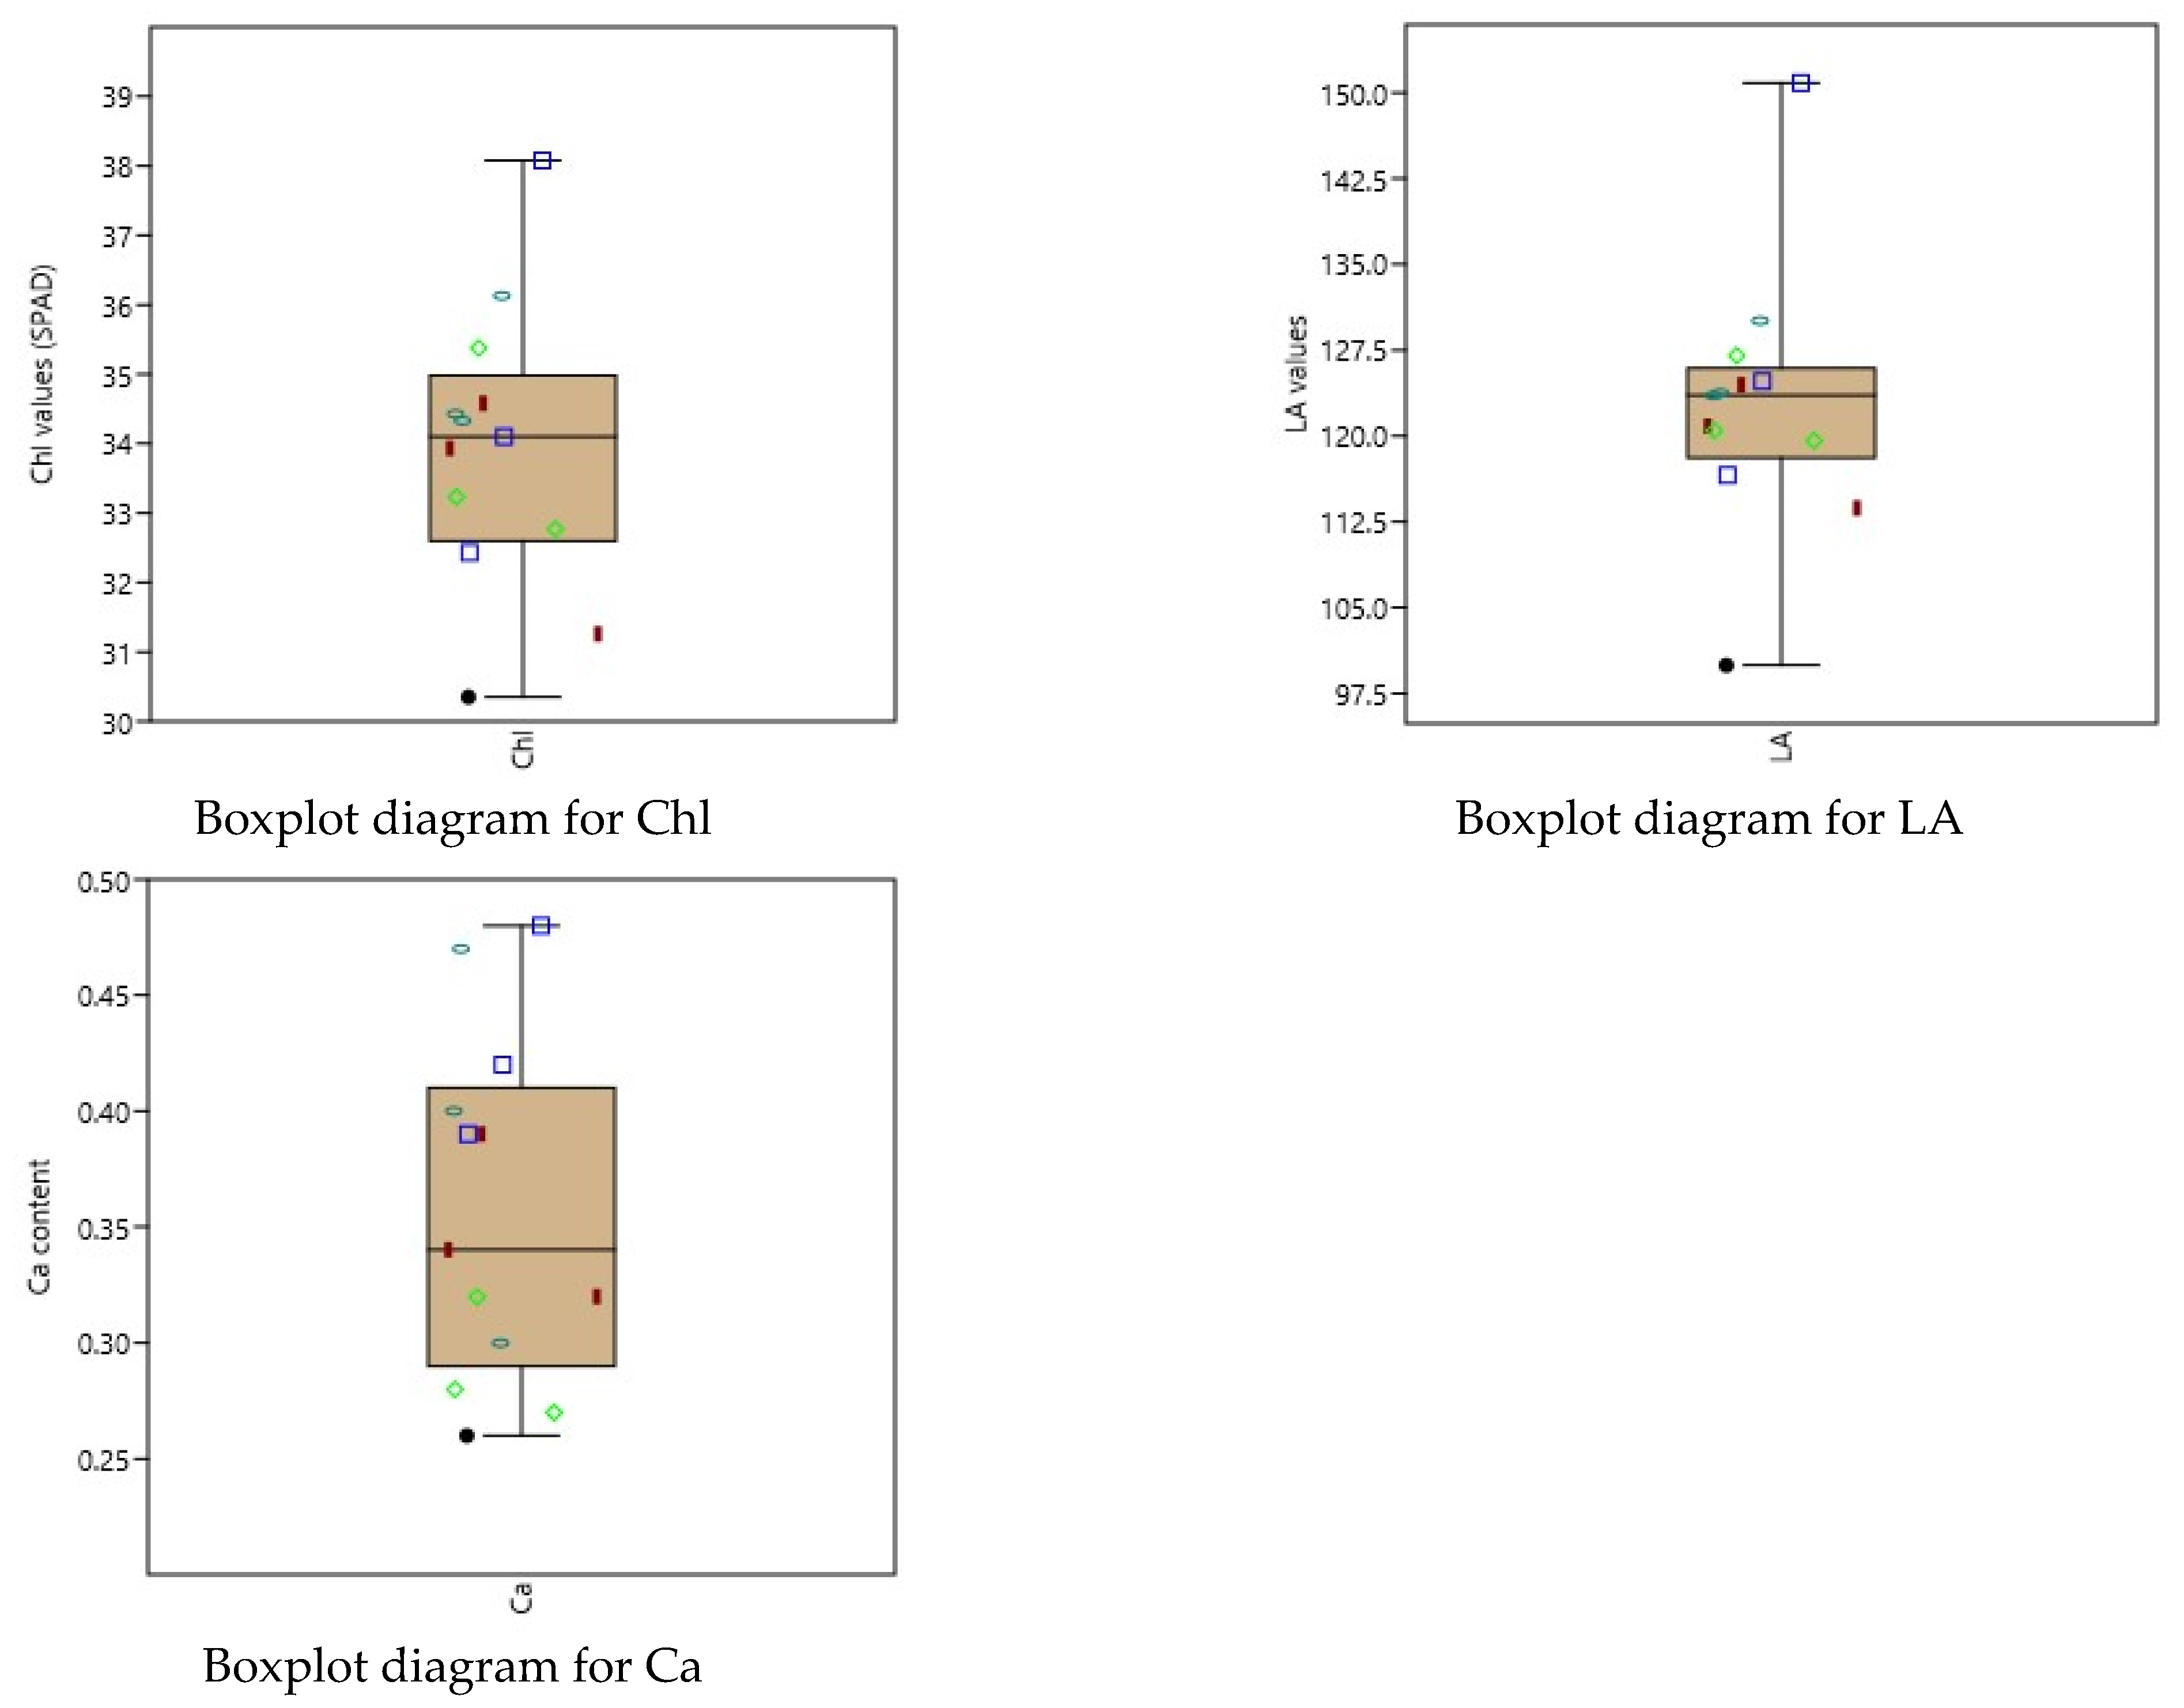
Figure 5.
Boxplot for factor N in PC3. Legend: dot—control (T1); reddish-brown bar—T2, T3 and T4 (organic fertilizer); blue square—T5, T6 and T7 (mineral fertilizer); light-green diamond—T8, T10 and T12 (foliar fertilizers without Ca); blue-green oval—T9, T11 and T13 (foliar fertilizers + Ca).
Figure 5.
Boxplot for factor N in PC3. Legend: dot—control (T1); reddish-brown bar—T2, T3 and T4 (organic fertilizer); blue square—T5, T6 and T7 (mineral fertilizer); light-green diamond—T8, T10 and T12 (foliar fertilizers without Ca); blue-green oval—T9, T11 and T13 (foliar fertilizers + Ca).

Figure 6.
Boxplots for factors in PC4. Legend: dot—control (T1); reddish-brown bar—T2, T3 and T4 (organic fertilizer); blue square—T5, T6, T7 (mineral fertilizer); light-green diamond—T8, T10 and T12 (foliar fertilizers without Ca); blue-green oval—T9, T11 and T13 (foliar fertilizers + Ca).
Figure 6.
Boxplots for factors in PC4. Legend: dot—control (T1); reddish-brown bar—T2, T3 and T4 (organic fertilizer); blue square—T5, T6, T7 (mineral fertilizer); light-green diamond—T8, T10 and T12 (foliar fertilizers without Ca); blue-green oval—T9, T11 and T13 (foliar fertilizers + Ca).

Figure 7.
Boxplot diagrams for production and quality indices. Legend: dot—control (T1); reddish-brown bar—T2, T3 and T4 (organic fertilizer); blue square—T5, T6 and T7 (mineral fertilizer); light-green diamond—T8, T10 and T12 (foliar fertilizers without Ca); blue-green oval—T9, T11 and T13 (foliar fertilizers + Ca).

Table 1.
Characterization of soil at DER, Horticultural Research Base, ULST [24].
Table 1.
Characterization of soil at DER, Horticultural Research Base, ULST [24].
| Parameters | Measurement Unit (MU) | Soil Depth | |
|---|---|---|---|
| 0–20 cm | 20–40 cm | ||
| pH (H2O) | 7.33 | 7.19 | |
| Humus (H) | % | 3.14 | 2.04 |
| Phosphorus (P, mobile form) | ppm | 76.52 | 77.21 |
| Potassium (K, mobile form) | ppm | 490.20 | 243.30 |
| Magnesium (Mg, total form) | ppm | 4275 | 5188 |
| Iron (Fe, total form) | ppm | 12,465 | 39,614 |
| Manganese (Mn, total form) | ppm | 860 | 677 |
| Copper (Cu, total form) | ppm | 57.09 | 51.99 |
| Zinc (Zn, total form) | ppm | 73.44 | 80.36 |
Table 2.
Mineral element content and physiological indices of vine leaves of the ‘Burgund mare’ cultivar (average values).
Table 2.
Mineral element content and physiological indices of vine leaves of the ‘Burgund mare’ cultivar (average values).
| Trial | Content Of Mineral Elements In The Leaves | Physiological Indices | ||||||||||
|---|---|---|---|---|---|---|---|---|---|---|---|---|
| N | P | K | Ca | Mg | Fe | Mn | Cu | Zn | LA | Chl | ||
| Fertilizer | Code | (%) | (mg kg−1) | (cm2) | (SPAD) | |||||||
| Control | T1 | 1.78 | 0.22 | 0.46 | 0.26 | 0.27 | 79.50 | 59.70 | 7.10 | 12.10 | 99.96 | 30.35 |
| G.30t/ha | T2 | 2.37 | 0.24 | 0.52 | 0.32 | 0.20 | 82.40 | 43.60 | 8.70 | 5.60 | 113.69 | 31.26 |
| G.40t/ha | T3 | 2.47 | 0.43 | 0.60 | 0.34 | 0.16 | 75.70 | 14.90 | 9.60 | 9.70 | 120.84 | 33.93 |
| G.50t/ha | T4 | 2.53 | 0.28 | 0.53 | 0.39 | 0.23 | 83.20 | 19.60 | 9.80 | 7.90 | 124.46 | 34.58 |
| NPK 50 | T5 | 1.94 | 0.28 | 0.47 | 0.39 | 0.23 | 68.20 | 68.30 | 8.00 | 13.20 | 116.58 | 32.43 |
| NPK 100 | T6 | 1.96 | 0.51 | 0.68 | 0.42 | 0.16 | 105.80 | 52.60 | 10.20 | 13.70 | 124.79 | 34.10 |
| NPK 150 | T7 | 2.28 | 0.45 | 0.56 | 0.48 | 0.19 | 105.80 | 53.30 | 11.20 | 11.60 | 150.86 | 38.08 |
| Fertitel | T8 | 2.54 | 0.25 | 0.48 | 0.32 | 0.23 | 84.10 | 49.50 | 9.20 | 7.70 | 127.03 | 35.38 |
| Fertitel + Ca | T9 | 2.56 | 0.21 | 0.50 | 0.30 | 0.24 | 68.60 | 49.00 | 7.80 | 13.70 | 130.08 | 36.13 |
| Cropmax | T10 | 2.49 | 0.21 | 0.45 | 0.27 | 0.23 | 143.00 | 56.00 | 8.60 | 14.60 | 119.58 | 32.77 |
| Cropmax + Ca | T11 | 2.40 | 0.24 | 0.45 | 0.40 | 0.26 | 82.70 | 43.60 | 8.60 | 7.60 | 123.55 | 34.43 |
| Waterfert | T12 | 2.30 | 0.19 | 0.43 | 0.28 | 0.24 | 60.80 | 86.20 | 6.20 | 8.50 | 120.47 | 33.23 |
| Waterfert + Ca | T13 | 2.15 | 0.20 | 0.24 | 0.47 | 0.37 | 85.00 | 85.00 | 7.20 | 12.20 | 123.77 | 34.33 |
| Standard Error (SE) | ±0.071 | ±0.030 | ±0.028 | ±0.020 | ±0.015 | ±5.921 | ±5.764 | ±0.385 | ±0.811 | ±3.131 | ±0.560 | |
Table 3.
Vine production and quality indices for grape berries of the ‘Burgund mare’ cultivar (average values).
Table 3.
Vine production and quality indices for grape berries of the ‘Burgund mare’ cultivar (average values).
| Trial | Yield Data | Quality Data | |||
|---|---|---|---|---|---|
| Y/Plt | Y/ha | Gb-Sug | Gb-Ac | ||
| Fertilizer | Code | (Kg plt−1) | (t ha−1) | (g L−1) | (g L−1 H2SO4) |
| Control | T1 | 1.84 | 8.15 | 212.43 | 4.81 |
| G.30 t/ha | T2 | 2.33 | 9.31 | 216.41 | 4.72 |
| G.40t/ha | T3 | 2.50 | 10.11 | 224.04 | 4.65 |
| G.50t/ha | T4 | 2.82 | 11.56 | 225.43 | 4.67 |
| NPK 50 | T5 | 2.45 | 9.33 | 217.27 | 4.74 |
| NPK 100 | T6 | 2.82 | 11.26 | 224.06 | 4.64 |
| NPK 150 | T7 | 3.23 | 12.85 | 225.03 | 4.67 |
| Fertitel | T8 | 2.35 | 9.49 | 214.48 | 4.74 |
| Fertitel + Ca | T9 | 2.93 | 11.91 | 221.60 | 4.65 |
| Cropmax | T10 | 2.06 | 9.39 | 216.17 | 4.72 |
| Cropmax + Ca | T11 | 2.29 | 10.39 | 224.78 | 4.63 |
| Waterfert | T12 | 2.21 | 9.61 | 216.80 | 4.70 |
| Waterfert + Ca | T13 | 2.47 | 10.69 | 227.22 | 4.63 |
| Standard Error (SE) | ±0.105 | ±0.360 | ±1.377 | ±0.015 | |
Table 4.
Component loadings.
| PC1 | PC2 | PC3 | PC4 | Uniqueness | |
|---|---|---|---|---|---|
| K | 0.963 | 0.060 | |||
| Mg | −0.940 | 0.113 | |||
| P | 0.770 | 0.049 | |||
| Mn | −0.759 | 0.216 | |||
| Cu | 0.752 | 0.079 | |||
| Chl | 0.938 | 0.109 | |||
| LA | 0.938 | 0.081 | |||
| Ca | 0.722 | 0.190 | |||
| N | −0.916 | 0.112 | |||
| Fe | 0.869 | 0.179 | |||
| Zn | 0.761 | 0.260 |
Table 5.
Component characteristics.
| Components | Unrotated Solution | Rotated Solution | ||||
|---|---|---|---|---|---|---|
| Eigenvalue | Proportion var. | Cumulative | SumSq. Loadings | Proportion var. | Cumulative | |
| Component 1 | 4.495 | 0.409 | 0.409 | 3.633 | 0.330 | 0.330 |
| Component 2 | 2.447 | 0.222 | 0.631 | 2.761 | 0.251 | 0.581 |
| Component 3 | 1.566 | 0.142 | 0.773 | 1.700 | 0.155 | 0.736 |
| Component 4 | 1.043 | 0.095 | 0.868 | 1.457 | 0.132 | 0.868 |
Table 6.
Statistical summary.
| Statistical Parameters | P | K | Mg | Mn | Cu | Chl | LA | Ca | N | Fe | Zn | Y/plt | Y/ha | Gb- Sug | Gb- Ac |
|---|---|---|---|---|---|---|---|---|---|---|---|---|---|---|---|
| N | 13 | 13 | 13 | 13 | 13 | 13 | 13 | 13 | 13 | 13 | 13 | 13 | 13 | 13 | 13 |
| Min | 0.19 | 0.24 | 0.16 | 14.9 | 6.2 | 30.35 | 99.96 | 0.26 | 1.78 | 60.8 | 5.6 | 1.84 | 8.15 | 212.43 | 4.63 |
| Max | 0.51 | 0.68 | 0.37 | 86.2 | 11.2 | 38.08 | 150.86 | 0.48 | 2.56 | 143 | 14.6 | 3.23 | 12.85 | 227.22 | 4.81 |
| Mean | 0.285 | 0.490 | 0.232 | 52.408 | 8.631 | 33.923 | 122.74 | 0.357 | 2.290 | 86.523 | 10.623 | 2.485 | 10.312 | 220.44 | 4.690 |
| Std. dev | 0.106 | 0.103 | 0.054 | 20.781 | 1.387 | 2.022 | 11.289 | 0.074 | 0.257 | 21.348 | 2.926 | 0.380 | 1.301 | 4.964 | 0.054 |
| Median | 0.24 | 0.48 | 0.23 | 52.6 | 8.6 | 34.1 | 123.55 | 0.34 | 2.37 | 82.7 | 11.6 | 2.45 | 10.11 | 221.6 | 4.67 |
| 25 prcntil | 0.21 | 0.45 | 0.195 | 43.6 | 7.5 | 32.6 | 118.08 | 0.29 | 2.055 | 72.15 | 7.8 | 2.25 | 9.36 | 216.29 | 4.645 |
| 75 prcntil | 0.355 | 0.545 | 0.25 | 64 | 9.7 | 34.98 | 125.91 | 0.41 | 2.51 | 95.4 | 13.45 | 2.82 | 11.41 | 224.90 | 4.73 |
| Coeff. var | 37.292 | 20.945 | 23.180 | 39.652 | 16.071 | 5.960 | 9.197 | 20.632 | 11.241 | 24.673 | 27.539 | 15.289 | 12.614 | 2.2516 | 1.1515 |
Disclaimer/Publisher’s Note: The statements, opinions and data contained in all publications are solely those of the individual author(s) and contributor(s) and not of MDPI and/or the editor(s). MDPI and/or the editor(s) disclaim responsibility for any injury to people or property resulting from any ideas, methods, instructions or products referred to in the content. |
© 2024 by the authors. Licensee MDPI, Basel, Switzerland. This article is an open access article distributed under the terms and conditions of the Creative Commons Attribution (CC BY) license (https://creativecommons.org/licenses/by/4.0/).
Share and Cite
MDPI and ACS Style
Sala, F.; Camen, D.; Herbei, M.V.; Blidariu, C. Analysis of Vine Nutrition and Productivity Based on Statistical Indicators. Horticulturae 2024, 10, 397. https://doi.org/10.3390/horticulturae10040397
AMA Style
Sala F, Camen D, Herbei MV, Blidariu C. Analysis of Vine Nutrition and Productivity Based on Statistical Indicators. Horticulturae. 2024; 10(4):397. https://doi.org/10.3390/horticulturae10040397
Chicago/Turabian StyleSala, Florin, Dorin Camen, Mihai Valentin Herbei, and Cosmin Blidariu. 2024. "Analysis of Vine Nutrition and Productivity Based on Statistical Indicators" Horticulturae 10, no. 4: 397. https://doi.org/10.3390/horticulturae10040397
Note that from the first issue of 2016, this journal uses article numbers instead of page numbers. See further details here.