Abstract
Protein hydrolysates (PHs) derived from waste materials are promising for sustainable practices in agricultural production. This study evaluated the effects of PH enzymatically derived from anchovy by-products on the root system architecture (RSA) and aboveground development of potted primrose. The plants were treated with 0.5, 1.0, and 1.5 g/L concentrations of PH by drenching with 100 mL/pot at two-week intervals and irrigated once a week with 100 mL/pot during winter and twice weekly during spring. The results revealed that the 1.5 g/L treatment statistically significantly improved dry weight and leaf area, while the highest leaf chlorophyll content was observed with the 1.0 g/L treatment. The treatments did not influence leaf and flower numbers. Treatment with 1.0 g/L produced the most substantial improvement in root surface area, projected area, volume, length, tips, and forks. Additionally, the study employed machine learning (ML) algorithms, including GP, RF, XGBoost, and an ANN-based MLP. The input variables (root surface area, projected area, volume, length, tips, and forks) were assessed to model and predict the root traits. The ML and ANN algorithms’ R-squared rates were noted in the following order: MLP > GP > RF > XGBoost. These outcomes hold significant implications for enhancing primrose growth.
1. Introduction
Primula, or primrose, refers to early flowering and plant growth in spring and the genus belongs to the Primulaceae family. Primula acaulis, English primrose or acaulis primrose, is one of the most important species commercially produced for ornamental plant markets [1]. Primroses are herbaceous perennial plants with attractive flowers and rosette leaves and are cultivated as pot plants or bedding plants [2]. During the cultivation period, optimal environments and nutrition are required for primrose production. Achieving this goal involves cultivating plants in substrates and applying specific chemical fertilizers to meet the plants’ distinct requirements at various stages of development [3]. However, the use of pesticides and fertilizers for primrose production in greenhouses contributes significantly to both aquatic and terrestrial ecotoxicity impact categories [4].
Over the last three decades, various technological innovations have been developed to reduce synthetic agricultural chemicals such as pesticides and fertilizers and increase the sustainability of agricultural production systems. Efforts have been made to develop promising and environmentally friendly natural products that can increase flowering, plant growth, fruit set, crop productivity, and nutrient use efficiency and improve tolerance to a wide range of abiotic stress factors [5]. In this context, there has been a notable increase in enthusiasm for incorporating plant biostimulants into agricultural practices [6]. Biostimulants encompass various categories of compounds distinguished by their main modes of action and chemical composition. Among these, protein hydrolysates have become the subject of numerous studies. Hydrolysates are derived from various vegetal or animal sources, including by-products and agricultural waste [7]. Various agricultural practices generate organic waste, which holds the potential for additional processing to produce biostimulants. In this context, fish waste has great potential because almost 50% of the waste is generated during fish processing and is not processed into food [8]. Additionally, fish waste with a crude protein content ranging from 8 to 35% has the potential to be a source of essential amino acids [9]. Therefore, utilizing fish protein to produce protein hydrolysate and bioactive peptides can enhance the economic value and mitigate the potential negative environmental impact [10]. Various techniques are employed for fish protein hydrolysate (FPH) production, such as chemical hydrolysis (acid and alkaline hydrolysis), autolysis, bacterial fermentation, and enzymatic hydrolysis. Enzymatic hydrolysis and chemical hydrolysis are the most utilized methods to produce FPH. Notably, enzymatic hydrolysis avoids the generation of residual organic solvents and toxic chemicals in the final products [11]. Given these benefits, this study primarily emphasizes the enzymatic processes for FPH production [12,13].
FPH can be applied to plants as drenching or foliar spray. FPH is proven to improve plant performance, including yield and quality in lettuce [14,15], spinach [16,17], wheat [18], and melon [19]. Moreover, FPH has been demonstrated to enhance plant nutrient utilization and root development [20]. In traditional soil farming, such vigorous root growth is also correlated with heightened drought tolerance [21]. However, examining root morphological traits is challenging due to the labor-intensive process and difficulties in obtaining valid root samples without causing excessive damage [22]. Therefore, image analysis softwares such as RootNav 1.8.1, RootSystemAnalyzer 2, RootTrace 0.8.1, SmartRoot 4.1, and WhinRhizo 2013 were used to determine root morphological traits [23]. WinRhizo was developed specifically for root image analysis, allowing automatic and interactive root measurements [22]. Additionally, image analysis software integrated with machine learning algorithms provides promising statistical tools for variable selection and group classification [24].
The application of machine learning (ML) is prevalent in solving complex problems across diverse scientific disciplines [25]. Despite its widespread use in various fields, the adoption of ML methodologies in plant and agricultural science is comparatively limited [26]. Nevertheless, researchers have showcased notable success in leveraging ML in plant science, particularly in areas such as plant breeding [27], cell biology [28], or root system architecture (RSA) [24]. Artificial neural networks (ANNs) are a class of nonlinear computational methods utilized for diverse tasks, such as data clustering, predictions, and the categorization of complex systems [29,30]. Artificial neural networks (ANNs) could reveal relationships between input and output variables, extracting underlying insights from datasets without relying on pre-existing physical assumptions or considerations [31]. In this study, four distinct machine learning models were employed—multilayer perceptron (MLP), random forest (RF), Gaussian process (GP), and extreme gradient boosting (XGBoost). Each model possesses unique strengths and capabilities for capturing complex relationships within the data. The MLP utilizes a supervised training process with input and output variables provided in the training set. RF calculates the Euclidean distance between each neuron’s center and the input as the primary input to the neuron’s transfer function. GP assesses the likelihood that input samples belong to a specific class, serving as a nonparametric classifier for binary datasets, particularly effective with small datasets due to its consistency, precision, and ease of calculation [26]. XGBoost excels in learning from errors and progressively decreasing the error rate over multiple rounds [32]. The deliberate combination of these models enhances the study’s ability to comprehend intricate relationships within the dataset, encompassing primrose cultivars, plant growth, and root system architecture.
The primary goal of the current study is to determine the effects of anchovy waste protein hydrolysate on the overall quality of cultivated plants and promote sustainable cultivation methods. The study pursues multiple objectives to achieve this, including examining different primrose cultivars, protein hydrolysate from waste material, evaluating plant growth parameters, and image analysis of the root system. In order to expand the breadth of the research, the study incorporates advanced methods such as artificial neural network analysis and machine learning. By utilizing these computational techniques, the study strives to model and accurately predict the effects of fish protein hydrolysate on the quality of potted primrose cultivation.
2. Materials and Methods
2.1. Production Protein Hydrolysate from Fish By-Product
Protein hydrolysate was produced enzymatically from by-products (head and viscera) of anchovy (Engraulis encrasicolus), a common species in the Black Sea region in Türkiye. The optimized protocols for FPH production from anchovy waste by Korkmaz et al. [33] and Korkmaz and Tokur [34,35] were used. The anchovy waste materials were collected from commercial fisheries and brought immediately to the laboratory in a cold chain. In the first stage, the wastes were crushed by a mincing machine (Empero, EMP.12.01.P, Konya, Türkiye) and then kept in a water bath at 90 °C for 20 min to inhibit endogenous enzymes. Then, the samples were cooled and homogenized by adding distilled water (1:1 v/v). The samples were hydrolyzed by applying flavourzym (Novozymes A/S, Bagsvaerd, Denmark) (1.0%) at 50 °C for 1.5 h, and the pH was adjusted to 7.0 during the process. The inactivation time and temperature of flavourzym were applied in line with the recommendation of the company from which the enzymes were purchased. After cooling, the hydrolysis solution was centrifuged (Sigma 3-30KS, Sigma Laborzentrifugen GMH, Osterode, Germany) at 2067× g for 20 min to achieve phase separation. Subsequently, the liquid phase was freeze-dried. The FPH powder was stored in sterile 50 mL centrifuge tubes at 4 °C prior to analysis and applications.
Amino Acid Composition of FPH
Amino acid quantification was conducted using LC-MS/MS (Thermo Fisher Scientific Inc., Waltham, MA, USA), with modifications to the methods employed by Lee and Hwang [36] and Chan and Matanjun [37]. After necessary adjustments to the equipment outlined by Kıvrak [38], analyses were carried out. Considering the content of essential amino acids, the chemical scores of the protein hydrolysate were specified according to the essential amino acid content of the standard protein determined by the FAO/WHO [39]. Table 1 shows the total amino acid contents of the FPH.

Table 1.
Total amino acid contents of FPH obtained from anchovy by-product.
2.2. Plant Material and Growing Conditions
Light violet and pink varieties of Primula acaulis cv. Danova F1 were used as plant material. Seedlings with four true leaves were obtained from a local company and transferred into a 1.5 L plastic pot containing peat: perlite (2:1 v/v) substrate. Seedlings were grown in an unheated plastic greenhouse between 1 December 2019 and 4 April 2020. The highest, lowest, and average temperature (°C) and relative humidity (%) in the greenhouse were measured with a portable datalogger (Kimo KT100, Sauermann Industries, Montpon, France) throughout the growing period (Table 2). During the cultivation period, no additional nutrients or chemicals were applied. The plants were irrigated once a week with 100 mL/pot during winter and twice weekly during spring.
Table 2.
Climatic conditions in the greenhouse during cultivation.
2.3. Application of Protein Hydrolysate
Protein hydrolysate treatments started through root drenching two weeks after transplanting (1 December). The FPH powder was dissolved in distilled water and applied at two-week intervals for five times, 100 mL/pot, at 0.5, 1.0, and 1.5 g/L concentrations until flower bud differentiation. We watered the plants in the control group with 100 mL of distilled water instead of FPH treatment.
Experiments were conducted in a randomized plot design with 12 replications and a seedling in each replication. JMP 8.0 statistical software analyzed experimental results using two-way ANOVA (variety × applications). Differences between treatment means were tested with the least significant difference (LSD) test.
2.4. Plant Growth Characteristics and Assessment of Root System Architecture
Days from the transfer of seedlings into the pots till the flowering period (DAFT) were recorded, and flower numbers per plant were counted during the flowering period. The chlorophyll content in leaves (SPAD index) was measured using a chlorophyll content meter (CCM-200, Opti-Sciences, Hudson, NH, USA). The plants were brought to the laboratory at the end of the flowering period for further analysis. The plants were removed from pots and then washed under tap water. The plants’ organs were separated using a scalpel, and leaf numbers per plant were recorded. Whole leaves from each plant were scanned using a scanner (HP Deskjet 2720) and a ruler. Then, images were processed using Digimizer image analysis software (ver. 5.4.1, MedCalc Software Ltd, Ostend, Belgium), and leaf area (cm2) was calculated. The roots were carefully washed under tap water and scanned with a scanner (Epson Expression 10000XL, Epson America Inc., Long Beach, CA, USA). Images were used to measure root length (cm), root volume (cm3), root diameter (mm), root tips, root forks (where the parent root tips produce the new roots), root crossing (the point where the roots cross each other), projected area (cm2), and surface area (cm2) using WinRhizo software (ver. 2013, Regent Instruments, QC, Canada) [40]. Whole plant parts were dried in an oven (Ecocell, MMM Medcenter Einrichtungen GmbH, Munich, Germany) at 80 °C for 48 h, and dried samples were weighed with an analytical balance [41].
2.5. Modeling Procedure
In order to model and predict the root traits of different primrose genotypes after FPH treatment, this study employed three machine learning (ML) algorithms, Gaussian process (GP), random forest (RF), and extreme gradient boost (XGBoost), in addition to a well-known ANN-based multilayer perceptron (MLP). To fully assess the predicted performances of the MLP and ML models, we used a 10-fold cross-validation method to split the dataset into training and testing subsets.
The input variables comprised two distinct genotypes and four distinct treatments. Conversely, the target (output) variables included projected area, surface area, length, average diameter, root volume, tips, forks, and crossings of roots. The caret package was utilized together with R programming (ver. 3.0.3) to implement coding. The accuracy and precision of MLP and ML models were evaluated and contrasted using several criteria. Among these metrics were the mean absolute error (MAE), which computes the average error between the predicted and observed values (Equation (1)), the root mean square error (RMSE), which indicates how closely the regression line matches the observed data points (Equation (2)), and the coefficient of determination (R2), which indicates the degree of relationship between the model and dependent variable (Equation (3)).
2.5.1. Multilayer Perceptron
One widely recognized artificial neural network (ANN) is the multilayer perceptron (MLP), which is structured with an input layer, an output layer, and one or more hidden layers. We trained the MLP using the input and output variables from the training set by employing a supervised training method. We repeated the training process until the target value in Equation (4) was achieved:
= number of observations, is the -th observation variable, is the -th of the predicted variable.
To calculate the predicted value in the multilayer perceptron (MLP), which has a hidden layer with neurons and output variables, the following equation is applied:
represents the -th output variable, corresponds to the weighted input data entering the -th hidden neuron, is the activation function applied to the output neuron, signifies the weight associated with the direct connection from input neuron to hidden neuron , represents the bias specific to the -th neuron, represents the bias linked to the output neuron, and is the activation function utilized for the hidden neuron.
2.5.2. Gaussian Process
The Gaussian process (GP) model is an effective tool for supervised learning, extending the Gaussian probability distribution to better understand the spread of random variables. This model is particularly well-suited for addressing classification and regression problems. As a nonparametric classifier, it estimates the probability that input samples belong to specific classes, especially for binary datasets. One of its key advantages is its ability to perform well with small datasets, providing consistent, accurate, and computationally efficient results [42]. Equation (6) presents the mathematical derivation for each input () and corresponding output ()
2.5.3. Random Forest
The random forest (RF) method, which is essentially an ensemble of unpruned trees, was developed by Breiman [43]. The RF technique has been successful in both regression and classification tasks and is well-known for its efficiency and ease of use. Previous research has shown that the RF model possesses several prominent characteristics, including its ability to prevent overfitting, its proficiency in handling noise, and its efficient management of a large number of features [34]. The RF method employs bagging, also known as bootstrap aggregation, and the final outcome is determined by the decision of the trained tree. Equation (7) illustrates the fundamental concept behind the RF model.
2.5.4. Extreme Gradient Boosting
The extreme gradient boosting (XGBoost) model, developed by Chen and Guestrin [44], is a highly effective solution for addressing regression and classification problems. As a member of the gradient boosting decision tree family, XGBoost is celebrated for its exceptional performance and efficiency. By operating within a gradient boosting framework, XGBoost is particularly skilled at learning from mistakes and continually reducing the error rate through a series of iterations.
Equation (9) expresses the XGBoost iterative model, while Equation (8) provides its objective function.
3. Results
3.1. Effects of FPH on Plant Growth and Root System
Plant growth characteristics, including leaf area, leaf number, SPAD index, flower number, days from seedlings transferred to pot till first flower (DAFT), and plant dry weight were evaluated in two primrose varieties subjected to different FPH concentrations. The treatments significantly affected leaf area, leaf chlorophyll content, plant dry weight, and DAFT; parameters including leaf number and flower number were not influenced by FPH treatments (Table 3). All FPH treatments increased leaf areas and plant dry weight, and the highest values were observed in 1.5 g/L FPH treatments with 39.87 cm2 and 4.85 g, respectively. The effects of FPH treatments on the SPAD index and DAFT were similar and statistically grouped together. SPAD index ranged from 33.10 to 34.35 among the treatments, and the highest index was recorded in 1.0 g/L FPH treatments, while the lowest SPAD index of 27.45 was observed in the control group. Effects of variety on flowering time were statistically significant. However, treatments promoted early flowering of the plants for nearly four days (Table 3). The treatment of FPH did not influence the flower number per plant.
Table 3.
The effects of FPH treatments on leaf area, leaf number, SPAD index, flower number, flowering time, and plant dry weight of primrose varieties.
The root system was evaluated using image analysis software, and treatments significantly influenced evaluated parameters. However, the variety and interaction of variety and treatment did not statistically affect the root system. Table 4 shows that 1.0 g/L FPH treatment improved surface area, projected area, and root volume; the highest values were observed in 1.0 g/L FPH treatment. The second highest surface area and projected area values were obtained at the 1.5 g/L concentration, resulting in higher values than 0.5 g/L. The control group had the lowest surface and projected area values, with 207.93 and 68.28 cm2, respectively. The highest root volumes were obtained from treatments of 0.5 and 1.0 g/L FPH, and the lowest values were recorded in the control group and 1.5 g/L FPH treatment (Table 4).
Table 4.
The surface area, projected area, and root volume of primrose varieties in terms of the concentration of fish protein hydrolysates.
The root length, tips, forks, and crossings were significantly affected by FPH treatments. However, the effects of treatments on root diameter were not statistically significant. Among the tested FPH treatments, the 1.0 g/L concentration resulted in the highest values, with 259.59 cm for root length, 612.66 for root tips, and 1286.9 for root forks. In contrast, 0.5 and 1.5 g/L FPH treatments gave intermediate values compared to the control group. All the FPH treatments improved root crossing significantly. The highest root crossing value was observed in 1.5 g/L FPH treatment with 139.87, while the lowest was 71.68 in the control group. The 0.5 and 1.0 g/L treatments gave intermediate values but clustered in the same group with the 1.5 g/L FPH treatment (Table 5).
Table 5.
The effects of FPH treatments on root parameters of primroses.
3.2. ML Modeling Analysis
The research findings underwent analysis using the artificial-neural-network-based multilayer perceptron (MLP) and machine learning algorithms, including XGBoost, random forest (RF), and the Gaussian process (GP).
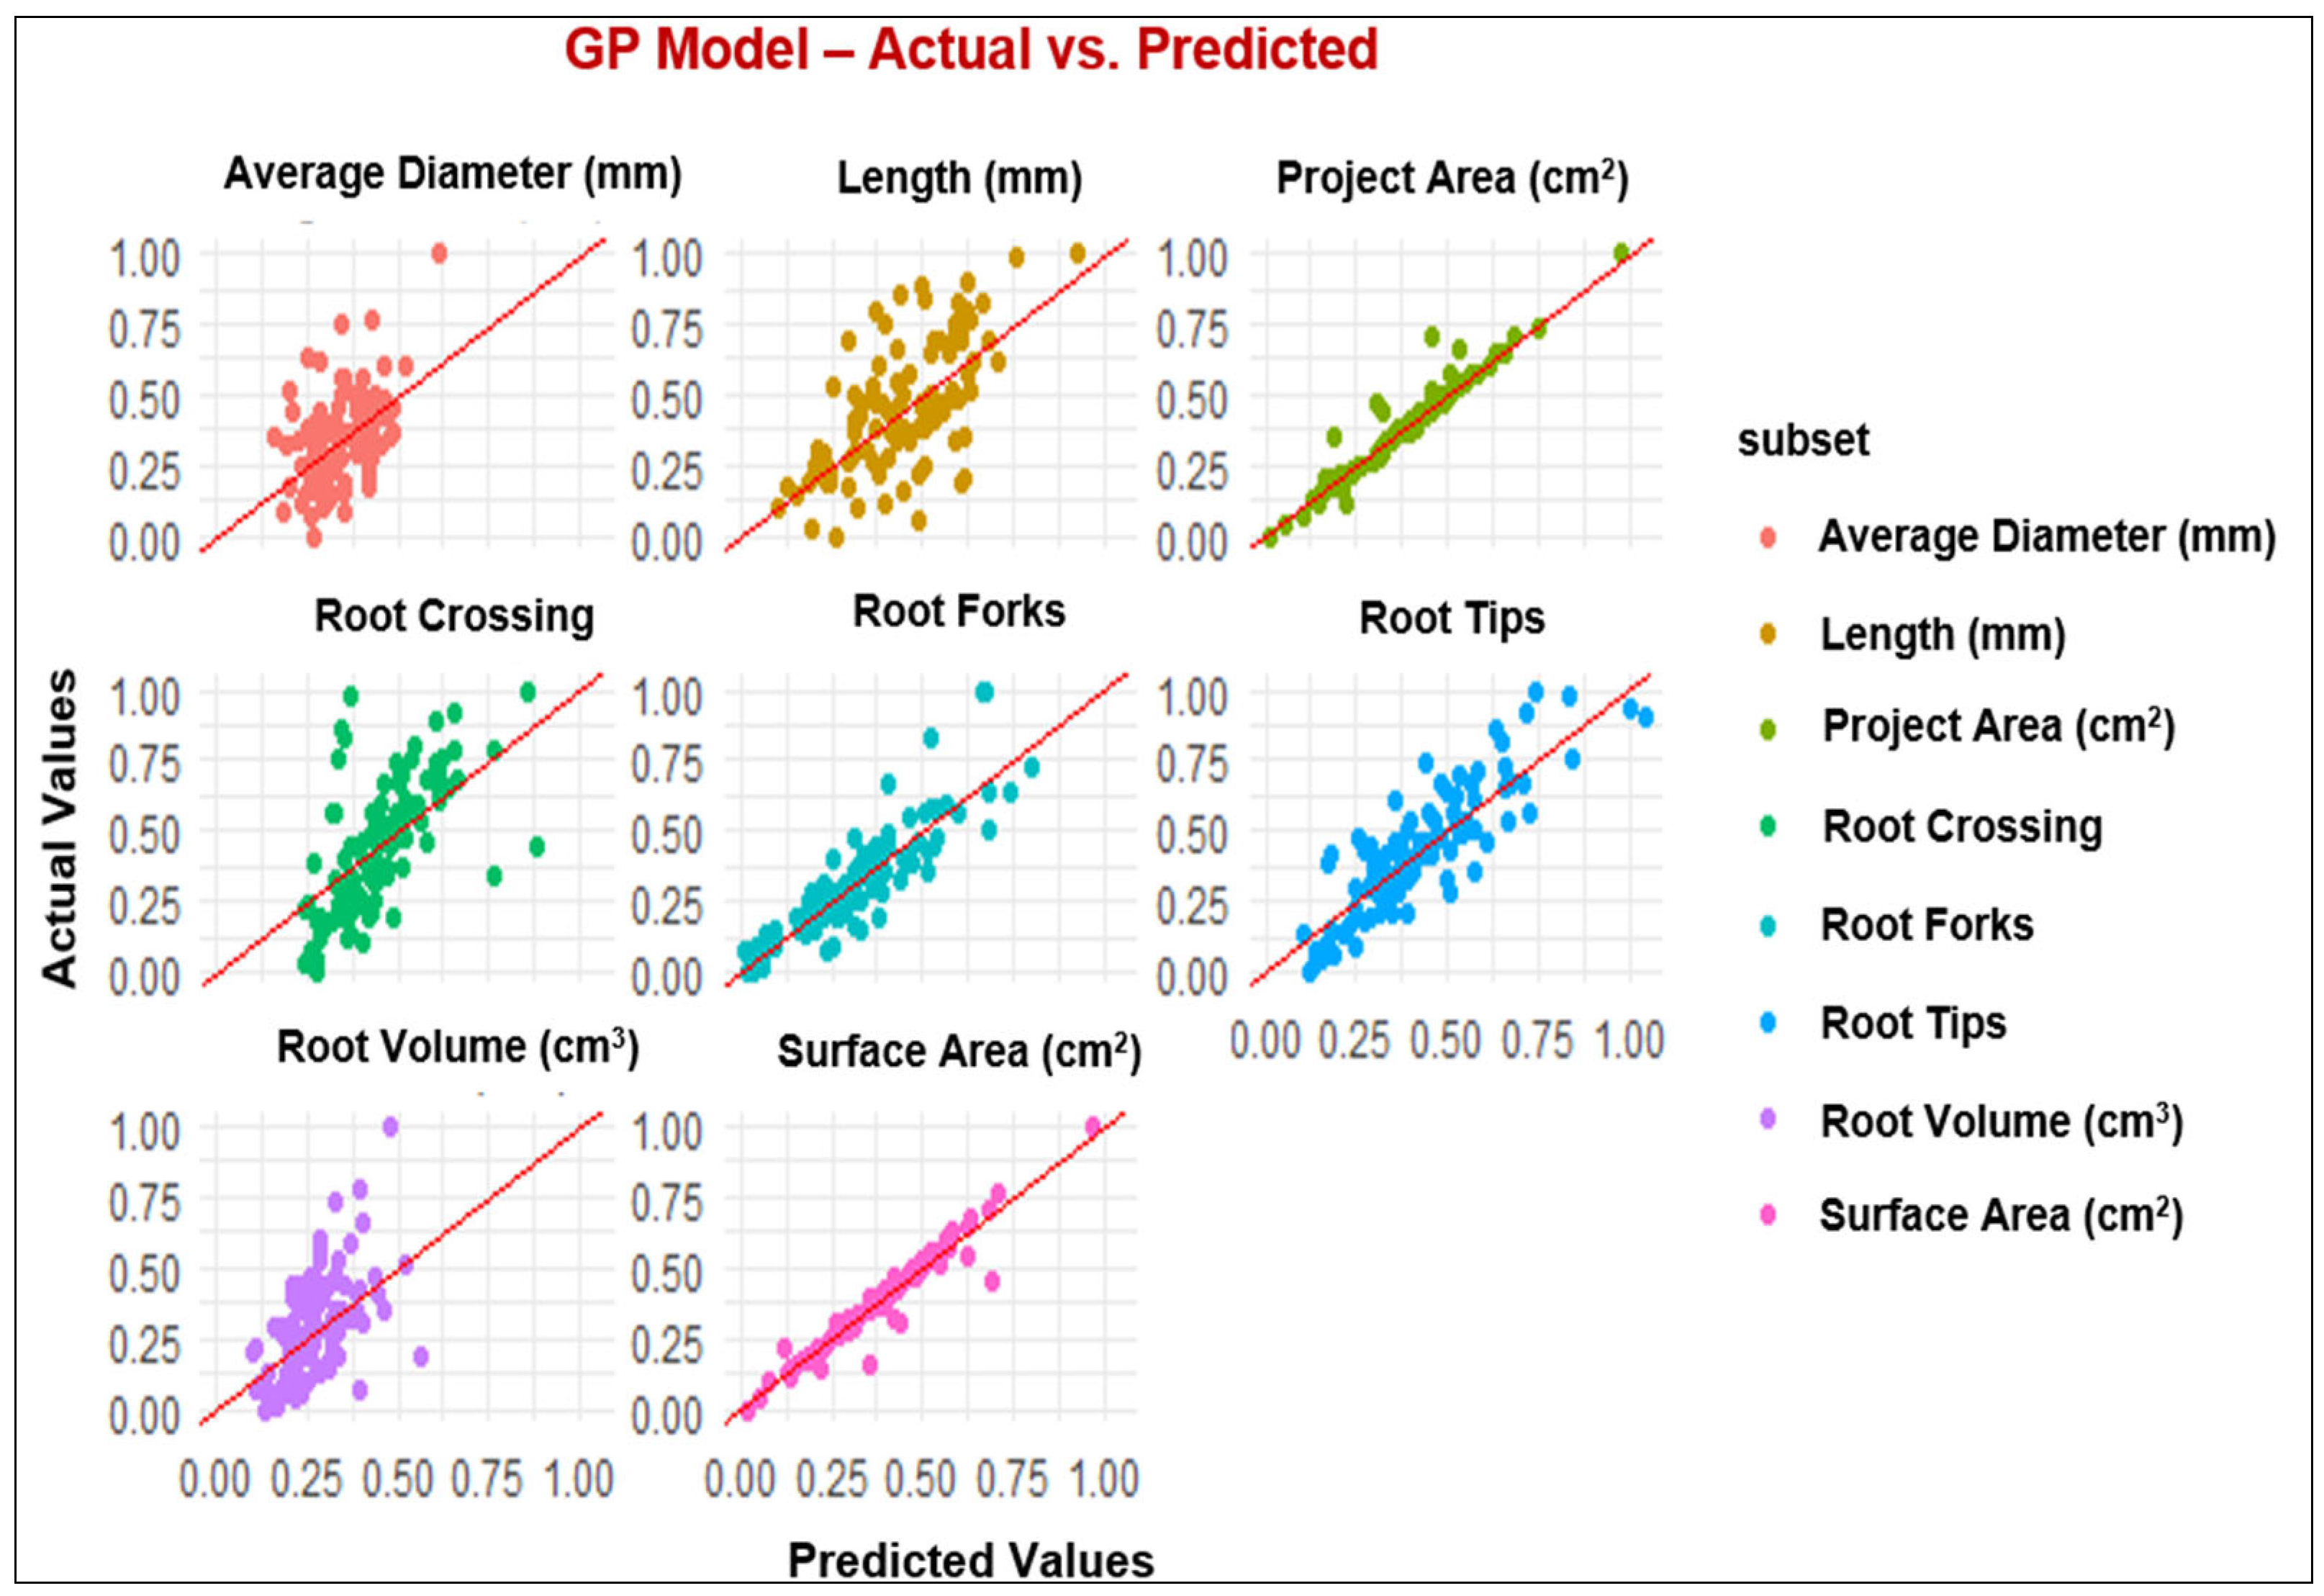
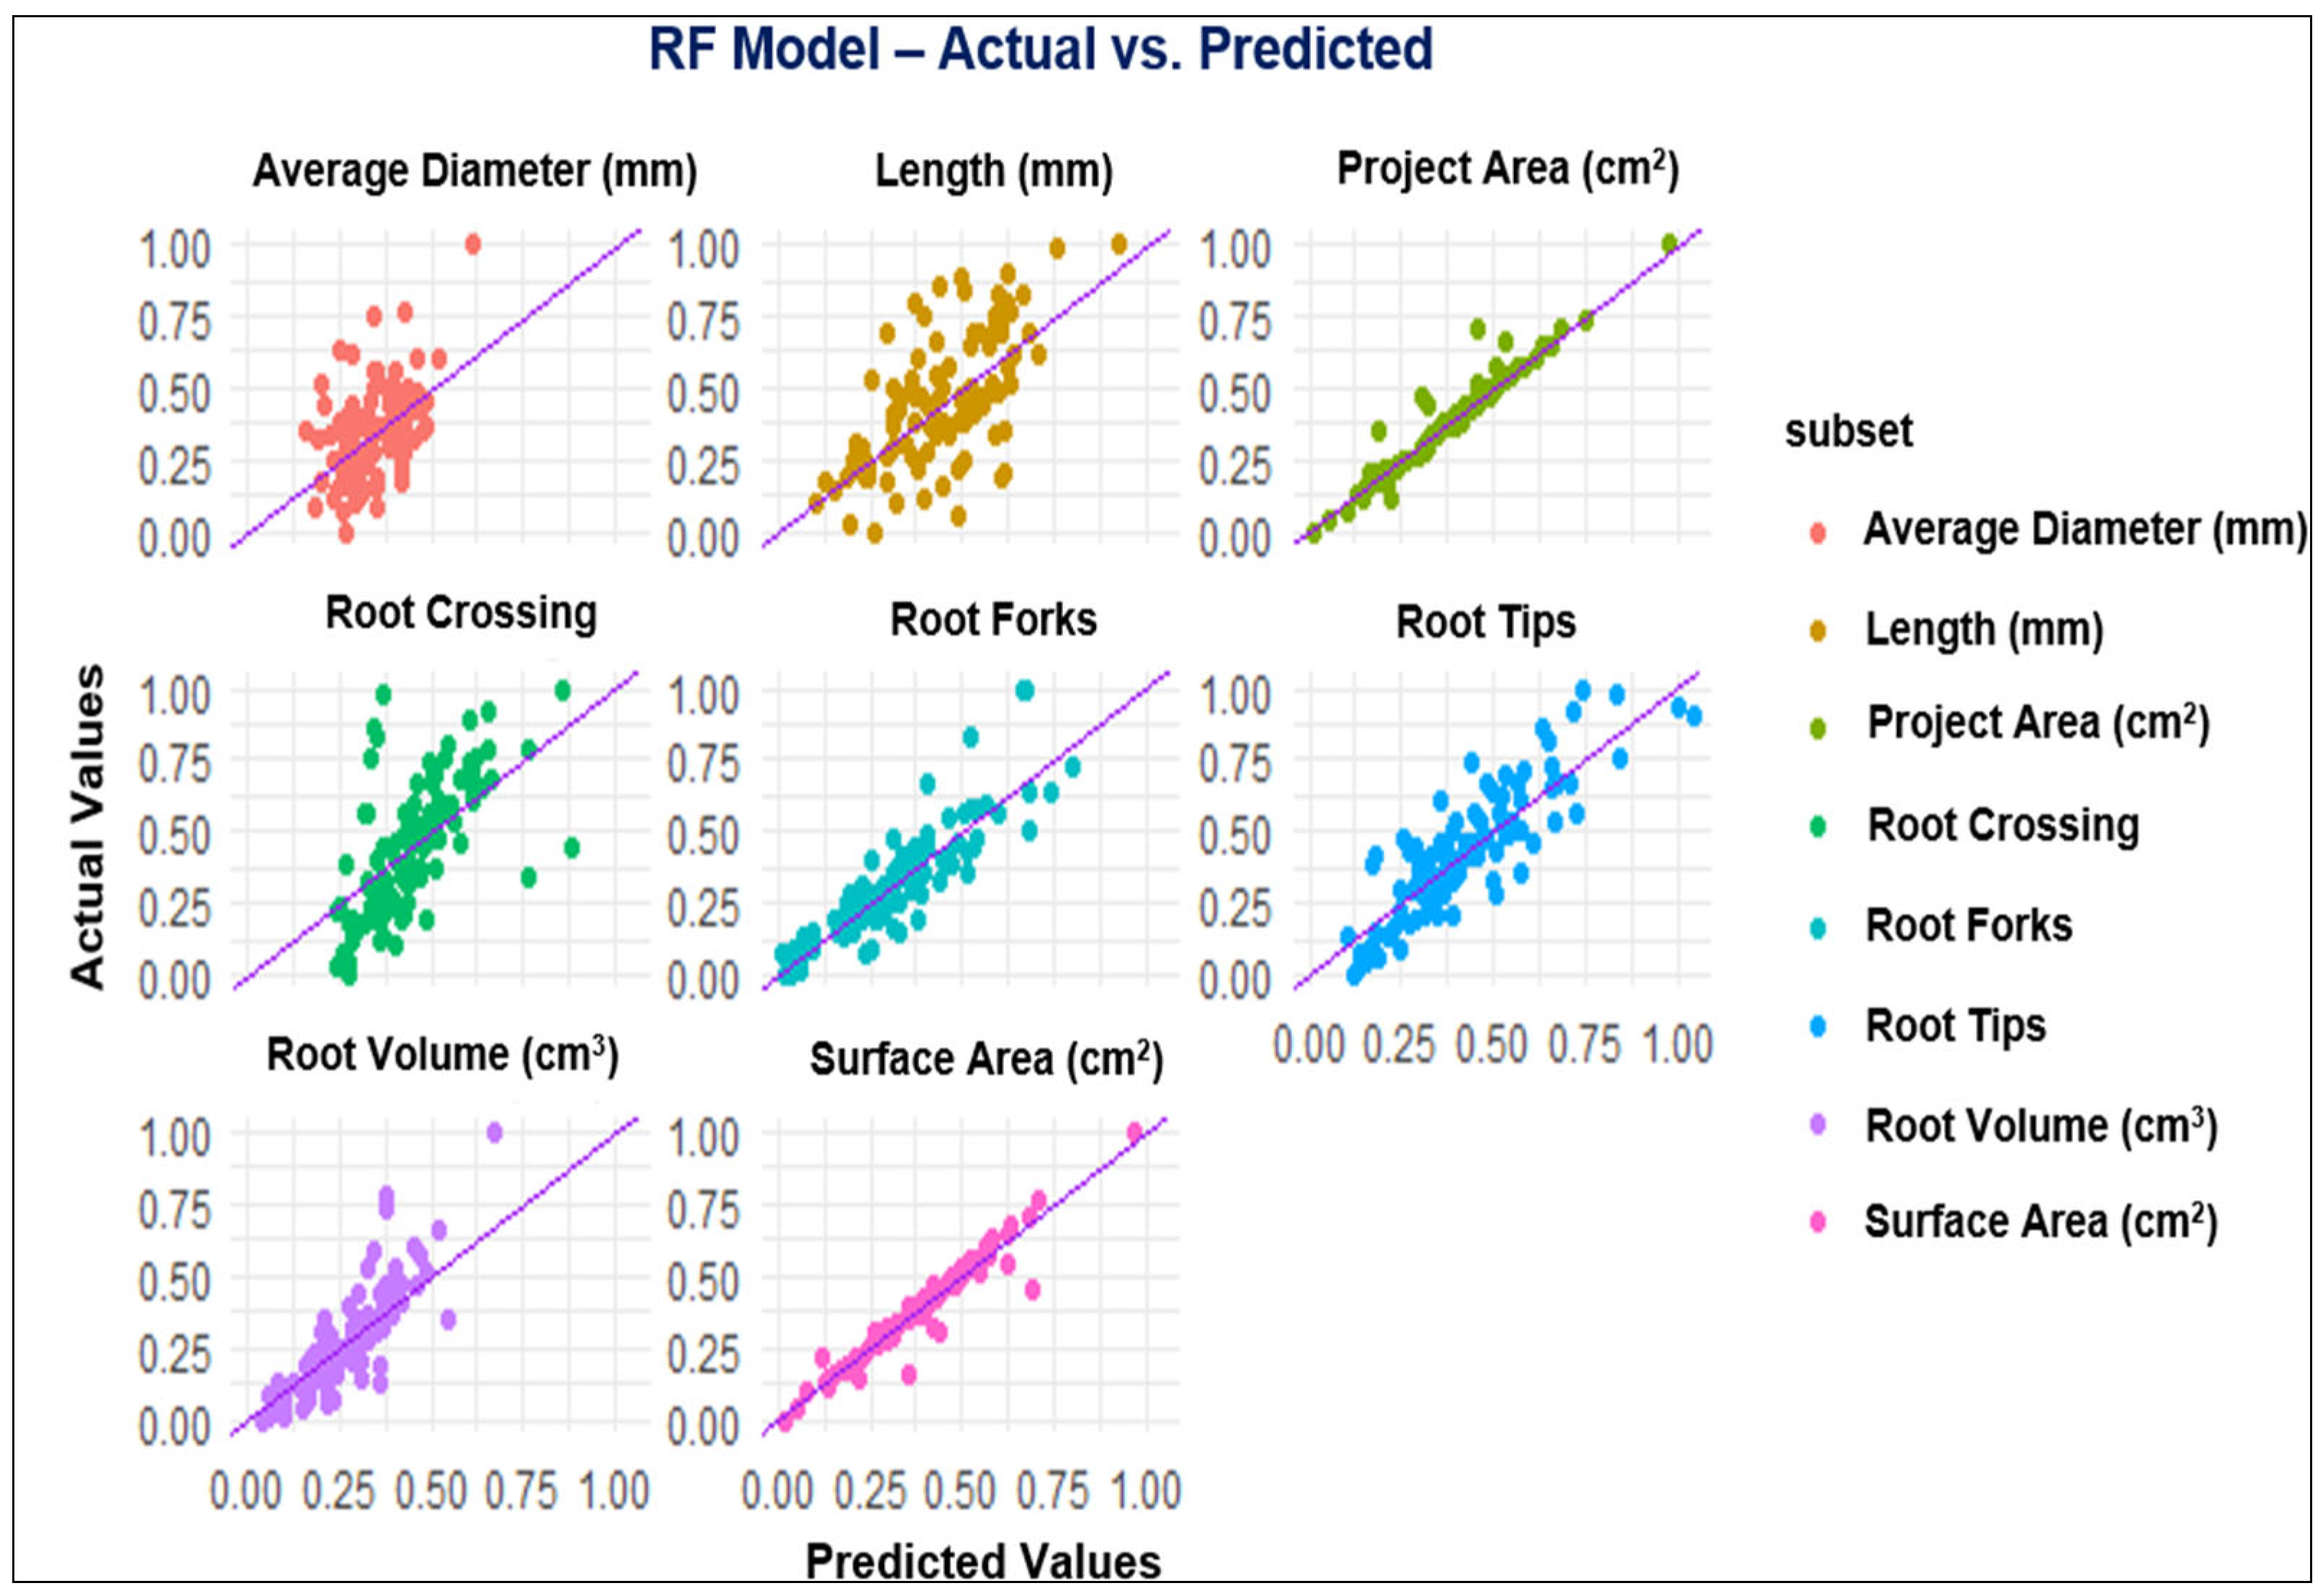
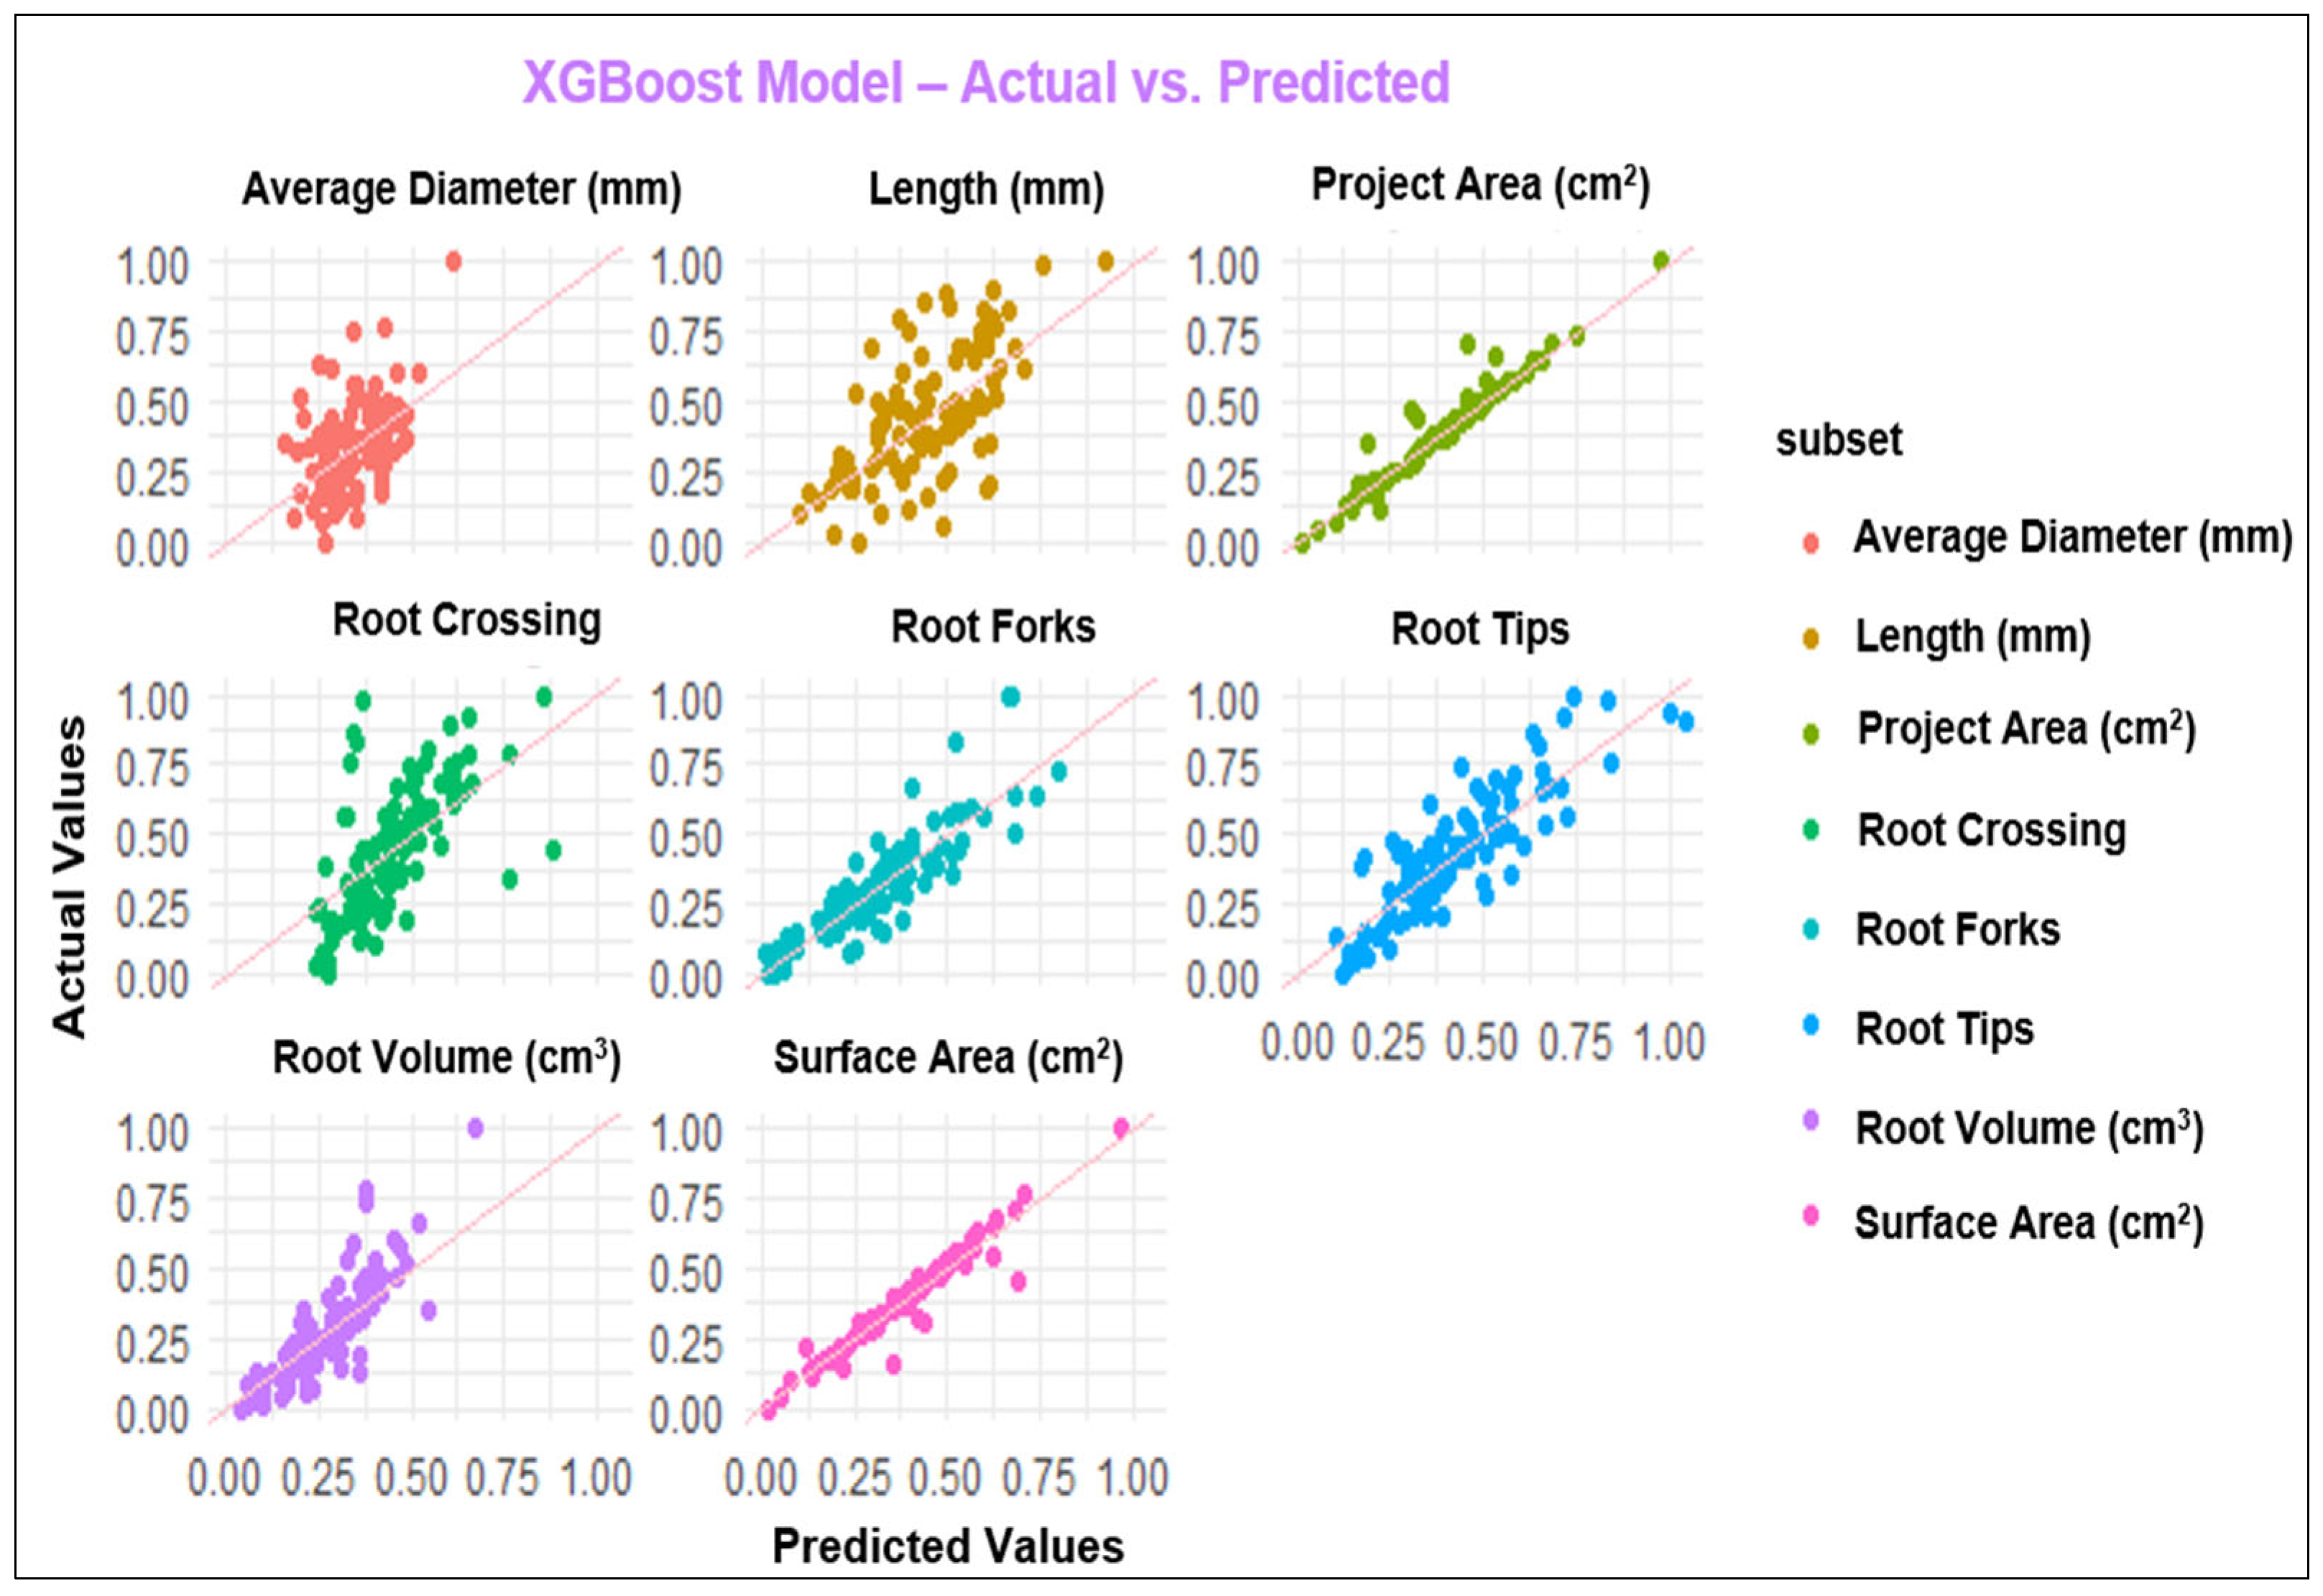
The results were validated and forecasted using three performance measures, namely root mean square error (RMSE), R-squared (R2), and mean absolute error (MAE). The R2 values for the MLP model ranged from 0.35 to 0.95 in the comparative evaluation of various root system characteristics using these models and their performance metrics. The highest R2 value was recorded for projected area and surface area, at 0.95 and 0.94, respectively, while the lowest value was recorded for average diameter. The MAE values were generally low, with the projected and surface areas displaying the lowest values at 0.03. The RMSE values varied from 0.05 to 0.20, with the length recording the highest RMSE value and the projected area and surface area recording the lowest. For the GP model, the R2 values were very close to those of the MLP model, ranging from 0.35 to 0.95. The highest R2 value was recorded for projected and surface areas, at 0.94 and 0.95, respectively, while the lowest value was recorded for average diameter. The MAE values were generally low, with the projected area displaying the lowest value at 0.02. The RMSE values varied from 0.03 to 0.19, with the length recording the highest RMSE value and the projected area recording the lowest value. The random forest (RF) model demonstrated varying R2 values, ranging from 0.22 to 0.91. The highest R2 value of 0.91 was observed in the projected and surface areas, while the lowest value of 0.22 was recorded for the average diameter. The mean absolute error (MAE) values were generally low, ranging from 0.04 to 0.15. The length rate exhibited the highest root mean squared error (RMSE) value of 0.19, while the projected and surface areas displayed the lowest RMSE values. For the XGBoost model, the R2 values ranged from 0.20 to 0.92, with the highest R2 value of 0.92 observed for the surface area and the lowest value of 0.20 for the average diameter. The MAE values for the XGBoost model were generally low, ranging from 0.04 to 0.15. The highest RMSE value of 0.15 was attributed to the length, while the surface area and projected area displayed the minimum RMSE value of 0.04 (as shown in Table 6). The ML and ANN algorithms’ R2 rates were noted in the following order: MLP > GP > RF > XGBoost.
Table 6.
Assessment metrics for ANN-based MLP and ML.
The diagrams in Figure 1, Figure 2, Figure 3 and Figure 4 depict the dissemination of actual and estimated values across various models for examining plant-related metrics. These results offer valuable insights into the predictive capabilities and overall performance of the utilized models when evaluating diverse plant attributes.
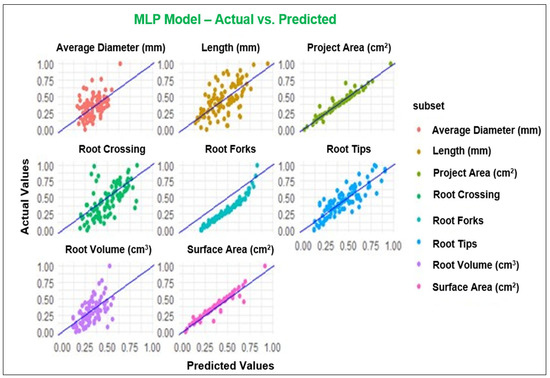
Figure 1.
Observed and predicted values of the parameters using MLP model.

Figure 2.
Observed and predicted values of the parameters using the GP model.

Figure 3.
Observed and predicted values of the parameters using the RF model.
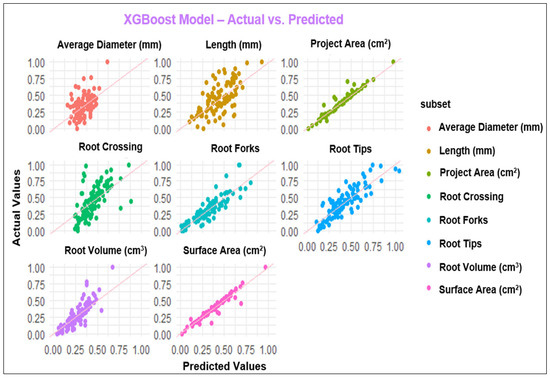
Figure 4.
Observed and predicted values of the parameters using the XGBoost model.
4. Discussion
4.1. Performances of Plant Growth and Root System Architecture
Protein hydrolysates are characterized as blends comprising polypeptides, oligopeptides, and amino acids derived from protein sources through partial hydrolysis [45]. They have been widely demonstrated to enhance plant growth and development, effectively regulating plant biomass and improving crop performance even under challenging environmental conditions [46]. The beneficial impacts of PHs on plant performance have sparked a growing interest in their utilization as a part of a more sustainable cropping system. This interest, in turn, contributes to a promising solution for addressing the issue of waste disposal [47,48,49]. Fish wastes can be transformed into protein hydrolysates comprising small peptides containing 2–20 amino acids [50]. There are several methods, such as alkali hydrolysis, acid hydrolysis, and enzymatic hydrolysis, to produce protein hydrolysate derived from fish waste. Hence, enzymatic hydrolysis is the most promising method commonly used to generate PH, renowned for its high functionality and nutritional value [51,52].
To our knowledge, the impact of employing a fish-derived hydrolysate (FPH) on primrose’s growth parameters and root system architecture has not been documented previously. Additionally, assessing root system architecture integrated with machine learning methods was rarely employed. Consequently, the discussion of the findings will reference results from other plant species or plant-derived hydrolysates.
In our study, applying protein hydrolysate derived from anchovy waste through enzymatic hydrolysis increased leaf area, plant dry weight, and SPAD index and promoted early flowering (Table 3). The present study aligns with results reported by Zeljković et al. [53] in potted primrose, who reported that applying Radifarm, a commercial biostimulant containing peptides, amino acids, betaines, saponins, vitamins, polysaccharides, and microelements, increases fresh and dry weight of root mass and aboveground mass. Carillo et al.’s study [54] tested two different plant-derived protein hydrolysates and one animal-derived protein hydrolysate in chrysanthemum and reported that foliar application of the PHs enhanced SPAD index, flower number, and stem diameter. Cristiano et al. [55] indicated that total leaf area (+29%), total aboveground dry weight (+13%), and photosynthetic rate (+52%) were significantly increased by animal-derived biostimulant application compared to the control, regardless of the dose, in potted snapdragon. Similarly, Al-Malieky and Jerry [56] reported that foliar application of fish-derived hydrolysate (FPH) promoted growth parameters such as leaf area and dry matter in lettuce. Xu and Mou [15] observed that drench application of FPH increased lettuce’s dry weight, leaf number, and chlorophyll content. These results support the potential use of PH comprising short-chain peptides and certain amino acids, such as phenylalanine, that have been reported to increase the production of endogenous auxin by functioning as signaling molecules, showing favorable effects on roots and improved vegetative growth [46,57,58]. In addition, enhancement of chlorophyll content by applying animal-derived PH has been found in corn, soybean, tomato [59], petunia [60], and chrysanthemum [54]. The mechanisms responsible for increased chlorophyll content due to protein hydrolysates remain largely unexplored [59]. However, in this study, FPH contained a high amount of glutamate (Table 1), which plays a crucial role in providing the precursor 5-aminolevulinate, essential in chlorophyll biosynthesis [57,61].
The results of our research demonstrate that drenching applications of FPH, particularly 1.0 g/L treatments, stimulate and significantly modify the root system architecture, increasing surface area, projected area, root volume, root length, root tips, root forks, and root crossing compared to the control group (Table 4 and Table 5). The potential mechanism driving induced root development may be attributed to the auxin-like activity exhibited by FPHs [62]. Raguraj et al. [57] reported that soil-drenching chicken feather protein hydrolysates at the rate of 2 g/L have positive effects on root length and surface area in tea plants. The application of biostimulants based on animal-derived protein hydrolysate at doses of 0.1 and 0.2 g/L positively influences root length, projected area, surface area, and the number of root tips, forks, and crossings in petunia. Similar results were also reported regarding root length, average root diameter, root volume, root tips, crossings, and forks per plant when applying an animal-derived PH biostimulant by Cristiano et al. [55] in snapdragon plants. It has been shown that the root system serves as a comprehensive indicator of the plant’s response to water and nutrient availability [63,64] and enhances the development of the root system resulting from protein hydrolysate applications, which may have also played a significant role in the quality of potted ornamental plants [55].
4.2. Performance of Modeling of Root System Architecture
Assessment of RSA is as crucial as the evaluation of aboveground parts of the plants since plant performance relies on its root architecture and functionality [65]. In the last decade, combining the ML platform with root phenotyping has allowed scientists to understand root development, its interaction with different environments, and the classification of the RSA phenotypes for genomic breeding [66]. The present study employed MLP, GP, RF, and XGBoost to predict RSA under the application of FPH, and all the models with the R2 values between 0.75 to 0.95 showed high performance for the parameters, including projected area, surface area, root tips, and root forks. While the models demonstrated good performance across most of the parameters evaluated, the poorest performance was in root diameter. It is possible that input variables could not explain the behavior of the mentioned parameter [67]. Duarte et al. [67] studied machine learning applied to predict the root architecture of soybean cultivars under two water availability conditions. They reported that none of the models, including a linear model (LM), RF, MLP, and XGBoost, was efficient in estimating the average diameter of soybean root, and the XGBoost model presented the worst performance among the machine learning models. These results are consistent with our results because MLP and GP models exhibited the best performance among the models considering the results for all parameters. In contrast, XGBoost presented the poorest performance compared to the other models with low R2 values (Table 6).
5. Conclusions
This study evaluated plant growth of primrose treated with different concentrations of PH derived from anchovy by-products and applied machine learning methods (MLP, GP, RF, and XGBoost) to predict RSA. The 1.0 g/L FPH treatment significantly improved plant growth and modified the RSA of primrose. The results show that the PHs derived from anchovy waste have valuable potential for primrose cultivation to enhance plant growth and development.
In general, machine learning methods, particularly MLP and GP with better values for R2, MAE, and RMSE, exhibited sufficient potential to predict the root architecture of primrose varieties. Additionally, these algorithms allowed us to assess the input variables. Among the input variables, projected area, surface area, root volume, root tips, and root forks were the most important parameters when using machine learning algorithms. The primary advantage of this approach was streamlining the predictive process, necessitating only a single model to forecast examined root variables. Consequently, it is inferred that machine learning models, particularly MLP and GP, can effectively predict RSA variables of primrose varieties.
Funding
This research received no external funding.
Data Availability Statement
Data are contained within the article.
Acknowledgments
The author would like to thank Birol Kurt and Ondokuz Mayıs University, R&D Coordination Office, Academic Writing Advisory Unit, for the English language editing of the manuscript.
Conflicts of Interest
The author declares no conflicts of interest.
References
- Karlsson, M. Primula culture and production. HortTechnology 2001, 11, 627–635. [Google Scholar] [CrossRef]
- Tütüncü, M.; Dalda-Sekerci, A.; Bulut, F.; Şimşek, Ö. Comprehensive assessment of genetic variation in native heterostylous primrose genotypes of Türkiye. Not. Bot. Horti Agrobot. Cluj-Napoca 2023, 51, 13276. [Google Scholar] [CrossRef]
- Davitkovska, M.; Kabranova, R.; Bogevska, Z.; Popsimonova, G.; Agic, R.; Zeljković, S.; Dorbić, B. Quality examination of Primula acaulis Hill. treated with two different fertilizers. J. Agric. Food Environ. Sci. 2021, 75, 45–51. [Google Scholar]
- Salehpour, T.; Khanali, M.; Rajabipour, A. Environmental impact assessment for ornamental plant greenhouse: Life cycle assessment approach for primrose production. Environ. Pollut. 2020, 266, 115258. [Google Scholar] [CrossRef]
- Rouphael, Y.; Colla, G. Biostimulants in agriculture. Front. Plant Sci. 2020, 11, 511937. [Google Scholar] [CrossRef] [PubMed]
- Bhupenchandra, I.; Chongtham, S.K.; Devi, E.L.; Choudhary, A.K.; Sahoo, M.R.; Dasgupta, M. Role of biostimulants in mitigating the effects of climate change on crop performance. Front. Plant Sci. 2022, 13, 967665. [Google Scholar] [CrossRef]
- Ugolini, L.; Malaguti, L.; Matteo, R.; Pagnotta, E.; Beleggia, R.; Righetti, L. Protein Hydrolysates from Crambe abyssinica Seed Cake as Potential Biostimulants for Root Development. Agronomy 2023, 13, 2755. [Google Scholar] [CrossRef]
- Madende, M.; Hayes, M. Fish by-product use as biostimulants: An overview of the current state of the art, including relevant legislation and regulations within the EU and USA. Molecules 2020, 25, 1122. [Google Scholar] [CrossRef] [PubMed]
- Sila, A.; Bougatef, A. Antioxidant peptides from marine by-products: Isolation, identification and application in food systems. A review. J. Funct. Foods 2016, 21, 10–26. [Google Scholar] [CrossRef]
- Himaya, S.; Ngo, D.-H.; Ryu, B.; Kim, S.-K. An active peptide purified from gastrointestinal enzyme hydrolysate of Pacific cod skin gelatin attenuates angiotensin-1 converting enzyme (ACE) activity and cellular oxidative stress. Food Chem. 2012, 132, 1872–1882. [Google Scholar] [CrossRef]
- Najafian, L.; Babji, A. A review of fish-derived antioxidant and antimicrobial peptides: Their production, assessment, and applications. Peptides 2012, 33, 178–185. [Google Scholar] [CrossRef] [PubMed]
- Siddik, M.A.; Howieson, J.; Fotedar, R.; Partridge, G.J. Enzymatic fish protein hydrolysates in finfish aquaculture: A review. Rev. Aquac. 2021, 13, 406–430. [Google Scholar] [CrossRef]
- Gao, R.; Yu, Q.; Shen, Y.; Chu, Q.; Chen, G.; Fen, S.; Yang, M.; Yuan, L.; McClements, D.J.; Sun, Q. Production, bioactive properties, and potential applications of fish protein hydrolysates: Developments and challenges. Trends Food Sci. Technol. 2021, 110, 687–699. [Google Scholar] [CrossRef]
- Choi, S.; Colla, G.; Cardarelli, M.; Kim, H.-J. Effects of plant-derived protein hydrolysates on yield, quality, and nitrogen use efficiency of greenhouse grown lettuce and tomato. Agronomy 2022, 12, 1018. [Google Scholar] [CrossRef]
- Xu, C.; Mou, B. Drench application of fish-derived protein hydrolysates affects lettuce growth, chlorophyll content, and gas exchange. Horttechnology 2017, 27, 539–543. [Google Scholar] [CrossRef]
- Liatile, P.C.; Potgieter, G.; Moloi, M.J. A Natural Bio-Stimulant Consisting of a Mixture of Fish Protein Hydrolysates and Kelp Extract Enhances the Physiological, Biochemical and Growth Responses of Spinach under Different Water Levels. Plants 2022, 11, 3374. [Google Scholar] [CrossRef] [PubMed]
- Dewang, S.P.; Devi, C.U. Influence of soil-application of fish-protein hydrolysate liquid on growth and yield of spinach (Spinacia oleracea L.). Asian J. Dairy Food Res. 2021, 40, 69–75. [Google Scholar] [CrossRef]
- Mironenko, G.A.; Zagorskii, I.A.; Bystrova, N.A.; Kochetkov, K.A. The effect of a biostimulant based on a protein hydrolysate of rainbow trout (Oncorhynchus mykiss) on the growth and yield of wheat (Triticum aestivum L.). Molecules 2022, 27, 6663. [Google Scholar] [CrossRef]
- Lei, H.; Zhang, J.; Jia, C.; Feng, J.; Liang, L.; Cheng, Q.; Li, T.; Hao, J. Foliar application of fish protein peptide improved the quality of deep-netted melon. J. Plant Nutr. 2023, 46, 3683–3696. [Google Scholar] [CrossRef]
- Du Jardin, P. Plant biostimulants: Definition, concept, main categories and regulation. Sci. Hortic. 2015, 196, 3–14. [Google Scholar] [CrossRef]
- Palta, J.A.; Turner, N.C. Crop root system traits cannot be seen as a silver bullet delivering drought resistance. Plant Soil 2019, 439, 31–43. [Google Scholar] [CrossRef]
- Sanada, A.; Agehara, S. Characterizing root morphological responses to exogenous tryptophan in soybean (Glycine max) seedlings using a scanner-based rhizotron system. Plants 2023, 12, 186. [Google Scholar] [CrossRef]
- Chung, Y.S.; Lee, U.; Heo, S.; Na, C.-I.; Kim, Y. Image-based machine learning characterizes root nodule in soybean exposed to silicon. Front. Plant Sci. 2020, 11, 520161. [Google Scholar] [CrossRef]
- Zhao, J.; Bodner, G.; Rewald, B. Phenotyping: Using machine learning for improved pairwise genotype classification based on root traits. Front. Plant Sci. 2016, 7, 221684. [Google Scholar] [CrossRef]
- Şimşek, Ö. Machine Learning Offers Insights into the Impact of In Vitro Drought Stress on Strawberry Cultivars. Agriculture 2024, 14, 294. [Google Scholar] [CrossRef]
- Aasim, M.; Katırcı, R.; Akgur, O.; Yildirim, B.; Mustafa, Z.; Nadeem, M.A.; Baloch, F.S.; Karakoy, T.; Yılmaz, G. Machine learning (ML) algorithms and artificial neural network for optimizing in vitro germination and growth indices of industrial hemp (Cannabis sativa L.). Ind. Crops Prod. 2022, 181, 114801. [Google Scholar] [CrossRef]
- van Dijk, A.D.J.; Kootstra, G.; Kruijer, W.; de Ridder, D. Machine learning in plant science and plant breeding. Iscience 2021, 24, 101890. [Google Scholar] [CrossRef]
- Sommer, C.; Gerlich, D.W. Machine learning in cell biology–teaching computers to recognize phenotypes. J. Cell Sci. 2013, 126, 5529–5539. [Google Scholar] [CrossRef]
- Jafari, M.; Shahsavar, A. The application of artificial neural networks in modeling and predicting the effects of melatonin on morphological responses of citrus to drought stress. PLoS ONE 2020, 15, e0240427. [Google Scholar] [CrossRef] [PubMed]
- Niazian, M.; Shariatpanahi, M.E.; Abdipour, M.; Oroojloo, M. Modeling callus induction and regeneration in an anther culture of tomato (Lycopersicon esculentum L.) using image processing and artificial neural network method. Protoplasma 2019, 256, 1317–1332. [Google Scholar] [CrossRef] [PubMed]
- Hesami, M.; Jones, A.M.P. Application of artificial intelligence models and optimization algorithms in plant cell and tissue culture. Appl. Microbiol. Biotechnol. 2020, 104, 9449–9485. [Google Scholar] [CrossRef]
- Kirtis, A.; Aasim, M.; Katırcı, R. Application of artificial neural network and machine learning algorithms for modeling the in vitro regeneration of chickpea (Cicer arietinum L.). Plant Cell Tissue Organ Cult. (PCTOC) 2022, 150, 141–152. [Google Scholar] [CrossRef]
- Korkmaz, K.; Tokur, B.; Yılmaz, U. Enzimatik hidroliz yöntemi kullanılarak balık işleme atıklarından balık protein hidrolizatı üretimi. Yuz. Yıl Univ. J. Agric. Sci. 2021, 31, 502–513. [Google Scholar]
- Korkmaz, K.; Tokur, B. Investigation of the quality parameters of hydrolysates obtained from fish by-products using response surface methodology. J. Food Process. Preserv. 2022, 46, e16296. [Google Scholar] [CrossRef]
- Korkmaz, K.; Tokur, B. Optimization of hydrolysis conditions for the production of protein hydrolysates from fish wastes using response surface methodology. Food Biosci. 2022, 45, 101312. [Google Scholar] [CrossRef]
- Lee, Y.; Hwang, K.T. Changes in physicochemical properties of mulberry fruits (Morus alba L.) during ripening. Sci. Hortic. 2017, 217, 189–196. [Google Scholar] [CrossRef]
- Chan, P.T.; Matanjun, P. Chemical composition and physicochemical properties of tropical red seaweed. Gracilaria changii. Food Chem. 2017, 221, 302–310. [Google Scholar] [CrossRef]
- Kıvrak, İ. Chemical constituents: Water-soluble vitamins, free amino acids and sugar profile from Ganoderma adspersum. Nat. Prod. Res. 2015, 29, 518–523. [Google Scholar] [CrossRef] [PubMed]
- Joint, F. Energy and protein requirements: Report of a joint FAO/WHO/UNU Expert Consultation. In Energy and Protein Requirements: Report of a Joint FAO/WHO/UNU Expert Consultation; World Health Organization: Geneva, Switzerland, 1985; p. 206. [Google Scholar]
- Saribaş, S.; Balkaya, A.; Kandemir, D.; Karaağaç, O. Yerli patlican anaçlarinin (Solanum melongena × Solanum aethiopicum) köklenme potansiyeli ve fenotipik kök mimarisi. Black Sea J. Agric. 2019, 2, 137–145. [Google Scholar]
- Zehra, Ş.; Tütüncü, A.Ç.; Demirkaya, S.; Harun, Ö. Organik ve konvansiyonel fide yetiştiriciliğinin domates fidelerinin kalitesi üzerine etkileri. Anadolu Tarım Bilim. Derg. 2023, 38, 555–564. [Google Scholar]
- Hu, J.; Sun, Y.; Li, G.; Jiang, G.; Tao, B. Probability analysis for grasp planning facing the field of medical robotics. Measurement 2019, 141, 227–234. [Google Scholar] [CrossRef]
- Breiman, L. Random forests. Mach. Learn. 2001, 45, 5–32. [Google Scholar] [CrossRef]
- Chen, T.; Guestrin, C. Xgboost: A Scalable Tree Boosting System. In Proceedings of the 22nd ACM SIGKDD International Conference on Knowledge Discovery and Data Mining, San Francisco, CA, USA, 13–17 August 2016; pp. 785–794. [Google Scholar]
- Schaafsma, G. Safety of protein hydrolysates, fractions thereof and bioactive peptides in human nutrition. Eur. J. Clin. Nutr. 2009, 63, 1161–1168. [Google Scholar] [CrossRef] [PubMed]
- Colla, G.; Nardi, S.; Cardarelli, M.; Ertani, A.; Lucini, L.; Canaguier, R.; Rouphael, Y. Protein hydrolysates as biostimulants in horticulture. Sci. Hortic. 2015, 196, 28–38. [Google Scholar] [CrossRef]
- Ceccarelli, A.V.; Miras-Moreno, B.; Buffagni, V.; Senizza, B.; Pii, Y.; Cardarelli, M.; Rouphael, Y.; Colla, G.; Lucini, L. Foliar application of different vegetal-derived protein hydrolysates distinctively modulates tomato root development and metabolism. Plants 2021, 10, 326. [Google Scholar] [CrossRef] [PubMed]
- Wangkheirakpam, M.; Mahanand, S.; Majumdar, R.; Sharma, S.; Hidangmayum, D.; Netam, S. Fish waste utilization with reference to fish protein hydrolisate—A review. Fish. Technol 2019, 56, 169–178. [Google Scholar]
- Colantoni, A.; Recchia, L.; Bernabei, G.; Cardarelli, M.; Rouphael, Y.; Colla, G. Analyzing the environmental impact of chemically-produced protein hydrolysate from leather waste vs. enzymatically-produced protein hydrolysate from legume grains. Agriculture 2017, 7, 62. [Google Scholar] [CrossRef]
- Sarmadi, B.H.; Ismail, A. Antioxidative peptides from food proteins: A review. Peptides 2010, 31, 1949–1956. [Google Scholar] [CrossRef] [PubMed]
- Ishak, N.; Sarbon, N. A review of protein hydrolysates and bioactive peptides deriving from wastes generated by fish processing. Food Bioprocess Technol. 2018, 11, 2–16. [Google Scholar] [CrossRef]
- Kristinsson, H.G.; Rasco, B.A. Fish protein hydrolysates: Production, biochemical, and functional properties. Crit. Rev. Food Sci. Nutr. 2000, 40, 43–81. [Google Scholar] [CrossRef]
- Zeljković, S.; Parađiković, N.; Vinković, T.; Tkalec, M. Biostimulant application in the production of seedlings of seasonal flowers. Agroznanje 2011, 12, 175–181. [Google Scholar]
- Carillo, P.; Pannico, A.; Cirillo, C.; Ciriello, M.; Colla, G.; Cardarelli, M.; De Pascale, S.; Rouphael, Y. Protein hydrolysates from animal or vegetal sources affect morpho-physiological traits, ornamental quality, mineral composition, and shelf-life of Chrysanthemum in a distinctive manner. Plants 2022, 11, 2321. [Google Scholar] [CrossRef]
- Cristiano, G.; Pallozzi, E.; Tufarelli, V.; De Lucia, B. Effects of an animal-derived biostimulant on the growth and physiological parameters of potted snapdragon (Antirrhinum majus L.). Front. Plant Sci. 2018, 9, 362419. [Google Scholar] [CrossRef] [PubMed]
- Al-Malieky, H.M.; Jerry, A.N. Preparation protein hydrolysates from fish by-product and study effected on lettuce (Lactuca sativa L.) growth, yield, quality and enhanced salt tolerance. Basrah J. Agric. Sci. 2019, 32, 246–255. [Google Scholar] [CrossRef]
- Raguraj, S.; Kasim, S.; Md Jaafar, N.; Nazli, M.H. Growth of tea nursery plants as influenced by different rates of protein hydrolysate derived from chicken feathers. Agronomy 2022, 12, 299. [Google Scholar] [CrossRef]
- Del Buono, D. Can biostimulants be used to mitigate the effect of anthropogenic climate change on agriculture? It is time to respond. Sci. Total Environ. 2021, 751, 141763. [Google Scholar] [CrossRef] [PubMed]
- Horii, A.; McCue, P.; Shetty, K. Seed vigour studies in corn, soybean and tomato in response to fish protein hydrolysates and consequences on phenolic-linked responses. Bioresour. Technol. 2007, 98, 2170–2177. [Google Scholar] [CrossRef]
- Cristiano, G.; De Lucia, B. Petunia performance under application of animal-based protein hydrolysates: Effects on visual quality, biomass, nutrient content, root morphology, and gas exchange. Front. Plant Sci. 2021, 12, 640608. [Google Scholar] [CrossRef]
- Gough, S.P.; Westergren, T.; Hansson, M. Chlorophyll biosynthesis in higher plants. Regulatory aspects of 5-aminolevulinate formation. J. Plant Biol. 2003, 46, 135–160. [Google Scholar] [CrossRef]
- Moreno-Hernández, J.M.; Benítez-García, I.; Mazorra-Manzano, M.A.; Ramírez-Suárez, J.C.; Sánchez, E. Strategies for production, characterization and application of protein-based biostimulants in agriculture: A review. Chil. J. Agric. Res. 2020, 80, 274–289. [Google Scholar] [CrossRef]
- Ryser, P. The mysterious root length. Plant Soil 2006, 286, 1–6. [Google Scholar] [CrossRef]
- Clothier, B.E.; Green, S.R. Roots: The big movers of water and chemical in soil. Soil Sci. 1997, 162, 534–543. [Google Scholar] [CrossRef]
- Zhao, J.; Sykacek, P.; Bodner, G.; Rewald, B. Root traits of European Vicia faba cultivars—Using machine learning to explore adaptations to agroclimatic conditions. Plant Cell Environ. 2018, 41, 1984–1996. [Google Scholar] [CrossRef] [PubMed]
- Xu, Z.; York, L.M.; Seethepalli, A.; Bucciarelli, B.; Cheng, H.; Samac, D.A. Objective phenotyping of root system architecture using image augmentation and machine learning in alfalfa (Medicago sativa L.). Plant Phenomics 2022, 2022, 9879610. [Google Scholar] [CrossRef]
- Duarte, A.B.; de Oliveira Ferreira, D.; Ferreria, L.B.; da Silva, F.L. Machine learning applied to the prediction of root architecture of soybean cultivars under two water availability conditions. Semin. Ciências Agrárias 2022, 43, 1017–1036. [Google Scholar] [CrossRef]

Disclaimer/Publisher’s Note: The statements, opinions and data contained in all publications are solely those of the individual author(s) and contributor(s) and not of MDPI and/or the editor(s). MDPI and/or the editor(s) disclaim responsibility for any injury to people or property resulting from any ideas, methods, instructions or products referred to in the content. |
© 2024 by the author. Licensee MDPI, Basel, Switzerland. This article is an open access article distributed under the terms and conditions of the Creative Commons Attribution (CC BY) license (https://creativecommons.org/licenses/by/4.0/).