Article

Sweet Cherry Fruit Firmness Evaluation Using Compression Distance Methods

by
Maria Karageorgiadou
,
Maria Rodovitou
,
Elpida Nasiopoulou
,
Vaia Styliani Titeli
and
Michail Michailidis
*
Laboratory of Pomology, School of Agriculture, Aristotle University of Thessaloniki, 570 01 Thessaloniki-Thermi, Greece
*
Author to whom correspondence should be addressed.
Horticulturae 2024, 10(5), 435; https://doi.org/10.3390/horticulturae10050435
Submission received: 3 April 2024 / Revised: 19 April 2024 / Accepted: 23 April 2024 / Published: 24 April 2024

Abstract

:
Flesh firmness in sweet cherries is determined using the measurement of normalized deformation force, i.e., determining the required force for a distance equal to 5 or 10% of the diameter of the cherries per millimeter. However, a firmness method involving a defined distance is quite simple and suitable for easy applications. Hence, our study focuses on the impact of fruit physiology under various and fixed distances. To assess the firmness evaluation, two sweet cherry cultivars (Canada Giant and Regina) were selected and subjected to three different levels of compression distance equal to 1%, 5%, 10% of the fruit’s small thickness dimension along with a consistent compression distance of 0.16 mm. There was a strong correlation between panelists’ preferences and the fruit that had been subjected to both a 1% deformation force and a fixed distance of 0.16 mm within each cultivar. Physiological traits, membrane integrity, and the metabolome of the fruit in these categories were mostly unaffected by the control (0%), or 1%, deformation force, as shown by clustering and PCA analysis. The control and 1% deformation force groups showed similar patterns, contrary to those of the 5% and 10% deformation force groups. Given these considerations, a fixed distance of 0.16 mm and a minimal 1% deformation force possess the potential to be employed and implemented for monitoring the firmness of sweet cherries during postharvest preservation.

1. Introduction

Sweet cherry (Prunus avium L.) is greatly perishable at harvest and during postharvest storage but is also widely desirable for its attractive appearance and its nutritional value due to its high content of polyphenol compounds and vitamin C. Sweet cherry fruit displays a short harvest window, while several factors deteriorate its appearance, such as cracking and surface pitting [1,2,3,4]. Beyond the obvious physiological disorders, sweet cherry quality is significantly influenced by firmness and flavor, two of the main factors that determine consumers’ acceptance. Consequently, breeders focus on improving these traits during the development of new cultivars [5]. In particular, cherry fruit firmness is a crucial feature that significantly influences the postharvest preservation of the fruit and its acceptability by customers [6,7,8]. It is noteworthy that consumers are willing to pay more for sweet cherries with an extra unit of sweetness and firmness [9]. Sweet cherry firmness naturally decreases during both on-tree fruit development and the subsequent postharvest period [10,11,12]. This loss of firmness happens due to the activation of enzymes related to pectin degradation, the main stabilizing factor of fruit’s primary cell walls [13]. Nevertheless, it has been reported that sweet cherries with high firmness at harvest preserve higher firmness during cold storage compared to those with lower firmness at harvest [14]. Recently, it has been noted that sweet cherry softening is related to the activation of certain transcription factors. For example, PavMADS7 is an important regulator factor of sweet cherry fruit ripening that induces the ABA-mediated signaling pathway and directly binds to the promoter of the PaPG1 gene, which is involved in sweet cherry softening [15].
In recent years, firmness of the sweet cherry fruit has been evaluated either by applying a fruit size-dependent compression distance (i.e., 2, 3, 10, and 15%) [16,17,18,19] or by applying a fixed compression distance of 1 mm. The force required to deform fruits, is expressed as a normalized deformation force in N mm−1 [20]. In a recent review, it was suggested that high-speed functional equipment should be used for the firmness assessment of sweet cherries, especially in cases where quick and reproducible testing is necessary [21]. To date, several methods have been reported to determine the firmness of cherries such as penetration tests using instruments like the Effe-gi Tester, Magness-Taylor Device, Durofel, and Chatillon, etc. [22], puncture tests [23], Firmtech equipment [24], acoustic firmness sensors and compression tests applying pressure until a small deformation is reached, typically between 2% and 20% of fruit diameter [21,25,26]. In addition, a high positive correlation of the sweet cherry firmness between the trained panelists with the Firmtech2 device, which by applying 1 mm compression determines the maximum force required to achieve deformation, has been demonstrated [7,8]. Novel technologies for non-destructive measuring of sweet cherries’ firmness using color sensors and near-infrared diffuse reflectance spectroscopy have been developed [27,28], but with controversial effectiveness on the prediction of firmness [29]. While the mechanical characteristics of several fruits have been examined [30], there is limited knowledge about the interaction between these traits and the physiological responses of the fruits. Currently, there is no established method for evaluating the firmness of sweet cherries at harvest and the postharvest period. In the present study, the main objective is to investigate the physiological impact of sweet cherries flesh firmness determination under different deformation distances and secondly, to uncover the deformation distance with the minimum effect on fruit physiology. For this purpose, experiments were carried out on two cherry cultivars (Canada Giant and Regina) to assess the firmness of sweet cherries. The tests involved applying various levels of compression dependent on the size of the fruit (1%, 5%, and 10%), as well as a fixed compression distance of 0.16 mm in the smallest thickness dimension of the fruit. Following the determination of textural properties, several fruit quality traits, sensory assessments of firmness, and primary metabolites of the fruits were evaluated.

2. Materials and Methods

2.1. Plant Material and Sampling Process

Fruit of two sweet cherry cultivars, namely Canada Giant (is a traditional cultivar, widely cultivated in Greece, [31]) and Regina (is a traditional, late harvest and cracking tolerant cultivar [3]) were collected with a soluble solid concentration of 16.3 ± 0.2 and 19.4 ± 0.3% Brix and a titratable acidity of 0.7 ± 0.1 and 0.6 ± 0.1% malic acid, respectively, in representative samples (5 replicates of 10 cherries per cultivar) at the commercial harvest stage. The experiment was conducted in a commercial sweet cherry orchard (Arnissa, Pellas’s region, North Greece) during the 2023 growing season. The orchard consisted of 10-year-old trees planted at 3.5 × 1.25 m spacing between rows and along the row, grafted onto ‘Gisela 5’ rootstock, trained in tall spindle axe, and subjected to standard cultural practices. The experimental design was a completely randomized design (CRD). Fruit of each cultivar were picked and immediately transferred to the facilities of the Pomology Laboratory in the Farm of the Aristotle University of Thessaloniki. From a total of 900 fruit, 300 fruit were randomly divided into three 100-fruit sub-lots, and fruit firmness was assessed as described in detail below (Section 2.2). Ninety cherries were used for repeat measurements of firmness (see also Section 2.2). The assessment of firmness of 42 sweet cherry fruit was conducted by the panelists in each cultivar; further details are available in Section 2.3. The remaining 400 fruit were randomly divided into four equal groups, and deformation forces of 0% (control), 1, 5, and 10% were applied. Following these treatments, the flesh firmness and the quality traits of the fruit were evaluated.

2.2. Textural Properties

Fruit deformation forces, corresponding to 1, 5, and 10% of the fruit’s small thickness dimension, were determined using a TA.XT.plusC Texture Analyzer (Stable Microsystems, Godalming, Surrey, UK), as previously described with slight modifications [17,19]. In particular, fruit firmness of 100 fruit of each condition (1, 5, and 10% fruit size and deformation forces) and cultivar was measured at harvest using a flat steel platen (75 mm diameter) fitted on the machine’s branch; sweet cherries were placed with their small diameters on a stable steel surface. The required force in Newtons (N) for 1, 5, and 10% diameter compression (fruit size-dependent compression distance) or compression of 0.16 mm (fixed compression distance) on the small thickness dimension of fruit was recorded. The speed of the compression platen was set to 20 mm s−1. The normalized deformation force of sweet cherries firmness, expressed in N mm−1, was calculated as the ratio of the required force in order to achieve 1, 5, and 10% (fruit size-dependent compression distance) or 0.16 mm (fixed compression distance) deformation forces to the required distance of the platen in mm to achieve the deformation force during fruit compression in the small diameter of sweet cherries. Arithmetic data of 100 fruit for each treatment are provided in Table S1.
Also, to test if the repetition of the measurement processes affects the cherry fruit physiology, another 3 tests were performed for each condition (1, 5, and 10% fruit deformation forces) and cultivar using 10 cherries for each test (in total 90 sweet cherries per cultivar), as follows: (a) Calculation of the deformation force ratio after 5 successive compressions between the initial measurement in N mm−1 and the final measurement in N mm−1, expressed as an increase in the required normalized force (percentage, %). (b) Calculation of the deformation force ratio at harvest and after 2 days at 20 °C between the final measurement in N mm−1 and the initial measurement in N mm−1, expressed as a reduction in the required normalized force (percentage, %). (c) Calculation of the deformation force ratio at harvest and after 7 days at 4 °C between the final measurement in N mm−1 and the initial measurement in N mm−1, expressed as a reduction in the required normalized force (percentage, %).
Fruit classification (described in detail in Section 2.3) of 7 individual sweet cherries was also determined (in N mm−1) for each category (low and high fruit firmness based on panelist’s classification), condition (1, 5 and 10% fruit deformation forces), and cultivar.

2.3. Firmness Assessment by Panelist

Every one of the seven panelists randomly selected 6 sweet cherries, which were classified into low and high flesh firmness (3 for each category), respectively, from a batch of at least 100 sweet cherries per cultivar. The selection and classification of 6 sweet cherries by the panelists were performed by squeezing them in their small thickness fruit dimension between their index finger and their thumb. Thereafter, one sweet cherry from each panelist and class was determined under the three conditions (1, 5 and 10% = varied distance or 0.16 mm = fixed distance, fruit deformation forces, 7 sweet cherries in each condition). The results were expressed as normalized deformation force in N mm−1 and the arithmetic data are provided in Table S1.

2.4. Evaluation of the Fruit’s Cellular Damage

Membrane integrity of sweet cherries was tested as relative electrical conductivity (REC, %), as previously described [23] with slight modifications. Ten fruit per treatment, time-point, and cultivar were selected and were cut on both sides of their small thickness dimension (2 slices, 4 ± 0.2 g), and then they were submerged in 30 mL of deionized water for 30 min at 20 °C. The electrolyte content of the solution was determined by measuring the electrical conductivity with a conductivity meter in μS cm−1 (model HI 9033 and probe HI 7630, Hanna Instruments, Smithfield, RI, USA). Total electrolytes of the fruit slices were determined after boiling them for 15 min and then allowed to reach 20 °C, when electrical conductivity was recorded again. Relative electrical conductivity (REC, %) was calculated as the percentage of a ratio of electrical conductivity just after 30 min to total electrolytes. Data are provided in Table S2.

2.5. Fruit Weight Loss and Respiration Rate

To determine fruit weight loss (%), weight of three batches of ten fruit from each treatment (0% (control), 1%, 5%, and 10% deformation forces) and cultivar were recorded at harvest and after 4, 24, and 48 h using an analytical balance (0.001 g). Furthermore, fruit respiration rate was measured by enclosing fruit in 2 L air-tight jars for 30 min at 20 °C and CO2 production was determined in a 1 mL gas sample from the air of the jars by injecting it into a gas chromatograph (Shimadzu GC-2014, Kyoto, Japan), coupled with a thermal conductivity detector (TCD). To calculate CO2 concentration, a correction was conducted by subtracting the ppm CO2 of the laboratory air from that detected in the jars. The results were expressed as mL CO2 kg−1 h−1. Data are provided in Table S2.

2.6. Quantification of Primary Metabolites

Frozen (−80 °C) ground exo-and meso-carp tissues (0.5 g) of each treatment and cultivar in triplicate (biological replicates) in 48 h after treatments were transferred into 2 mL screw-cap tubes for primary polar metabolite extraction, as previously described with slight modifications [32]. In brief, 1.4 mL pure methanol and 0.1 mL of 1 mg mL−1 adonitol were added and incubated for 10 min at 70 °C. After centrifugation (10,000× g), the supernatant was collected, and 0.75 mL chloroform and 1.5 mL dH2O were added. From the upper polar phase, 0.15 mL was dried at room temperature (RT) under vacuum. The residue was redissolved in 0.04 mL methoxyamine hydrochloride at a concentration of 20 mg mL−1, and incubated for 120 min at 37 °C. Then it was derivatized with 0.07 mL N-methyl-N-(trimethylsilyl) tri-fluoroacetamide reagent (MSTFA) for 30 min at 37 °C. The GC–MS analysis was carried out with a Perkin Elmer Clarus™ SQ 8S (Waltham, MA, USA) as described in detail [33]. Compound peak identification was determined using standards or the NIST11 database and the GOLM metabolome database (GMD) in cases of unknown peaks [34]. The metabolites were presented based on the area after peak quantification compared to the area of adonitol (internal standard) and expressed as the relative abundance of adonitol. Data on metabolite description and relative abundance are provided in Table S3.

2.7. Statistical Analysis

Fruit textural properties, physiological traits, and polar primary metabolites were conducted using SPSS (SPSS v25.0., Chicago, IL, USA) by multivariate analysis of variance (MANOVA). Mean values were compared by the Student’s t-test, the least significant difference (LSD), and the Duncan’s multiple range test (p ≤ 0.05). Furthermore, root-mean-square error (RMSE) was calculated using the R-package (ver. 3.6.2.). Metabolite visualization and clustering (hierarchical and PCA) were conducted using the Clustvis tool ver. 2.0 [35].

3. Results

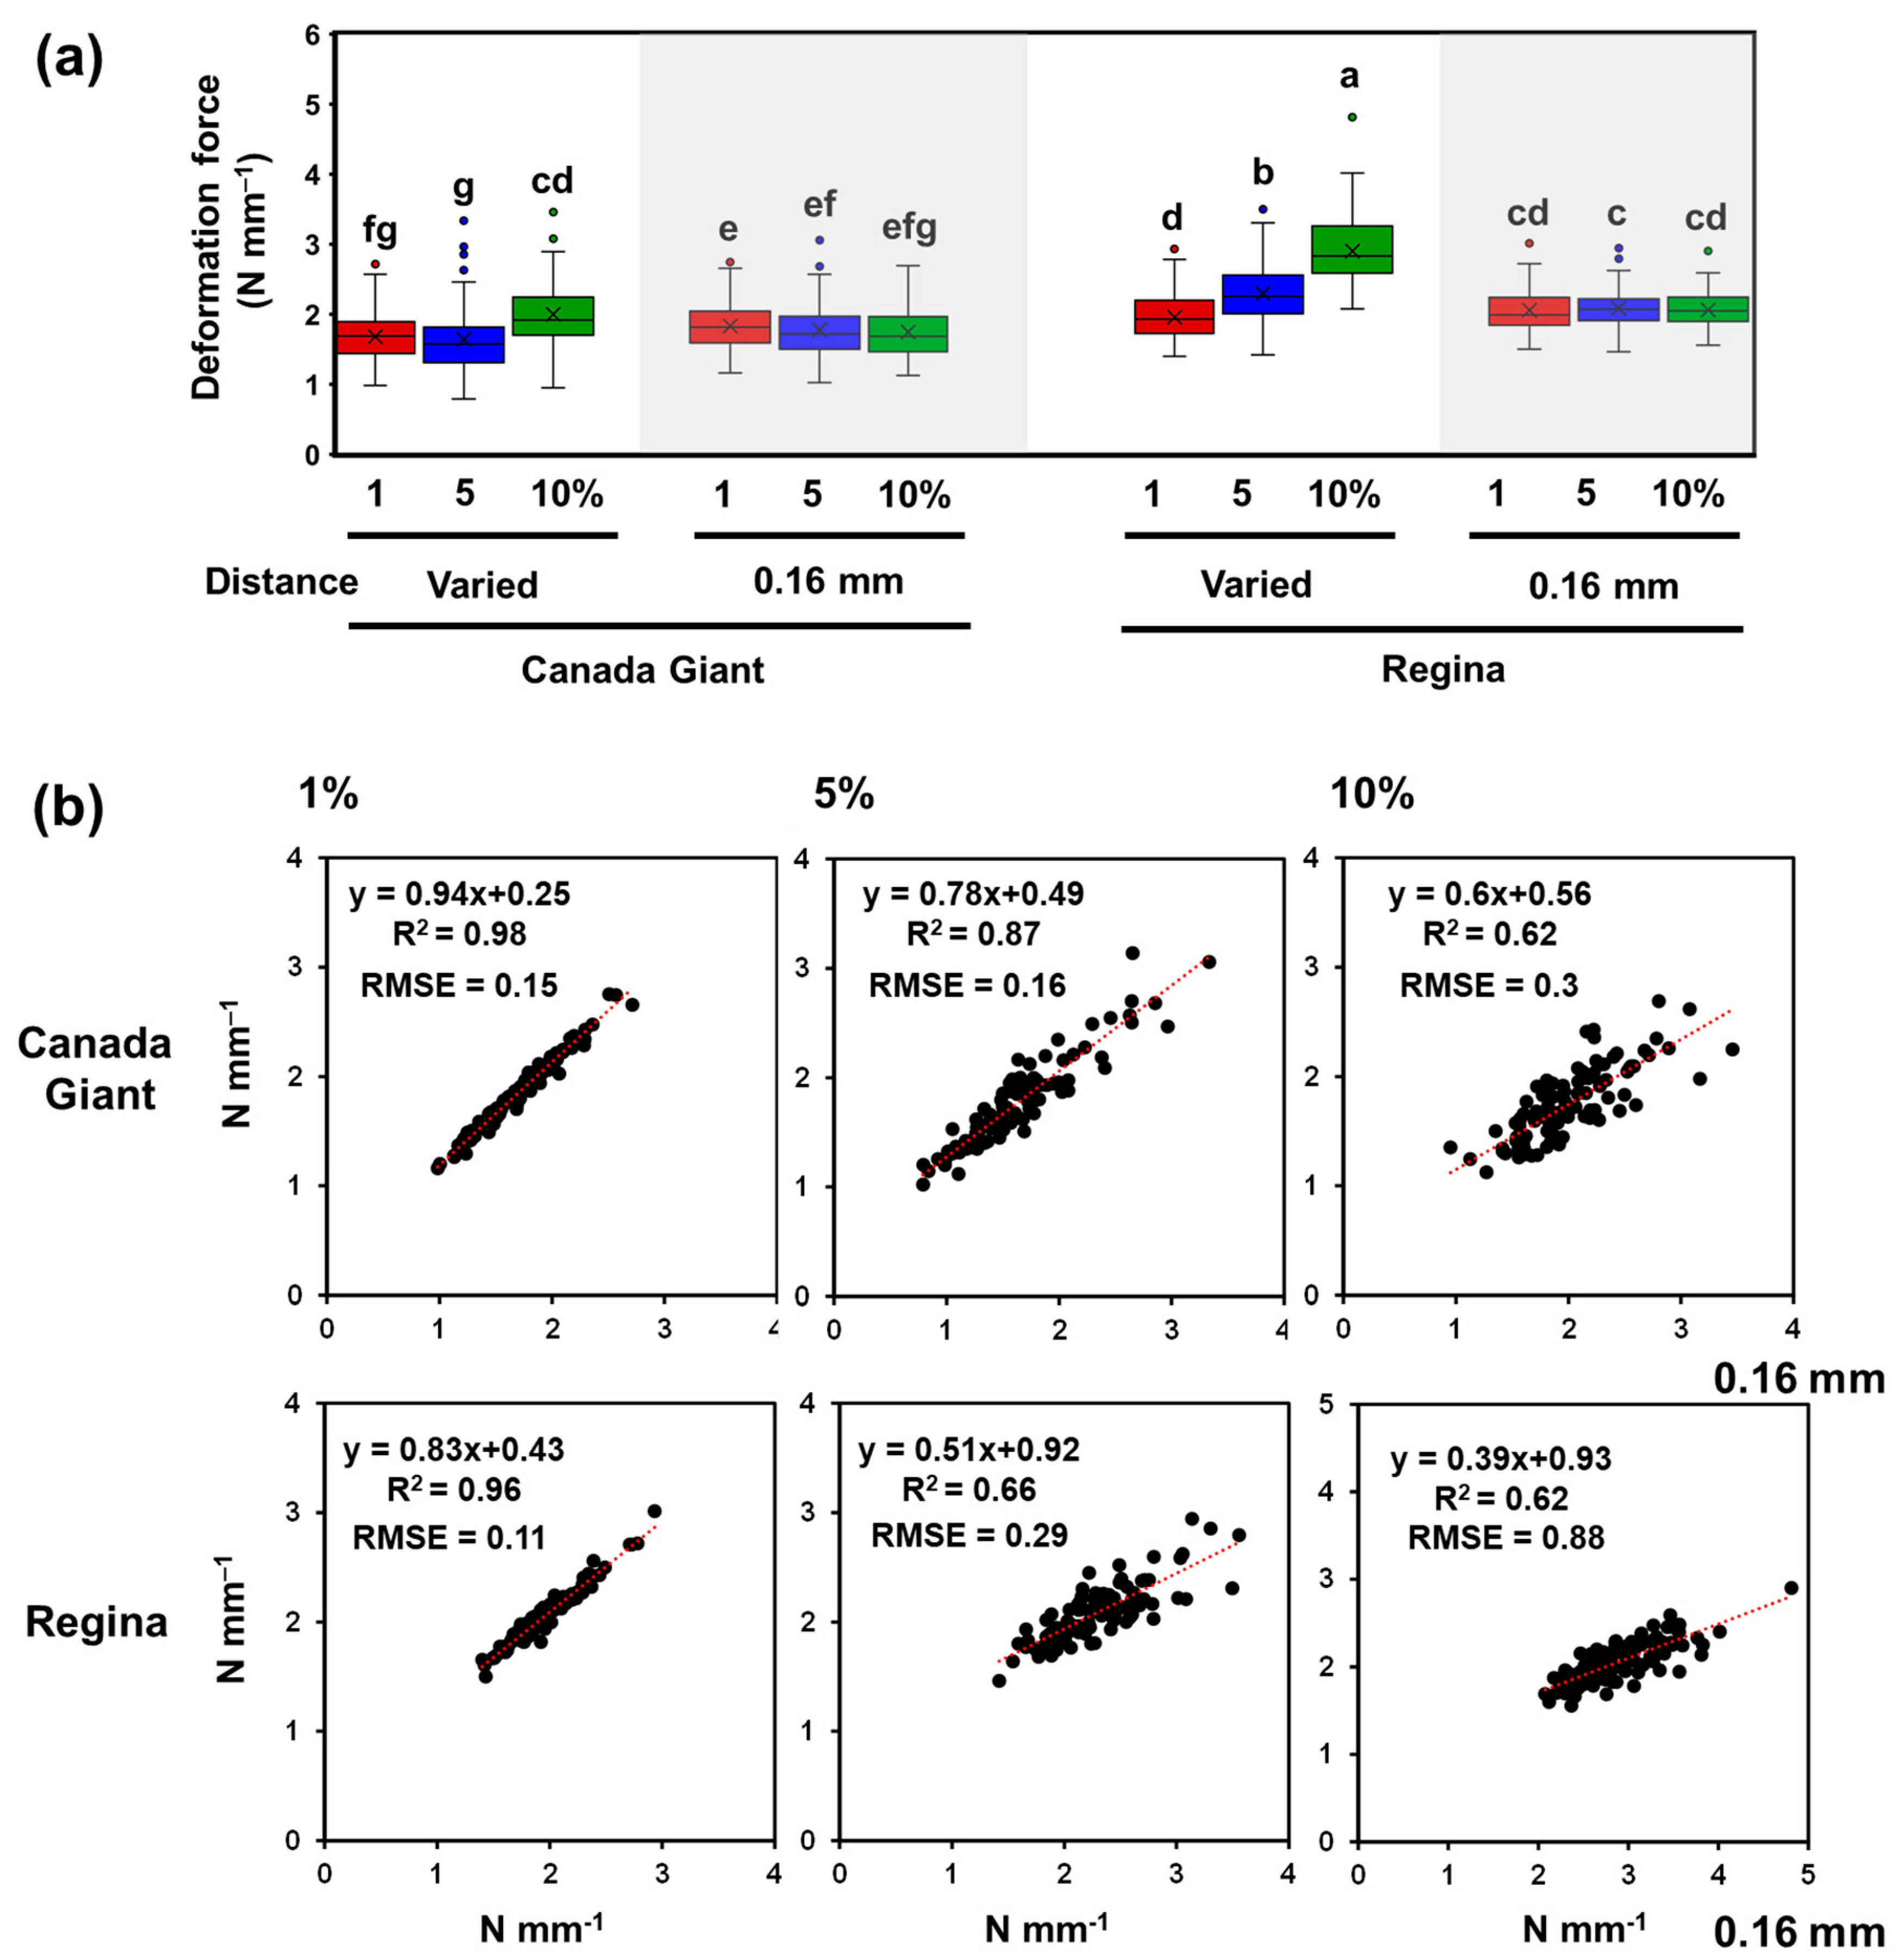
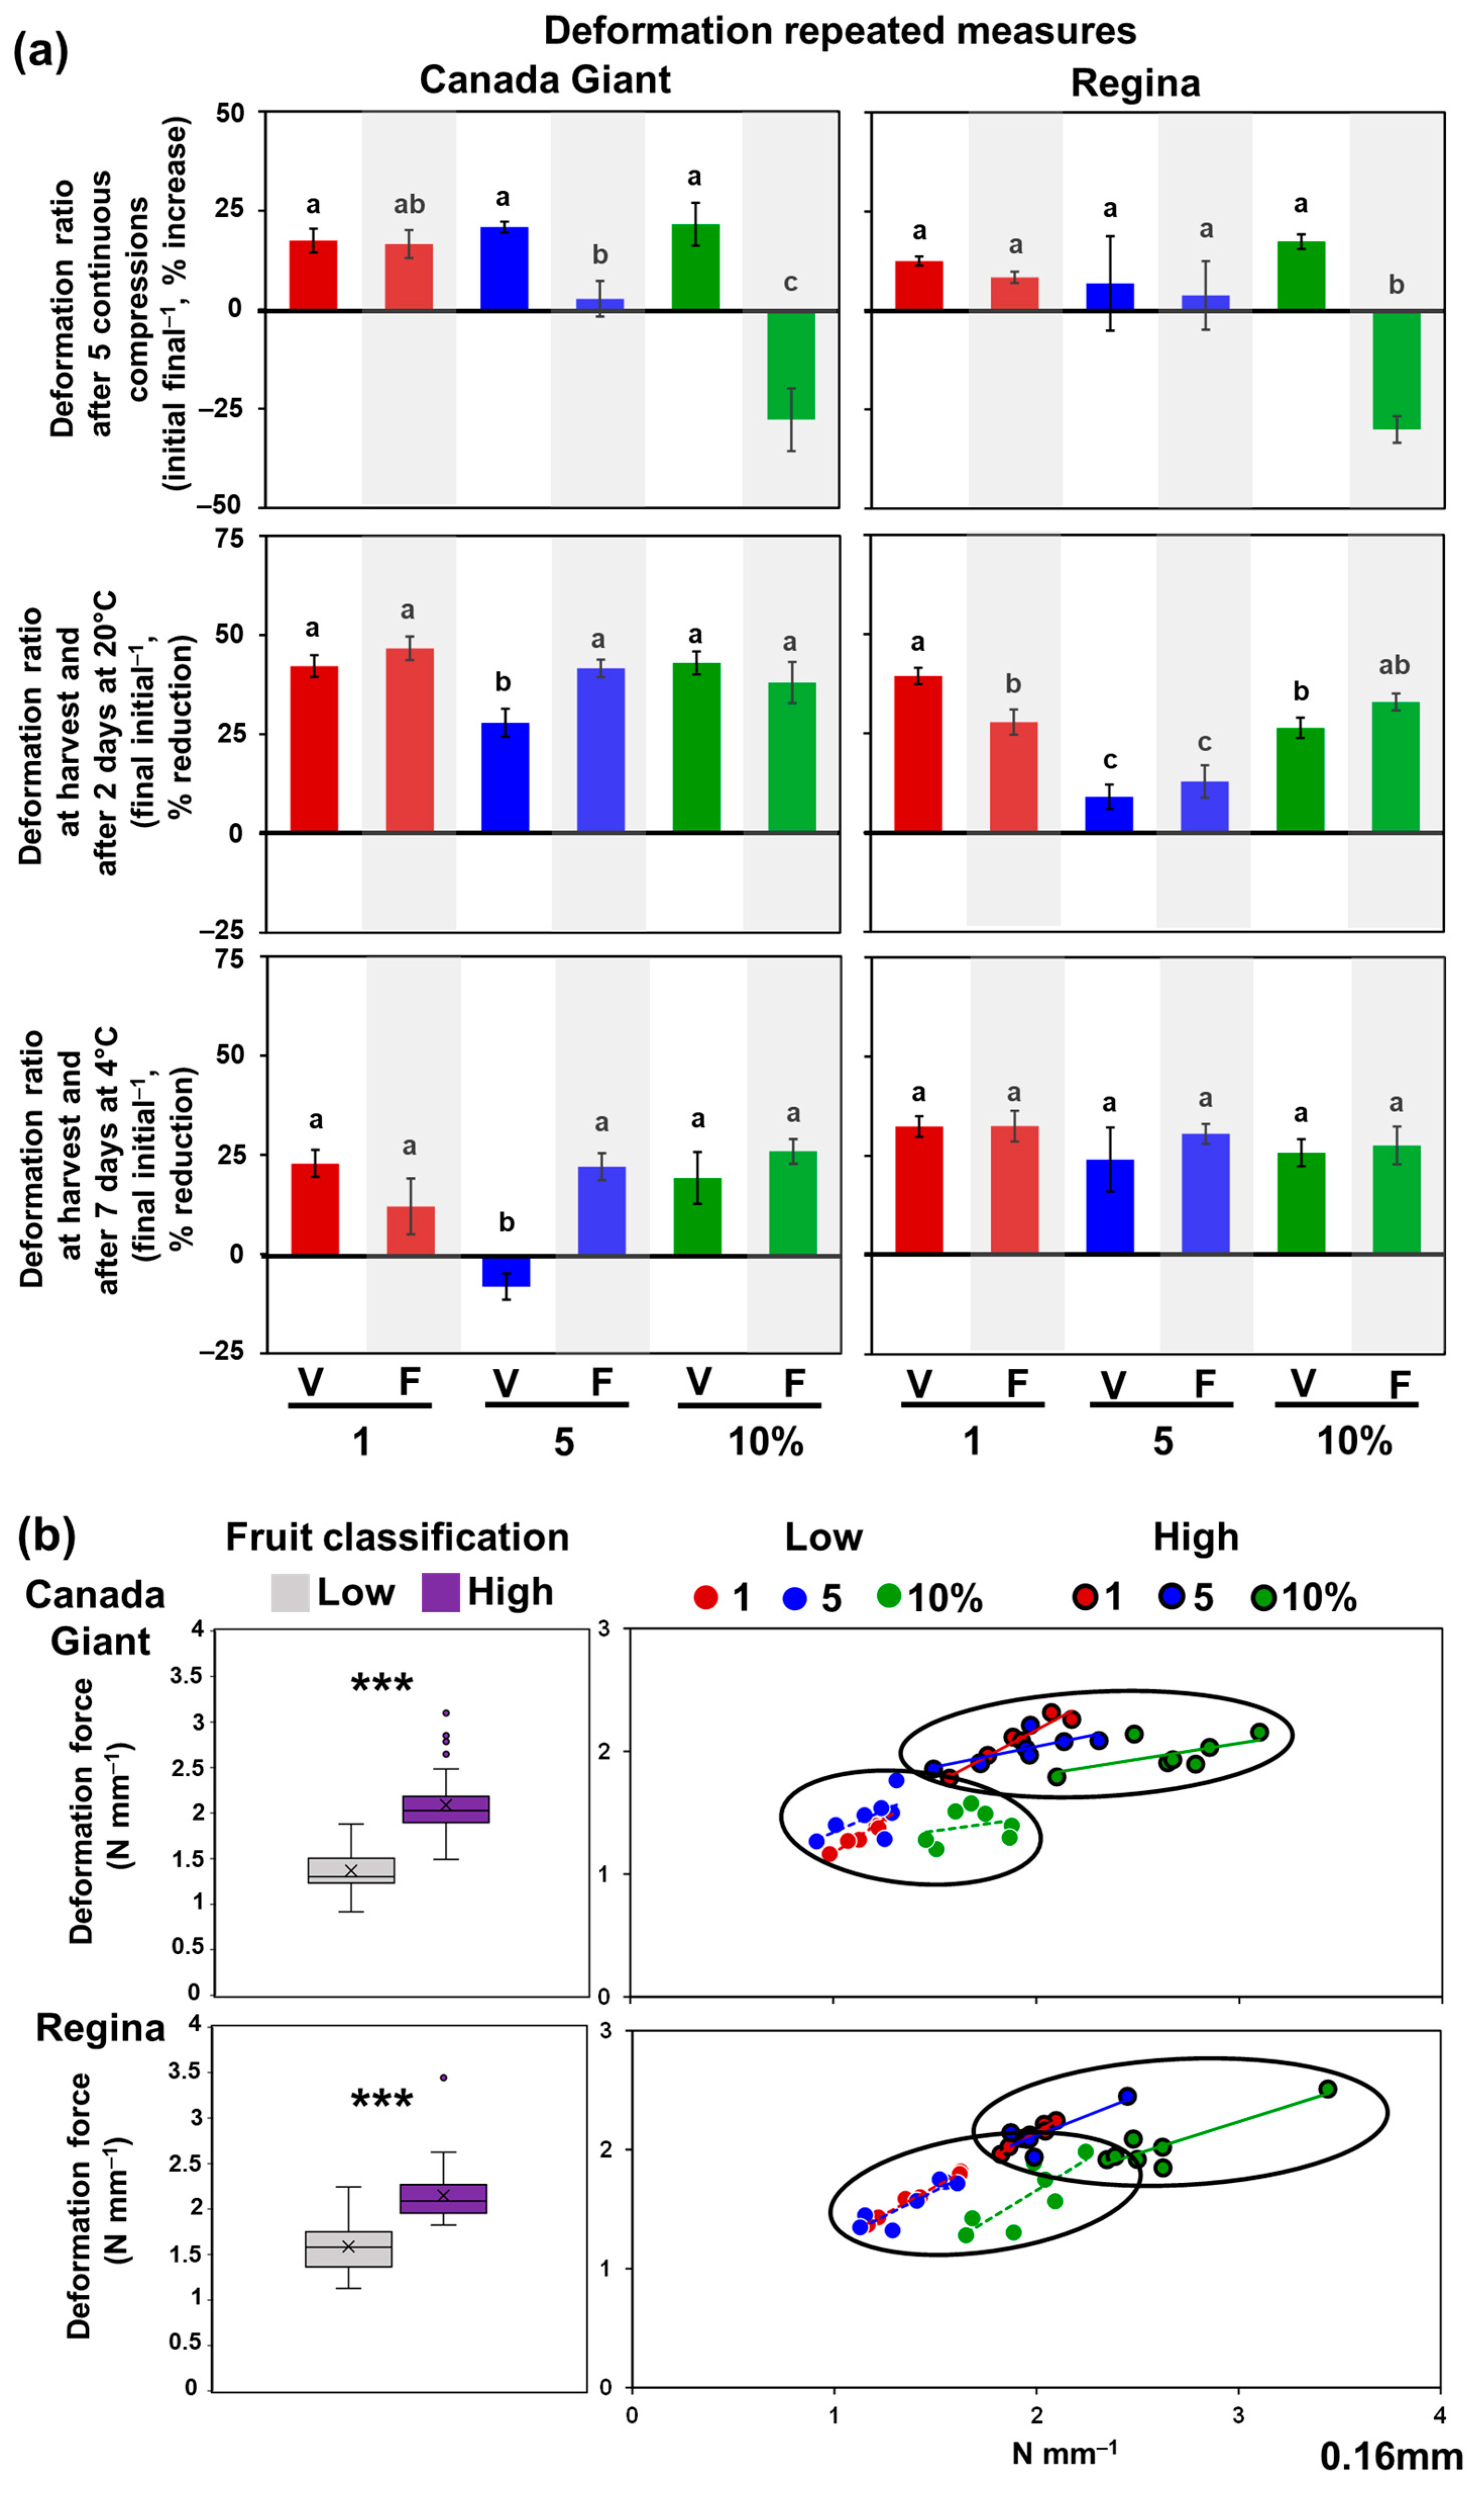
3.1. Flesh Firmness Test in Sweet Cherries

In order to examine the firmness of sweet cherries, tests on two cultivars (Canada Giant and Regina) were conducted using different compression distances based on fruit size (1%, 5%, and 10%), as well as a fixed compression distance of 0.16 mm in the smallest thickness dimension of the fruit. The normalized deformation force (N mm−1) of the fixed compression distance was measured at 1.8 and 2.1 for Canada Giant and Regina, respectively, indicating that Regina was firmer than Canada Giant (Figure 1a).
Furthermore, under the 1, 5, and 10% size-dependent compression distance conditions, flesh firmness of Canada Giant was 1.7, 1.6, and 2 N mm−1, which are lower values than the corresponding of Regina 2, 2.3, and 2.9 N mm−1 (Table S1 and Figure 1a). Thereafter, a scatter plot was built between the deformation force for the fixed and the size-dependent compression distance to explore the linear regression match. The above-mentioned approach is employed to explore the fit of fixed and varied compression distances based on R2 and RMSE with a view to the possible replacement of the second one. Deformation force indicates a better fit between 1% of the size-dependent compression distance and the fixed distance (0.16 mm) in both cultivars compared to others (5 and 10%) with an R2 of 0.98 and 0.96 for Canada Giant and Regina, respectively (Figure 1b). On the other hand, the deformation forces of 5 and 10% and the fixed distance correlated with an R2 of 0.87 and 0.62, respectively, in Canada Giant, whereas for Regina, it was 0.66 and 0.62, respectively. Furthermore, the root-mean-square error (RMSE) was lower in the 1% deformation force and the fixed distance (0.15 in Canada Giant and 0.11 in Regina) compared to 5% (0.16 in Canada Giant and 0.29 in Regina) and 10% (0.3 in Canada Giant and 0.88 in Regina) in both cultivars (Figure 1b). Subsequently, tests were carried out to measure the firmness of sweet cherries under different conditions, namely size-dependence and fixed distance. These tests involved subjecting the cherries to five consecutive compressions and then evaluating their firmness after either 2 days at 20 °C or 7 days at 4 °C.
The purpose of these tests was to assess the effectiveness of monitoring the firmness of cherries’ flesh, as depicted in Figure 2a. Both cultivars exhibited a negative percentage increase in a fixed distance after undergoing five continuous compressions in 10% (Figure 2a). Moreover, in Canada Giant, the fixed distance after five continuous compressions in a 5% deformation force had the lowest increase of 2.7% compared to the others (various and fixed distance), and the elevation in firmness ranged from 16.5% to 21.6% after five continuous compressions (Table S1 and Figure 2a). In addition, Regina firmness increase ranged from 3.8% (fixed distance after five continuous compressions in 5%) to 17.4% (10% deformation force) following five continuous compressions (Table S1 and Figure 2a). After 2 days of shelf life at 20 °C, Canada Giant cherries exhibited a reduction in firmness, ranging from 24.1% (5% deformation force) to 32.5% (fixed distance after 5% deformation force and 2 days at 20 °C). In parallel, Regina cherries showed a lower reduction in the 5% deformation at a varied distance of 9% and a fixed distance of 12.9% than 1% and 10% deformation forces after 2 days at 20 °C, ranging from 26.4 to 39.5% (Table S1 and Figure 2a). An increase in firmness was recorded for a 5% deformation force in sweet cherries of Canada Giant after 7 days of cold storage (4 °C), while for the rest of the deformation conditions, the reduction ranged from 12% (fixed distance after 1% deformation force and 7 days at 4 °C) to 25.9% (fixed distance after 10% deformation force and 7 days at 4 °C). After 7 days at 4 °C, a decrease in firmness was observed in Regina fruit ranging from 27.9% (5% deformation force) to 46.7% in the fixed distance after 1% deformation force and 7 days at 4 °C (Table S1 and Figure 2a).
To further explore the association between sweet cherry flesh firmness measurement and hand sense, seven trained panelists classified 6 fruit into ‘low’ flesh firmness and ‘high’ flesh firmness (3 to each category) from a batch of 100 fruit from each cultivar. Panelists’ assessments indicated that sweet cherries classified in the ‘low’ group had a normalized deformation force of 1.4 N mm−1, while the ‘high’ group had 2.1 N mm−1 in Canada Giant, indicating a significant difference (Table S1 and Figure 2b). Moreover, Regina fruit with 1.6 N mm−1 and 2.1 N mm−1 were classified by panelists into the ‘low’ and ‘high’ groups, respectively, and they were also significantly differentiated between the two groups (Table S1 and Figure 2b). Subsequently, a scatter plot was constructed for both ‘low’ and ‘high’ flesh firmness classified cherries for each cultivar to examine the match to the linear regression model between the varied and the corresponding fixed distance. A high correlation in the linear models of the classified sweet cherries for both groups and cultivars was observed for the 1% deformation force with an R2 that ranged from 0.94 to 0.99 compared to the other conditions (5 and 10% deformation force) with an R2 that ranged from 0.07 to 0.8 (Table S1 and Figure 2b).

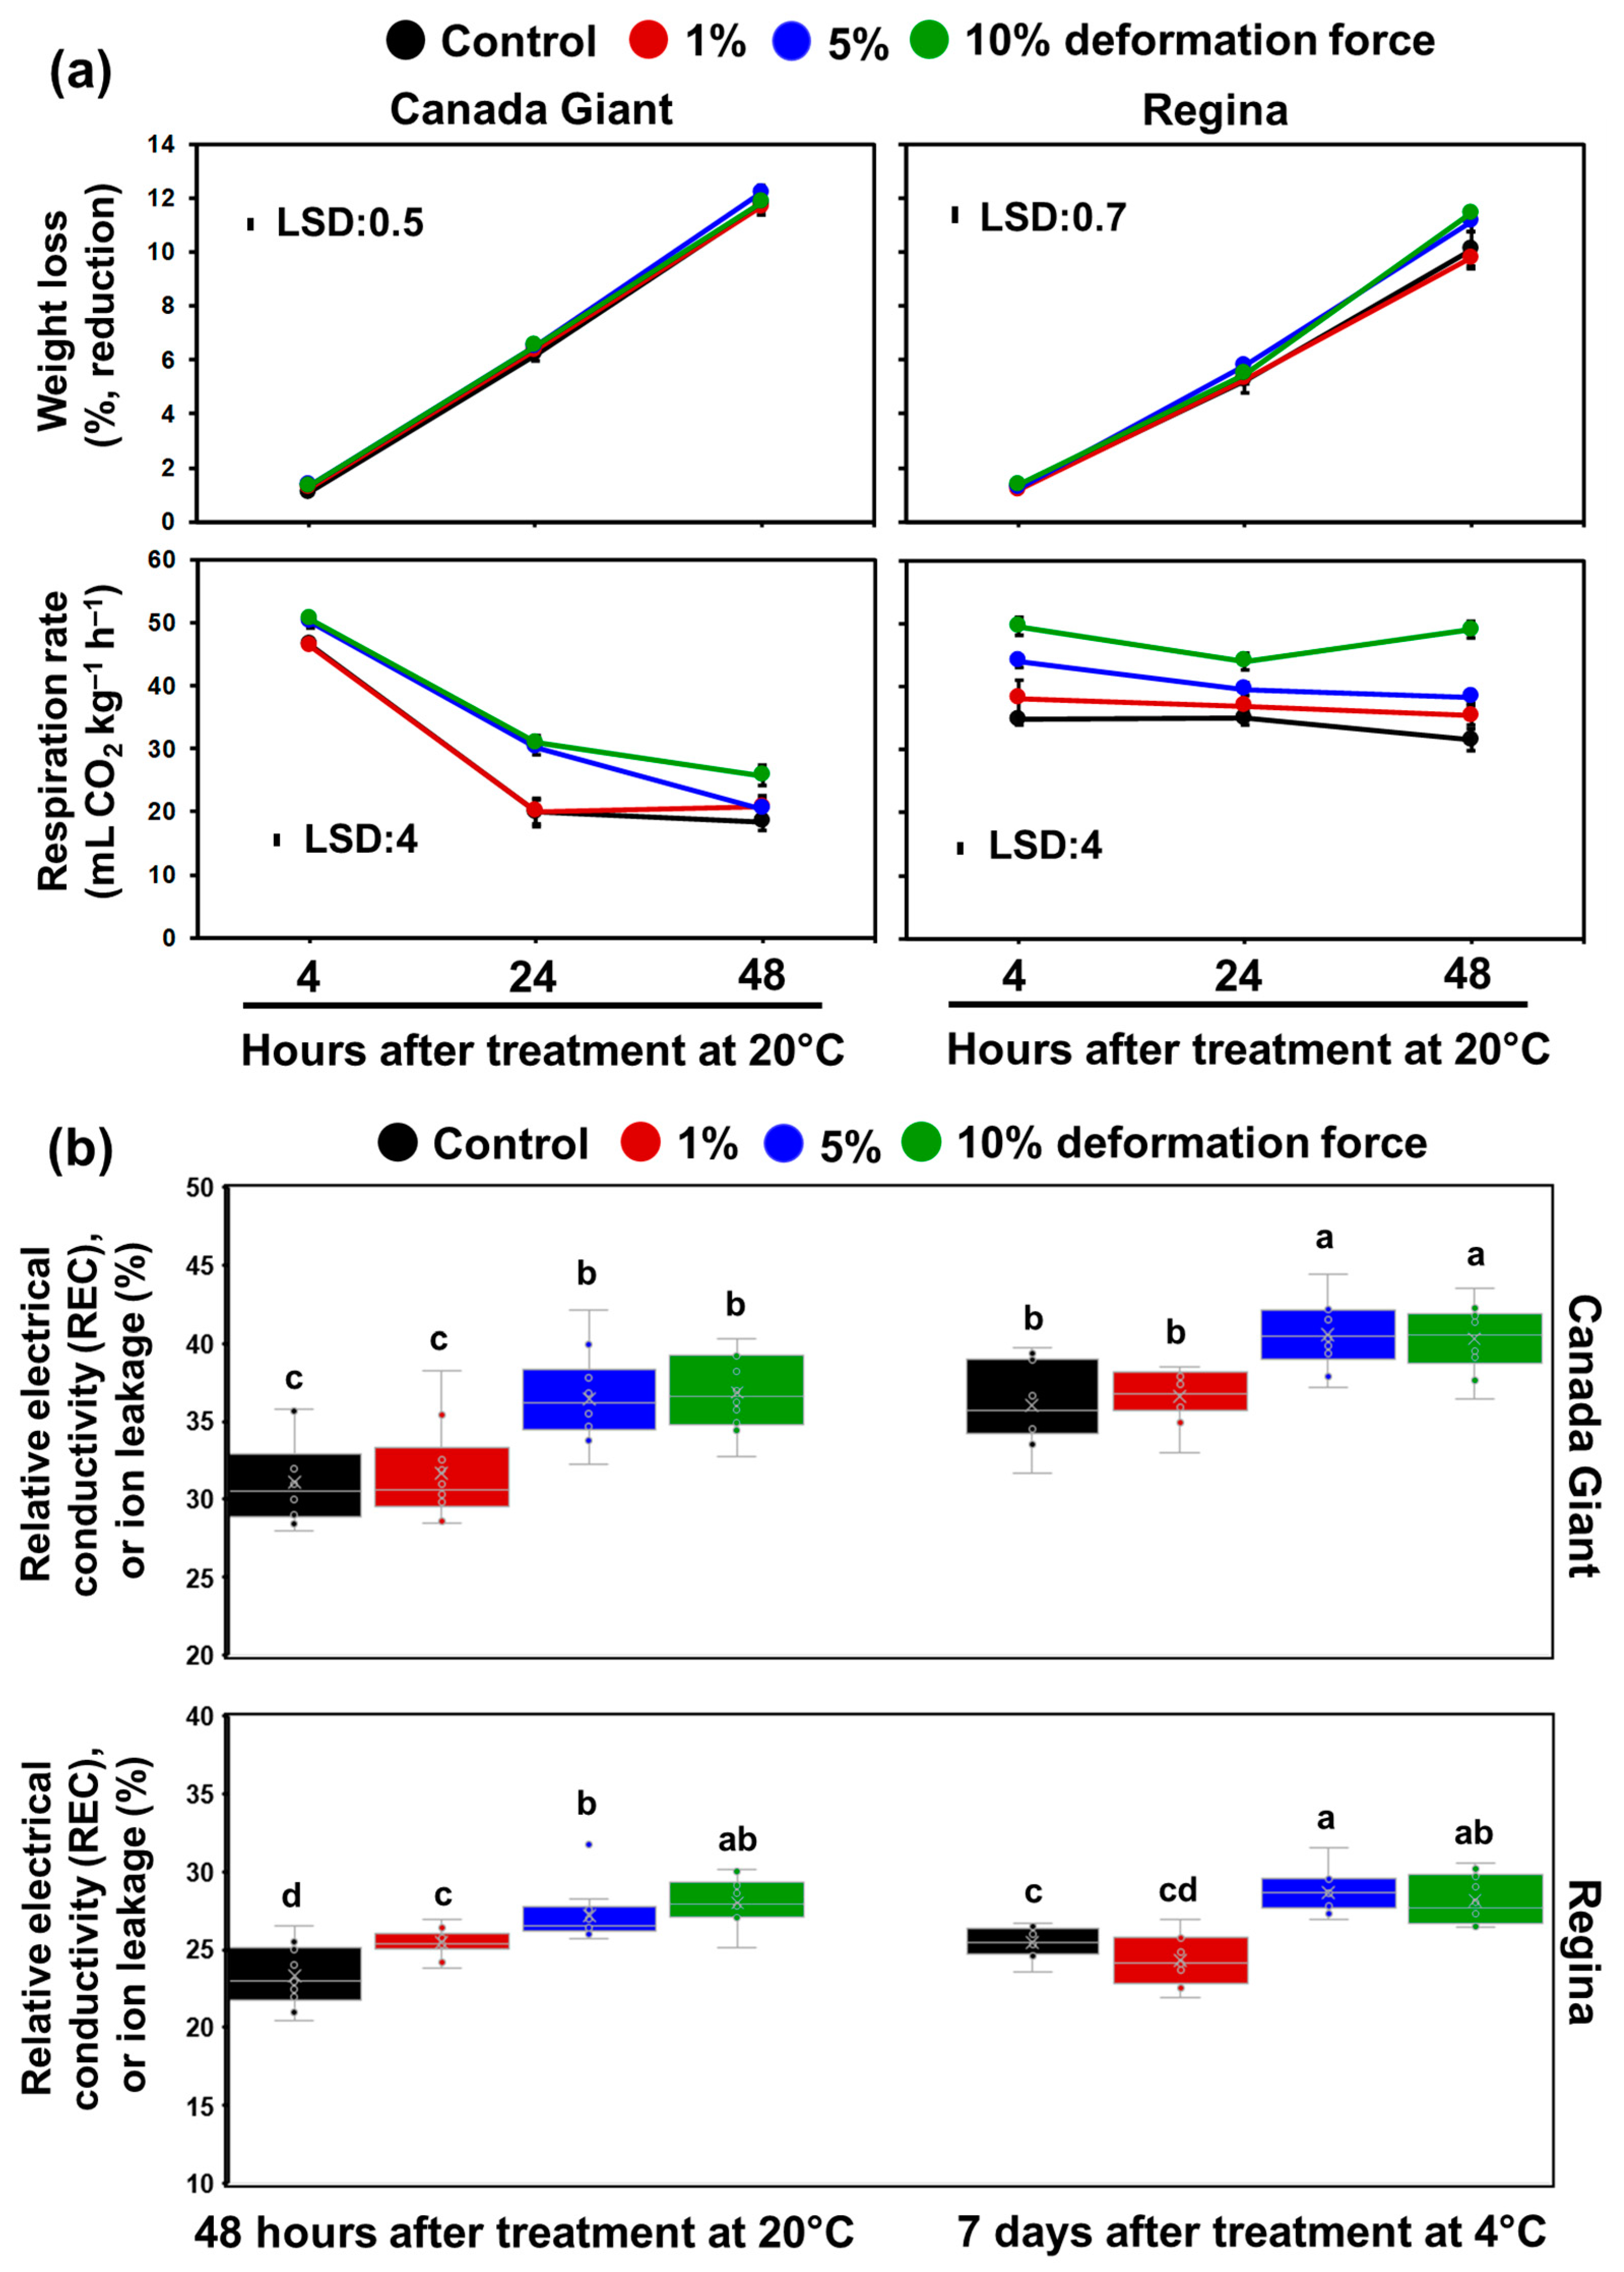
3.2. Monitoring Sweet Cherry Quality Traits

The weight loss and respiration rate of both cultivars were measured at 4, 24, and 48 h after treatment. Additionally, the membrane integrity of the fruit was assessed by measuring the relative electrical conductivity (REC) 48 h after treatment at 20 °C and 7 days after treatment at 4 °C. The weight loss of the fruit over the postharvest shelf life did not differ across treatments in both cultivars, except for a noticeable difference observed at the 48 h mark.
The treatment with a 10% deformation force showed an enhanced fruit weight loss compared to the control and the treatment with a 1% deformation force. Significantly, sweet cherries exhibited a weight loss of over 10% within a 48 h period at a temperature of 20 °C, as indicated in Table S2 and Figure 3a.
In addition, the respiratory activity of the fruit was often enhanced when subjected to deformation forces of 5% and 10%, regardless of the time point and cultivar. The only exception was seen after 48 h at 20 °C in the 5% deformation treatment of the Canada Giant cultivar. In contrast, the respiration rate of fruit subjected to a 1% deformation force did not show a significant impact (Table S2 and Figure 3a).
A reduction in respiration rate in Canada Giant during postharvest maintenance was observed, while the respiratory status of Regina fruit was not influenced during the postharvest period (Table S2 and Figure 3a). The relative electrical conductivity (REC) of Canada Giant fruit ranged from 31 to 41% and increased in response to treatments 5 and 10% flesh deformation after 48 h at 20 °C and after 7 days at 4 °C, while there was no difference detected at these time points during REC determination at a 1% deformation force (Table S2 and Figure 3b). Moreover, the REC of Regina fruit ranged from 23 to 29% and increased in all treatments after 48 h at 20 °C and in 5% and 10% deformation treatments after 7 days at 4 °C. It is also worth noting that the REC for both cultivars increased in treatments of 5 and 10% deformation compared to a 1% deformation force (Table S2 and Figure 3b).

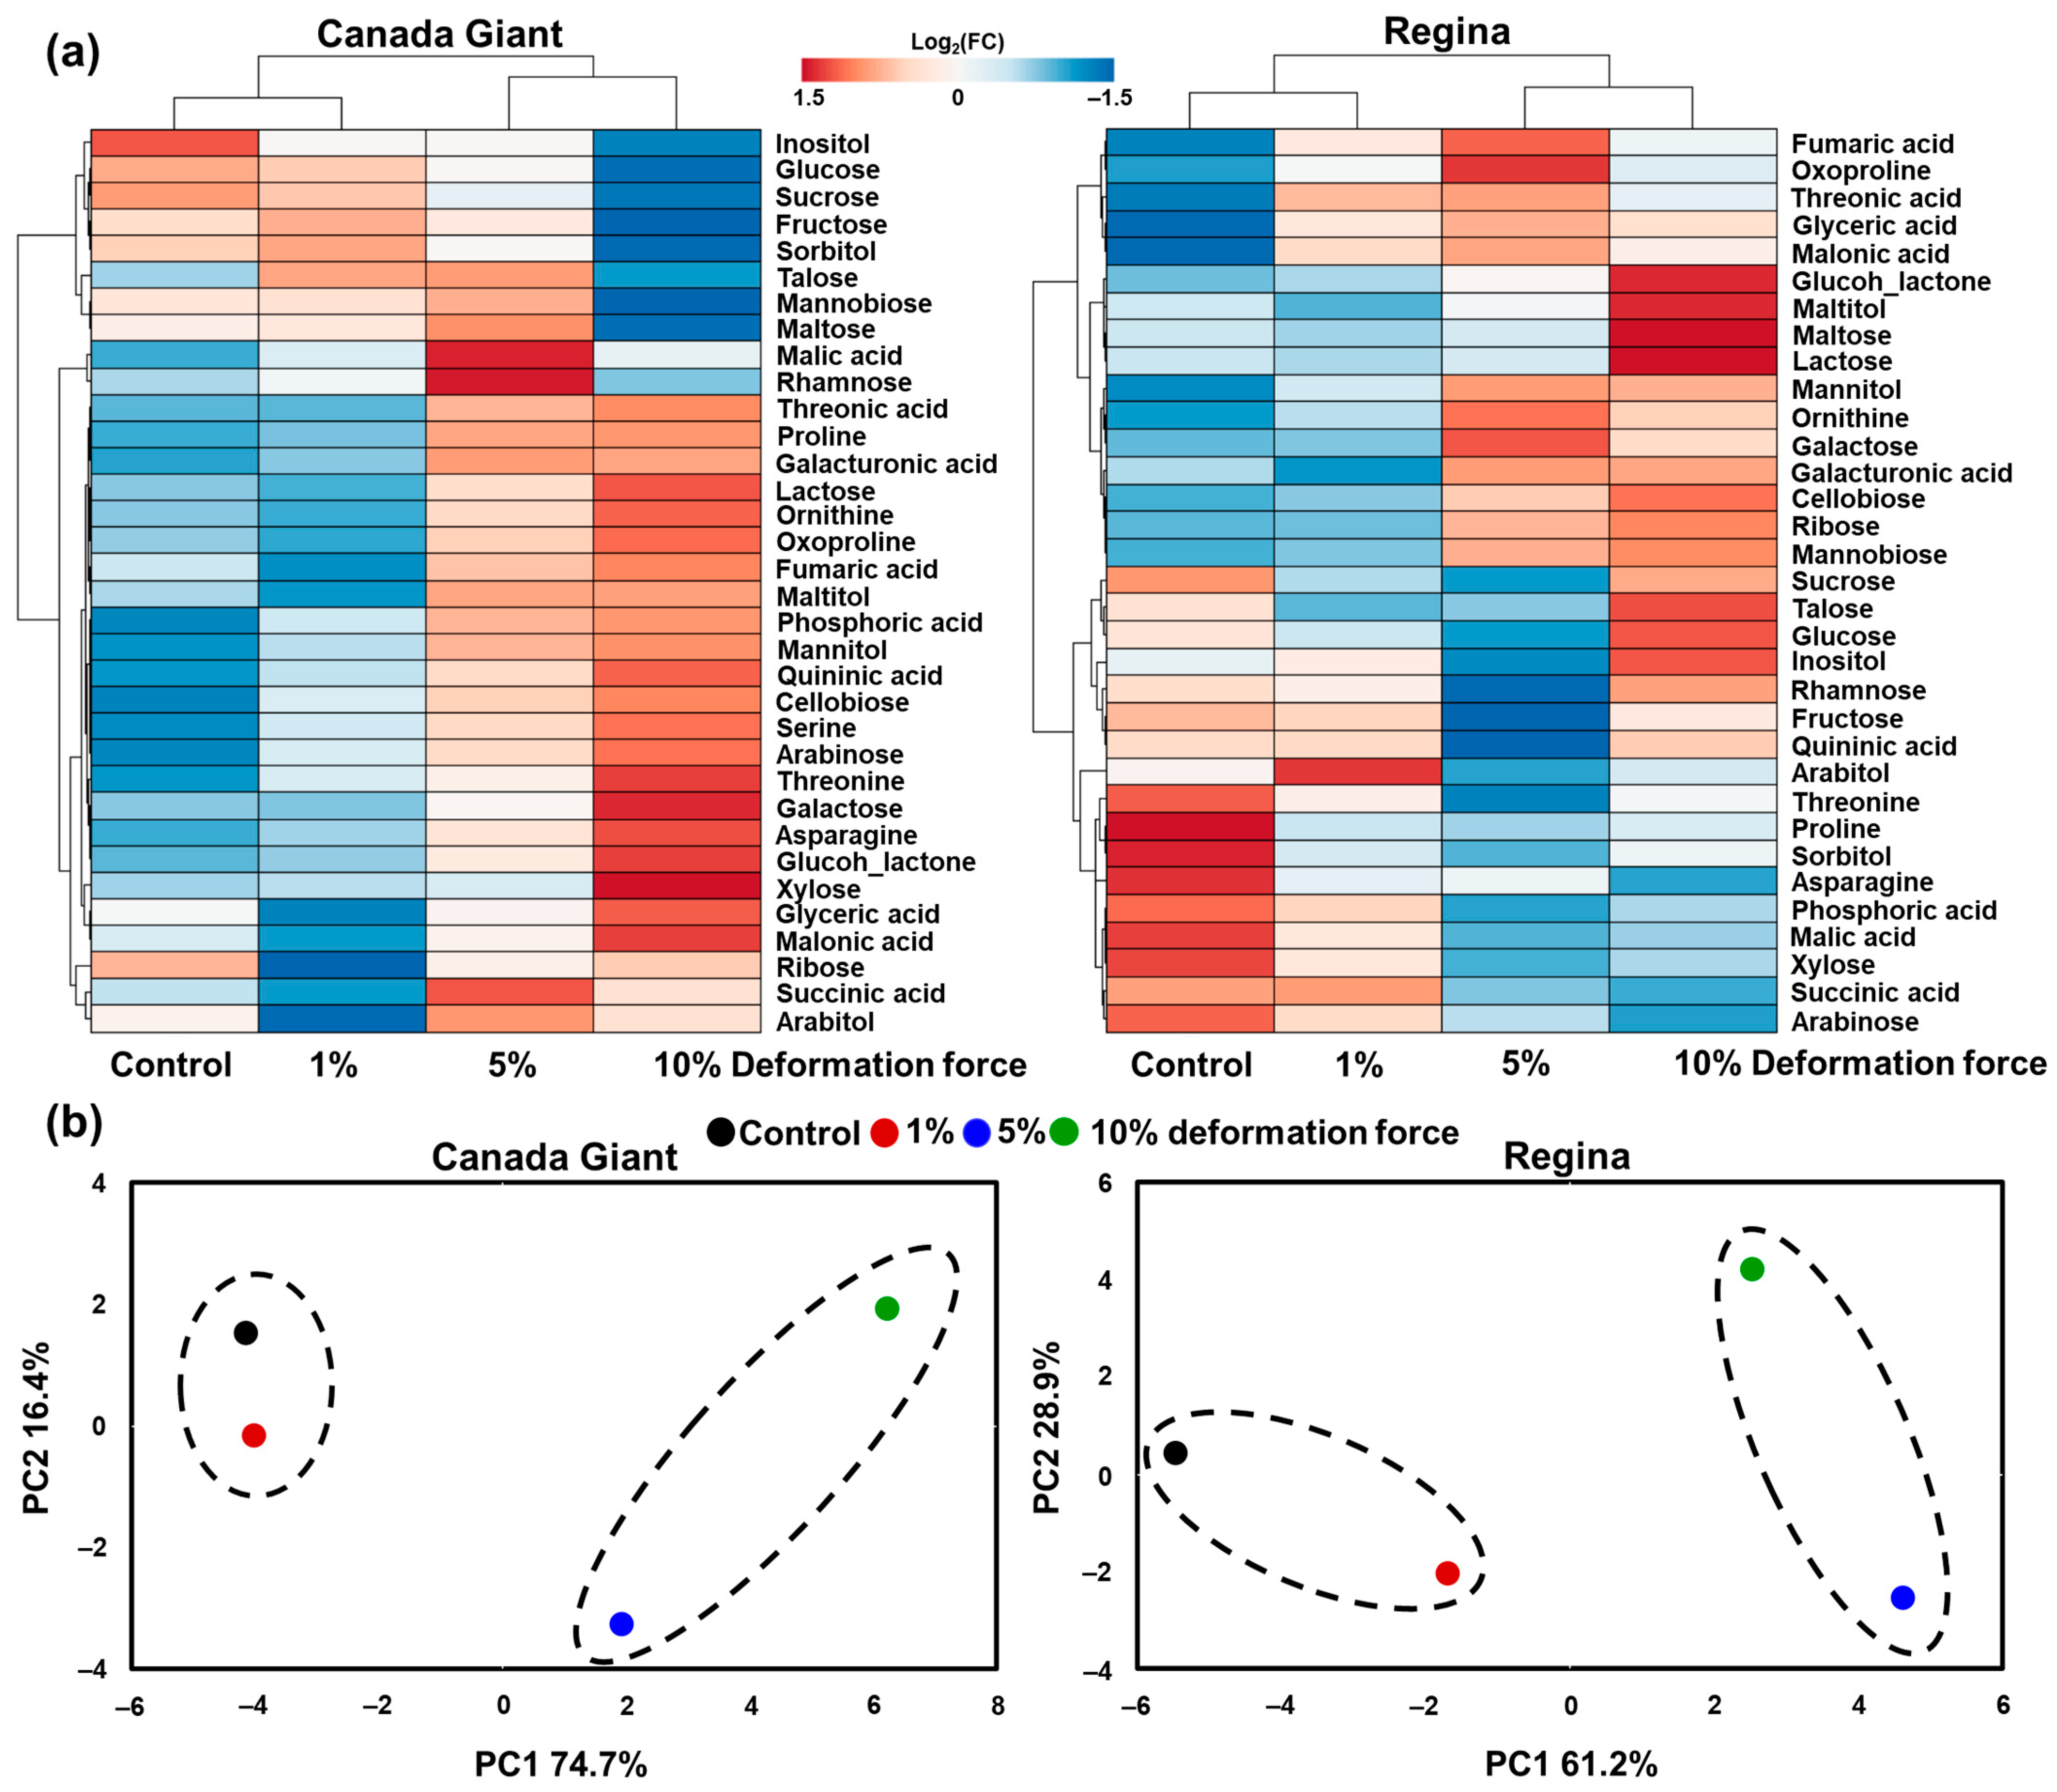
3.3. Primary Metabolic Profile of Sweet Cherry Fruit Exposed to Deformation Experiments

To better understand the variables contributing to fruit flesh deformation, we proceeded to examine the changes in the metabolic profile of the affected sampling areas 48 h after treatments at 20 °C using the GC-MS approach. In total, thirty-four polar metabolites in the exo-meso-carp tissue of the two sweet cherry cultivars were quantified and then clustered according to treatment and cultivar (Figure 4).
In response to treatments, 9 and 15 primary metabolites remained unaffected in Canada Giant and Regina, respectively, based on MANOVA. For instance, phosphoric acid, inositol, talose, and glucoheptonolactone showed no differences following treatments in both cultivars (Table S3). Generally, there was a clear separation in both cultivars due to hierarchical clustering analysis, leading to the first group where control and 1% deformation treatment grouped together and to the second group where 5% and 10% deformation treatments grouped together (Figure 4a). Furthermore, based on principal component analysis (PCA) for each cultivar, an obvious separation of the same groups (control and 1% deformation treatment compared to 5% and 10% deformation treatments) was detected, indicating that they are strongly related to PC1—principal component 1 (Figure 4b). In more detail, the variance of the metabolic data explained by the PCA model in Canada Giant was 91.1%, with 74.7% explained by PC1 and 16.4% by PC2, similarly in Regina, it was 90.1%, with 61.2% explained by PC1 and 28.9% by PC2 (Figure 4b).
To focus on the fruit metabolic alterations due to compression treatments, we studied metabolites that shifted their abundance in both cultivars. Thus, in both cultivars, an increase in mannitol and galacturonic acid in the 5 and 10% deformation treatments compared to control and the 1% deformation treatments was observed. Also, an increase in lactose was detected in the 10% deformation treatment compared to the control and the 1% deformation treatment (Figure 4a and Table S3). In Canada Giant, 11 primary metabolites (e.g., proline, fumaric acid, threonine, serine, arabinose, malic acid, ornithine, oxoproline, asparagine, quininic acid, and threonic acid) were increased in response to 5 and 10% deformation treatments, while sucrose was decreased. Furthermore, an increase in malonic acid and xylose were detected in the 10% deformation treatment, whereas a decrease in fructose, glucose, sorbitol, and maltose was recorded in this treatment (Figure 4a and Table S3). In Regina, an increase in mannobiose and cellobiose content in 5 and 10% deformation treatments were observed; however, a decrease in seven metabolites including proline, succinic acid, malic acid, asparagine, xylose, arabinose, and sorbitol was also observed. In addition, maltose and maltitol were increased in the 10% deformation treatment compared to the other applied treatments (Figure 4a and Table S3). The axis of principal component 2 (PC2) is mostly associated with the variation between the two greater compressions observed in the fruit subjected to a 5% deformation treatment compared to those that were subjected to a 10% deformation treatment in both cultivars (Figure 4b). Based on metabolic profile of the two cultivars from both hierarchical cluster analysis and PCA analysis (Figure 4), it is seen that the control and 1% deformation treatment in one group were grouped together, and 5% and 10% deformation treatments in the other group were also clustered. This indicates stronger changes in metabolite abundances after the application of 5% and 10% deformation treatments versus both control and 1% deformation treatment (Figure 4).

4. Discussion

Fundamental issues, such as the impact of compression due to firmness measurements on sweet cherry cell membrane integrity and cell metabolic status, have not been fully examined yet. In the current study, we investigated these aspects related to sweet cherry firmness, such as the optimum deformation force and the sensory discrimination of firmness, providing useful data in the food industry to develop a texture-based method of fruit quality monitoring. To achieve this, we conducted tests on the application utilizing three distinct fruit compression conditions (1%, 5%, and 10%) and a fixed compression distance condition of 0.16 mm. These tests were performed on two high commercial and traditional cultivars in Greece, as shown in Figure 1. An optimum number of one hundred tested cherries in each condition and cultivar were used to minimize variability [36] (Figure 1a). In addition, the selection of compression speed and loading direction was suggested to test the reliability of fast and accurate results, notably at the fixed compression distance of 0.16 mm (Figure 1a). For this reason, the compression speed was set to 20 mm s−1, and the loading direction of the fruit was set to the small thickness dimension.
The demand for rapid and precise assessment of firmness arose primarily because of the short period of time available for handling sweet cherries and their transportation [21]. Additionally, the necessity for fast assessment of cherry attributes was reinforced by the implementation of hydro-cooling techniques to avoid the short period of life due to deterioration of the fruit [37,38]. A recent study indicates that the deformation leading to elastic, local plastic, or structural failure in strawberry fruit is highly influenced by the speed of compression and the direction of loading [39]. Consequently, the current firmness data may be affected by the selected speed of compression, but it also should be fast enough in sweet cherries to assess a specific fruit batch as soon as possible. Therefore, we have also chosen the loading direction with the small thickness dimension, since the probability of sweet cherries being automatically placed in this position is much higher than the large dimension. It is also noteworthy that the compression of fruit with a small thickness dimension equal to 1% was strongly correlated with the fixed compression distance of 0.16 mm on a linear regression with an R2 exceeding 0.96 in both cultivars (Figure 1b). Hence, a fixed distance in fruit deformation force below 0.2 mm enables the design of suitable postharvest mechanical handling facilities with elastic fruit deformation, assisting fruit classification based on the ripening stage [40]. In this regard, a non-destructive elastic deformation for the determination of tomato ripening stage was previously proposed [41]. In sweet cherries, a destructive elastic–plastic deformation when applied to the fruit’s repeated measurement was observed; specifically, after five continuous compressions, an increase in recorded force was detected, leading to the hypothesis that this increase in fruit firmness should be taken into consideration in order to monitor the firmness declination during the postharvest life period (Figure 2a). A sweet cherry destructive method for firmness estimation should offer more precise measurement than non-destructive, yielding more accurate results. Furthermore, a destructive approach with a minimum impact on fruit physiology could provide accessibility to firmness while still preserving the fruit for further physiological analysis [42]. Although we can claim that deforming the fruit to 1% of the small thickness dimension had minimal effect on the fruit physiological responses (Figure 3 and Figure 4), the non-destructive approach is well-defined, and concerns, among others, include the correlation of profiles in the infrared spectrum with physiological characteristics of the fruit such as firmness, SSC, DM and its biochemical traits [43].
Skin mechanical properties of sweet cherries are tightly linked with genotype, ripening stage, fruit water relations (including turgor, transpiration, and water uptake), and temperature [44]. Herein, we also performed sensory evaluation of sweet cherry firmness by hand, and cherries were split into ‘low’ and ‘high’ fruit firmness after squeezing them to the small thickness dimension. In these fruit, the firmness was also quantified using a texture analyzer. Data indicated that fruit characterized as low firmness had 1.30 and 1.58 N mm−1, and those characterized as high firmness had 2.03 and 2.09 N mm−1, respectively, in the cultivars Canada Giant and Regina (Figure 2b). According to previous studies [7,45] panelists’ sensory assessment of firmness is highly sensitive. Moreover, firmness of sweet cherries has been linked with postharvest maintenance [6], as firmer cherries at harvest could remain firmer during the postharvest period than the softer ones [14]. Therefore, in this study, sweet cherry ripening characteristics, including fruit firmness, were periodically monitored during maintenance for 2 days at 20 °C following deformation force treatments (Figure 3a). Generally, there were no differences in sweet cherry weight loss after deformation treatments, with the only exception of an increase of 2 days in Regina after a 10% deformation force. Also, the fruit respiration rate displayed higher values in both cultivars after a 5 and 10% deformation force compared to either control or a 1% deformation force (Figure 3a). A rise in respiration activity had also been observed in plum fruit exposed to mechanical damage during the postharvest handling process [46]. A lower sweet cherry respiratory status is the optimal goal for depression in senescence and metabolic activity under postharvest conditions [10,47]. Hence, the observed increase in the respiration of fruit exposed to 5 and 10% deformation treatments (Figure 3a) possibly gives rise to shifts in the fruit cell membrane status to reverse these adverse situations (Figure 3a). Indeed, the relative electrical conductance (REC), which reflects the cell membrane integrity, increased in response to 5 and 10% deformation treatments after 48 h at 20 °C, indicating a loosening of the cell membrane (Figure 3b). A strong positive correlation between REC and fruit damage due to vibration following wounding was recorded in strawberries [48]. In parallel, metabolic analysis and clustering revealed a clear separation between the first group, which includes control and a 1% deformation force, and the second group, which includes 5% and 10% deformation forces (Figure 4). Particularly, the increase in galacturonic acid in fruit treated with 5 and 10% deformation forces compared to the other group seemed to have a significant role in the observed disjunction (Figure 4a), since galacturonic acid accumulation, which is the main compound of pectin degradation, is associated with the activation of several pectin-related enzymes, such as β-galactosidase (β-Gal), polygalacturonase (PG), and pectinmethylesterase (PME) [14,49,50].
Polyol accumulation under stress conditions in higher plants has been well documented [51]. In this work, the detected increase in mannitol may indicate a fruit response to a stressful situation manifested as compression force (Figure 4a and Table S3). Although the metabolic changes in each cultivar showed distinct patterns, these changes led to the same result: an obvious separation of treatments of 5 and 10% deformation forces compared to control and a 1% deformation (Figure 4a and Table S3). For example, proline and oxoproline were accumulated in the aforementioned treatments (5% and 10% deformation forces) only in the cultivar Canada Giant (Figure 4a and Table S3), while these two compounds have been linked with stress conditions in sweet cherries [4,52]. On the contrary, the accumulation of mannobiose and cellobiose in the 5% and 10% deformation treatments (Figure 4a and Table S3) was a good example for sweet cherries of Regina cultivar, indicating that the cell wall collapsed, and these two constituents were released via hydrolysis from the cell wall and thereafter detected [53]. Undoubtedly, the metabolic response of fruit to high compression forces in both cultivars was differentiated between them, but the outcome was similar, namely the separation of high and low compression forces (Figure 4). The differences in sweet cherry firmness between 1% or specific deformation force at 0.16 mm and a 5% or 10% deformation force are illustrated in Figure 5.

5. Conclusions

Flesh firmness evaluation in sweet cherries is primarily determined by the deformation force applied at a distance equal to a different percentage compression distance of the fruit diameter. The current study supports the idea that a fixed distance of 0.16 mm for cherry fruit firmness evaluation, which is also the main goal for easy applications, fits better with a 1% deformation force determination than with a 5% or 10% deformation force. Moreover, the classification of fruit into low and high firmness by panelists demonstrated a stronger correlation with the application of a 1% deformation force and the fixed distance of 0.16 mm within each cultivar. The effect of a 1% deformation force on physiological traits such as weight loss, respiration activity, and membrane integrity was minimized compared to 5% or 10% deformation forces. Hence, in the fixed distance 0.16 mm or a 1% deformation force, the fruit’s metabolic status was not dramatically influenced compared to 5% or 10% deformation forces, indicating a future perspective for monitoring sweet cherries during postharvest maintenance, either during cold storage or the shelf life with a minimum impact on fruit physiology. Additionally, control and 1% deformation treatment were clustered together concerning metabolic analysis, whereas 5% and 10% deformation treatments exhibited significant metabolic shifts compared to control and a 1% deformation treatment after 48 h. Finally, these findings should be tested on more sweet cherry cultivars in future studies, and extensive tests should also be accomplished to apply the proposed compression distance for sweet cherry firmness determination on a large scale.

Supplementary Materials

The following supporting information can be downloaded at: https://www.mdpi.com/article/10.3390/horticulturae10050435/s1, Table S1. Data on sweet cherry deformation force, repeated measurements, and classification.; Table S2. Data on sweet cherry physiological traits and membrane integrity.; Table S3. Quantification and descriptive data of primary metabolites in sweet cherries. Ref. [54] cited in Table S3.

Author Contributions

Conceptualization, M.M. and M.K.; methodology, M.K. and M.R.; software, M.K. and M.R.; validation, E.N., V.S.T. and M.M.; formal analysis, M.K., E.N. and V.S.T.; investigation, M.K. and M.R.; resources, M.M.; data curation, E.N. and V.S.T.; writing—original draft preparation, M.K.; writing—review and editing, M.M., E.N. and V.S.T.; visualization, M.K., M.R., E.N., V.S.T. and M.M.; supervision, M.M.; project administration, M.M.; funding acquisition, M.M. All authors have read and agreed to the published version of the manuscript.

Funding

This research was funded by the Action “Investment Plans of Innovation” of the Operational Program “Central Macedonia 2021–2027”, which is co-funded by the European Regional Development Fund and Greece (Project code: ΚΜΡ6-0078866).

Data Availability Statement

Data are contained within the article and Supplementary Materials.

Acknowledgments

We would like to thank Athanassios Molassiotis who provided us with laboratory equipment to carry out the measurements.

Conflicts of Interest

The authors declare no conflicts of interest.

References

  1. Chockchaisawasdee, S.; Golding, J.B.; Vuong, Q.V.; Papoutsis, K.; Stathopoulos, C.E. Sweet cherry: Composition, postharvest preservation, processing and trends for its future use. Trends Food Sci. Technol. 2016, 55, 72–83. [Google Scholar] [CrossRef]
  2. Kelley, D.S.; Adkins, Y.; Laugero, K.D. A review of the health benefits of cherries. Nutrients 2018, 10, 368. [Google Scholar] [CrossRef] [PubMed]
  3. Michailidis, M.; Karagiannis, E.; Tanou, G.; Sarrou, E.; Karamanoli, K.; Lazaridou, A.; Martens, S.; Molassiotis, A. Sweet cherry fruit cracking: Follow-up testing methods and cultivar-metabolic screening. Plant Methods 2020, 16, 51. [Google Scholar] [CrossRef] [PubMed]
  4. Michailidis, M.; Karagiannis, E.; Polychroniadou, C.; Tanou, G.; Karamanoli, K.; Molassiotis, A. Metabolic features underlying the response of sweet cherry fruit to postharvest UV-C irradiation. Plant Physiol. Biochem. 2019, 144, 49–57. [Google Scholar] [CrossRef] [PubMed]
  5. Ganopoulos, I.; Farsakoglou, A.M.; Aravanopoulos, F.; Molassiotis, A.; Michailidis, M.; Malliarou, E.; Avramidou, E.; Tsaftaris, A.; Osanthanunkul, M.; Madesis, P.; et al. Towards sweet cherry (Prunus avium L.) breeding: Phenotyping evaluation of newly developed hybrids. Euphytica 2018, 214, 99. [Google Scholar] [CrossRef]
  6. Correia, S.; Schouten, R.; Silva, A.P.; Gonçalves, B. Factors Affecting Quality and Health Promoting Compounds during Growth and Postharvest Life of Sweet Cherry (Prunus avium L.). Front. Plant Sci. 2017, 8, 2166. [Google Scholar] [CrossRef] [PubMed]
  7. Hampson, C.R.; Stanich, K.; McKenzie, D.L.; Herbert, L.; Lu, R.; Li, J.; Cliff, M.A. Determining the optimum firmness for sweet cherries using Just-About-Right sensory methodology. Postharvest Biol. Technol. 2014, 91, 104–111. [Google Scholar] [CrossRef]
  8. Ross, C.F.; Chauvin, M.A.; Whiting, M. Firmness evaluation of sweet cherries by a trained and consumer sensory panel. J. Texture Stud. 2009, 40, 554–570. [Google Scholar] [CrossRef]
  9. Gallardo, R.K.; Li, H.; Mccracken, V.; Yue, C.; Luby, J.; Mcferson, J.R. Market intermediaries’ willingness to pay for apple, peach, cherry, and strawberry quality attributes. Agribusiness 2015, 31, 259–280. [Google Scholar] [CrossRef]
  10. Michailidis, M.; Karagiannis, E.; Tanou, G.; Sarrou, E.; Stavridou, E.; Ganopoulos, I.; Karamanoli, K.; Madesis, P.; Martens, S.; Molassiotis, A. An integrated metabolomic and gene expression analysis identifies heat and calcium metabolic networks underlying postharvest sweet cherry fruit senescence. Planta 2019, 250, 2009–2022. [Google Scholar] [CrossRef]
  11. Michailidis, M.; Karagiannis, E.; Tanou, G.; Samiotaki, M.; Sarrou, E.; Karamanoli, K.; Lazaridou, A.; Martens, S.; Molassiotis, A. Proteomic and metabolic analysis reveals novel sweet cherry fruit development regulatory points influenced by girdling. Plant Physiol. Biochem. 2020, 149, 233–244. [Google Scholar] [CrossRef] [PubMed]
  12. Michailidis, M.; Tanou, G.; Sarrou, E.; Karagiannis, E.; Ganopoulos, I.; Martens, S.; Molassiotis, A. Pre- and Post-harvest Melatonin Application Boosted Phenolic Compounds Accumulation and Altered Respiratory Characters in Sweet Cherry Fruit. Front. Nutr. 2021, 8, 306. [Google Scholar] [CrossRef] [PubMed]
  13. Basanta, M.F.; Ponce, N.M.A.; Salum, M.L.; Raffo, M.D.; Vicente, A.R.; Erra-Balsells, R.; Stortz, C.A. Compositional changes in cell wall polysaccharides from five sweet cherry (Prunus avium L.) cultivars during on-tree ripening. J. Agric. Food Chem. 2014, 62, 12418–12427. [Google Scholar] [CrossRef] [PubMed]
  14. Belge, B.; Comabella, E.; Graell, J.; Lara, I. Post-storage cell wall metabolism in two sweet cherry (Prunus avium L.) cultivars displaying different postharvest performance. Food Sci. Technol. Int. 2015, 21, 416–427. [Google Scholar] [CrossRef] [PubMed]
  15. Qi, X.; Liu, C.; Song, L.; Li, M. PaMADS7, a MADS-box transcription factor, regulates sweet cherry fruit ripening and softening. Plant Sci. 2020, 301, 110634. [Google Scholar] [CrossRef] [PubMed]
  16. Calle, A.; Balas, F.; Cai, L.; Iezzoni, A.; López-Corrales, M.; Serradilla, M.J.; Wünsch, A. Fruit size and firmness QTL alleles of breeding interest identified in a sweet cherry ‘Ambrunés’ × ‘Sweetheart’ population. Mol. Breed. 2020, 40, 1–17. [Google Scholar] [CrossRef]
  17. Goulas, V.; Minas, I.S.; Kourdoulas, P.M.; Lazaridou, A.; Molassiotis, A.N.; Gerothanassis, I.P.; Manganaris, G.A. 1H NMR Metabolic Fingerprinting to Probe Temporal Postharvest Changes on Qualitative Attributes and Phytochemical Profile of Sweet Cherry Fruit. Front. Plant Sci. 2015, 6, 959. [Google Scholar] [CrossRef] [PubMed]
  18. Martínez-Romero, D.; Alburquerque, N.; Valverde, J.M.; Guillén, F.; Castillo, S.; Valero, D.; Serrano, M. Postharvest sweet cherry quality and safety maintenance by Aloe vera treatment: A new edible coating. Postharvest Biol. Technol. 2006, 39, 93–100. [Google Scholar] [CrossRef]
  19. Karagiannis, E.; Sarrou, E.; Michailidis, M.; Tanou, G.; Ganopoulos, I.; Bazakos, C.; Kazantzis, K.; Martens, S.; Xanthopoulou, A.; Molassiotis, A. Fruit quality trait discovery and metabolic profiling in sweet cherry genebank collection in Greece. Food Chem. 2021, 342, 128315. [Google Scholar] [CrossRef] [PubMed]
  20. Wang, Y.; Bai, J.; Long, L.E. Quality and physiological responses of two late-season sweet cherry cultivars “Lapins” and “Skeena” to modified atmosphere packaging (MAP) during simulated long distance ocean shipping. Postharvest Biol. Technol. 2015, 110, 1–8. [Google Scholar] [CrossRef]
  21. Ricardo-Rodrigues, S.; Laranjo, M.; Agulheiro-Santos, A.C. Methods for quality evaluation of sweet cherry. J. Sci. Food Agric. 2023, 103, 463–478. [Google Scholar] [CrossRef]
  22. Belge, B.; Goulao, L.F.; Comabella, E.; Graell, J.; Lara, I. Refrigerated storage and calcium dips of ripe ‘Celeste’ sweet cherry fruit: Combined effects on cell wall metabolism. Sci. Hortic. 2017, 219, 182–190. [Google Scholar] [CrossRef]
  23. Zhu, D.; Liang, J.; Liu, H.; Cao, X.; Ge, Y.; Li, J. Sweet cherry softening accompanied with moisture migration and loss during low-temperature storage. J. Sci. Food Agric. 2018, 98, 3651–3658. [Google Scholar] [CrossRef] [PubMed]
  24. Kurlus, R.; Rutkowski, K.; Łysiak, G.P. Improving of cherry fruit quality and bearing regularity by chemical thinning with fertilizer. Agronomy 2020, 10, 1281. [Google Scholar] [CrossRef]
  25. Marquina, P.L.; Burgos, J.; Oria, R. Application of a compression-relaxation test for the characterization of Burlat sweet cherry. J. Texture Stud. 2001, 32, 15–30. [Google Scholar] [CrossRef]
  26. Valero, D.; Díaz-Mula, H.M.; Zapata, P.J.; Castillo, S.; Guillén, F.; Martínez-Romero, D.; Serrano, M. Postharvest treatments with salicylic acid, acetylsalicylic acid or oxalic acid delayed ripening and enhanced bioactive compounds and antioxidant capacity in Sweet cherry. J. Agric. Food Chem. 2011, 59, 5483–5489. [Google Scholar] [CrossRef] [PubMed]
  27. Overbeck, V.; Schmitz, M.; Blanke, M. Non-Destructive Sensor-Based Prediction of Maturity and Optimum Harvest Date of Sweet Cherry Fruit. Sensors 2017, 17, 277. [Google Scholar] [CrossRef] [PubMed]
  28. Lu, R. Predicting firmness and sugar content of sweet cherries using near-infrared diffuse reflectance spectroscopy. Trans. Am. Soc. Agric. Eng. 2001, 44, 1265–1271. [Google Scholar] [CrossRef]
  29. Sun, J.; Künnemeyer, R.; McGlone, A. Optical Methods for Firmness Assessment of Fresh Produce: A Review. In Postharvest Handling; Academic Press: Cambridge, MA, USA, 2017. [Google Scholar] [CrossRef]
  30. Li, Z.; Yang, H.; Li, P.; Liu, J.; Wang, J.; Xu, Y. Fruit biomechanics based on anatomy: A review. Int. Agrophysics 2013, 27, 97–106. [Google Scholar] [CrossRef]
  31. Papapetros, S.; Louppis, A.; Kosma, I.; Kontakos, S.; Badeka, A.; Papastephanou, C.; Kontominas, M.G. Physicochemical, spectroscopic and chromatographic analyses in combination with chemometrics for the discrimination of four sweet cherry cultivars grown in northern Greece. Foods 2019, 8, 442. [Google Scholar] [CrossRef] [PubMed]
  32. Michailidis, M.; Bazakos, C.; Kollaros, M.; Adamakis, I.D.S.; Ganopoulos, I.; Molassiotis, A.; Tanou, G. Boron stimulates fruit formation and reprograms developmental metabolism in sweet cherry. Physiol. Plant. 2023, 175, e13946. [Google Scholar] [CrossRef] [PubMed]
  33. Michailidis, M.; Titeli, V.S.; Karagiannis, E.; Feidaki, K.; Ganopoulos, I.; Tanou, G.; Argiriou, A.; Molassiotis, A. Tissue-specific transcriptional analysis outlines calcium-induced core metabolic changes in sweet cherry fruit. Plant Physiol. Biochem. 2022, 189, 139–152. [Google Scholar] [CrossRef] [PubMed]
  34. Hummel, J.; Strehmel, N.; Selbig, J.; Walther, D.; Kopka, J. Decision tree supported substructure prediction of metabolites from GC-MS profiles. Metabolomics 2010, 6, 322–333. [Google Scholar] [CrossRef] [PubMed]
  35. Metsalu, T.; Vilo, J. ClustVis: A web tool for visualizing clustering of multivariate data using Principal Component Analysis and heatmap. Nucleic Acids Res. 2015, 43, W566–W570. [Google Scholar] [CrossRef] [PubMed]
  36. Cappai, F.; Benevenuto, J.; Ferrão, L.F.V.; Munoz, P. Molecular and genetic bases of fruit firmness variation in blueberry—A review. Agronomy 2018, 8, 174. [Google Scholar] [CrossRef]
  37. Karagiannis, E.; Michailidis, M.; Karamanoli, K.; Lazaridou, A.; Minas, I.S.; Molassiotis, A. Postharvest responses of sweet cherry fruit and stem tissues revealed by metabolomic profiling. Plant Physiol. Biochem. 2018, 127, 478–484. [Google Scholar] [CrossRef] [PubMed]
  38. Özkaya, O.; Şener, A.; Saridaş, M.A.; Ünal, Ü.; Valizadeh, A.; Dündar, Ö. Influence of Fast Cold Chain and Modified Atmosphere Packaging Storage on Postharvest Quality of Early Season-Harvested Sweet Cherries. J. Food Process. Preserv. 2015, 39, 2119–2128. [Google Scholar] [CrossRef]
  39. An, X.; Li, Z.; Zude-Sasse, M.; Tchuenbou-Magaia, F.; Yang, Y. Characterization of textural failure mechanics of strawberry fruit. J. Food Eng. 2020, 282, 110016. [Google Scholar] [CrossRef]
  40. Li, Z.; Miao, F.; Andrews, J. Mechanical Models of Compression and Impact on Fresh Fruits. Compr. Rev. Food Sci. Food Saf. 2017, 16, 1296–1312. [Google Scholar] [CrossRef] [PubMed]
  41. Lien, C.C.; Ay, C.; Ting, C.H. Non-destructive impact test for assessment of tomato maturity. J. Food Eng. 2009, 91, 402–407. [Google Scholar] [CrossRef]
  42. Tian, S.; Xu, H. Mechanical-based and optical-based methods for nondestructive evaluation of fruit firmness. Food Rev. Int. 2023, 39, 4009–4039. [Google Scholar] [CrossRef]
  43. Tziotzios, G.; Pantazi, X.E.; Paraskevas, C.; Tsitsopoulos, C.; Valasiadis, D.; Nasiopoulou, E.; Michailidis, M.; Molassiotis, A. Non-Destructive Quality Estimation Using a Machine Learning-Based Spectroscopic Approach in Kiwifruits. Horticulturae 2024, 10, 251. [Google Scholar] [CrossRef]
  44. Brüggenwirth, M.; Knoche, M. Factors affecting mechanical properties of the skin of sweet cherry fruit. J. Am. Soc. Hortic. Sci. 2016, 141, 45–53. [Google Scholar] [CrossRef]
  45. Chauvin, M.A.; Whiting, M.; Ross, C.F. The influence of harvest time on sensory properties and consumer acceptance of sweet cherries. Horttechnology 2009, 19, 748–754. [Google Scholar] [CrossRef]
  46. Martínez-Romero, D.; Castillo, S.; Valero, D. Forced-air cooling applied before fruit handling to prevent mechanical damage of plums (Prunus salicina Lindl.). Postharvest Biol. Technol. 2003, 28, 135–142. [Google Scholar] [CrossRef]
  47. Wang, Y.; Long, L.E. Respiration and quality responses of sweet cherry to different atmospheres during cold storage and shipping. Postharvest Biol. Technol. 2014, 92, 62–69. [Google Scholar] [CrossRef]
  48. Jiang, Y.; Shiina, T.; Nakamura, N.; Nakahara, A. Electrical conductivity evaluation of postharvest strawberry damage. J. Food Sci. 2001, 66, 1392–1395. [Google Scholar] [CrossRef]
  49. Ali, Z.M.; Chin, L.H.; Lazan, H. A comparative study on wall degrading enzymes, pectin modifications and softening during ripening of selected tropical fruits. Plant Sci. 2004, 167, 317–327. [Google Scholar] [CrossRef]
  50. Wang, L.; Jin, P.; Wang, J.; Jiang, L.; Shan, T.; Zheng, Y. Effect of β-aminobutyric acid on cell wall modification and senescence in sweet cherry during storage at 20 °C. Food Chem. 2015, 175, 471–477. [Google Scholar] [CrossRef] [PubMed]
  51. Merchant, A.; Richter, A.A. Polyols as biomarkers and bioindicators for 21st century plant breeding. Funct. Plant Biol. 2011, 38, 934–940. [Google Scholar] [CrossRef] [PubMed]
  52. Shen, X.; Guo, X.; Guo, X.; Zhao, D.; Zhao, W.; Chen, J.; Li, T. PacMYBA, a sweet cherry R2R3-MYB transcription factor, is a positive regulator of salt stress tolerance and pathogen resistance. Plant Physiol. Biochem. 2017, 112, 302–311. [Google Scholar] [CrossRef] [PubMed]
  53. Hatoum, D.; Annaratone, C.; Hertog, M.L.A.T.M.; Geeraerd, A.H.; Nicolai, B.M. Targeted metabolomics study of “Braeburn” apples during long-term storage. Postharvest Biol. Technol. 2014, 96, 33–41. [Google Scholar] [CrossRef]
  54. Lisec, J.; Schauer, N.; Kopka, J.; Willmitzer, L.; Fernie, A.R. Gas chromatography mass spectrometry-based metabolite profiling in plants. Nat. Protoc. 2006, 1, 387–396. [Google Scholar] [CrossRef] [PubMed]
Figure 1. (a) Normalized deformation force (N mm−1) of three different compression conditions (1, 5, 10%) and a fixed compression distance (0.16 mm) on the small thickness dimension of the fruit. (b) Scatter plot between the fixed (x axis) distance and the corresponding varied (y axis) distance. One hundred fruit for each condition and cultivar were used to create the box plot. Different letters indicate significant differences among treatments based on Duncan’s multiple range test (p ≤ 0.05). Best-fit linear regression, R squared, and the root-mean-square error (RMSE) were defined in each cultivar and in the pair of varied and fixed distance treatments. Data are provided in Table S1.
Horticulturae 10 00435 g001
Figure 2. (a) Sweet cherry flesh firmness in response to fine continuous compressions following 2 days at 20 °C and 7 days at 4 °C in each treatment and cultivar. Values represent the ratio between each stage and the harvest. (b) Scatter plot among the fixed (x axis) distance and the corresponding varied (y axis) distance of flesh firmness classified into ‘low’ and ‘high’ by panelists. Each value represents the mean of 10 replications of individual fruit, and vertical bars represent the SD for the deformation ratio determinations. Different letters indicate significant differences among treatments based on Duncan’s multiple range test (p ≤ 0.05) or t-Student’s test (*** p ≤ 0.001). Data and linear regression with the R squared of each condition are provided in Table S1.
Horticulturae 10 00435 g002
Figure 3. (a) Weight loss and respiration rate 4, 24, and 48 h after treatment at 20 °C, and membrane integrity (b) 48 h after treatment at 20 °C and 7 days after treatment at 5 °C of sweet cherries in each cultivar were determined. Each value represents the mean of 3 replications × 10 fruit in the case of physiological traits and 10 individually in membrane integrity determination. Differences among treatments were detected based on the least significant difference (LSD, p ≤ 0.05) or different letters indicate significant differences among treatments based on Duncan’s multiple range test (p ≤ 0.05). Arithmetic data are provided in Table S2.
Horticulturae 10 00435 g003
Figure 4. A heat map diagram and clustering analysis of primary metabolites were performed in deformation-related treatments of the two sweet cherry cultivars (a). Additionally, these metabolites were analyzed with principal component analysis (PCA) for each cultivar (b). Based on the grand mean of each cultivar and metabolite, an increase is depicted as red, and a decrease is depicted as blue (see color scale). Metabolite abundances were expressed as relative abundance compared to the internal standard of adonitol. Each metabolite is represented by 10 sweet cherries in three biological replications. Metabolites relative abundance data are provided in Table S3.
Horticulturae 10 00435 g004
Figure 5. Schematic presentation of sweet cherry firmness measurements. Pros and cons during firmness determination when using a deformation force of 1% or a fixed distance of 0.16 mm on the left side and deformation forces of 5% or 10% on the right side. Abbreviations: WL, weight loss; RA, respiration activity.
Horticulturae 10 00435 g005
Disclaimer/Publisher’s Note: The statements, opinions and data contained in all publications are solely those of the individual author(s) and contributor(s) and not of MDPI and/or the editor(s). MDPI and/or the editor(s) disclaim responsibility for any injury to people or property resulting from any ideas, methods, instructions or products referred to in the content.

