Abstract
In this study, E-nose and SPME-GC/MS were applied to compare the odour patterns and volatile compounds of two truffle species harvested in different areas of Campania (Southern Italy). In total, 107 Tuber mesentericum (black truffle) and 60 Tuber borchii (bianchetto truffle) truffles were sampled in areas of Avellino, Salerno, Benevento, and Caserta. The E-nose correctly discriminated between Tuber mesentericum and Tuber borchii truffles. The GC/MS analysis revealed qualitative-quantitative differences between Tuber mesentericum and Tuber borchii, with a prevalence of volatile phenols and aromatic compounds for the black truffle, which are responsible for smoky and floral aromas, and ketones, alcohols, aldehydes, and thiophene derivatives for the bianchetto truffle, mostly responsible for earthy mushroom- and garlic-like aromas. The discriminant analysis performed on the E-nose data pattern provided an average correct classification between 55 and 60% for the same species collected in different sites. Tuber borchii truffles were better discriminated based on the harvesting altitude (hilly and coastal areas). GC/MS revealed quantitative differences in the volatile compounds of truffles of the same species collected in different areas, with variations in abundance based on the harvesting site. The distinctive profile of volatile compounds could represent a useful chemical marker to be investigated to authenticate the truffle harvesting area.
1. Introduction
Truffles, which belong to the Tuber (T.) genus and serve as a food source, are subterranean ascomycete fungi that form symbiotic relationships with the roots of trees or shrubs, such as oak, poplar, and willow, based on the truffle species and the characteristics of the territory [1]. Europe has the most valued truffle species, including T. melanosporum Vittad. (Périgord black truffle), T. magnatum Pico (Italian white truffle), T. aestivum Vittad. (summer or Burgundy truffle), and Tuber borchii Vittad. (bianchetto truffle) [2]. One of the most appreciated characteristics of these truffles is their distinctive and intense aroma, which depends on a complex mixture of volatile organic compounds (VOCs) including alcohols and ketones, mainly with eight and four carbon chain atoms, aldehydes, and aromatic and sulphur compounds.
Over 200 VOCs have been identified in truffles, the predominance of which is implicated in the aromatic distinction of truffles of different species. In the black truffle T. melanosporum, 2,3-butanedione, dimethyldisulfide, 3-methyl-1-butanol, and 3-ethyl-5-methylphenol were among the main aroma-active compounds [3]. On the other hand, some thiophene compounds, such as 3-methyl-4,5-dihydrothiophene and 2-methyl-4,5-dihydrothiophene, were found exclusively in T. borchii and contribute to its aroma [4]. March et al. [5] highlighted the qualitative differences in the volatile compounds of truffles of the species T. aestivum, T. brumale, T. melanosporum, T. rufum, and T. simonea. Despite the presence of common VOCs, such as 3-octanone, 1-octen-3-one, and 3-octanol responsible for the characteristic mushroom aroma of truffles, methoxy-methylbenzene was identified in T. brumale and not in T. aestivum [6]. The differences in VOCs according to the different truffle species are responsible for the various nuances of the aroma observed.
These VOCs can derive from the truffle biosynthesis processes or from the microorganisms that colonise them [7]. Environmental factors such as the harvesting area can influence the abundance of these VOCs for the same truffle species, not only for harvesting in different regions or countries [8,9,10], but more recently a difference has also been noted for truffles of the same species harvested in different sites in the same collection area [11]. In addition to geographical factors, the maturity stage of truffles can also influence their volatile composition [9]. Studies have indicated that lipid compounds accumulate more in the immature stage than in the mature stage, while the levels of some amino acids increase as the maturation stage of truffles increases [12]. These compounds are important as precursors of the truffle aroma. Overall, mature truffles have higher nutritional values in terms of ash, protein, raw fibre, and total sugar contents [9,13].
Several studies have employed the SPME-GC/MS as a headspace solvent-free technique to examine and compare the composition of volatile compounds of truffles belonging to different species, such as T. aestivum, T. melanosporum, T. mesentericum, and T. indicum [11,14]. More recently, the analysis of VOCs has been carried out to identify differences in key volatile compounds of white truffles (T. magnatum) collected in different countries [15]. Some studies have focused on the effect of freezing and temperature conditions on the evolution of the VOC profile during storage [16,17]. Although greater attention has been paid to identify volatile molecular markers associated with specific odours [2], there is a growing interest in identifying chemical markers capable of authenticating different truffle species also in relation to their respective harvesting areas.
However, while volatile compound analysis can represent a complex, costly, and time-consuming method, the electronic nose (E-nose) can be a promising technique to rapidly and objectively investigate the odour fingerprint of a large number of samples [18]. The E-nose is a portable device that mimics the human sense of olfaction and uses an array of gas sensors to convert the chemical responses of volatile chemical species into electrical signals. These signals are processed with pattern recognition techniques to classify and discriminate different samples. Nonetheless, the E-nose does not provide separation and identification of individual volatile compounds [19,20].
Several types of electronic noses have been developed. E-nose based on metal oxide semiconductor (MOS) sensors provide a high response and low recovery time and are highly sensitive to some gases in the order of 100 ppb [21]. In the literature, an electronic nose based on ten MOS sensors was applied to olive oils flavoured with truffles to identify the three different species of truffles mentioned on the oil labels [22]. A recent study used a six-gas-sensor quartz crystal array system, developed in the laboratory, to discriminate the headspace of T. magnatum Pico packaged in various materials; during short time storage, a change in the response intensity was observed after 4 days of storage, with minor changes for samples packaged in paper [23].
To the best of our knowledge, there is limited research available on the direct application of electronic nose technology in characterising truffles, and we found no information regarding the use of an E-nose based on MOS sensors as a useful and rapid device to authenticate truffles harvested in different areas. Therefore, this study aimed to use an E-nose consisting of ten metal oxide semiconductor sensors to differentiate between Tuber mesentericum (black truffle) and Tuber borchii (bianchetto truffle) and, within each truffle species, among different harvesting areas. Since collection sites even in confined areas can have an influence on truffle aroma [11], we also chose to examine different harvesting sites for both truffle species within the Campania region, Southern Italy. SPME-GC/MS analysis was performed to evaluate the volatile compounds that contributed to the different responses of the E-nose sensors.
2. Materials and Methods
2.1. Samples
Fresh ascocarps of T. mesentericum (n = 107) and T. borchii (n = 60) were harvested in different areas of the Campania region (Southern Italy) between January and April 2023. The collection sites involved were those in the provinces of Avellino, Salerno, Benevento, and Caserta. The collection of truffle samples was conducted in accordance with the current regional legislation regarding the truffle harvesting periods in the Campania region. According to Article 8 of Regulation no. 3 of 24 July 2007 of the President of the Regional Council, the harvesting period for Tuber mesentericum Vitt. is from 1 September to 15 April, while for Tuber borchii Vitt., it is from 1 January to 30 April. Consequently, the collection of T. mesentericum samples was carried out from late January to April, while for T. borchii, it was from February to April, with slight variations depending on the collection site (Table 1), to ensure homogeneous maturity times for all truffles. Any truffles not corresponding to the desired maturity time, with an inadequate degree of colour or consistency, were eliminated during the recognition and selection phase of the samples. The truffles were collected by professional hunters using trained truffle hunting dogs. The hunters trained the dogs with fully mature truffles in order to limit the harvesting of truffles in an excessive stage of maturation or immature stage. Table 1 provides an overview of sample collection information, including altitude and associated tree species. Before being transported to the laboratory, the samples were brushed with a soft wet brush to remove coarse impurities and soil, dried and individually sealed in sterile freezer bags. All samples were transported rapidly and separately, in plastic freezer bags, to the laboratory under frozen conditions in insulated boxes with ice packs and stored at −25 °C before analysis to avoid the formation of volatile compounds not native to the truffles.

Table 1.
Sample information for Tuber borchii and Tuber mesentericum truffles, including collection sites, harvesting period, altitude, and associated trees.
2.2. Electronic Nose Analysis
All 167 truffle samples were analysed by electronic nose. A quantity of 2 g of each sample gleba was grated into a 20 mL glass vial, sealed with a screw cap equipped with a Teflon/silicone septum to examine the odour fraction of the headspace. A portable Electronic Nose PEN2 (WMA Airsense Analytics GmbH, Schwerin, Germany), equipped with 10 metal oxide semiconductor (MOS) sensors, was used.
Prior to E-nose acquisition, the vials were placed in a thermostatic bath at 53 °C for 5 min to allow for equilibrium of volatile compounds in the headspace of the sample [17]. The odour sampling system in the headspace consisted of an aspiration needle that extracted and transferred the volatile fraction to the E-nose sensors at a constant flow of 400 mL/min. Data were recorded every second by a computer, and the experiment lasted for 60 s. The recovery time for sensor cleaning with reference air was 240 s [24]. The E-nose was used at 25 °C ± 1. The average G/G0 values of the response of the ten MOS sensors were calculated from measurements in the range time of 45–55 s (stability of the response of the sensors) using Winmuster v.1.6 software (Airsense Analytics GmbH, Schwerin, Germany).
2.3. Analysis of Volatile Organic Compounds
2.3.1. Sample Preparation and SPME Extraction
The analysis aimed to compare the two species, T. mesentericum and T. borchii, and, within each species, samples were divided into distinct groups. The 107 T. mesentericum and 60 T. borchii samples were homogenised by grating, creating two separate batches for each species. Further homogenisation groups taking collection sites into account were then created. For T. mesentericum, the truffles were homogenised to create four subgroups in relation to the sites in which the collection areas fall: (1) Partenio-Taburno; (2) Alburni; (3) Eremita-Marzano; (4) Picentini. Similarly, for T. borchii, four subgroups were formed from the Caserta and Salerno provinces based on the collection altitude, named (1) Caserta hill, (2) Salerno hill, (3) Caserta coast, and (4) Salerno coast (see Table 1 for further details).
Truffle sample volatile compounds were extracted using the solid-phase microextraction (SPME) technique. A quantity of 2 g of each sample gleba was placed in a 20 mL glass vial, sealed with a screw cap equipped with a Teflon/silicone septum, and conditioned at 53 °C for 5 min. After this equilibration period, the SPME fibre (Supelco Co., Bellefonte, PA, USA), coated with a 2 cm long 50/30 µm divinylbenzene/carboxen/polydimethylsiloxane (DVB/CAR/PDMS) stationary phase, was exposed to the sample headspace for 13.6 min [17].
2.3.2. Gas Chromatography/Mass Spectrometry Analysis
The volatile organic compounds were desorbed directly into the GC inlet maintained at a temperature of 250 °C in split mode (4:1 ratio) for 10 min. The analysis of volatile compounds was performed on an Agilent 7890A gas chromatograph coupled to an Agilent 5975C VL MSD mass spectrometer with a triple-axis detector (Agilent Technologies, Inc., Palo Alto, CA, USA). The GC was equipped with a Zebron ZB-WAX capillary column (60 m × 0.25 mm internal diameter × 0.25 μm film thickness of 100% polyethylene glycol; Phenomenex, Torrance, CA, USA). Helium was the carrier gas at a flow rate of 1 mL/min. The oven temperature program was as follows: 40 °C for 5 min, first ramp of 4 °C/min to 140 °C, second ramp of 10 °C/min to 220 °C, and hold at 220 °C for 10 min [17]. Mass spectra were acquired at 70 eV. The source temperature was 230 °C, the quadrupole temperature was 150 °C, and the interface temperature was 250 °C.
Identification of VOCs was performed by comparing the retention times and mass spectra of the identified compounds with those of pure reference standard compounds when available (Sigma-Aldrich, St. Louis, MO, USA). Identification was also confirmed by comparing mass spectra with those in the National Institute of Standards and Technology (NIST) database. The fibre was conditioned at 270 °C for 1 h before the experiment. Before each analysis, a fibre blank run was performed to prevent the release of undesirable compounds. Peak area integration was performed using the MSD ChemStation 5975 TAD Data Analysis software v.E.02.00.493 (Agilent Technologies, Palo Alto, CA, USA) and expressed as area percentages. The analysis of volatile compounds was performed in triplicate.
2.4. Statistical Analysis
Three independent data patterns were constructed starting from the E-nose measurement tests in the 45–55 s time range (stability of the response of the sensors) both for the comparison between Tuber borchii and Tuber mesentericum, then for the comparison between sites of collection of T. borchii, and then for the comparison between the collection sites of T. mesentericum. The obtained results were processed through two pattern recognition methods, principal component analysis (PCA) and linear discriminant analysis (LDA). Since the data patterns were obtained from eleven vectors (from 45 to 55 s of the response of the ten E-nose sensors), before the discriminant analysis, the average values of the response of each sensor were calculated to ensure independent observations. A confusion matrix was obtained from the LDA classification models of the three data patterns constructed using the raw E-nose data (mean values of G/G0; where G represents the sensor conductivity when exposed to the sample gas, and G0 represents the conductivity when exposed to the reference gas). Analysis of variance (ANOVA) with Tukey’s test (p < 0.05) was performed to highlight the variables that produced significant differences. VOCs with significant differences were used for cluster heatmap analysis, implementing ascendant hierarchical clustering based on Euclidian distances preceded by the k-means algorithm to permute the data matrix. Analyses and visualisation of the data were carried out using Winmuster software v.1.6 (Airsense Analytics GmbH, Schwerin, Germany) and XLStat (Version 2019 v.2.2), an add-in software package for Microsoft Excel v.2404 (Addinsoft Corp., Paris, France).
3. Results and Discussion
3.1. Specie Variability between Tuber borchii and Tuber mesentericum
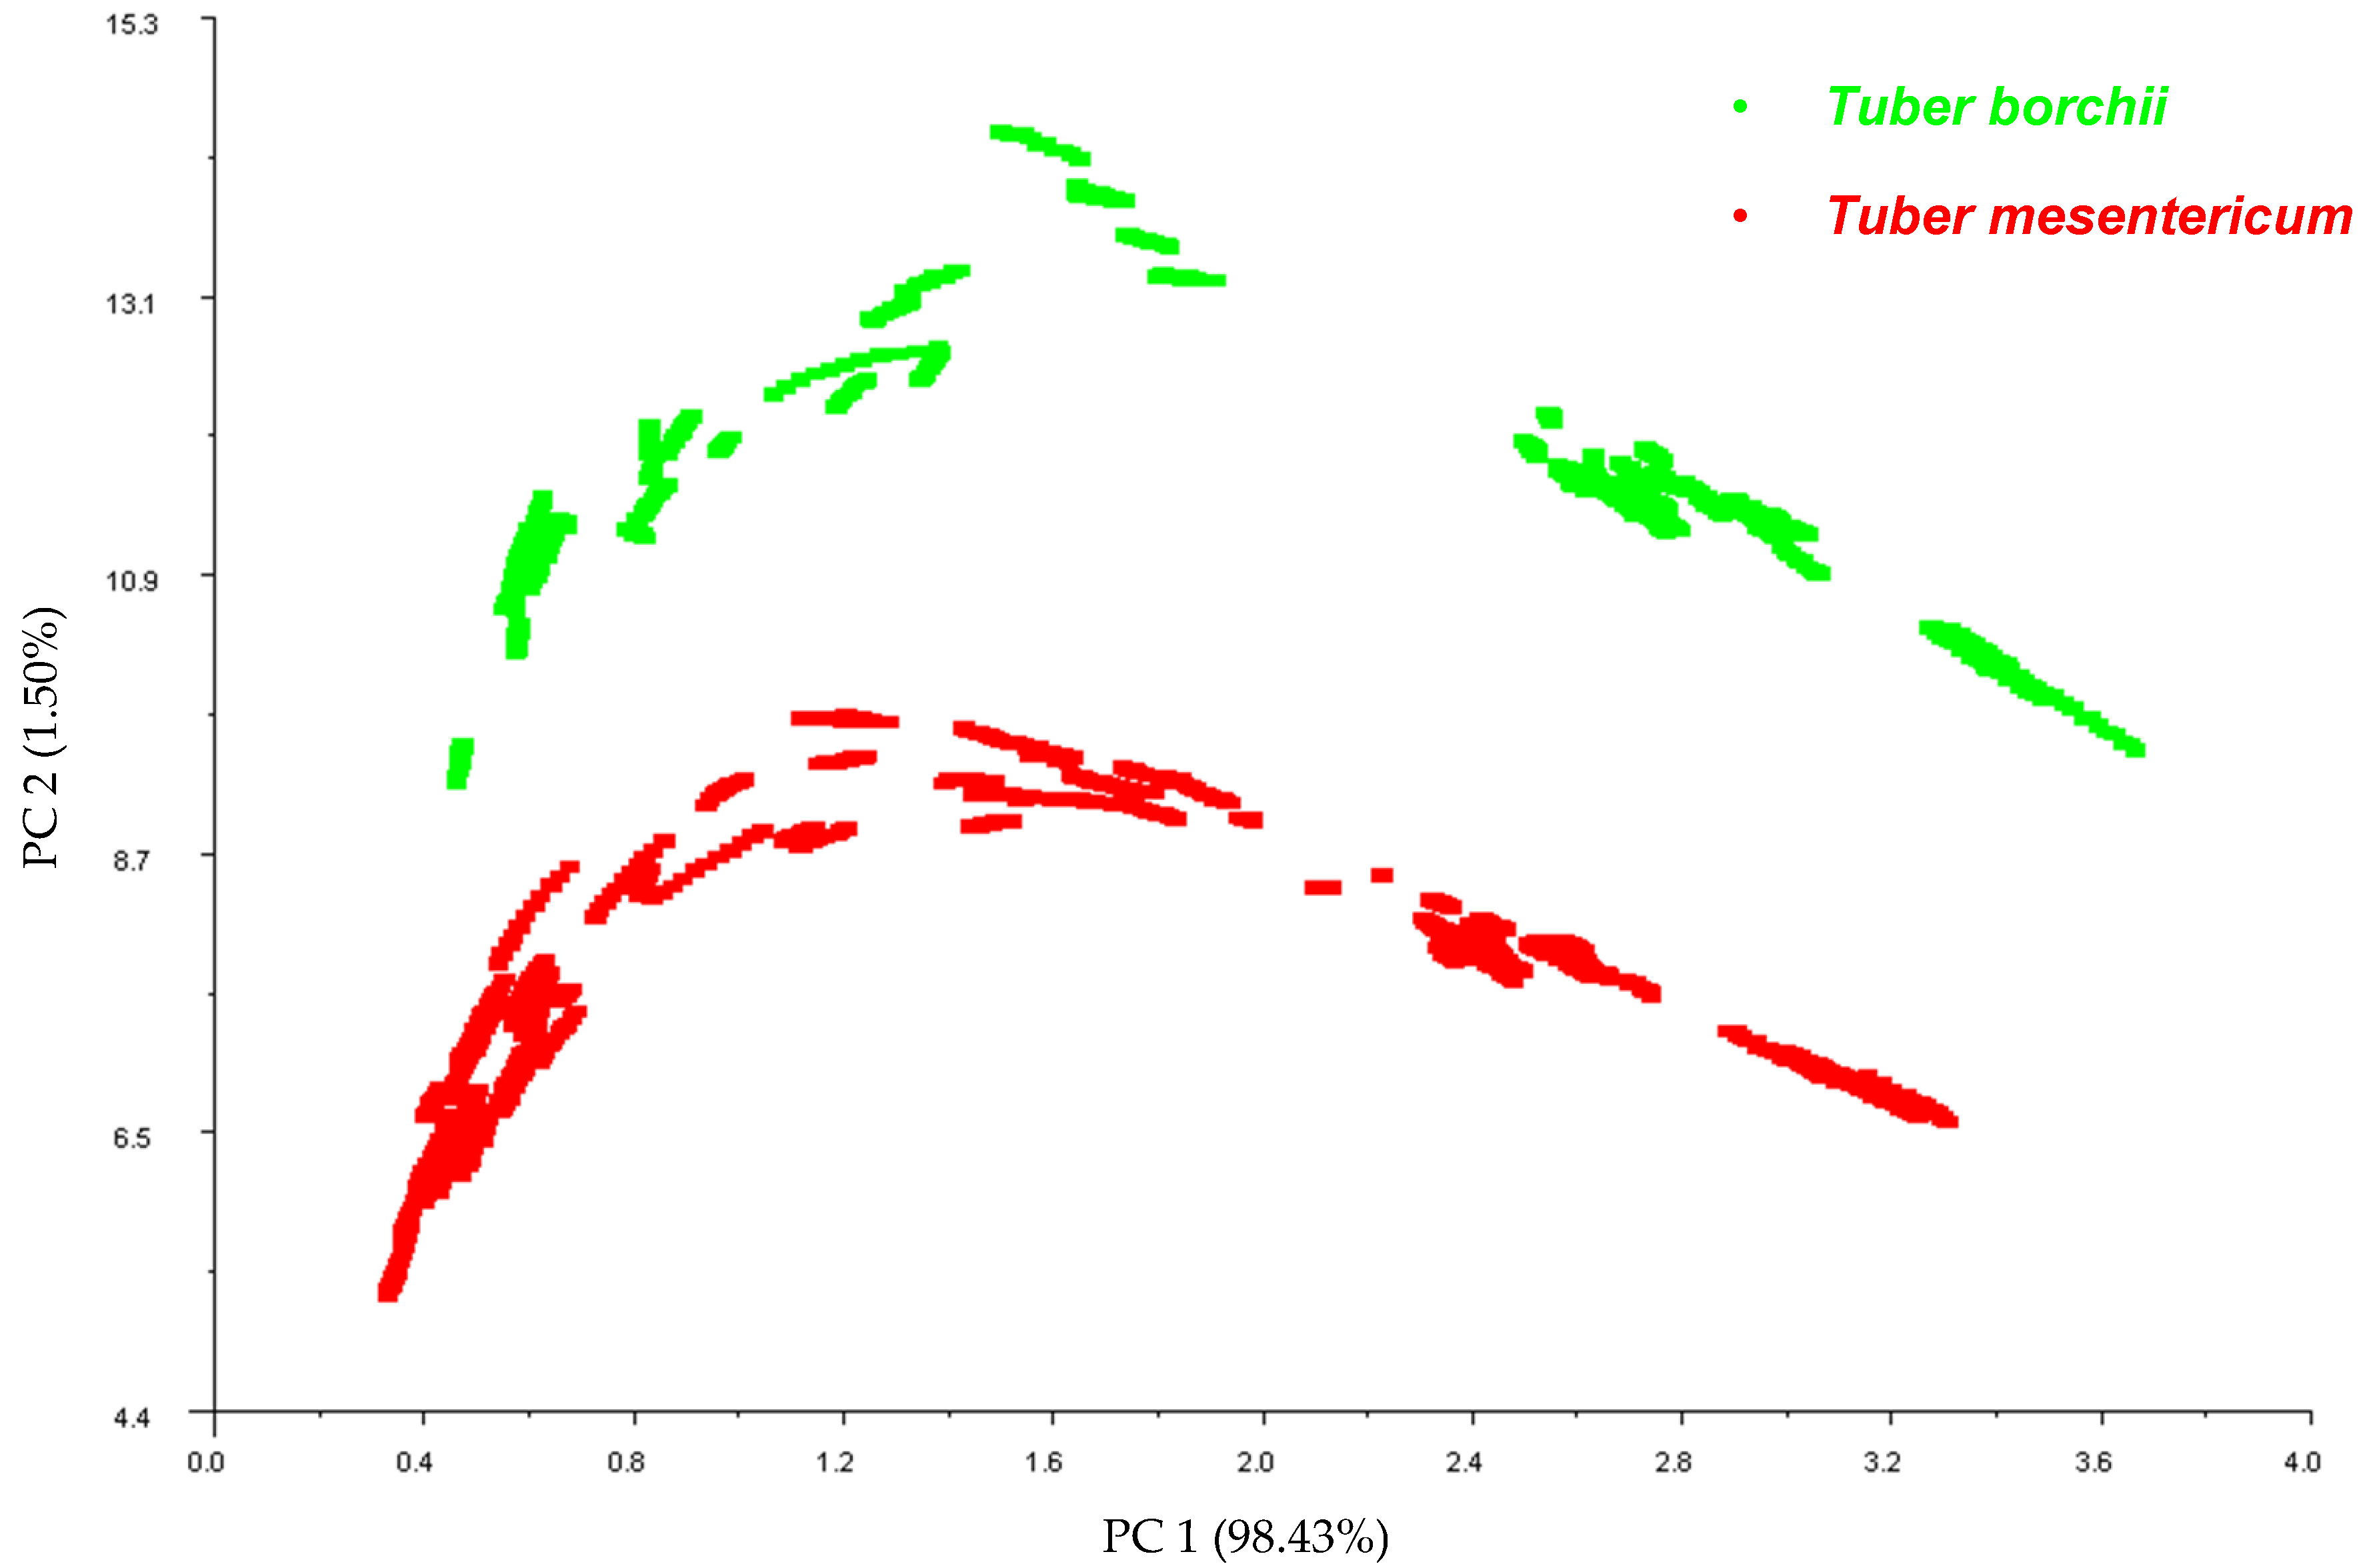
Principal Component Analysis was implemented as a data pattern recognition technique to reduce the dimensionality of the data set and to investigate the ability of the E-nose to discriminate between the two truffle species. The resulting PCA observation plot of the first two principal components illustrates distinct clusters corresponding to T. mesentericum and T. borchii, with the first principal component explaining 98% of the variance (Figure 1). The E-nose provided good discrimination between Tuber mesentericum and Tuber borchii. The species is known to be one of the primary factors influencing the profile of volatile compounds and the aroma of truffles [2], supporting our findings.

Figure 1.
Correlation plot obtained from Principal Component Analysis carried out on the data pattern constructed from the 45–55 s sensor responses of the E-nose on the 107 samples of T. mesentericum and 60 samples of T. borchii.
SPME-GC/MS analysis was then conducted to identify the volatile organic compounds that most contributed to the different responses of the E-nose sensors between Tuber borchii and Tuber mesentericum. Table 2 shows VOCs identified in the two truffle species, as well as their odour descriptors according to the literature [17,25].
Table 2.
Headspace level of volatile organic compounds identified in truffles of the Tuber borchii (bianchetto) and Tuber mesentericum (black truffle) species.
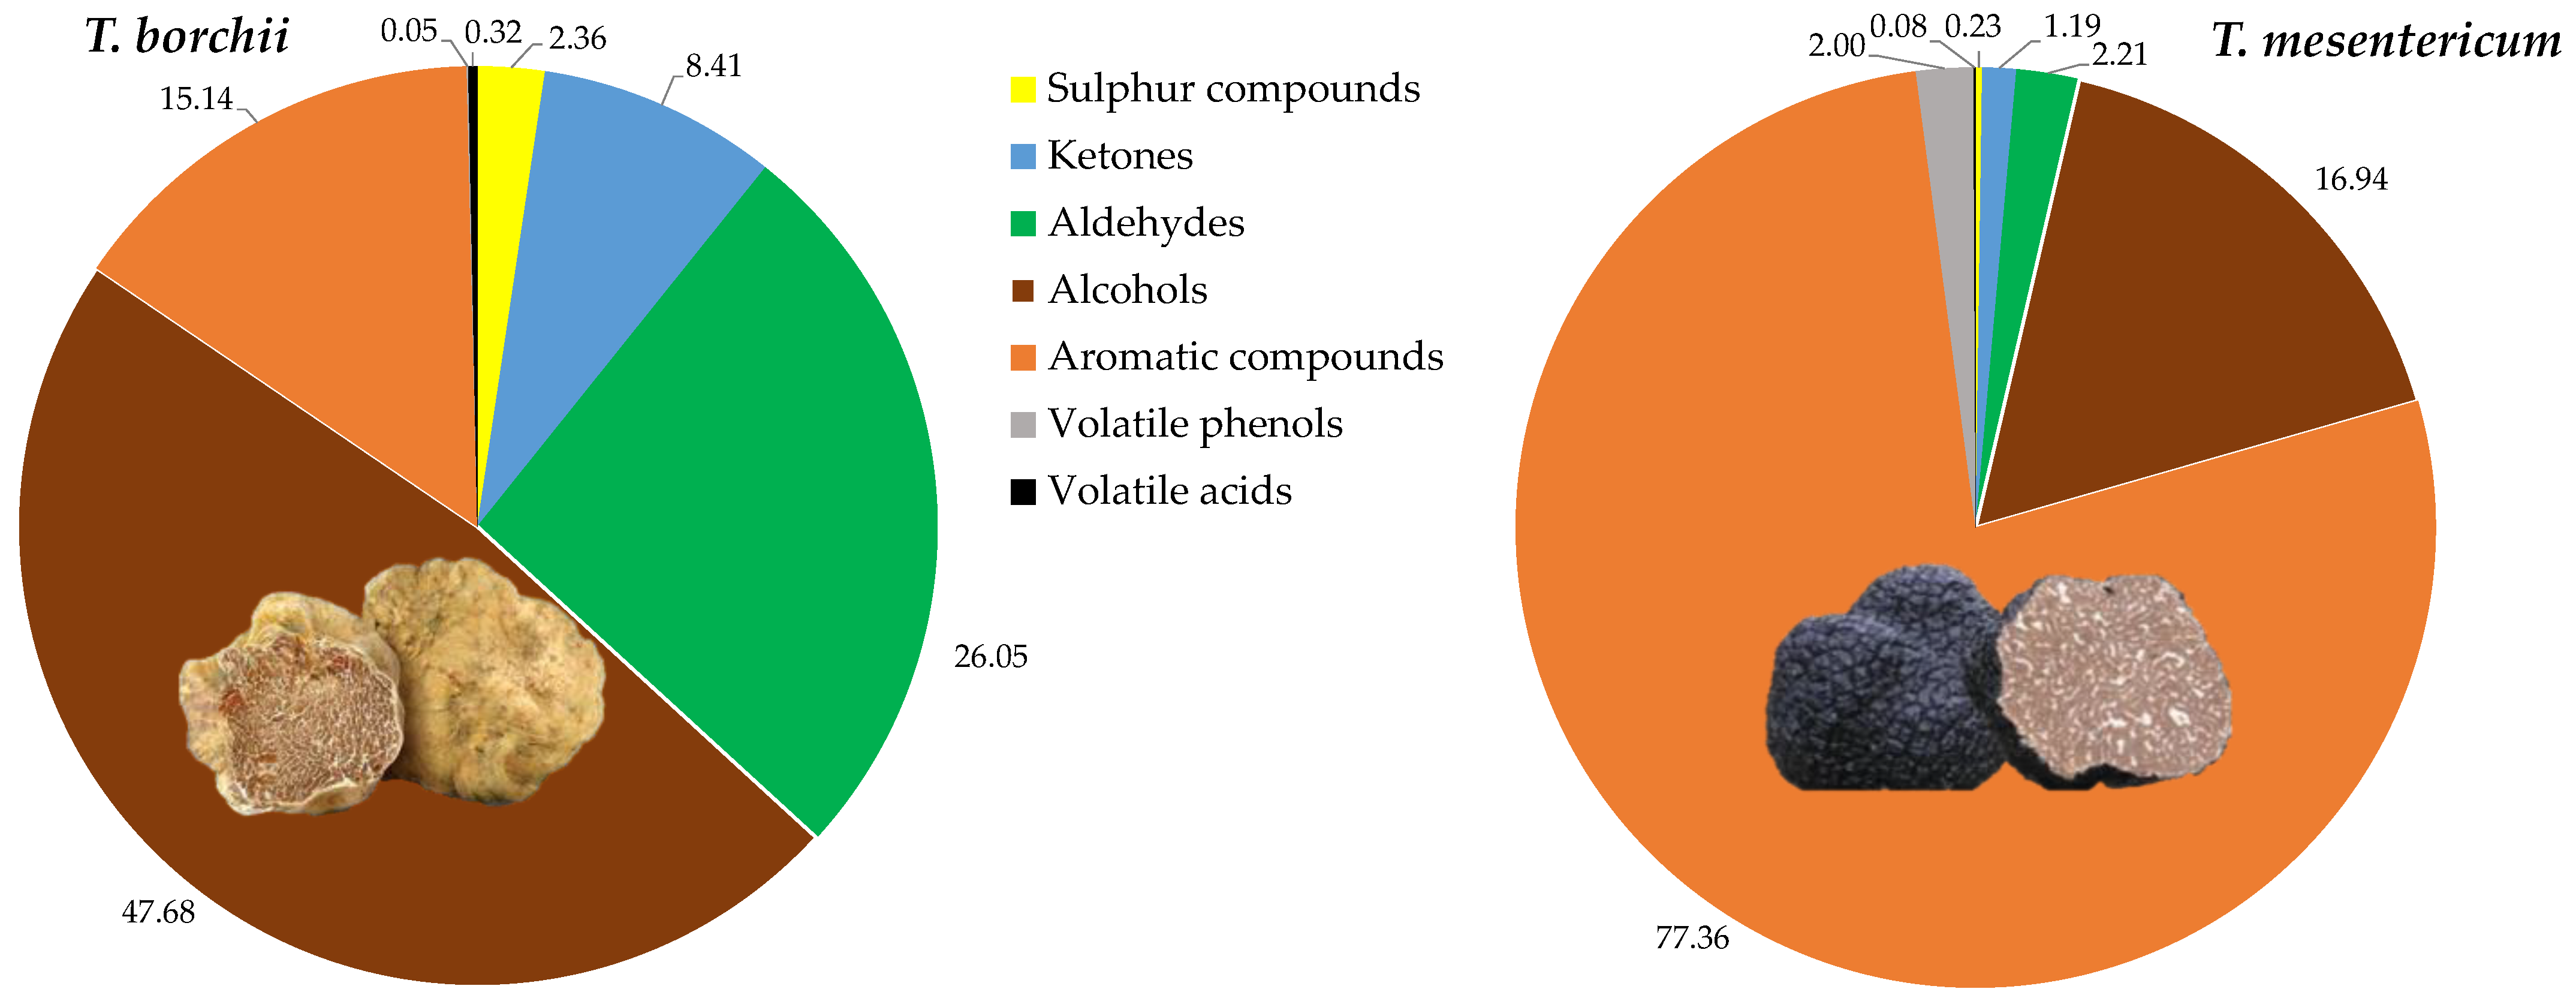
In total, 64 VOCs were identified, with the majority exhibiting significant differences between the two species. In particular, in decreasing order of quantity for Tuber mesentericum, there were volatile aromatic compounds, alcohols, aldehydes, volatile phenols, ketones, sulphur compounds, and volatile acids (Figure 2).
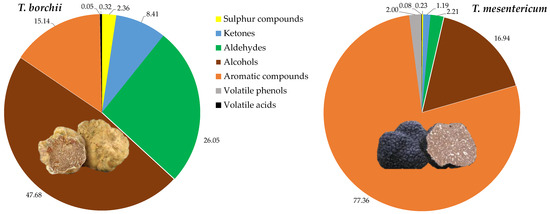
Figure 2.
Relative quantities of chemical classes of volatile compounds quantified in the headspace of Tuber borchii and Tuber mesentericum.
In T. borchii, alcohols were the dominant VOCs, followed by aldehydes, ketones, sulphur compounds, and volatile acids. Alcohols have previously been identified as the most abundant compounds in Tuber borchii [26]. It is reported that the order of VOC levels of different truffles is from highest to lowest for black truffle, white truffle, and summer truffle, respectively, with black truffle reportedly producing over 100 times more aromatic compounds than others [3], as we observed between the black and the bianchetto truffle.
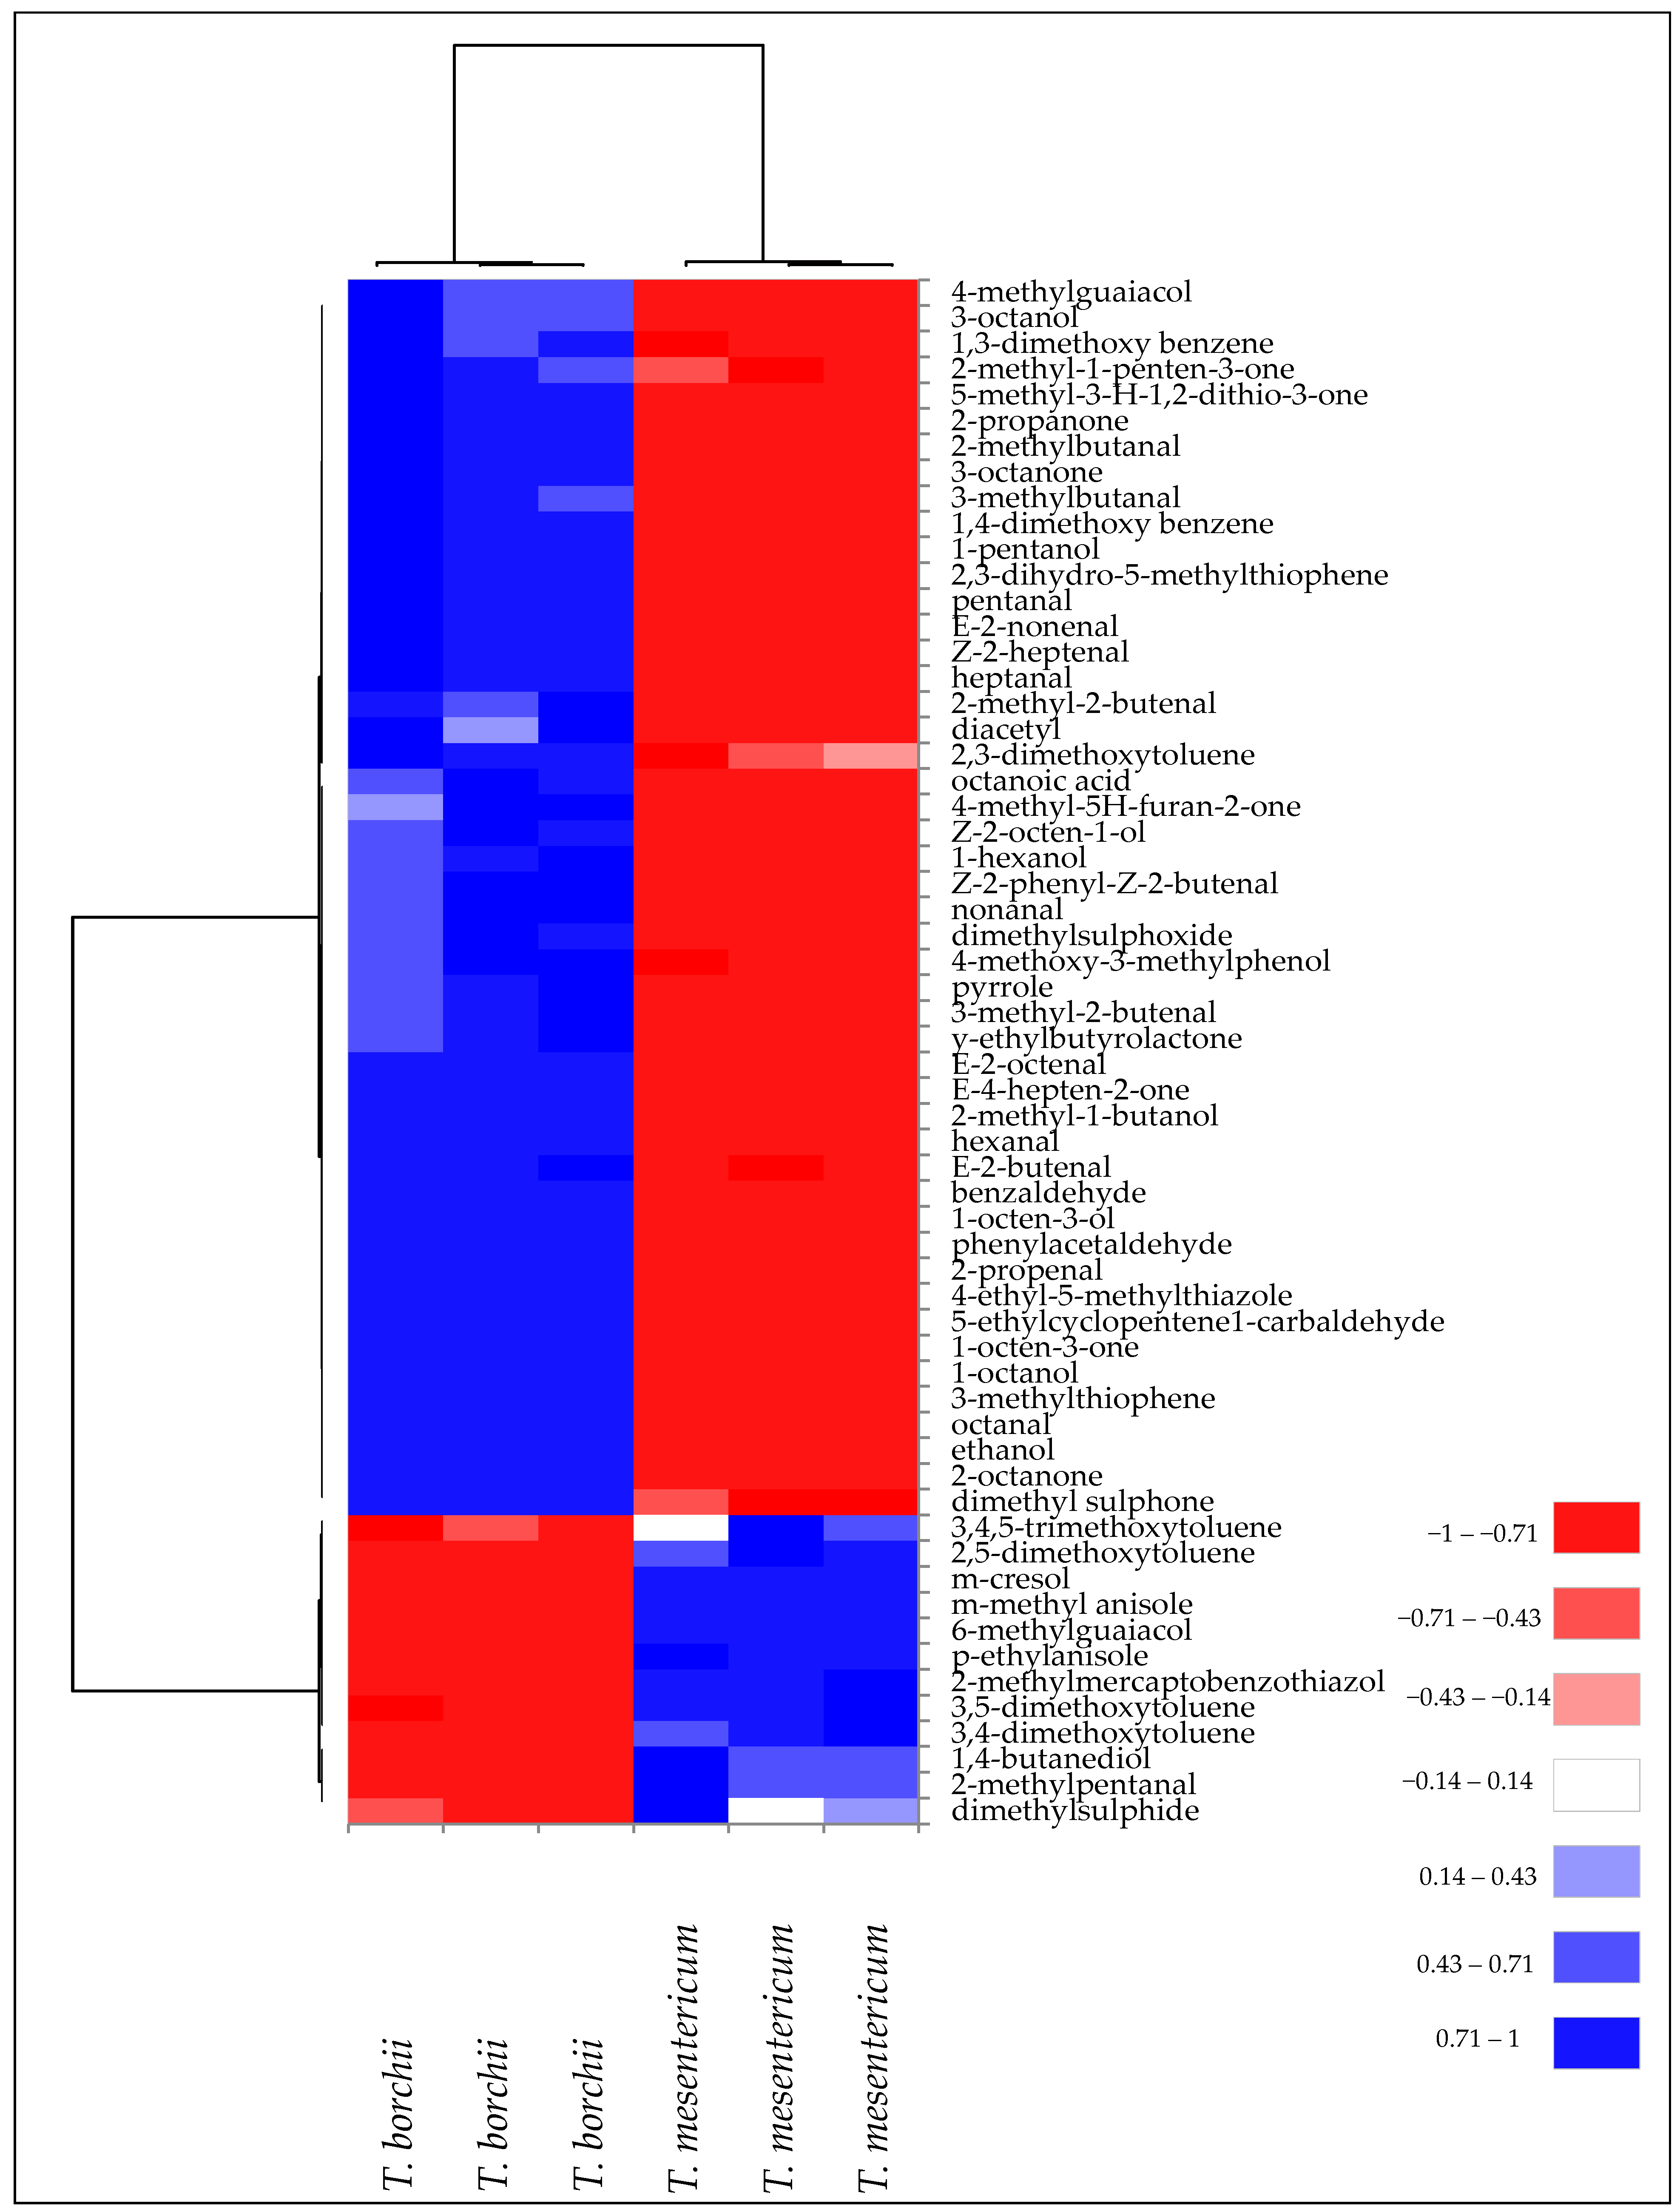
These qualitative and quantitative differences in terms of VOCs contributed to the classification and discrimination of Tuber mesentericum and Tuber borchii into two distinct groups, as highlighted by the cluster analysis visualised as a heatmap (Figure 3).
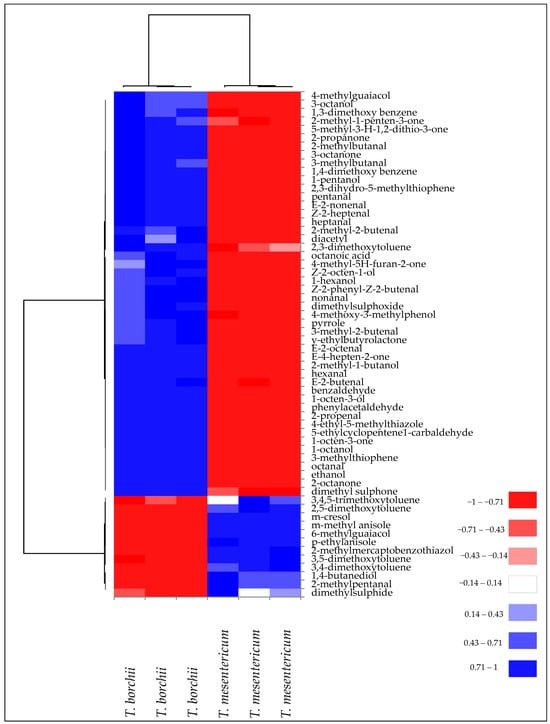
Figure 3.
Heatmap of significantly different (p < 0.05) volatile compounds of T. borchii and T. mesentericum samples. Volatile compounds were plotted on the Y axis, while the X axis had the samples. Results are displayed as negative (−1) to positive (+1) correlation of the volatile compounds in the permuted matrix for the respective truffle samples.
This subdivision is due to the diversity of VOCs present in the two truffle species. In fact, two main clusters of volatile compounds have been identified. One was mainly related to volatile phenols and volatile aromatic compounds, mostly present in T. mesentericum. A second cluster was mainly formed by aldehydes, ketones, and alcohols, more representative of T. borchii.
In T. mesentericum, 3-methylanisole was the most abundant VOC, responsible for a floral aroma (Table 2). This compound has been identified as one of the most abundant VOCs in black truffles [26]. Consistently with our results, Schmidberger and Schieberle [25] observed a higher quantity of volatile aromatic compounds in black truffles bringing typical floral, spicy, and nutty odours. On the other hand, 8-carbon chain alcohols prevailed in T. borchii, characterised by a mushroom and earthy odour, with 1-octen-3-ol as the most abundant one.
It is noteworthy to mention that volatile phenols qualitatively characterised T. mesentericum. These compounds, including meta-cresol (m-cresol), which constitutes >99% of the phenolics detected in the headspace of T. mesentericum, have low odour thresholds and contribute to the distinctive smoky/burnt and phenolic aroma of black truffles [25]. A paper describing the odour thresholds in the air of 30 volatile phenols and their isomers found that compounds with monoalkyl groups in the meta position lowered thresholds substantially, imparting very low odour detection thresholds of <1 ng/L air [27].
Another important difference was in the sulphur compounds, which were more representative of the “bianchetto” headspace (Figure 2), according to Splivallo, Bossi, Maffei, and Bonfante [26], who identified them as more abundant compounds in T. borchii compared to black truffles such as T. melanosporum and T. indicum. Schmidberger and Schieberle [25] found, among the most odour-active compounds (FD ≥ 4), greater quantities of bis(methylthio)methane, 3-(methylthio)propanal, etc., in white Alba truffle compared to black Burgundy truffle, which provide a greater sulphury, garlic, and cooked cabbage-like aroma, as confirmed by sensory analysis. Moreover, in agreement with our findings, 2-methyl-4,5-dihydrothiophene is exclusively found in T. borchii and contributes to the aroma perceived by humans in this kind of truffle [16,28]. The bacteria that colonise T. borchii have exhibited an important role in contributing to the formation of these thiophene derivatives [7]. Overall, these differences in volatile compounds have led to sensory evaluations describing white truffles as having a garlicky, mushroom, and cheesy aroma, with subtle methane notes, while black truffles are described as having a “wet forest” aroma, with hazelnut and phenolic notes [29].
3.2. Geographical Variability of Tuber borchii and Tuber mesentericum
Table 3 shows the confusion matrix obtained from the linear discriminant analysis conducted as a supervised data pattern recognition method on the data pattern constructed by comparing the different harvesting zones of T. borchii. The analysis assumes that within-class covariance matrices are equal and takes prior probabilities into account at a significance level of 5%. The confusion matrix shows that, within the same species, most of the samples collected in the same harvested area obtained a correct classification rate between or above 50%, up to 74% for the “Caserta coast” area, 68% for the “Salerno coast” area, and 67% for the “Caserta hill” area.
Table 3.
Confusion matrix obtained from the discriminant analysis performed on the data pattern constructed considering the different harvesting areas of T. borchii.
Higher misclassifications occurred for T. borchii collected in the “Salerno hill” area (Table 3). However, considering the collection altitude of T. borchii (coastal area, at sea level, and hilly area, above 350 m above sea level; see Table 1 for further details), we observed an increase in the correct classification rate, in which the “coast” sites were correctly classified 38 times out of 42, while the “hill” sites were correctly classified 12 times out of 18. Among the host trees of the coastal areas, there were Aleppo and Stone pine, while the hilly areas were represented by Oak trees (Table 1).
Recently, Niimi, Deveau, and Splivallo [15] showed variations in the quantity of 48% of the volatile compounds identified based on the sites of truffle harvesting within the same geographical area. These differences were mainly attributed, as demonstrated by microbiome analysis, to differences in bacterial communities between the various collection sites [15]. Therefore, it is plausible that the coastal and hilly collection sites, subjected to distinct climates, vegetation (e.g., host trees), and, consequently, soil microbiota, played a key role in the differences in odour patterns obtained from the E-nose analysis.
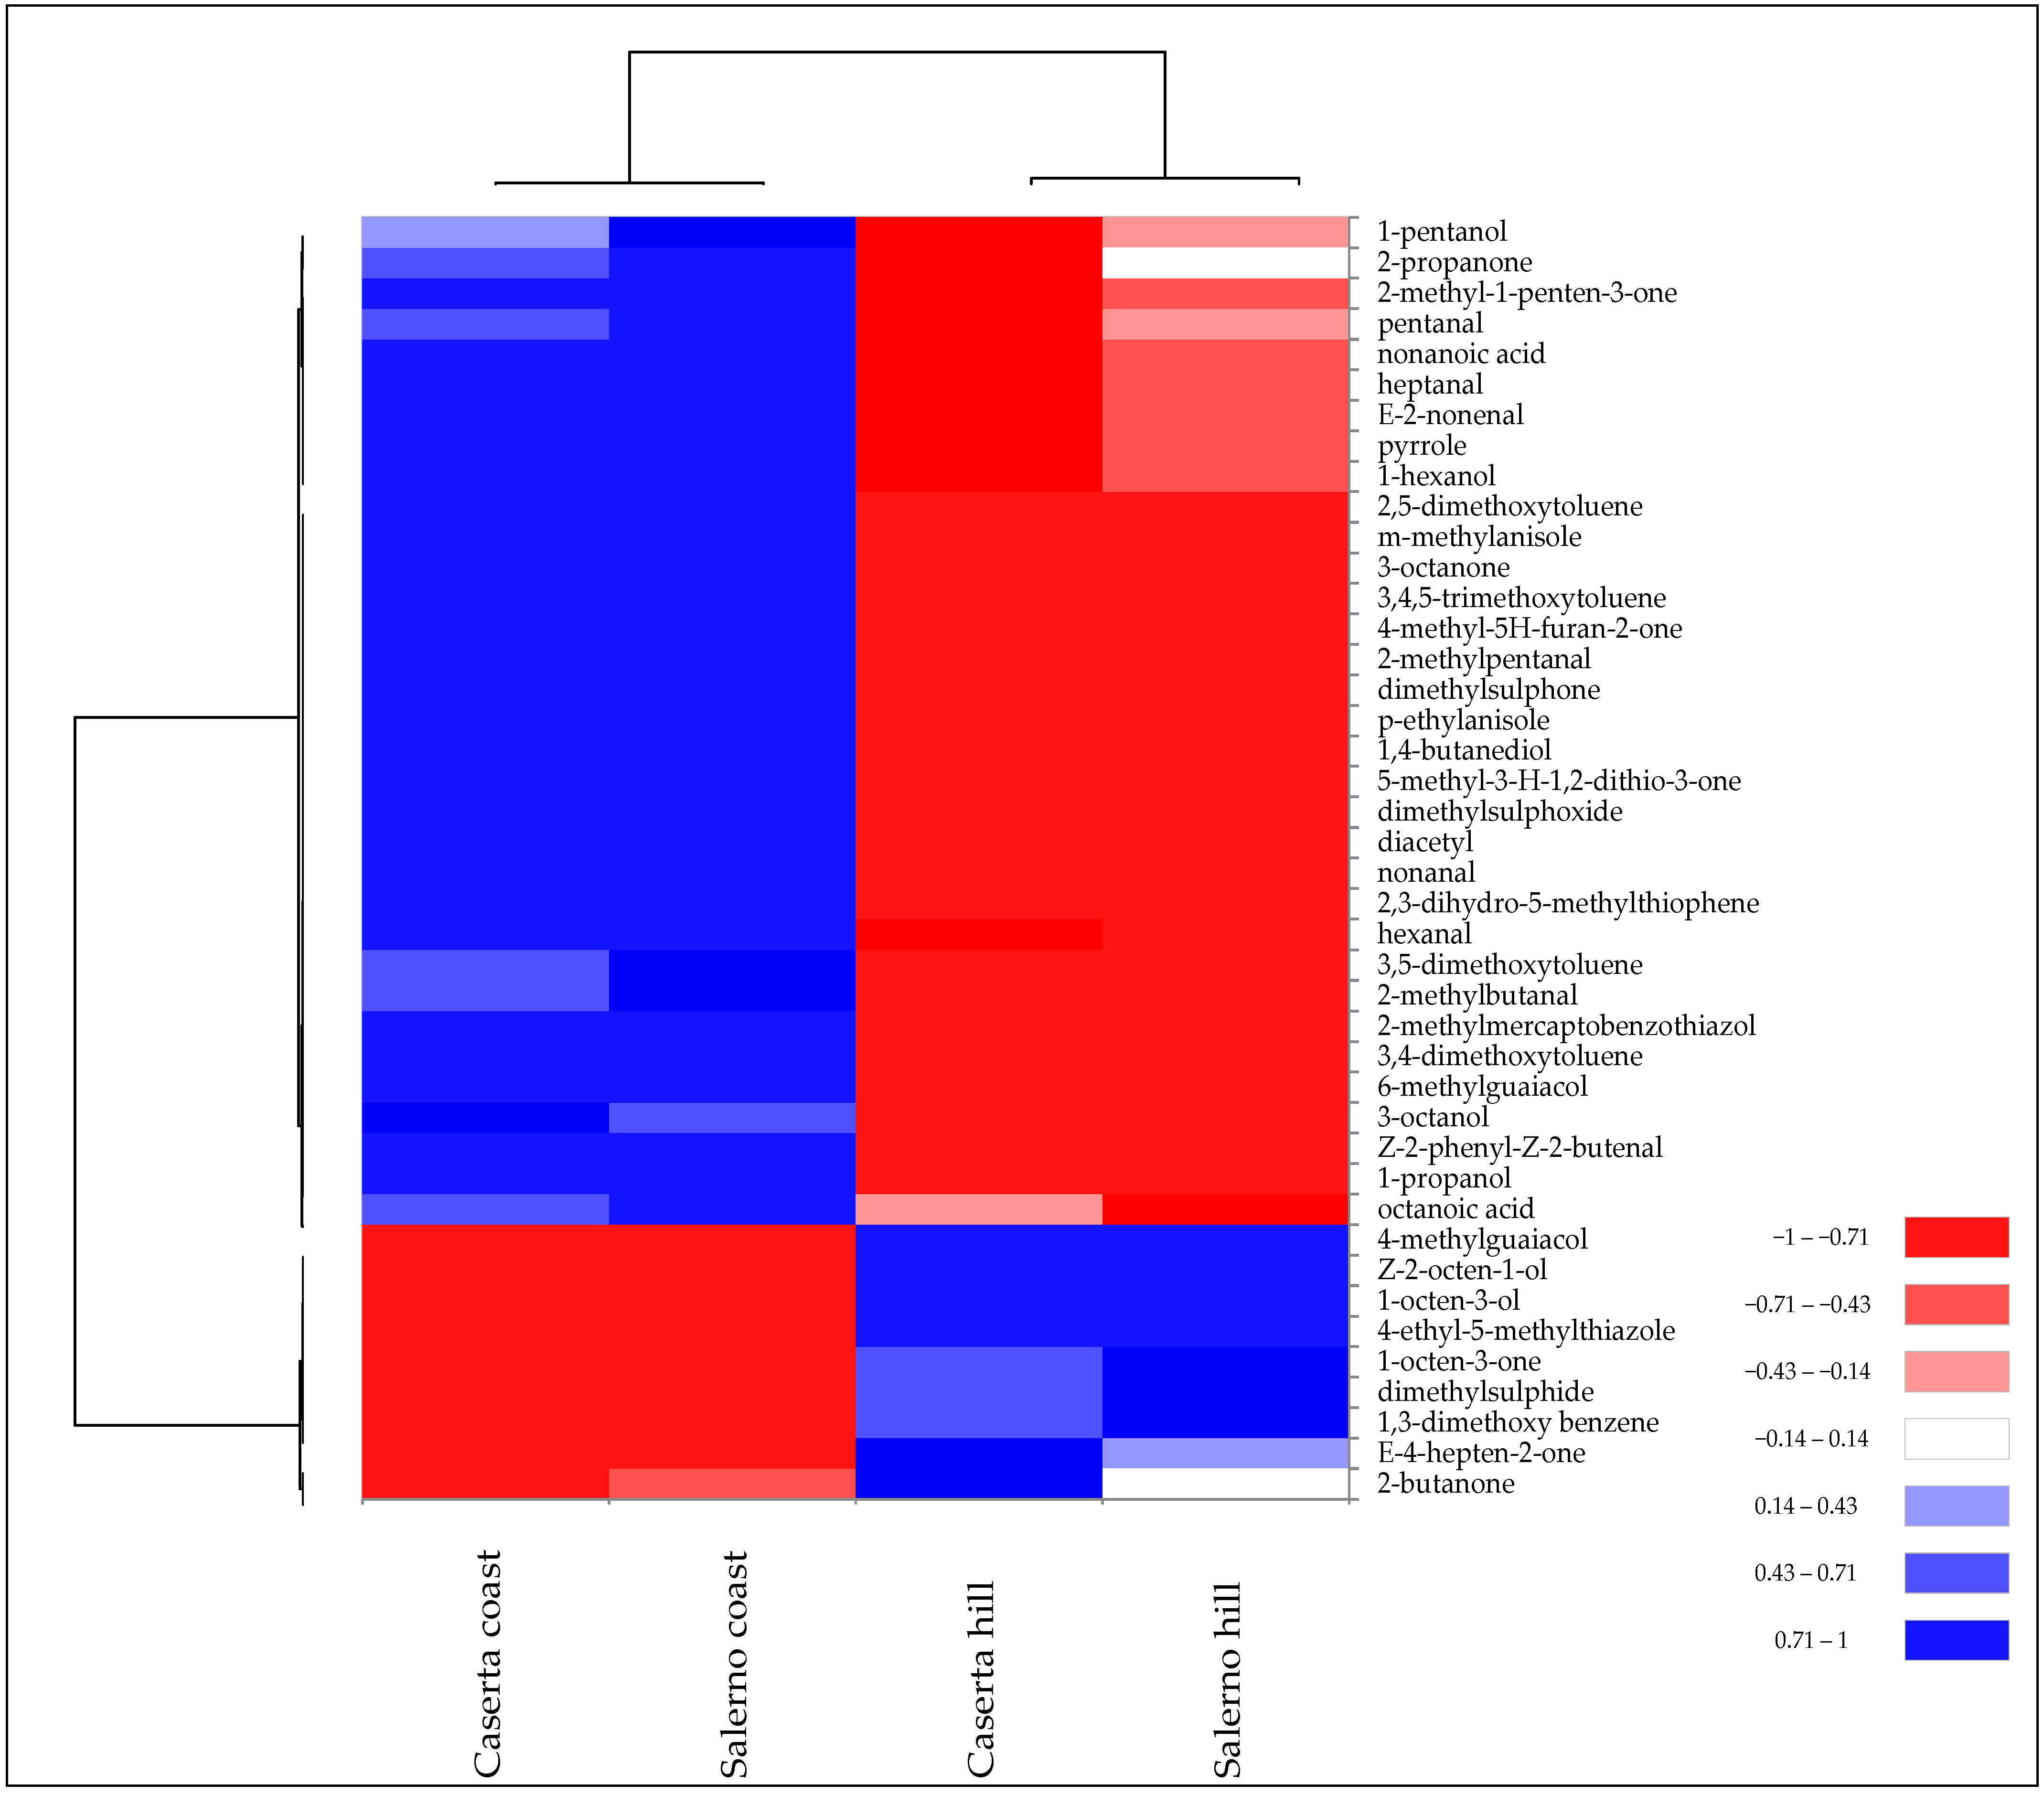
SPME-GC/MS analysis confirmed these differences. In fact, the different levels of volatile compounds allowed the samples of T. borchii from the two harvesting zones to be grouped into two distinct clusters (Figure 4).

Figure 4.
Heatmap of significantly different (p < 0.05) volatile compounds of T. borchii samples harvested in different areas of Caserta and Salerno provinces of Campania region. Volatile compounds were plotted on the Y axis, while the X axis had the samples. Results are displayed as negative (−1) to positive (+1) correlation of the volatile compounds in the permuted matrix for the respective samples.
The two collection areas exhibited quantitative differences in terms of specific volatile compounds rather than chemical class. For instance, T. borchii collected at altitudes >350 m above sea level had a higher amount of 1-octen-3-ol, which is one of the VOCs quantitatively more abundant in T. borchii (Table 2). In contrast, “coast” samples had a higher abundance of aromatic compounds and aldehydes.
In terms of sulphur compounds, “Caserta hill” and “Salerno hill” samples showed higher concentrations of dimethylsuphide, while “Caserta coast” and “Salerno coast” showed higher concentrations of dimethylsuphone and thiophene derivatives (Figure 4). Gioacchini et al. [8] detected significant differences in the proportion of volatile compounds from white truffles of the Tuber magnatum species collected from different regions of Italy. Bertault et al. [30] found a low level for random amplified polymorphic DNA and microsatellite polymorphism of T. melanosporum collected from different areas of Italy and France. This low genetic variation led the authors to explain the observed morphological and organoleptic differences to environmental variables, such as pedoclimatic conditions.
Similarly, a discriminant analysis was also conducted on the E-nose data pattern of the different harvesting zones of Tuber mesentericum, and the confusion matrix is reported in Table 4.
Table 4.
Confusion matrix obtained from the discriminant analysis performed on the data pattern constructed considering the different harvesting areas of T. mesentericum.
In this case, the “Picentini” collection area obtained the best % correct classification, 64%, followed by “Alburni” and “Eremita-Marzano” areas, both of which obtained 56% correct classification (Table 4).
Figure 5 illustrates the results of the cluster heatmap analysis performed on VOCs identified in the Tuber mesentericum truffle samples collected in different areas of Campania, in order to effectively visualise their distribution and clustering patterns.
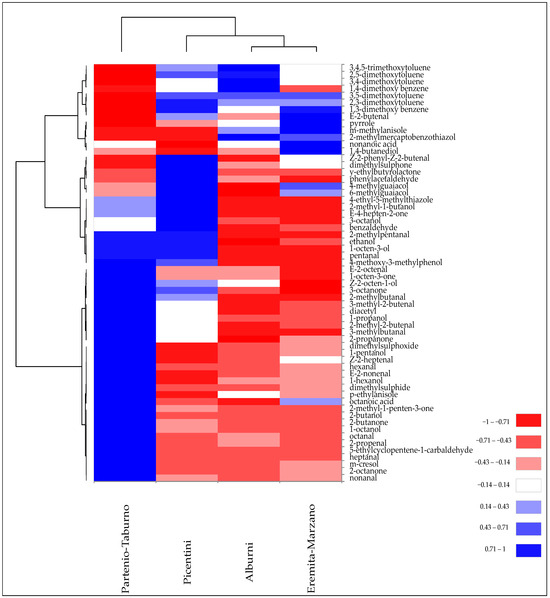
Figure 5.
Heatmap of significantly different (p < 0.05) volatile compounds of T. mesentericum samples harvested in different areas of Campania region. Volatile compounds were plotted on the Y axis, while the X axis had the samples. Results are displayed as negative (−1) to positive (+1) correlation of the volatile compounds in the permuted matrix for the respective samples.
All samples exhibited a peculiar pattern of VOCs, although, at the same time, they showed some similarities that caused their partial grouping. For example, “Alburni” and “Eremita-Marzano” collection sites had in common the abundance of certain VOCs, such as a higher presence of 3-methylanisole, pyrrole, 2,5-dimethoxytoluene, 3,4-dimethoxytoluene, and 3,4,5-trimethoxytoluene, and a lower quantity of some ketones and unsaturated aldehydes, thereby causing their clustering. Subsequently, the “Picentini” site, due to the sharing of volatile phenols such as 6- and 4-methylguaiacol and some aromatic compounds, was partially grouped with the previous two groups. However, the greater abundance of 8-carbon alcohols and ketones also contributed to its similarity with the “Partenio-Taburno” site, which still maintained a modest diversity in the composition of VOCs, such as a higher quantity of unsaturated aldehydes and 2-ketones (Figure 5).
Previously, differences in the abundance of VOCs helped discriminate the black truffle Tuber indicum harvested from seven different regions of China, despite some regions showing very similar profiles [9]. Moreover, within the sample groups from the Mudanjiang and Linzhi (Tibet) regions, authors observed intra-group variations in VOCs, indicating differences across various collection sites within the same region. Similar results were obtained by Lu et al. [31] who observed differences in the VOCs of Chinese truffles of different origins, even within the same region, attributing these differences to the metabolic activity of the associated microorganisms and to the different pedoclimatic conditions [31].
Although this study recognises the limitation of non-robust quantitative analysis of volatile compounds based on relative percentage areas, it aims to pave the way for future research focused on combined E-nose and GC/MS analysis for rapid discrimination of truffles and the identification of key volatile molecules responsible for these differences. Overall, these results suggest that environmental factors could be crucial in affecting the VOC profile of the truffle, although the species remains the main determinant.
4. Conclusions
Through the analysis of the E-nose data pattern, T. mesentericum was effectively discriminated from T. borchii. SPME-GC/MS analysis revealed qualitative–quantitative differences in volatile compounds between the two truffle species. This study provided, for the first time, a comprehensive list of volatile compounds identified in T. mesentericum, which included aromatic compounds like 3-methylanisole and volatile phenols like m-cresol. On the contrary, 8-carbon ketones and alcohols, such as 3-octanone, 1-octen-3-one, and 1-octen-3-ol, prevailed in T. borchii. While volatile phenols (m-cresol) were exclusively identified in T. mesentericum, thiophene derivatives qualitatively characterised T. borchii. The abundance of these compounds is responsible for more pronounced floral and smoky odours for T. mesentericum, and mushroom and earthy notes for T. borchii.
Considering the E-nose data pattern of different collection sites for the same species, the differences were smaller, leading to an average 60% correct classification rate. However, for T. borchii, the correct classification rate increased when it was divided into two groups depending on the harvesting altitude (at sea level or >350 m above sea level) of the provinces of Caserta and Salerno, suggesting an important role of environmental factors on the composition of truffle volatile compounds. In fact, quantitative differences in volatile compounds were mainly observed between these areas based on the collection altitude. Overall, the abundance of volatile compounds of the same truffle species varied quantitatively within the collection sites, as observed for the different harvesting areas of T. borchii and T. mesentericum. These findings suggest that environmental factors could be crucial in affecting the VOC profile of the truffle, although the species remains the main determinant.
Our results are a first step to pave the way for further works that employ the electronic nose as a rapid, solvent-free, and reliable method to authenticate different truffle harvesting areas, by combining the E-nose with GC/MS to identify and quantify the volatile organic compounds responsible for these differences. Therefore, the relationship between E-nose responses and the amount of specific volatile compounds, as well as the environmental and microbial factors that influence them, would require further investigation.
Author Contributions
Conceptualisation, E.D.F., M.C. and L.B.; methodology, A.G., E.D.F. and L.B.; formal analysis, A.B.; investigation, A.B.; resources, A.G. and R.S.; data curation, A.B. and M.C.; writing—original draft preparation, A.B.; writing—review and editing, A.G., E.D.F. and R.S.; funding acquisition, E.D.F. and L.B.; visualisation, A.B.; supervision, A.G. All authors have read and agreed to the published version of the manuscript.
Funding
This research was funded by Assessorato all’Agricoltura, Regione Campania, Project “Research activity on aroma compounds of Campania truffles” entrusted to the Osservatorio Appennino Meridionale (CUP B45C22021070002).
Data Availability Statement
The data presented in this study are contained within the article. Raw data are available from the corresponding author upon reasonable request.
Acknowledgments
The authors would like to thank the truffle hunters of Campania for collecting the samples. We would also like to thank Flora Della Valle of the Assessorato all’Agricoltura, Regione Campania, and Mariagiovanna Riitano of the Osservatorio Appennino Meridionale, for their collaboration.
Conflicts of Interest
The authors declare that the research was conducted in the absence of any commercial or financial relationships that could be construed as a potential conflict of interest.
References
- Mello, A.; Murat, C.; Bonfante, P. Truffles: Much more than a prized and local fungal delicacy. FEMS Microbiol. Lett. 2006, 260, 1–8. [Google Scholar] [CrossRef] [PubMed]
- Mustafa, A.M.; Angeloni, S.; Nzekoue, F.K.; Abouelenein, D.; Sagratini, G.; Caprioli, G.; Torregiani, E. An Overview on Truffle Aroma and Main Volatile Compounds. Molecules 2020, 25, 5948. [Google Scholar] [CrossRef] [PubMed]
- Culleré, L.; Ferreira, V.; Chevret, B.; Venturini, M.E.; Sánchez-Gimeno, A.C.; Blanco, D. Characterisation of aroma active compounds in black truffles (Tuber melanosporum) and summer truffles (Tuber aestivum) by gas chromatography–olfactometry. Food Chem. 2010, 122, 300–306. [Google Scholar] [CrossRef]
- Splivallo, R.; Culleré, L. The smell of truffles: From aroma biosynthesis to product quality. In True Truffle (Tuber spp.) in the World: Soil Ecology, Systematics and Biochemistry; Zambonelli, A., Lotti, M., Murat, C., Eds.; Springer International Publishing: Cham, Switzerland, 2016; Volume 47, pp. 393–407. [Google Scholar] [CrossRef]
- March, R.E.; Richards, D.S.; Ryan, R.W. Volatile compounds from six species of truffle–head-space analysis and vapor analysis at high mass resolution. Int. J. Mass Spectrom. 2006, 249, 60–67. [Google Scholar] [CrossRef]
- Kiss, M.; Csóka, M.; Győrfi, J.; Korány, K. Comparison of the fragrance constituents of Tuber aestivum and Tuber brumale gathered in Hungary. J. Appl. Bot. Food. Qual. 2011, 84, 102–110. [Google Scholar]
- Splivallo, R.; Deveau, A.; Valdez, N.; Kirchhoff, N.; Frey-Klett, P.; Karlovsky, P. Bacteria associated with truffle-fruiting bodies contribute to truffle aroma. Environ. Microbiol. 2015, 17, 2647–2660. [Google Scholar] [CrossRef] [PubMed]
- Gioacchini, A.M.; Menotta, M.; Guescini, M.; Saltarelli, R.; Ceccaroli, P.; Amicucci, A.; Barbieri, E.; Giomaro, G.; Stocchi, V. Geographical traceability of Italian white truffle (Tuber magnatum Pico) by the analysis of volatile organic compounds. Rapid Commun. Mass Spectrom. 2008, 22, 3147–3153. [Google Scholar] [CrossRef] [PubMed]
- Li, Y.; Li, J.; Qiao, P.; Zhou, D.; Xing, Y.; Chen, J. Monitoring the volatile composition and change in different geographical regions and harvest time of Chinese truffle (Tuber indicum Cooke & Massee). Eur. Food Res. Technol. 2022, 248, 1663–1677. [Google Scholar] [CrossRef]
- Vita, F.; Taiti, C.; Pompeiano, A.; Bazihizina, N.; Lucarotti, V.; Mancuso, S.; Alpi, A. Volatile organic compounds in truffle (Tuber magnatum Pico): Comparison of samples from different regions of Italy and from different seasons. Sci. Rep. 2015, 5, 12629. [Google Scholar] [CrossRef]
- Strojnik, L.; Grebenc, T.; Ogrinc, N. Species and geographic variability in truffle aromas. Food Chem. Toxicol. 2020, 142, 111434. [Google Scholar] [CrossRef]
- Li, Y.; Xing, Y.M.; Murat, C.; Kohler, A.; Zhou, D.Y.; Yu, F.Q.; Chen, J. Transcriptome and metabolome analysis reveals stage-specific metabolite accumulation during maturity of Chinese black truffle Tuber indicum. Plant Physiol. Biochem. 2023, 205, 108158. [Google Scholar] [CrossRef]
- Zhang, B.; Zhang, X.; Yan, L.; Kang, Z.; Tan, H.; Jia, D.; Yang, L.; Ye, L.; Li, X. Different maturities drive proteomic and metabolomic changes in Chinese black truffle. Food Chem. 2021, 342, 128233. [Google Scholar] [CrossRef] [PubMed]
- Dıaz, P.; Ibáñez, E.; Senorans, F.; Reglero, G. Truffle aroma characterization by headspace solid-phase microextraction. J. Chromatog. A 2003, 1017, 207–214. [Google Scholar] [CrossRef] [PubMed]
- Niimi, J.; Deveau, A.; Splivallo, R. Geographical-based variations in white truffle Tuber magnatum aroma is explained by quantitative differences in key volatile compounds. New Phytol. 2021, 230, 1623–1638. [Google Scholar] [CrossRef] [PubMed]
- Bellesia, F.; Pinetti, A.; Tirillini, B.; Bianchi, A. Temperature-dependent evolution of volatile organic compounds in Tuber borchii from Italy. Flavour Fragr. J. 2001, 16, 1–6. [Google Scholar] [CrossRef]
- Culleré, L.; Ferreira, V.; Venturini, M.E.; Marco, P.; Blanco, D. Chemical and sensory effects of the freezing process on the aroma profile of black truffles (Tuber melanosporum). Food Chem. 2013, 136, 518–525. [Google Scholar] [CrossRef] [PubMed]
- Wei, G.; Dan, M.; Zhao, G.; Wang, D. Recent advances in chromatography-mass spectrometry and electronic nose technology in food flavor analysis and detection. Food Chem. 2023, 405, 134814. [Google Scholar] [CrossRef] [PubMed]
- Yakubu, H.G.; Kovacs, Z.; Toth, T.; Bazar, G. Trends in artificial aroma sensing by means of electronic nose technologies to advance dairy production–a review. Crit. Rev. Food Sci. Nutr. 2022, 63, 234–248. [Google Scholar] [CrossRef] [PubMed]
- Gliszczyńska-Świgło, A.; Chmielewski, J. Electronic nose as a tool for monitoring the authenticity of food. A review. Food Anal. Methods 2017, 10, 1800–1816. [Google Scholar] [CrossRef]
- Deshmukh, S.; Bandyopadhyay, R.; Bhattacharyya, N.; Pandey, R.; Jana, A. Application of electronic nose for industrial odors and gaseous emissions measurement and monitoring–an overview. Talanta 2015, 144, 329–340. [Google Scholar] [CrossRef]
- Pacioni, G.; Cerretani, L.; Procida, G.; Cichelli, A. Composition of commercial truffle flavored oils with GC–MS analysis and discrimination with an electronic nose. Food Chem. 2014, 146, 30–35. [Google Scholar] [CrossRef]
- Costa, R.; Fanali, C.; Pennazza, G.; Tedone, L.; Dugo, L.; Santonico, M.; Sciarrone, D.; Cacciola, F.; Cucchiarini, L.; Dachà, M. Screening of volatile compounds composition of white truffle during storage by GCxGC-(FID/MS) and gas sensor array analyses. LWT-Food Sci. Technol. 2015, 60, 905–913. [Google Scholar] [CrossRef]
- Balivo, A.; Cipolletta, S.; Tudisco, R.; Iommelli, P.; Sacchi, R.; Genovese, A. Electronic Nose Analysis to Detect Milk Obtained from Pasture-Raised Goats. Appl. Sci. 2023, 13, 861. [Google Scholar] [CrossRef]
- Schmidberger, P.C.; Schieberle, P. Characterization of the key aroma compounds in white Alba truffle (Tuber magnatum pico) and Burgundy truffle (Tuber uncinatum) by means of the sensomics approach. J. Agric. Food Chem. 2017, 65, 9287–9296. [Google Scholar] [CrossRef]
- Splivallo, R.; Bossi, S.; Maffei, M.; Bonfante, P. Discrimination of truffle fruiting body versus mycelial aromas by stir bar sorptive extraction. Phytochemistry 2007, 68, 2584–2598. [Google Scholar] [CrossRef] [PubMed]
- Czerny, M.; Brueckner, R.; Kirchhoff, E.; Schmitt, R.; Buettner, A. The Influence of Molecular Structure on Odor Qualities and Odor Detection Thresholds of Volatile Alkylated Phenols. Chem. Senses 2011, 36, 539–553. [Google Scholar] [CrossRef]
- Splivallo, R.; Ebeler, S.E. Sulfur volatiles of microbial origin are key contributors to human-sensed truffle aroma. Appl. Microbiol. Biotechnol. 2015, 99, 2583–2592. [Google Scholar] [CrossRef] [PubMed]
- Wang, S.; Marcone, M.F. The biochemistry and biological properties of the world’s most expensive underground edible mushroom: Truffles. Food Res. Int. 2011, 44, 2567–2581. [Google Scholar] [CrossRef]
- Bertault, G.; Raymond, M.; Berthomieu, A.; Callot, G.; Fernandez, D. Trifling variation in truffles. Nature 1998, 394, 734. [Google Scholar] [CrossRef]
- Lu, B.; Perez-Moreno, J.; Zhang, F.; Rinaldi, A.C.; Yu, F. Aroma profile of two commercial truffle species from Yunnan and Sichuan, China: Inter-and intraspecific variability and shared key compounds. Food Sci. Hum. Wellness 2021, 10, 163–173. [Google Scholar] [CrossRef]

Disclaimer/Publisher’s Note: The statements, opinions and data contained in all publications are solely those of the individual author(s) and contributor(s) and not of MDPI and/or the editor(s). MDPI and/or the editor(s) disclaim responsibility for any injury to people or property resulting from any ideas, methods, instructions or products referred to in the content. |
© 2024 by the authors. Licensee MDPI, Basel, Switzerland. This article is an open access article distributed under the terms and conditions of the Creative Commons Attribution (CC BY) license (https://creativecommons.org/licenses/by/4.0/).