Abstract
Floral scent is an essential and genetically complex trait in herbaceous peonies (Paeonia lactiflora Pall.); however, specific genes related to metabolic and regulatory networks remain scantily studied. Our study integrated metabolite profiling and RNA-sequencing to screen floral scent biosynthetic genes. Hence, the major molecules identified by headspace collection combined with cultivar-specific GC-MS analysis were geraniol, β-caryophyllene, 2-phenylethanol (2-PE), citronellol, and 1,8-cineole. Genes related to terpenoids and 2-PE biosynthesis were identified after the assembly and annotation of the P. lactiflora transcriptomes. Eight angiosperm-specific terpene synthases (TPSs) from the TPS-a and TPS-b clades, as well as enzymes linked to 2-PE synthesis such as aromatic amino acid decarboxylase (AADC), phenylacetaldehyde reductase (PAR), and geranial reductase (GER) were identified. The biochemical analysis of the enzymes encoded by PlPAR1 and PlGER1 generated 2-PE from phenylacetaldehyde (PAld). The pairwise alignment of AADC1 reveals a splice variant lacking a 124 bp fragment, thus highlighting the possible role of alternative splicing in modulating floral scent composition. This study offers insights into the molecular-level biosynthesis of terpenoids and 2-PE in Peonia taxa, and provides the basis for the functional characterization, breeding, and bioengineering of prospective candidate genes for the production of floral volatiles in the Paeonia genus.
1. Introduction
Terpenoids, phenylpropanoids/benzenoids, and fatty acid derivatives originate from divergent biosynthetic routes, and they largely constitute the floral scent of ornamental plants [1]. As the leading class of floral volatile compounds, terpenoids are derived from isopentenyl diphosphate (IPP) and dimethylallyl diphosphate (DMAPP), which are two common and interchangeable precursors [2]. Studies have shown that the two precursors are synthesized by the plastidic 2-C-methyl-D-erythritol-4-phosphate (MEP) and the cytosolic mevalonate (MVA) pathways. In both routes, the IPP and DMAPP syntheses are catalyzed by prenyltransferases to prenyl diphosphates such as geranyl diphosphate (GPP, C10), neryl diphosphate (NPP, C10), trans/cis-farnesyl diphosphate (FPP, C15), and geranylgeranyl diphosphate (GGPP C20), among others [3]. The molecules are transformed into different terpene classes by variable-sized terpene synthases (TPSs) [4,5]. For example, the TPSs catalytically convert GPP, FPP, and GGPP into monoterpenes (C10), sesquiterpenes (C15) and diterpenes (C20), respectively. Terpenoids are the most leading set of structurally and functionally diverse blends occurring in nearly all lifeforms [6,7]. They are involved in plant fitness [8], multi-trophic interactions [9], and industrial applications [10]. Among terpenoids, rhodinol, largely made of geraniol and citronellol, is widely known as “liquid gold”. Traditionally extracted from roses, this “liquid gold” maintains a substantial market share and remains in high demand.
Benzenoids/phenylpropanoids are the second most abundant family of plant volatile compounds [11]. Benzenoids/phenylpropanoids are exclusively derived from the aromatic amino acid phenylalanine (L-Phe), which is synthesized via either shikimate or arogenate plastidial pathways [12], a seven- and a three-multistep enzymatic process [1]. Phenylalanine ammonialyase (PAL) catalyzes L-Phe into cinnamic acid and represents the first committed step in benzenoid (C6-C1) and phenylpropene (C6-C3) biosynthesis [13]. In contrast to benzenoids and phenylpropenes, different routes for the biosynthesis of volatile phenylpropanoid-related (C6-C2) compounds, such as phenylacetaldehyde (PAld) and 2-phenylethanol (2-PE), exist. In plants, 2-PE is synthesized in two major steps: the conversion of L-Phe into PAld followed by the subsequent conversion of PAld into 2-PE. There are at least four routes responsible for PAld biosynthesis in plants. As a recap, pyridoxal-5′-phosphate-dependent aromatic amino acid decarboxylase (AADC) or phenylacetaldehyde synthase (PAAS) converts L-Phe to PAld in roses and petunias [14]. Interestingly, an alternative pathway involving enzymes named aromatic amino acid aminotransferase (AAAT), which converts L-Phe into phenylpyruvate (PPA), and phenylpyruvic aciddecarboxylase (PPDC), converting PPA into PAld, has also been characterized in roses [15]. But this pathway seems to be season-specific and induced by high temperature in summer [16]. In tomato (Solanum lycopersicum), AADC has also been reported to convert L-Phe into 2-phenylethylamine which can be further catalyzed into PAld by an amino oxidase [17]. Recently, a cytochrome P450 family 79D protein CYP79D73 has been identified to catalyze the formation of (E/Z)-phenylacetaldoxime (PAOx), an intermediate in the biosynthesis of 2-PE in Plumeria (Plumeria rubra) [18]. While a handful of genes and pathways have been pinpointed for the initial step from L-Phe to PAld, the conversion of PAld to 2-PE in plants is currently attributed solely to the short-chain reductase (SDR) phenylacetaldehyde reductase (PAR) [19]. In addition, fatty acid derivatives derived from the degradation of long carbon chains of lipids are mainly responsible for the herbaceous notes in the fragrance of flowers. For example, Z-3-hexenol confers certain rose varieties the characteristic smell of freshly cut grass [20]. However, the accurate biosynthesis pathway of fatty acid derivatives remains largely unresolved. The volatile organic compounds (VOCs) mentioned above largely contribute to the complexity of floral scent in many plant varieties [21]. The diversity of these VOCs can be further expanded through modifications of primary scent precursors. For example, the fatty acids can also be ligated with alcohols from either terpenoids or benzenoids/phenylpropanoids to form esters such as geranyl isovalerate, citronellol acetate, linalyl formate, and phenethyl acetate [5]. Moreover, methyltransferases, acetyltransferases, and reductases are among the most common modification enzymes that modifying the primary VOCs [22,23,24].
Thirty-two well-known species of Paeonia have been identified and assigned to three sections: Moutan, Paeonia, and Onaepia [25]. Herbaceous peonies have a long cultivation history, and symbolize wealth and honor in Chinese culture [26]. Species within these sections are varied in morphology and ploidy level [27,28]. Crucially, Paeonia has the largest number of exclusively herbaceous species and the widest distribution in the Mediterranean and Eastern Asiatic regions [25]. Germplasm resources of Paeonia species and cultivars, their breeding strategy, and recent progress in the isolation and functional characterization of structural and regulatory genes were recently summarized [29]. Paeonia lactiflora Pall. is a perennial ornamental plant with a striking anemone form and exceptional floral scent cultivated for landscaping and for cut flowers; it is also regarded as a valuable germplasm resource [30]. However, despite extensive research on the structural diversity and related biosynthetic genes in a variety of plants [31,32,33,34], the bulk of volatile terpenoid and phenylpropanoid-related metabolic networks in Paeonia remains unexplored. RNA sequencing technologies have evolved into reliable and commonly used, massively parallel sequencing means for the study of molecular insights linked to various phenotypic traits without a reference genome [35,36]. RNA-Seq has been used to screen genes related to scent biosynthesis in plant such as Clivia miniata [37], Freesia hybrida [31,38], Aquilegia [33] and Paeonia species [39,40]. Similarly, our study aimed to understand the biochemical and molecular networks that may contribute to the biosynthesis of the main VOCs in peony by integrating metabolome analysis and transcriptome sequencing. Gene identification and the assessment of their expression patterns and structure variations form a platform for further clarification of the floral scent formation in Paeonia taxa.
2. Results
2.1. Cultivar-Specific Volatile Profiles Unveil the Intricate Levels and Blends of Floral Scent in Herbaceous Peony
Headspace solid-phase microextraction (HS-SPME) in conjunction with gas chromatography–mass spectrometry (GC-MS) analysis identified 95 volatile organic compounds (VOCs) in twenty-four whole flowers from herbaceous peony (Figure 1A, Table S1). After filtering with the criterion that the relative percentage of one component should be no less than 1% in at least 1 of these 24 cultivars, 53 VOCs were divided into different groups (Figure 1B). Notably, terpenoids such as 1,8-cineole, citronellol, geraniol, and β-caryophyllene, as well as phenylpropanoid-related compound 2-PE were dominant VOCs detected in most peony flowers. Although phenolic methyl ethers, such as 1,4-dimethoxybenzene, contain a benzene skeleton, they are not derived from aromatic amino acids. Instead, they belong to a specific chemical class that contributes to the scent of certain plant varieties. Moreover, R-(−)-3-hydroxy-β-ionone, a derivative of carotenoids, was grouped together with 1,4-dimethoxybenzene as other VOCs (Figure 1B). Esters formed by terpenoids and fatty acids were tentatively grouped as fatty acid derivatives. Interestingly, the relative contents of the VOCs varied significantly among different peony cultivars. For example, most cultivars’ flowers exhibited notably high levels of 2-PE. However, 2-PE was not detected in P. lactiflora cv. Zifengyu, P. lactiflora cv. Zhongshengfen, P. lactiflora cv. Fenfurong, or P. lactiflora cv. Saifugui flowers. Citronellol was dominantly present in P. lactiflora cv. Jarcoma, P. lactiflora cv. Heixiuqiu, and P. lactiflora cv. Zifengyu, while β-caryophyllene was highly detected in P. lactiflora cv. Fenchijinyu and P. lactiflora cv. Fenfurong flowers.
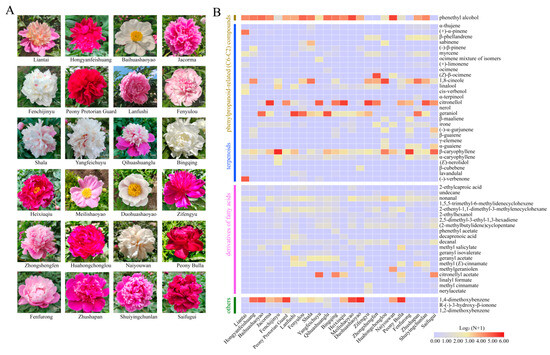
Figure 1.
Floral VOC emission profiles in herbaceous peony. (A) Peony cultivar flowers. The twenty-four cultivar flowers were used to examine volatile emission profiles. (B) The contents of floral VOCs released from different herbaceous peony cultivars. Specific relative contents are provided in Table S1.
To determine the dominant and divergent scent compounds, the floral volatiles were subjected to principal component analysis (PCA). In detail, 2-PE, 1,4-dimethedoxybenzene, citronellol, geraniol, β-caryophyllene, and 1,8-cineole were identified as the most dominant floral VOCs conferring the aroma diversity to herbaceous peony (Figure 2A). As noted in previous studies [40], terpenoids appear as leading compounds, followed by volatile phenylpropanoid-related (C6–C2) compounds, fatty acid derivatives, and other compounds in peony plants (Figure 2B). For instance, terpenoids were highly observed in P. lactiflora cv. Liantai, P. lactiflora cv. Jacorma, P. lactiflora cv. Fenchijinyu, P. lactiflora cv. Lanfushi, P. lactiflora cv. Fenyulou, P. lactiflora cv. Shala, P. lactiflora cv. Yangfeichuyu, P. lactiflora cv. Qihuashuanglu, P. lactiflora cv. Bingqing, P. lactiflora cv. Heixiuqiu, P. lactiflora cv. Zifengyu, P. lactiflora cv. Zhongshengfen, P. lactiflora cv. Huahongchonglou, P. lactiflora cv. Fenfurong, P. lactiflora cv. Zhushapan, P. lactiflora cv. Shuiyingchunlan, and P. lactiflora cv. Saifugui. Comparatively, phenylpropanoid-related (C6–C2) compounds were dominantly identified in P. lactiflora cv. Baihuashaoyao, P. lactiflora cv. Meilishaoyao, and P. lactiflora cv. Naiyouwan. Generally, fatty acid derivatives were found in all peony cultivars under this study, albeit at relatively lower levels compared to other VOCs. In summary, the volatile analysis of twenty-four cultivar flowers showed distinct variations in contents and the complexity of scent blends in Paeonia taxa.
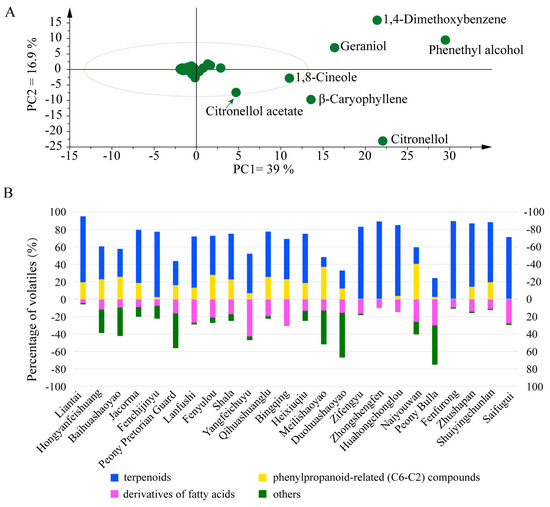
Figure 2.
PCA and VOC comparison among the twenty-four herbaceous peony cultivars. (A) PCA of floral volatiles. The values 39% (x-axis) and 16.9% (y-axis) indicate the contribution rate. (B) The contents of benzenoids/phenylpropanoids, terpenoids, and fatty acid derivatives. The relative quantities are represented in parentages (%).
2.2. VOC Emission Profiles Vary across Different Flowering Stages in P. lactiflora cv. Zifengyu
Floral volatiles are restricted to specific flower organs/tissues and vary in emission levels across different flowering stages. In this study, the budding, half-, and fully open flower developmental stages of P. lactiflora cv. Zifengyu were used to assess the VOC emission profiles, due to its widespread cultivation, economic significance, dominance in the garden, and unique floral VOC composition, particularly its abundance of geraniol and citronellol but absence of 2-phenylethanol (Figure 3A). Twenty-two quantifiable volatile terpenoids were identified across the three flowering phases (Figure 3B; Table S2), confirming the prevailing terpenoids among all the floral VOCs of P. lactiflora cv. Zifengyu. Moreover, P. lactiflora cv. Zifengyu produced more monoterpenes than sesquiterpenes, implying an unbalanced metabolic flux between MEP and MVA pathways. In detail, at the budding stage, the floral scent profile predominantly included fatty acid derivatives such as hexenyl acetate, monoterpenes (+)-limonene and 1,8-cineole, and sesquiterpenes α-/β-caryophyllene. Citronellol, (Z)-β-ocimene, and β-caryophyllene were prevailing terpenoids at the half-open flowering stage. Citronellol, (Z)-β-ocimene, geraniol, 1,8-cineole, and α-/β-caryophyllene were abundantly detected in fully opened flowers. Generally, these findings suggest dynamic variations in the composition and abundance of VOCs across distinct flowering phases of peony flowers, shedding light on the intricate pathways underlying floral scent synthesis and regulatory web in Paeonia taxa.
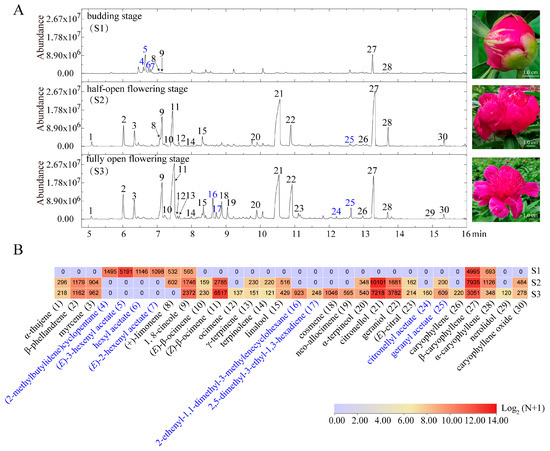
Figure 3.
Volatile emission patterns during three flowering stages of P. lactiflora cv. Zifengyu. (A) Mass spectra of VOCs. Numbers above the peaks represented different VOCs marked in subfigure (B). (B) Relative contents of the VOCs from budding, half-open, and fully open flowering stages. The terpenoids (black) and fatty acid derivative acids (blue) represented differently.
2.3. Transcriptomes Sequencing, Assembly, and Annotation
In order to decipher the metabolic genes or mechanism underlying VOC biosynthesis, we have combined the next-generation and third-generation sequencing techniques to get full-length transcripts of peony. Hence, the P. lactiflora cv. Zifengyu flowers at the budding, half-, and fully open flowering stages were chosen to construct nine cDNA libraries (three replicates for each stage) for Illumina sequencing. After the assembly of transcriptomes from three flowering stages, 34.32 Gb of clean data was obtained. Within this dataset, a total of 311,155 unigenes were identified, averaging about 133.99 million reads (Table 1). Among these unigenes, 26,724 were characterized by a length greater than 1 kb, suggesting a substantial portion of the transcriptome containing longer sequences. Moreover, the quality of the data was assessed, revealing a Q30 score of 93.89%, indicating high accuracy in base calling and sequencing reliability. Overall, the annotated genes generated from Illumina RNA sequencing were 44,307 (Table 1).

Table 1.
Illumina sequence clean data from P. lactiflora floral sample.
Furthermore, samples from the three flowering stages were individually analyzed (Table 2). After the transcriptome assembly of the budding stage sample, 134.3 million clean reads from 179.95 million total raw reads were obtained, with Q20 and Q30 scores of 97.91% and 93.41%, respectively. From the half-open flowering stage, 133.09 million clean reads from 165.95 million total raw reads were generated, with Q20 and Q30 scores of 97.88% and 92.69%, respectively. Similarly, from the fully open floral sample, 134.59 million clean reads from 197.485 million total raw reads were obtained, with Q20 and Q30 scores of 98.23% and 93.61%, respectively. Notably, the clean read ratio was computed by dividing filtered reads with the total number of total reads obtained by sequencing. Overall, the clean read ratio, representing the proportion of high-quality sequencing reads, was found to be 79.63%, 80.79%, and 70.53% for the budding stage, half-open, and fully open flowering samples, respectively (Table 2).
Table 2.
Illumina sequence data analysis of the three flowering stages.
The full-length transcriptome analysis of the P. lactiflora cv. Zifengyu pooled sample from three flowering stages was performed using single-molecule real-time (SMRT) sequencing on the PacBio Sequel platform (Table 3). After assembly, 1,799,987 total polymerase reads and 37,444,331 subreads were obtained. The 1,625,074 ROIs (total reads of inserts) were classified into 4,064,073 FLNC (full-length non-chimeric) which had the 5′ and 3′ barcoded primers and the poly (A) tail. After error correction and combining library clusters, redundancy was removed, and these processes yielded 3,884,048 isoforms with an average sequence length of 1099 bp and a mean quality of 0.99. Notably, after redundancy, 493,042 final isoforms were obtained, with a total length of 610,095,296, a characteristic minimum and maximum length of 200 and 30,833, and an N50 and sequence GC content of 1618 and 41.62%, respectively. To predict the coding regions, the SwissProt database was then subjected to BLAST and Hmmscan algorithms to search for matches to Pfam domains. After this process, 295,835 coding DNA sequences (CDSs) were obtained (Table 3). Subsequently, the quality of assembled transcripts and annotation completeness were assessed by benchmarking the universal single-copy orthologous (BUSCO) database (Figure S1). Given that longer full-length reads can provide useful insights into the complexity and structure of the transcriptome in plants, their lengths were also assessed (Figure 4A). In summary, the functional categorization of the transcriptome was performed by analyzing the BLAST results against the Kyoto Encyclopedia of Genes and Genomes (KEGG) in order to provide insights into metabolic pathways representing molecular interaction and reaction networks in P. lactiflora flowers (Figure 4B). Moreover, the annotated isoforms from the P. lactiflora transcriptome matched plant species such as Vitis vinifera (9%), Nyssa sinensis (9%), Vitis riparia (6%), Tetracentron sinensis (4%), and others (72%) (Figure 4C). In essence, the assessment of transcriptome integrity and annotated results revealed a high-quality assembly and the aptness of the database for further analysis.
Table 3.
The SMRT sequencing data analysis.
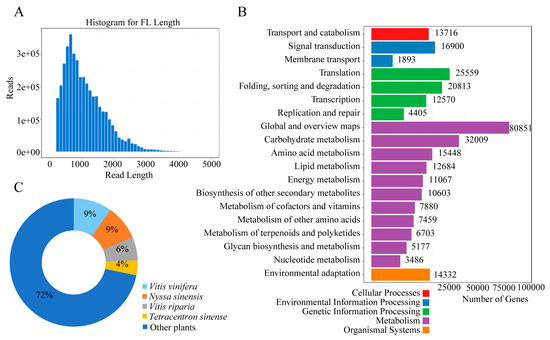
Figure 4.
Summary of transcriptome analysis of P. lactiflora cv. Zifengyu. (A) Quality parameter of full-length reads. (B) Species distribution. The chart shows the annotated isoforms that compare P. lactiflora with other plant species. The highest matched species were Vitis vinifera and Nyssa sinensis, accounting for 9% of the total unigenes, Vitis riparia (6%), Tetracentron sinensis (4%), and others (72%). (C) Unigene classification showing KEGG assignment.
2.4. Screening of Candidate Genes Related to Terpenoid Biosynthetic Pathways
The biosynthesis of terpenoids in plants is mainly from acetyl-CoA via the MVA pathway and glyceraldehye phosphate and pyruvate via the MEP pathway. In such pathways, IPP and different terpenoids are synthesized through a series of catalytic reactions. By integrating homology-based BLAST and phylogenetic analysis, isoforms involved in the terpenoid metabolic pathway were screened from the transcriptome database of P. lactiflora cv. Zifengyu (Figure 5A). To note, two acetyl-CoA acetyltransferases (AACTs), two hydroxymethylglutaryl-CoA synthases (HMGSs), two hydroxymethylglutaryl-CoA reductases (HMGRs), mevalonate kinase (MVK), phosphomevalonate kinase (PMK), two mevalonate diphosphate decarboxylases (MVDs), isopentenyl-diphosphate δ-isomerase (IDI), and two farnesyl diphosphate synthases (FPPSs) were annotated into the upstream of MVA pathway. The 1-deoxy-D-xylulose-5-phosphate synthase (DXS), 1-deoxyxylulose-5-phosphate reductoisomerase (DXR), 2-C-methyl-D-erythritol 4-phosphate cytidylyl-transferase (MCT), 4-diphosphocytidyl-2-C-methyl-D-erythritol kinase (CMK), 2-C-methylerythritol-2,4-diphosphate synthase (MDS), 4-hydroxy-3-methylbut-2-en-1-yl diphosphate synthase (HDS), hydroxymethylbutenyl diphosphate reductase (HDR), and geranyl diphosphate synthase (GPPS) were annotated into the upstream of the MEP pathway. ACCT1, HMGS1, HMGR1/2, and IDI were highly expressed across the three flowering stages, signifying their input to sesquiterpene backbone biosynthesis in herbaceous peonies. Similarly, DXS, DXR, MDS, HDS, and HDR were highly expressed across the three flowering stages, indicating their contribution to monoterpene backbone biosynthesis in peonies. Notably, MEP and MVA pathway genes exhibited comparable expression levels. However, the expression level of GPPS was relatively higher than FPPS, which may be associated with a higher production of monoterpenes than sesquiterpenes. Generally, these findings provided insights into specific pathway enzymes that are associated with the intricate mechanisms underpinning terpenoid synthesis in herbaceous peony at different flowering stages.
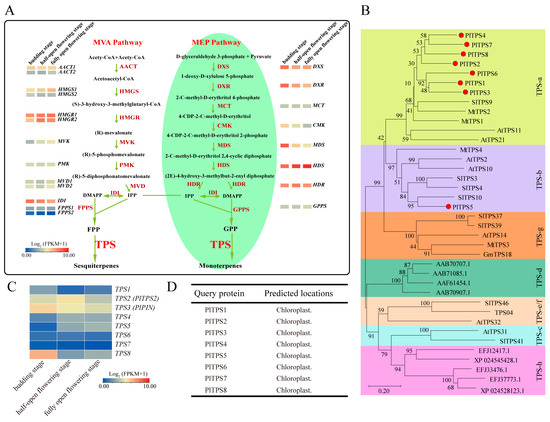
Figure 5.
Screening of candidate genes related to terpenoid biosynthetic pathways. (A) The expression profiles of putative genes encoding enzymes involved in terpene backbone biosynthesis. Full names of the MVA and MEP pathway enzymes appear in the main text. (B) Phylogenic relationship between TPS proteins from Peonia and other plants. Bootstrap values are shown as a percentage of 1000 replicates. The PlTPS proteins in this study are highlighted (red). The TPS-clades are highlighted in different color patterns. Accession numbers are given in Table S3. (C) Relative expression level of PlTPS at different flowering stages. Data were obtained from FPKM values of RNA-seq. (D) Subcellular localization. The PlTPS proteins were predicted to be localized in the chloroplasts.
A total of eight TPS genes were obtained from the transcriptome database of P. lactiflora cv. Zifengyu, among which TPS2 and TPS3 have been identified before [41,42]. The phylogenetic analysis of PlTPSs with proteins from other plants (Table S3) showed that TPS1, TPS2, TPS4, TPS6, TPS7, and TPS8 fall into angiosperm-specific TPS-a while TPS3 and TPS5 into TPS-b clades (Figure 5B). Amino acid sequence alignment displayed salient TPS features such as the presence of R(R,P,K)(X)8W, DDXX(D/E), and (N,D)DXX(S,T,G) XXXE (NSE/DTE) motifs involved in catalysis (Figure S2). Even so, they are solely required for their catalytic features, and the diversity of TPS enzyme-mediated products in plants cannot be entirely accounted for by these conserved motifs. Transcriptome analysis showed that TPS2, TPS3, and TPS8 had higher expression levels than their homologs, suggesting their more dominant roles in catalyzing terpenoid formation (Figure 5C). Subcellular localization prediction analysis revealed that all eight TPSs were supposed to localize into chloroplasts, suggesting their possible roles in converting GPP into monoterpenes (Figure 5D). Nevertheless, comprehensive functional characterizations of these TPSs are still required to completely elucidate their roles in terpenoid biosynthesis. Overall, these findings offer details on the diversity, evolution, and expression patterns of terpenoid metabolic genes in Paeonia genus, enabling us to investigate their functions in terpene biosynthesis in the future.
2.5. Screening of Candidate Genes Related to 2-PE Biosynthetic Pathway
Previously, enzymes associated with the 2-PE biosynthetic pathway were characterized (Figure 6A). To further investigate the 2-PE pathway in peony and elucidate the genetic limitations underlying 2-PE biosynthesis in P. lactiflora cv. Zifengyu, the homology-based BLAST and phylogenetic analysis approach were employed to mine 2-PE pathway genes from the transcriptome database of P. lactiflora cv. Zifengyu. Consequently, four candidate AADCs, one candidate CYP79D, and nine candidate PARs or closely related GERs (geranial reductases) were identified (Figure 6B). Their transcripts during flower developmental stages were assessed using FPKM values from the transcriptome database, suggesting that the homologs may function differently in P. lactiflora cv. Zifengyu (Figure 6C). As illustrated, there are at least four pathways for PAld biosynthesis in plants, whereas PAR is the only characterized enzyme responsible for PAld conversion into 2-PE (Figure 6A). To investigate the genetic mechanism underlying 2-PE deficiency in P. lactiflora cv. Zifengyu, the highly expressed PAR and GER genes, subsequently designated as PlPAR1, PlPAR2, and PlGER1, were cloned and functionally characterized via in vitro enzymatic assays. Consequently, both PlPAR1 and PlGER1 efficiently converted PAld into 2-PE, albeit with traces of PAld, while no 2-PE was detected in reactions catalyzed by PlPAR2 (Figure 6D). The results suggest that the absence of PAld, rather than the inactivation of enzymes catalyzing PAld transformation, blocks 2-PE biosynthesis in P. lactiflora cv. Zifengyu.
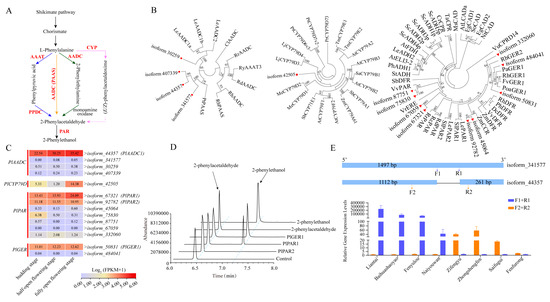
Figure 6.
Analysis of candidate genes related to 2-PE biosynthetic pathway. (A) Hypothetical biosynthetic routes for 2-PE. (B) Phylogenic analysis of 2-PE biosynthetic genes. Genes with red symbols indicated those from P. lactiflora cv. Zifengyu. (C) Transcript levels of 2-PE biosynthetic genes. PlAADC1 PlCYP79D, PlPAR, and PlGER1/2 transcript levels were high. (D) In vitro assay of PlPAR1/2 and PlGER1. Conversion of PAld into 2-PE by recombinant PlGER1 and PlPAR1/2. The control assay was carried out in the absence of enzymes. (E) Sequence alignment and expression analysis of AADC genes. Alignment revealed a splice variant lacking a 124 bp fragment. Expression analysis was performed with RT-qPCR.
To further validate this hypothesis, we tentatively cloned the highly expressed PlAADC1 candidate from P. lactiflora cv. Zifengyu without 2-PE, as well as from P. lactiflora cv. Liantai with a high amount of 2-PE. As expected, PlAADC1 from P. lactiflora cv. Zifengyu encoded an AADC protein with a C-terminal truncation compared to that from P. lactiflora cv. Liantai (Figure 6E), possibly resulting from the alternative splicing of the same gene (Figure S3). Despite the lack of robust evidence, we tentatively inferred that the truncated form of AADC might block PAld formation. Interestingly, the cloned PlAADC1 from P. lactiflora cv. Liantai shared the same sequence with isoform_341577 from P. lactiflora cv. Zifengyu, suggesting that different splicing transcripts co-existed and the ratio between the full-length and truncation transcripts might determine the final PAld content. As expected, the highly expressed AADC form in these two representative cultivars differed as depicted in Figure 6E using reverse transcription quantitative PCR (RT-qPCR). Consequently, the selective splicing of AADC and the relative abundance of differential transcripts might explain the difference in 2-PE content among peony cultivars, at least between P. lactiflora cv. Zifengyu and P. lactiflora cv. Liantai. However, further studies on the precise functions of these genes and their interactions within the biosynthetic pathway is crucial for deciphering the genetic mechanisms underlying 2-PE absence in specific peony cultivars.
3. Discussion
3.1. Terpenoids and 2-PE Represent the Primary Components of Peony, with Monoterpene Content Notably Surpassing That of Sesquiterpene
Scent is an incredibly complex element of floral phenotype, a chemical masterpiece with dynamic patterns of emission. Previous studies categorized floral scent as no/light fragrance, medium fragrance, and strong fragrance based on the sensory evaluation in herbaceous peony cultivars [40]. Similarly, based on the composition and contribution of main aroma chemicals, the scent can also be classified in various ways [43,44,45]. Specifically, high levels of 2-PE contribute to a characteristic sweet scent, whereas acyclic monoterpenes such as geraniol and citronellol provide a fragrance reminiscent of rose essential oil. Additionally, their corresponding aldehydes, geranial and citronellal, contribute sweet lemon-like notes to the aroma. Consistent with previous studies, our study demonstrates that the floral scent elements in peony predominantly comprise terpenoids such as citronellol, geraniol, β-caryophyllene, and 1,8-cineole, as well as benzenoids/phenylpropanoids like 2-PE, alongside a few fatty acid derivatives (Figure 1) [21,40,46].
Notably, despite the abundant release of volatiles by peony flowers, monoterpenes were observed as dominant compounds (Figure 1, Figure 2 and Figure 3). Several possibilities exist to elucidate this phenomenon. Firstly, although genes between the MVA and MEP pathways had comparable expression levels, GPPS, which is presumably localized in plastids, had many more transcripts than FPPS that usually localizes in the cytosol (Figure 5A), suggesting an unbalanced supply of GPP and FPP in peony cells. Moreover, recent studies have revealed a much more complicated biosynthesis mechanism of prenyl diphosphates. For example, there are also heterodimeric GPPS in plastids composed of GPPS.SSU (small subunit) and GGPPS.LSU (large subunit) [47]. However, the in planta function of PlGPPS and PlFPPS, and whether heterodimeric PlGPPS exists, require further investigation. Secondly, the subcellular localizations of PlTPSs may result in a biased production of monoterpenes. Eight PlTPSs were identified in the present study, seven of which belong to the TPS-a subfamily (Figure 5B). Although it is generally accepted that members of the subfamily usually function as sesquiterpene synthases in the cytosol, the availability of GPP or FPP substrate is also pivotal to the final terpene products, considering TPS promiscuity [31]. Subcellular location prediction analysis suggested that all eight PlTPSs are localized in the plastids, promoting the conversion of GPP into monoterpenes. However, the in vivo subcellular locations of these PlTPSs and their enzymatic activities towards GPP and FPP still require further characterization to fully elucidate the mechanism.
3.2. P. lactiflora cv. Zifengyu Is a Good Candidate for Extracting or Studying Rhodinol
Floral volatiles play a key role in the interaction of plants with other organisms [48]. As an example, 2-PE mediates both direct and indirect plant defenses, as well as attracting pollinators such as beetles, bees, and butterflies [49]. Terpenes such as β-caryophyllene play roles in mutualistic interactions, plant defense, and insect attraction [50,51,52]. Geraniol, an acyclic monoterpene, possesses anti-microbial, antifeedant, and insect repellant activities [53]. Moreover, phenylalanine-derived VOCs (such as 2-PE) and terpenoids (such as pinenes, carveol, camphor, menthol, and limonene) are active ingredients in essential oils, cosmetics, toiletries, and food additives [54]. Considering the high value of rhodinol, the prevalence of relatively pure geraniol and citronellol in certain peony cultivars such as P. lactiflora cv. Zifengyu, expands the availability of rhodinol resources (Figure 1).
Additionally, the biosynthesis of geraniol and citronellol has attracted significant attention. To date, geraniol biosynthesis has been characterized through at least two distinct pathways. Specifically, plastid-localized TPS, geraniol synthase (GES), directly converts GPP to geraniol in Citrus aurantium, Dendrobium officinale, and Ocimum basilicum [55,56]. Conversely, roses and pelargonium utilize a TPS-independent NUDX pathway for geraniol production [57,58,59]. It is widely acknowledged that citronellol originates from geraniol, catalyzed by a series of enzymes from diverse families [60,61,62,63,64]. However, the mechanisms underlying geraniol and citronellol biosynthesis in peonies remain elusive and require further characterization.
3.3. 2-PE Diversity in Peonies Might Result from AADC Splice Variants
Given its renowned elegant, delicate, and sturdy rose-like scent, 2-PE has been considered a typical floret-aroma compound, with several implicated biosynthetic pathways in plants [15,65]. These studies suggest that 2-PE biosynthesis is a complex and varied process in plants (Figure 6A). The investigation of 2-PE biosynthesis in P. lactiflora cv. Zifengyu offers us some new insights. Firstly, GER also participates in 2-PE synthesis, in addition to the well-known PAR (Figure 6D). Nevertheless, both of them belong to the SDR family. Secondly, although several pathways are reported for 2-PE biosynthesis in plants, the unique step of 2-PE conversion from PAld shared by different pathways is functional in peonies, at least in P. lactiflora cv. Zifengyu.
Considering the diverse pathways from L-Phe to PAld, elucidating the precise mechanism in peonies presents a challenge. However, homology-based BLAST and phylogenetic analysis revealed high similarities among AADC, PPDC, AAAT, and PAAS (Figure 6B). Subsequently, PlAADC1, with predominant transcripts, was selected and analyzed from different varieties. Intriguingly, the pairwise alignment of AADC1 in different cultivars revealed a splice variant lacking a 124 bp fragment, thus highlighting the potential role of alternative splicing in modulating floral scent composition. This notion is partially supported by comparing the expression ratio between full length and truncated AADC1 variants among different peony cultivars. However, confirming whether the truncated AADC1 has lost its function is a prerequisite for our hypothesis and warrants further scrutiny in subsequent studies.
As widely accepted, the modulation of floral scents involves intricate internal and external factors governing the fine-tuned emission of floral VOCs. Observations have indicated that peony VOCs vary spatially and temporally across different flowering stages (Figure 3) [66,67]. Also, floral scent diversity may be considered as an example of convergent evolution, with multiple pathways giving rise to analogous or matching products evolving independently across various plant taxa, possibly in response to different adaptive pressures or ecological niches [68]. For instance, in rose, the alternative pathway identified for 2-PE production could be triggered in response to seasonal temperature changes [16]. Moreover, recent studies demonstrate that seasonal changes, temperature, light, and circadian clock modulate the biosynthesis and emission of phenylpropanoids/benzenoids in petunias [16]. Similarly, selective forces may favor certain splice variants over others, altering plant phenotype and aiding in its adaptation and evolution in response to environmental challenges [69]. However, the mechanisms underlying the selection and regulation of alternative splicing remain an interesting question.
4. Conclusions
This study analyzed floral volatiles in herbaceous peonies, highlighting the intricate and diverse scent profiles characterized by a complex blend of terpenoids, phenylpropanoids, and fatty acid derivatives. By employing HS-SPME and GC-MS, 95 VOCs were identified, revealing significant variations across 24 peony cultivars, which indicates cultivar-specific scent profiles. Notably, terpenoids like citronellol, geraniol, and β-caryophyllene were predominant. Through transcriptome sequencing, genes involved in terpenoid and phenylpropanoid biosynthesis pathways were screened, with their expression patterns suggesting the potential mechanisms underlying the distinct scent profiles. Remarkably, enzymes encoded by the PlPAR1 and PlGER1 genes, which utilize PAld as substrate to generate 2-PE, were functionally characterized. Strikingly, the absence of 2-PE from certain cultivars, such as P. lactiflora cv. Zifengyu, was linked to the alternative splicing of AADC, suggesting that this mechanism may be a potential factor in scent diversity. These findings not only enhance the understanding of floral scent biosynthesis in peonies but also underscore the potential for targeted breeding and genetic modification to optimize and diversify floral aromas for horticultural and commercial applications.
5. Materials and Methods
5.1. Plant Materials and Growth Conditions
This study used 24 herbaceous peony cultivars for volatilome analysis. Specifically, the cultivars were taxonomically identified and collected from Changchun Peony Garden in Changchun, Jilin province (with GPS coordinates of 43°53′28.5432″ N and 125°19′52.8420″ E) in China. To examine the floral volatilized components, budding, half-open, and fully open flowering phases of Chinese herbaceous peony species’ cultivars were enclosed in a transparent gadget, specifically made of inorganic materials, and sampled. To determine the expression levels of genes, triplicate samples from the three flowering phases were collected for RNA extraction as described elsewhere [70].
5.2. Qualitative and Quantitative Analyses of Floral Volatiles in Herbaceous Peonies
Qualitative and quantitative analyses of floral volatiles followed the method described in our earlier studies [31,33,38]. In short, headspace SPME was used to collect VOCs from whole flowers and at different flowering stages (budding, half-open, and fully open flowering) for 2 h in ambient temperature using a 75-μm Divinylbenzene/Carboxen/Polydimethylsiloxane fiber absorbent (Sigma Aldrich, Munich, Germany). Total trapped volatile compounds were thermally desorbed and transferred to an Agilent 5975-6890N GC–MS apparatus (Agilent Technologies, Santa Clara, CA, USA) equipped with an HP-1MS fused-silica capillary column. The identification of individual terpene compounds was attained using spectral library matching with the NIST 2008 library, at a match factor of ≥85 and their retention indices (RIs) of known compounds and/or their retention indices (RIs) compared with values from the literature.
5.3. RNA Extraction
Total RNA extraction was carried out using OminiPlant RNA kit (CWBIO, Beijing, China) following the manufacturer’s protocol. The quality and concentration of the RNA were assessed using a Nano-500 micro-spectrophotometer (Allsheng Instruments, Hangzhou, China). The RNA sample was reverse-transcribed into cDNA using a UELris II RT-PCR system for First-strand cDNA Synthesis (with dsDNase) kit (US Everbright® Inc., Suzhou, China), which was used for gene cloning and expression assessment.
5.4. Library Construction, RNA Sequencing, and Data Processing
The enriched mRNA was fragmented into short fragments using a fragmentation buffer and reverse-transcribed into cDNA with random primers. Second-strand cDNA was synthesized using DNA polymerase I, RNase H, dNTP, and a buffer. The cDNA fragments were purified using the AMPure XP system (Beckman Coulter, Beverly, MA, USA), end-repaired, poly (A) added, and ligated to Illumina sequencing adapters. Agarose gel electrophoresis was used to a selected size of ligation products, PCR-amplified and sequenced using BGISEQ-500 sequencing technology.
After RNA sequencing, the quality control and filtering of the raw data were performed using FastQC (https://www.bioinformatics.babraham.ac.uk/projects/fastqc/). The removal of adapters or low-quality bases from the raw reads was carried out using in-house perl scripts. The clean reads were then assembled into unigenes based on the similarity between the overlapping regions using the Trinity algorithm with min_kmer_cov set to 2 by default and all other parameters set to default. At the same time, the Q20, Q30, and GC content and sequence duplication level of the clean data were calculated. Finally, the transcripts were clustered into unigenes and based on sequence homology, and were searched against public databases. The transcriptome obtained through Trinity splitting was used as the reference sequence (ref), and the clean reads of each sample were mapped on the ref. In this process, the high-quality clean reads were mapped to the full-length transcripts using RSEM v1.2.19 (Madison, WI, USA), and the gene abundances were calculated and normalized to reads per kb per million reads (RPKM). RNA differential expression analysis was performed using DESeq2 v1.0 software (https://github.io/DESeq2/v1).
The total RNA was first synthesized with a UMI base PCR cDNA Synthesis Kit (BGI) and the first strand of cDNA was amplified using PCR to synthesize the second strand of cDNA. Then, the double-stranded DNA, amplified using secondary PCR, was used for SMRTbell library construction and sequencing. Sequence data processing was performed using the SMRT Link v5.0.1 pipeline (Pacific Biosciences, Menlo Park, CA, USA). The SMRT analysis suite obtained reads of insert (ROI)), read classification (Classify), read clustering and correction (Cluster, Quvier), and, finally, high-quality full-length consistent sequences. Briefly, circular consensus sequence (CCS) reads were extracted from subread BAM files. Then, CCS reads were classified into full-length non-chimeric (FL), non-full-length (nFL), chimeras, and short reads based on cDNA primers and the polyA tail signal. Short reads were discarded. Subsequently, the full-length non-chimeric (FLNC) reads were clustered using iterative clustering for error correction (ICE algorithm). The non-full-length reads were used to polish the above-obtained cluster consensus isoforms using Quiver software v1.0 (https://github.com/lukeping/GenomicConsensus) to obtain the FL polished, high-quality consensus sequences (accuracy ≥ 99%). Then, the cd-hit-v4.6.7 software [71] was used to filter final transcriptome isoform sequences by removing the redundant sequences by setting a threshold of 0.99 identities. The Benchmarking Universal Single-Copy Orthologs (BUSCO) (busco.ezlab.org) measure, based on conserved genetics selected from OrthoDB, was used for the assessment of genome and transcriptome integrity. The high-quality full-length sequences of each library were combined for cluster de-redundancy and isoform expression quantification. Then, the transcripts were annotated with public databases. CDS prediction was performed on transcripts using TransDecoder v5.7.1 (Rosen Center for Advanced Computing, Perdue, IN, USA),, and analysis such as differential expression and functional annotation between samples was performed according to the expression quantification results.
5.5. Identification and Analysis of Putative Genes Linked to Floral Scent
Known genes from different plant species were used as queries in homology searches to identify the putative genes associated with floral scent biosynthesis. Genes encoding these enzymes were screened using a manual BLAST and HMMER search integrated in TBtools-II [72]. Sequence multiple alignment was carried out using DNAMAN8.0 software (Lynnon Corp., Quebec, QC, Canada) and the phylogenetic tree was constructed by MEGA v11.0 software [73] based on neighbor-joining tree using bootstrapping with 1000 replicates.
5.6. RT-qPCR Analysis
The relative expression of genes was analyzed using RT-qPCR (CFX96™ Real-Time PCR Detection System, BIO-RAD, Hercules, CA, USA). The cDNA samples were synthesized from 0.5~1 μg RNA using a PrimeScript® RT reagent Kit with gDNA Eraser (TaKaRa, Kusatsu, Japan). The primers were designed against the cDNA template. Briefly, a SYBR Green-based PCR assay was carried out in a total volume of 10 µL of reaction mixture containing 5 µLof TB Green® Premix Ex Taq (TaKaRa, Kusatsu, Japan), 0.5 μM of each primer, and 1 μL of cDNA. β-actin and PlUbi were used as internal controls, as previously described [31]. The amplification was performed at these conditions: 94 °C for 30 s, 40 cycles of 94 °C for 5 s, and 60 °C for 30 s. The Ct values were generated from the Bio-Rad CFX Manager V1.6.541.1028 software. The difference in relative expression levels was computed from the 2−ΔΔCt value after normalization [74]. All samples were repeated at least three times.
5.7. Molecular Cloning and Heterologous Expression of PAR and GER Genes
The primers for GER and PAR cloning are listed in Table S4. The isolated PCR products were purified using a gel extraction kit (CWBIO, Beijing, China), and then seamlessly cloned into His-tagged prokaryotic vector pET-32a with a Minerva Super Fusion Cloning Kit (US Everbright® Inc., Suzhou, China). The recombinant vectors were verified through sequencing. Bacterial expression from the pET-32a series vectors exclusively relied on BL21 cells (Coolaber, Beijing, China). The crude recombinant protein lysate was purified using a Ni-TED Sefinose column (Sangon Biotech Co., Ltd., Shanghai, China) and eluted with a two-column volume of elution buffer (50 mM Tris, pH 7.4, 0.5 M NaCl, 500 mM imidazole, and 0.5 mM DTT). After dialysis, the protein solution was concentrated and stored at 4 °C in storage buffer (20 mM Tri-HCl, pH 8.0, 25 mM NaCl, 0.5 mm DTT, and 10% glycerol). The purity of the recombinant protein was assessed using SDS-PAGE and densitometric analysis.
5.8. In Vitro Assay of PAR and GER from P. lactiflora
The PAR and GER enzymes were subjected to functional analysis, as previously described [75]. Briefly, a 300 µL reaction mix containing 100 mM potassium phosphate buffer (pH 7.0), 60 µg of recombinant enzyme, 20 mM PAld, 10% (v/v) glycerol, and 1 mM NADPH was prepared and then incubated at 30 °C for 2 h. The volatile products were adsorbed onto silica fiber and subsequently subjected to GC-MS analysis, as previously described [31].
Supplementary Materials
The following supporting information can be downloaded at: https://www.mdpi.com/article/10.3390/horticulturae10060617/s1, Figure S1. BUSCO analysis; Figure S2. Amino acid sequence alignment of putative PlTPSs; Figure S3. Sequence alignment of putative AADCs; Table S1. Composition of VOCs released from peony flowers; Table S2. Relative retention indices of diverse VOCs P. lactiflora cv. Zifengyu; Table S3. TPS proteins from other plant species used in phylogenetic analysis; Table S4. Primers used in the study.
Author Contributions
S.K.K., S.W., J.X., T.B., H.L. and A. performed the experiments and analyzed the data with the help of X.S., L.W. and Y.L. The manuscript was drafted by S.K.K. and revised by X.G., Y.L. and T.B. were involved in project administration, conceptualization, review and editing, and funding acquisition. All authors have read and agreed to the published version of the manuscript.
Funding
This work was supported by the National Natural Science Foundation of China (32272751), the Department of Science and Technology of Jilin Province (20220508112RC, 20210101005JC), and the China Postdoctoral Science Foundation (2023M740580). The funders had no role in the study design, data collection and analysis, decision to publish, or preparation of the manuscript.
Data Availability Statement
All the necessary data are presented in this study. Other data are available on reasonable request from the corresponding author due to the remaining unpublished data.
Conflicts of Interest
The authors declare that the research was conducted in the absence of any commercial or financial relationships that could be construed as a potential conflict of interest.
References
- Dudareva, N.; Klempien, A.; Muhlemann, J.K.; Kaplan, I. Biosynthesis, function and metabolic engineering of plant volatile organic compounds. New Phytol. 2013, 198, 16–32. [Google Scholar] [CrossRef] [PubMed]
- Tholl, D. Biosynthesis and biological functions of terpenoids in plants. Adv. Biochem. Eng. Biotechnol. 2015, 148, 63–106. [Google Scholar] [PubMed]
- Vranová, E.; Coman, D.; Gruissem, W. Network analysis of the MVA and MEP pathways for isoprenoid synthesis. Annu. Rev. Plant Biol. 2013, 64, 665–700. [Google Scholar] [CrossRef] [PubMed]
- Block, A.; Vaughan, M.; Schmelz, E.; Christensen, S. Biosynthesis and function of terpenoid defense compounds in maize (Zea mays). Planta 2019, 249, 21–30. [Google Scholar] [CrossRef] [PubMed]
- Daletos, G.; Katsimpouras, C.; Stephanopoulos, G. Novel strategies and platforms for industrial isoprenoid engineering. Trends Biotechnol. 2020, 38, 811–822. [Google Scholar] [CrossRef] [PubMed]
- Nagegowda, D.A.; Gupta, P. Advances in biosynthesis, regulation, and metabolic engineering of plant specialized terpenoids. Plant Sci. 2020, 294, 110457. [Google Scholar] [CrossRef] [PubMed]
- Tholl, D.; Rebholz, Z.; Morozov, A.V.; O’Maille, P.E. Terpene synthases and pathways in animals: Enzymology and structural evolution in the biosynthesis of volatile infochemicals. Nat. Prod. Rep. 2023, 40, 766–793. [Google Scholar] [CrossRef] [PubMed]
- Pichersky, E.; Raguso, R.A. Why do plants produce so many terpenoid compounds? New Phytol. 2018, 220, 692–702. [Google Scholar] [CrossRef] [PubMed]
- Dyer, L.A.; Jeffrey, C.S. Chemically Mediated Multi-trophic Interactions. In Plant-Animal Interactions: Source of Biodiversity; Springer: Berlin/Heidelberg, Germany, 2021; pp. 17–38. [Google Scholar]
- Tetali, S.D. Terpenes and isoprenoids: A wealth of compounds for global use. Planta 2019, 249, 1–8. [Google Scholar] [CrossRef]
- Muhlemann, J.K.; Klempien, A.; Dudareva, N. Floral volatiles: From biosynthesis to function. Plant Cell Environ. 2014, 37, 1936–1949. [Google Scholar] [CrossRef]
- Maeda, H.; Dudareva, N. The shikimate pathway and aromatic amino acid biosynthesis in plants. Annu. Rev. Plant Biol. 2012, 63, 73–105. [Google Scholar] [CrossRef] [PubMed]
- Wildermuth, M.C. Variations on a theme: Synthesis and modification of plant benzoic acids. Annu. Rev. Plant Biol. 2006, 9, 288–296. [Google Scholar] [CrossRef] [PubMed]
- Sakai, M.; Hirata, H.; Sayama, H.; Sekiguchi, K.; Itano, H.; Asai, T.; Dohra, H.; Hara, M.; Watanabe, N. Production of 2-phenylethanol in roses as the dominant floral scent compound from L-phenylalanine by two key enzymes, a PLP-dependent decarboxylase and a phenylacetaldehyde reductase. Biosci. Biotechnol. Biochem. 2007, 71, 2408–2419. [Google Scholar] [CrossRef] [PubMed]
- Hirata, H.; Ohnishi, T.; Watanabe, N. Biosynthesis of floral scent 2-phenylethanol in rose flowers. Biosci. Biotechnol. Biochem. 2016, 80, 1865–1873. [Google Scholar] [CrossRef] [PubMed]
- Hirata, H.; Ohnishi, T.; Tomida, K.; Ishida, H.; Kanda, M.; Sakai, M.; Yoshimura, J.; Suzuki, H.; Ishikawa, T.; Dohra, H. Seasonal induction of alternative principal pathway for rose flower scent. Sci. Rep. 2016, 6, 20234. [Google Scholar] [CrossRef] [PubMed]
- Tieman, D.; Taylor, M.; Schauer, N.; Fernie, A.R.; Hanson, A.D.; Klee, H.J. Tomato aromatic amino acid decarboxylases participate in synthesis of the flavor volatiles 2-phenylethanol and 2-phenylacetaldehyde. Proc. Natl. Acad. Sci. USA 2006, 103, 8287–8292. [Google Scholar] [CrossRef] [PubMed]
- Dhandapani, S.; Jin, J.; Sridhar, V.; Chua, N.-H.; Jang, I.-C. CYP79D73 participates in biosynthesis of floral scent compound 2-phenylethanol in Plumeria rubra. Plant Physiol. 2019, 180, 171–184. [Google Scholar] [CrossRef] [PubMed]
- Tieman, D.M.; Loucas, H.M.; Kim, J.Y.; Clark, D.G.; Klee, H.J. Tomato phenylacetaldehyde reductases catalyze the last step in the synthesis of the aroma volatile 2-phenylethanol. Phytochemistry 2007, 68, 2660–2669. [Google Scholar] [CrossRef]
- ul Hassan, M.N.; Zainal, Z.; Ismail, I. Green leaf volatiles: Biosynthesis, biological functions and their applications in biotechnology. Plant Biotechnol. J. 2015, 13, 727–739. [Google Scholar] [CrossRef]
- Zhang, Y.; Li, C.; Wang, S.; Yuan, M.; Li, B.; Niu, L.; Shi, Q. Transcriptome and volatile compounds profiling analyses provide insights into the molecular mechanism underlying the floral fragrance of tree peony. Ind. Crops Prod. 2021, 162, 113286. [Google Scholar] [CrossRef]
- Bathe, U.; Tissier, A. Cytochrome P450 enzymes: A driving force of plant diterpene diversity. Phytochemistry 2019, 161, 149–162. [Google Scholar] [CrossRef] [PubMed]
- Wang, S.; Alseekh, S.; Fernie, A.R.; Luo, J. The structure and function of major plant metabolite modifications. Mol. Plant 2019, 12, 899–919. [Google Scholar] [CrossRef] [PubMed]
- Boutanaev, A.; Moses, T.; Zi, J.; Nelson, D.; Mugford, S.; Peters, R.; Osbourn, A. Investigation of terpene diversification across multiple sequenced plant genomes. Proc. Natl. Acad. Sci. USA 2015, 112, E81–E88. [Google Scholar] [CrossRef] [PubMed]
- Christenhusz, M.; Byng, J. The number of known plants species in the world and its annual increase. Phytotaxa 2016, 261, 201–217. [Google Scholar] [CrossRef]
- Zhao, D.; Wei, M.; Shi, M.; Hao, Z.; Tao, J. Identification and comparative profiling of miRNAs in herbaceous peony (Paeonia lactiflora Pall.) with red/yellow bicoloured flowers. Sci. Rep. 2017, 7, 44926. [Google Scholar] [CrossRef] [PubMed]
- Hao, L.; Ma, H.; Teixeira da Silva, J.; Yu, X. Pollen morphology of herbaceous peonies (Paeonia lactiflora) with different ploidy levels. J. Am. Soc. Hort. Sci. 2016, 141, 275–284. [Google Scholar] [CrossRef]
- Yang, L.; Zhang, J.; da Silva, J.T.; Yu, X. Variation in ploidy and karyological diversity in different herbaceous peony cultivar groups. J. Am. Soc. Hortic. Sci. 2017, 142, 272–278. [Google Scholar] [CrossRef]
- Yang, Y.; Sun, M.; Li, S.; Chen, Q.; da Silva, J.A.T.; Wang, A.; Yu, X.; Wang, L. Germplasm resources and genetic breeding of Paeonia: A systematic review. Hortic. Res. 2020, 7, 107. [Google Scholar] [CrossRef]
- Ji, L.; Wang, Q.; da Silva, J.T.; Yu, X. The genetic diversity of Paeonia lactiflora. Sci. Hortic. 2012, 143, 62–74. [Google Scholar] [CrossRef]
- Bao, T.; Kimani, S.; Li, Y.; Li, H.; Yang, S.; Zhang, J.; Wang, Q.; Wang, Z.; Ning, G.; Wang, L. Allelic variation of terpene synthases drives terpene diversity in the wild species of the Freesia genus. Plant Physiol. 2023, 192, 2419–2435. [Google Scholar] [CrossRef]
- Jia, Q.; Köllner, T.G.; Gershenzon, J.; Chen, F. MTPSLs: New terpene synthases in nonseed plants. Trends Plant Sci. 2018, 23, 121–128. [Google Scholar] [CrossRef] [PubMed]
- Yang, S.; Wang, N.; Kimani, S.; Li, Y.; Bao, T.; Ning, G.; Li, L.; Liu, B.; Wang, L.; Gao, X. Characterization of terpene synthase variation in flowers of wild Aquilegia species from Northeastern Asia. Hortic. Res. 2022, 9, uhab020. [Google Scholar] [CrossRef] [PubMed]
- Li, Y.; Bao, T.; Zhang, J.; Li, H.; Shan, X.; Yan, H.; Kimani, S.; Zhang, L.; Gao, X. The coordinated interaction or regulation between floral pigments and volatile organic compounds. Hortic. Plant J. 2024. [Google Scholar] [CrossRef]
- Lv, S.; Cheng, S.; Wang, Z.; Li, S.; Jin, X.; Lan, L.; Yang, B.; Yu, K.; Ni, X.; Li, N. Draft genome of the famous ornamental plant Paeonia suffruticosa. Ecol. Evol. 2020, 10, 4518–4530. [Google Scholar] [CrossRef] [PubMed]
- Huang, M.; Fan, R.; Ye, X.; Lin, R.; Luo, Y.; Fang, N.; Zhong, H.; Chen, S. The transcriptome of flower development provides insight into floral scent formation in Freesia hybrida. Plant Growth Regul. 2018, 86, 93–104. [Google Scholar] [CrossRef]
- Li, Y.; Gao, R.; Zhang, J.; Wang, Y.; Kong, P.; Lu, K.; Adnan; Liu, M.; Ao, F.; Zhao, C.; et al. The biochemical and molecular investigation of flower color and scent sheds lights on further genetic modification of ornamental traits in Clivia miniate. Hortic. Res. 2022, 9. [Google Scholar] [CrossRef] [PubMed]
- Gao, F.; Liu, B.; Li, M.; Gao, X.; Fang, Q.; Liu, C.; Ding, H.; Wang, L.; Gao, X. Identification and characterization of terpene synthase genes accounting for volatile terpene emissions in flowers of Freesia × hybrida. J. Exp. Bot. 2018, 69, 4249–4265. [Google Scholar] [CrossRef] [PubMed]
- Song, C.; Wang, Q.; da Silva, J.A.T.; Yu, X. Identification of floral fragrances and analysis of fragrance patterns in herbaceous peony cultivars. J. Am. Soc. Hort. Sci. 2018, 143, 248–258. [Google Scholar] [CrossRef]
- Zhao, Q.; Gu, L.; Li, Y.; Zhi, H.; Luo, J.; Zhang, Y. Volatile composition and classification of Paeonia lactiflora flower aroma types and identification of the fragrance-related genes. Int. J. Mol. Sci. 2023, 24, 9410. [Google Scholar] [CrossRef]
- Ma, X.; Guo, J.; Ma, Y.; Jin, B.; Zhan, Z.; Yuan, Y.; Huang, L. Characterization of a monoterpene synthase from Paeonia lactiflora producing α-pinene as its single product. Biotechnol. Lett. 2016, 38, 1213–1219. [Google Scholar] [CrossRef]
- Li, S.; Zhang, L.; Sun, M.; Lv, M.; Yang, Y.; Xu, W.; Wang, L. Biogenesis of flavor-related linalool is diverged and genetically conserved in tree peony (Paeonia × suffruticosa). Hortic. Res. 2023, 10, uhac253. [Google Scholar] [CrossRef] [PubMed]
- Sheng, L.; Zeng, Y.; Wei, T.; Zhu, M.; Fang, X.; Yuan, X.; Luo, Y.; Feng, L. Cloning and functional verification of genes related to 2-phenylethanol biosynthesis in Rosa rugosa. Genes 2018, 9, 576. [Google Scholar] [CrossRef] [PubMed]
- Yasuyuki, H.; Miyako, I. Parfum of Rose; Nihon Kourido Publisher: Japan, 2009. [Google Scholar]
- Du, F.; Wang, T.; Fan, J.-M.; Liu, Z.-Z.; Zong, J.-X.; Fan, W.-X.; Han, Y.-H.; Grierson, D. Volatile composition and classification of Lilium flower aroma types and identification, polymorphisms, and alternative splicing of their monoterpene synthase genes. Hortic. Res. 2019, 6, 110. [Google Scholar] [CrossRef] [PubMed]
- Luo, X.; Yuan, M.; Li, B.; Li, C.; Zhang, Y.; Shi, Q. Variation of floral volatiles and fragrance reveals the phylogenetic relationship among nine wild tree peony species. Flavour Fragr. J. 2020, 35, 227–241. [Google Scholar] [CrossRef]
- Song, S.; Jin, R.; Chen, Y.; He, S.; Li, K.; Tang, Q.; Wang, Q.; Wang, L.; Kong, M.; Dudareva, N. The functional evolution of architecturally different plant geranyl diphosphate synthases from geranylgeranyl diphosphate synthase. Plant Cell 2023, 35, 2293–2315. [Google Scholar] [CrossRef] [PubMed]
- Abbas, F.; Ke, Y.; Yu, R.; Yue, Y.; Amanullah, S.; Jahangir, M.M.; Fan, Y. Volatile terpenoids: Multiple functions, biosynthesis, modulation and manipulation by genetic engineering. Planta 2017, 246, 803–816. [Google Scholar] [CrossRef] [PubMed]
- Galen, C.; Kaczorowski, R.; Todd, S.L.; Geib, J.; Raguso, R.A. Dosage-dependent impacts of a floral volatile compound on pollinators, larcenists, and the potential for floral evolution in the alpine skypilot Polemonium viscosum. Am. Nat. 2011, 177, 258–272. [Google Scholar] [CrossRef] [PubMed]
- Gurr, G.M.; Liu, J.; Pickett, J.A.; Stevenson, P.C. Review of the chemical ecology of homoterpenes in arthropod–plant interactions. Austral Entomol. 2023, 62, 3–14. [Google Scholar] [CrossRef]
- Ninkuu, V.; Zhang, L.; Yan, J.; Fu, Z.; Yang, T.; Zeng, H. Biochemistry of terpenes and recent advances in plant protection. Int. J. Mol. Sci. 2021, 22, 5710. [Google Scholar] [CrossRef]
- Han, T.; Shao, Y.; Gao, R.; Gao, J.; Jiang, Y.; Yang, Y.; Wang, Y.; Yang, S.; Gao, X.; Wang, L. Functional characterization of a (E)-β-Ocimene synthase gene contributing to the defense against Spodoptera litura. Int. J. Mol. Sci. 2023, 24, 7182. [Google Scholar] [CrossRef]
- Dong, L.; Miettinen, K.; Goedbloed, M.; Verstappen, F.W.A.; Voster, A.; Jongsma, M.A.; Memelink, J.; van der Krol, S.; Bouwmeester, H.J. Characterization of two geraniol synthases from Valeriana officinalis and Lippia dulcis: Similar activity but difference in subcellular localization. Metab. Eng. 2013, 20, 198–211. [Google Scholar] [CrossRef] [PubMed]
- Skaliter, O.; Livneh, Y.; Agron, S.; Shafir, S.; Vainstein, A. A whiff of the future: Functions of phenylalanine-derived aroma compounds and advances in their industrial production. Plant Biotechnol. J. 2022, 20, 1651–1669. [Google Scholar] [CrossRef] [PubMed]
- Xiang, B.; Li, X.; Wang, Y.; Tian, X.; Yang, Z.; Ma, L.; Liu, X.; Wang, Y. Cloning and characterization of two iridoid synthase homologs from Swertia mussotii. Molecules 2017, 22, 1387. [Google Scholar] [CrossRef]
- Zhao, C.; Yu, Z.; da Silva, J.A.T.; He, C.; Wang, H.; Si, C.; Zhang, M.; Zeng, D.; Duan, J. Functional characterization of a Dendrobium officinale geraniol synthase DoGES1 involved in floral scent formation. Int. J. Mol. Sci. 2020, 21, 7005. [Google Scholar] [CrossRef]
- Magnard, J.L.; Roccia, A.; Caissard, J.C.; Vergne, P.; Sun, P.; Romain, H.; Annick, D.; Laurence, H.O.; Frédéric, J.; Florence, N.; et al. Biosynthesis of monoterpene scent compounds in roses. Science 2015, 349, 81–83. [Google Scholar] [CrossRef]
- Conart, C.; Saclier, N.; Foucher, F.; Goubert, C.; Rius-Bony, A.; Paramita, S.; Moja, S.; Thouroude, T.; Douady, C.; Sun, P. Evolution of scent genes in roses. In Proceedings of the XXXI International Horticultural Congress (IHC2022): International Symposium on Innovations in Ornamentals: From Breeding to Market, Angers, France, 14–20 August 2022; pp. 361–370. [Google Scholar]
- Bergman, M.E.; Bhardwaj, M.; Phillips, M.A. Cytosolic geraniol and citronellol biosynthesis require a Nudix hydrolase in rose-scented geranium (Pelargonium graveolens). Plant J. 2021, 107, 493–510. [Google Scholar] [CrossRef]
- Bergman, M.E.; Franks, A.E.; Phillips, M.A. Biosynthesis, natural distribution, and biological activities of acyclic monoterpenes and their derivatives. Phytochem. Rev. 2023, 22, 361–384. [Google Scholar] [CrossRef]
- Xu, H.; Bohman, B.; Wong, D.C.; Rodriguez-Delgado, C.; Scaffidi, A.; Flematti, G.R.; Phillips, R.D.; Pichersky, E.; Peakall, R. Complex sexual deception in an orchid is achieved by co-opting two independent biosynthetic pathways for pollinator attraction. Curr. Biol. 2017, 27, 1867–1877.e1865. [Google Scholar] [CrossRef]
- Iijima, M.; Kenmoku, H.; Takahashi, H.; Lee, J.-B.; Toyota, M.; Asakawa, Y.; Kurosaki, F.; Taura, F. Characterization of 12-oxophytodienoic acid reductases from rose-scented geranium (Pelargonium graveolens). Nat. Prod. Commun. 2016, 11, 1934578X1601101201. [Google Scholar] [CrossRef]
- Martinelli, L.; Bihanic, C.; Bony, A.; Gros, F.; Conart, C.; Fiorucci, S.; Casabianca, H.; Schiets, F.; Chietera, G.; Boachon, B. Citronellol biosynthesis in pelargonium is a multistep pathway involving progesterone 5β-reductase and/or iridoid synthase-like enzymes. Plant Physiol. 2024, 194, 1006–1023. [Google Scholar] [CrossRef]
- Tan, C.S.; Hassan, M.; Hussein, Z.A.M.; Ismail, I.; Ho, K.L.; Ng, C.L.; Zainal, Z. Structural and kinetic studies of a novel nerol dehydrogenase from Persicaria minor, a nerol-specific enzyme for citral biosynthesis. Plant Physiol. Biochem. 2018, 123, 359–368. [Google Scholar] [CrossRef] [PubMed]
- Ansari, E.; Karami, A.; Ebrahimie, E. Isolation of 2-phenylethanol biosynthesis related gene and developmental patterns of emission of scent compounds in Persian musk rose (Rosa moschata Herrm.). Biocatal. Agric. Biotechnol. 2019, 19, 101176. [Google Scholar] [CrossRef]
- Zheng, W.Y.; Chen, Y.H.; Zhang, X.T.; Yu, Z.G. Analysis of volatiles in Paeonia obovata flowers by HS-SPME-GC-MS. Chem. Nat. Compd. 2016, 52, 922–923. [Google Scholar] [CrossRef]
- Huang, X.; Wang, C.; Wang, X.; Sun, X.; Guo, X. Preliminary study of aromatic components in herbaceous peonies of ‘Yangfei Chuyu’ and ‘Dafugui’. Acta Hortic. Sin. 2010, 37, 817–822. [Google Scholar]
- Pichersky, E.; Lewinsohn, E. Convergent evolution in plant specialized metabolism. Annu. Rev. Plant Biol. 2011, 62, 549–566. [Google Scholar] [CrossRef]
- Wright, C.J.; Smith, C.W.; Jiggins, C.D. Alternative splicing as a source of phenotypic diversity. Nat. Rev. Genet. 2022, 23, 697–710. [Google Scholar] [CrossRef] [PubMed]
- Liu, Y.; Xue, X.; Zhao, C.; Zhang, J.; Liu, M.; Li, X.; Li, Y.; Gao, X. Cloning and functional characterization of chalcone isomerase genes involved in anthocyanin biosynthesis in Clivia miniata. Ornam. Plant Res. 2021, 1, 2. [Google Scholar] [CrossRef]
- Fu, L.; Niu, B.; Zhu, Z.; Wu, S.; Li, W. CD-HIT: Accelerated for clustering the next-generation sequencing data. Bioinformatics 2012, 28, 3150–3152. [Google Scholar] [CrossRef]
- Chen, C.; Wu, Y.; Li, J.; Wang, X.; Zeng, Z.; Xu, J.; Liu, Y.; Feng, J.; Chen, H.; He, Y. TBtools-II: A “one for all, all for one” bioinformatics platform for biological big-data mining. Mol. Plant 2023, 16, 1733–1742. [Google Scholar] [CrossRef]
- Tamura, K.; Stecher, G.; Kumar, S. MEGA11: Molecular evolutionary genetics analysis version 11. Mol. Biol. Evol. 2021, 38, 3022–3027. [Google Scholar] [CrossRef]
- Schmittgen, T.D.; Livak, K.J. Analyzing real-time PCR data by the comparative CT method. Nat. Protoc. 2008, 3, 1101–1108. [Google Scholar] [CrossRef] [PubMed]
- Chen, X.-M.; Kobayashi, H.; Sakai, M.; Hirata, H.; Asai, T.; Ohnishi, T.; Baldermann, S.; Watanabe, N. Functional characterization of rose phenylacetaldehyde reductase (PAR), an enzyme involved in the biosynthesis of the scent compound 2-phenylethanol. J. Plant Physiol. 2011, 168, 88–95. [Google Scholar] [CrossRef] [PubMed]
Disclaimer/Publisher’s Note: The statements, opinions and data contained in all publications are solely those of the individual author(s) and contributor(s) and not of MDPI and/or the editor(s). MDPI and/or the editor(s) disclaim responsibility for any injury to people or property resulting from any ideas, methods, instructions or products referred to in the content. |
© 2024 by the authors. Licensee MDPI, Basel, Switzerland. This article is an open access article distributed under the terms and conditions of the Creative Commons Attribution (CC BY) license (https://creativecommons.org/licenses/by/4.0/).