Article

A Study on Sugar Content Improvement and Distribution Flow Response through Citrus Sugar Content Prediction Based on the PyCaret Library

1
Department of Computer Engineering, Jeju National University, Jeju 63243, Republic of Korea
2
Department of Computer Engineering, Major of Electronic Engineering, Institute of Information Science & Technology, Jeju National University, Jeju 63243, Republic of Korea
*
Authors to whom correspondence should be addressed.
Horticulturae 2024, 10(6), 630; https://doi.org/10.3390/horticulturae10060630
Submission received: 8 May 2024 / Revised: 31 May 2024 / Accepted: 10 June 2024 / Published: 12 June 2024
(This article belongs to the Special Issue Citrus Plant Growth and Fruit Quality)

Abstract

:
Despite the increasing attention on smart farms as a solution to rural issues such as aging agricultural populations, a shortage of young farmers, decreased production area, and reduced investment leading to stagnant income, exports, and growth rates, many farms still rely on traditional methods like cultivating tangerines in open fields. Despite this, increasing farm income requires producing high-quality tangerines and selling them at premium prices, with fruit sweetness being a crucial factor. Therefore, there is a need to examine the close correlation between tangerine quality and sweetness. In this paper, we use deep learning with the PyCaret library to predict and analyze tangerine sweetness using data from seven regions in Jeju and 13 comprehensive factors influencing sweetness, including terrain, temperature, humidity, precipitation, sunlight, wind speed, acidity, sugar-acid ratio, and others. Although applying all 13 factors could achieve over 90% accuracy, our study, limited to seven factors, still achieves a respectable 82.4% prediction accuracy, demonstrating the significant impact of weather data on sweetness. Moreover, these optimistic predictions enable the estimation of tangerine quality and price formation in the market for the coming year, allowing tangerine farmers and related agencies to respond to market conditions proactively. Furthermore, by applying these data to smart farms to control factors influencing tangerine sweetness, it is anticipated that high-quality tangerine production and increased farm income can be achieved.

1. Introduction

Various cases aiming to solve many challenges in agriculture have emerged as AI is utilized in the agricultural sector. Harvest automation in the United States has developed robots that autonomously navigate farms or greenhouses based on AI technology, enabling tasks such as crop condition analysis and soil analysis, as well as watering and pesticide/herbicide/fertilizer application, which would otherwise be impossible for humans [1,2].
In Korea, tangerines, a specialty of Jeju Island, are mainly consumed as a fresh fruit rather than a processed food. They are recognized for their nutritional value as sources of vitamins, dietary fiber, organic acids, and glucose/fructose. Particularly in traditional medicine, tangerines are known for their efficacy in treating digestive issues, asthma, phlegm, poor appetite, and arteriosclerosis. Recent studies have shown that tangerine peel can lower cholesterol levels and inhibit fat cell differentiation, making tangerines known as a beneficial fruit for weight loss [3]. According to the Jeju Special Self-Governing Province Tangerine Harvesting Cooperative Association, the total market size of the tangerine industry in Jeju Island is estimated to exceed KRW 1 trillion, making a significant contribution to the regional economy [4]. Therefore, harvesting high-quality tangerines is crucial.
Despite the decrease in agricultural population and aging, increasing farm income by producing high-quality tangerines and selling them at premium prices is crucial. Sweetness is considered the most critical factor determining fruit quality.
Therefore, this paper aims to predict tangerine sweetness for different regions in Jeju using big data, including seven factors, including weather data, that determine sweetness. By analyzing and visualizing data using the PyCaret library and machine learning techniques, we aim to predict sweetness for tangerines in seven regions based on the obtained data. This will reveal regional differences in sweetness and enable predictions of tangerine quality, distribution, and price formation in the market for the upcoming year, allowing for a rough prediction of farm income. Based on this information, tangerine farmers and relevant organizations can proactively manage and respond to the market. As a future research direction, we aim to apply this sweetness prediction data to smart farms, enabling control of weather data among tangerine sweetness factors, thereby contributing to high-quality tangerine production and increased farm income.

2. Research Scope and Methodology

We trained and performed predictions using time-series weather data from August to November, a critical period for tangerine production, and tangerine sweetness harvested during that time. The scope and methodology of this study are limited to the following four aspects:
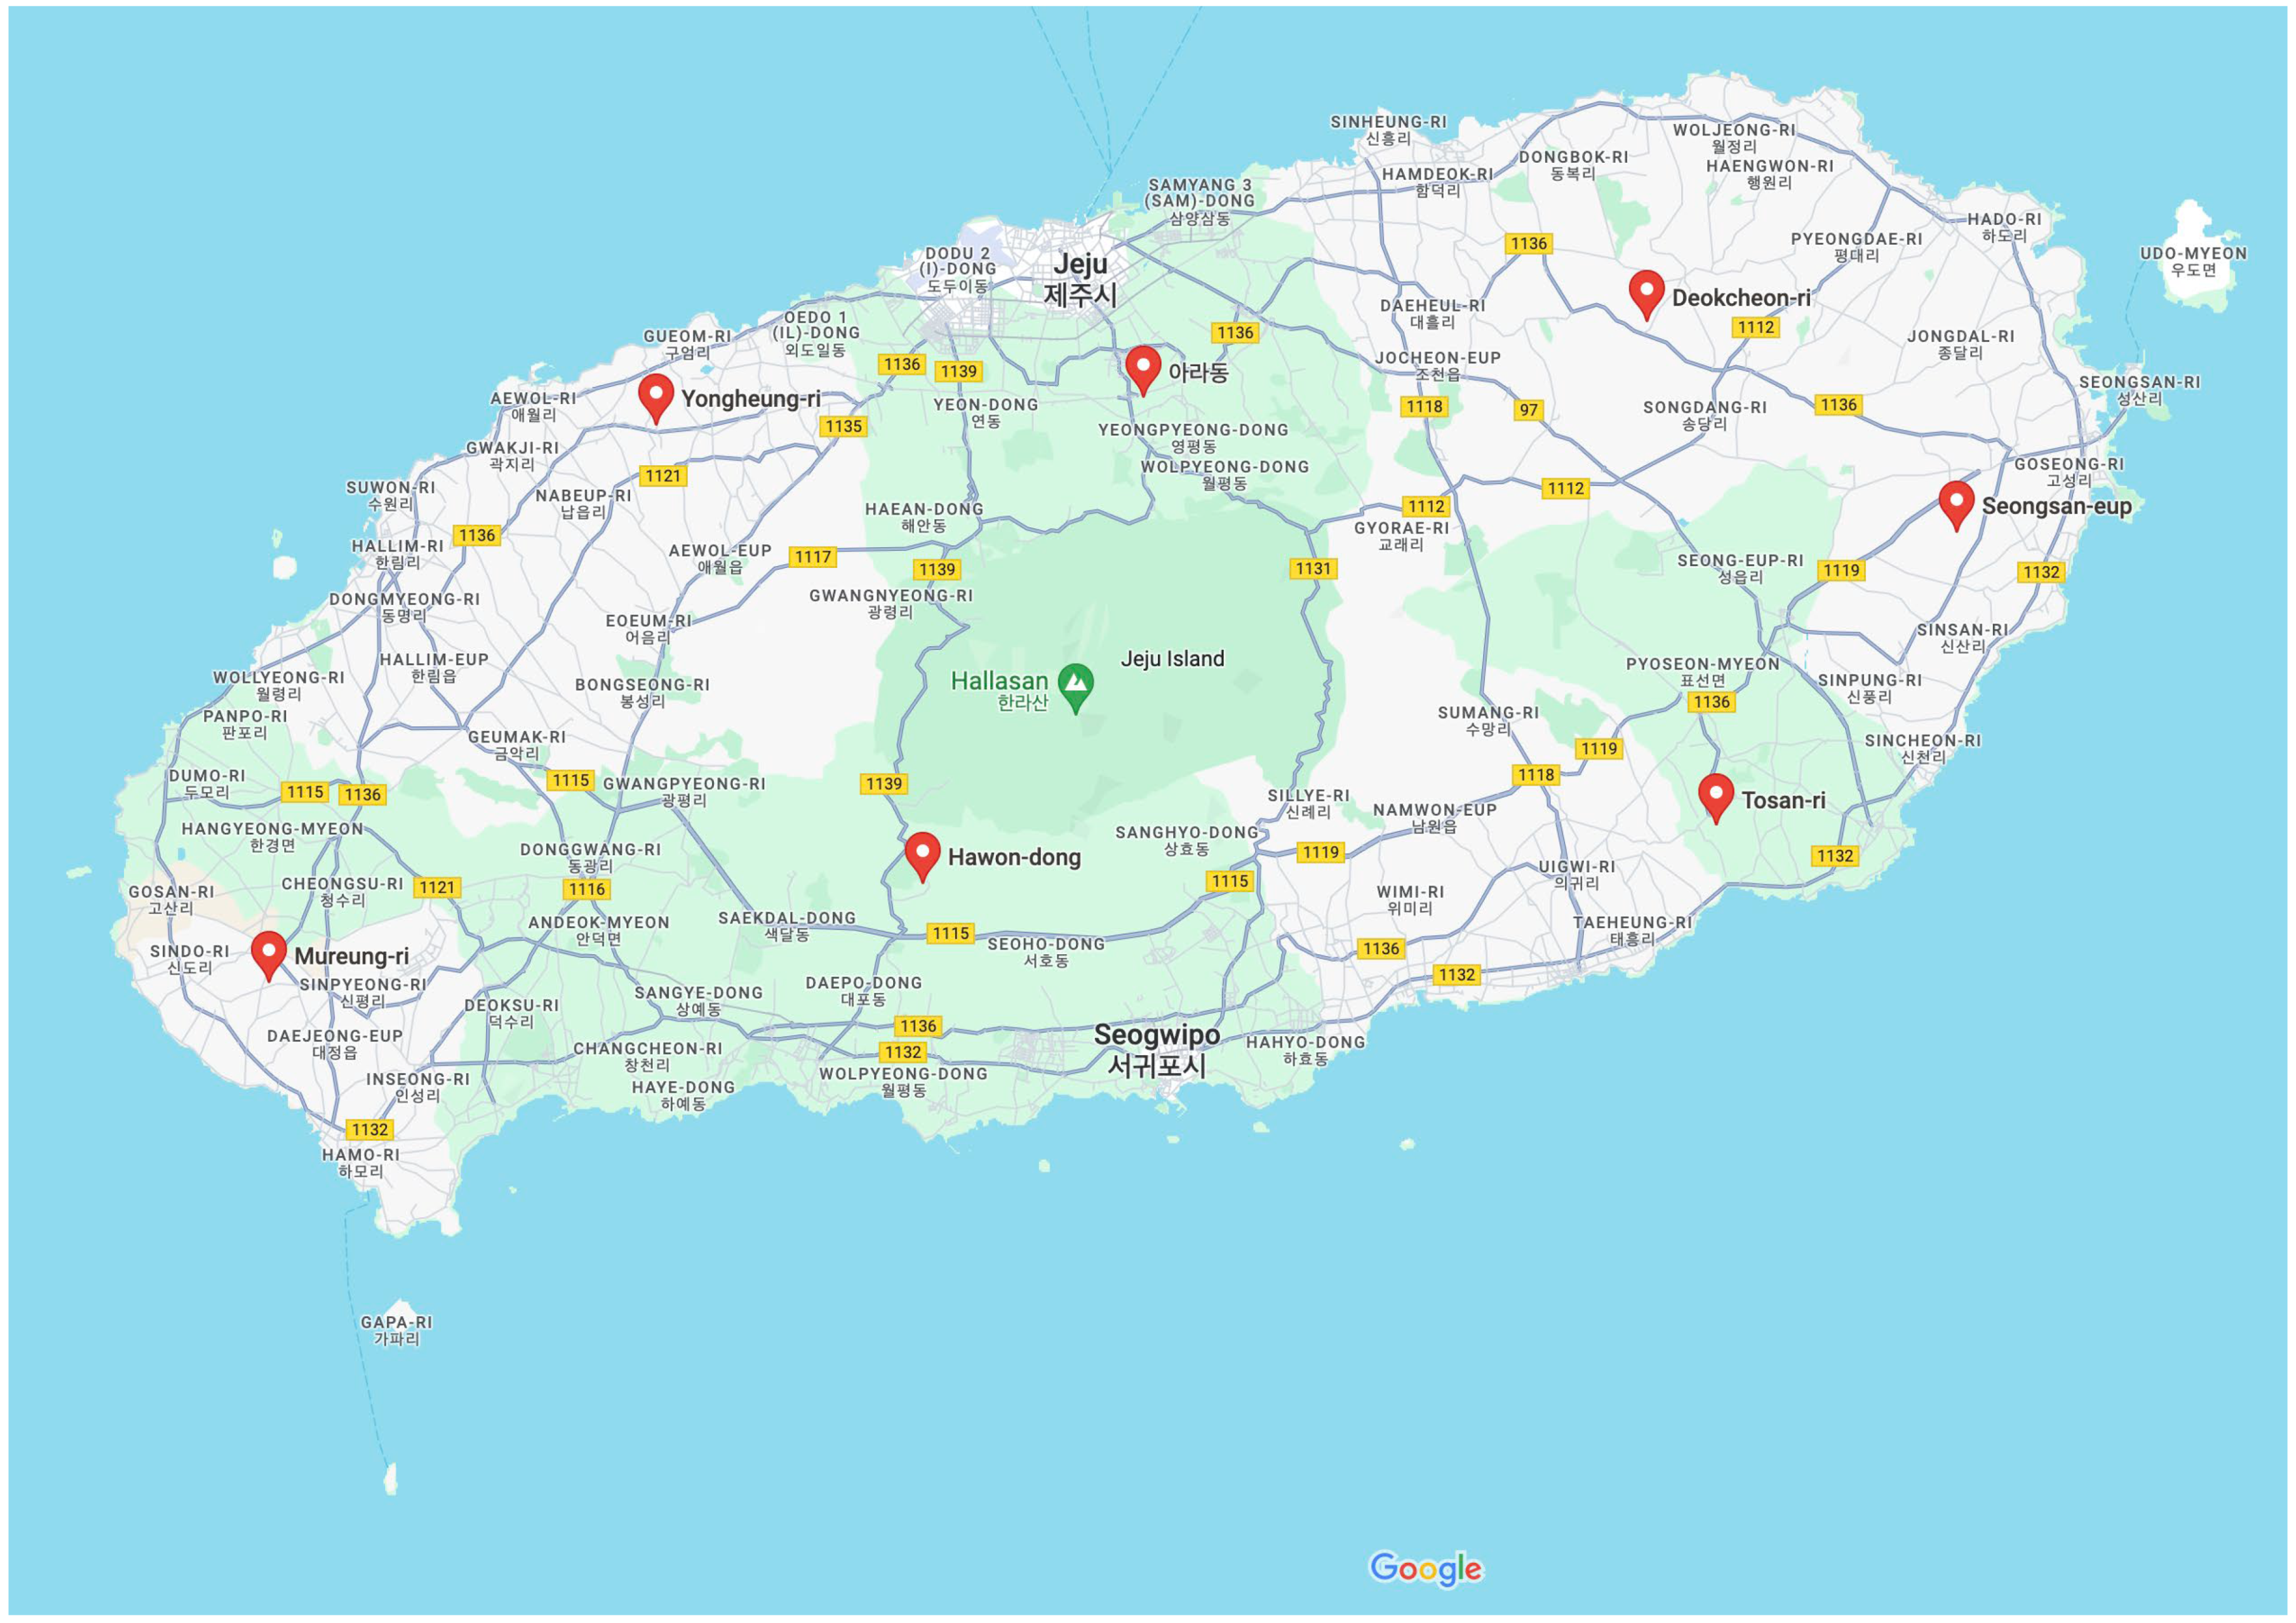
  • Area: Tangerine data from seven open-field environments on Jeju Island (Yongheung, Seongsan, Tosan, Ara, Mureung, Hawon, Deokcheon) (Figure 1).
2.
Period and Data Types:
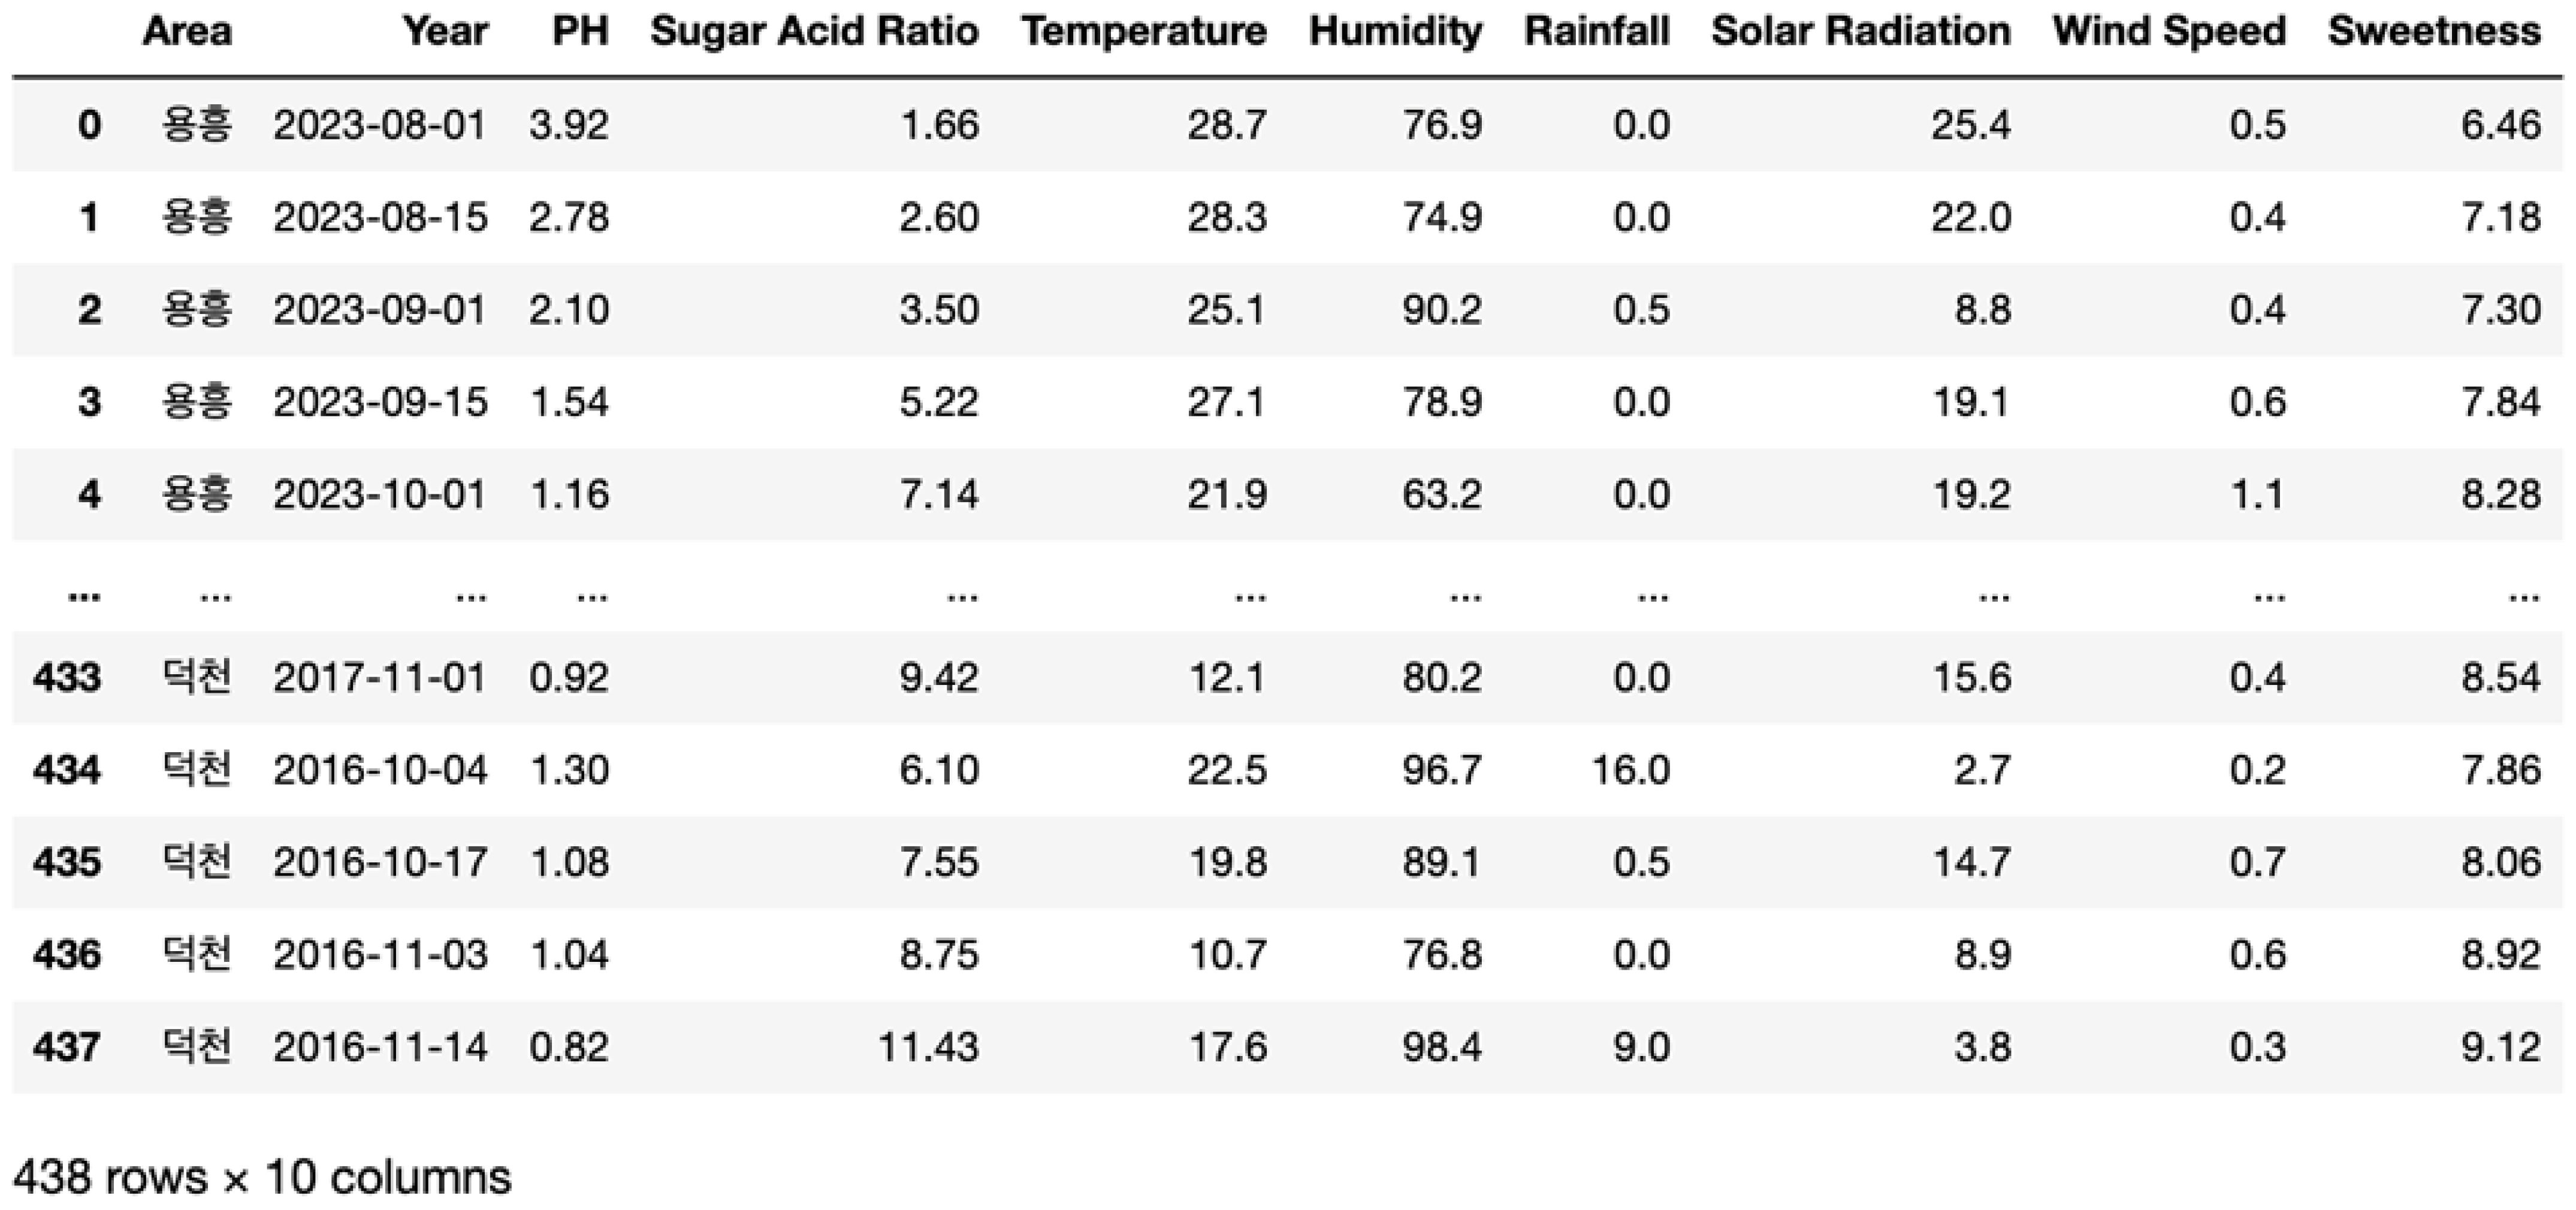
  • Data Preparation: We utilized 438 actual time-series data points from October to November 2016 and from August to November annually from 2017 to 2023.
  • Data Augmentation: We augmented the dataset to include 1314 data points due to limited available data.
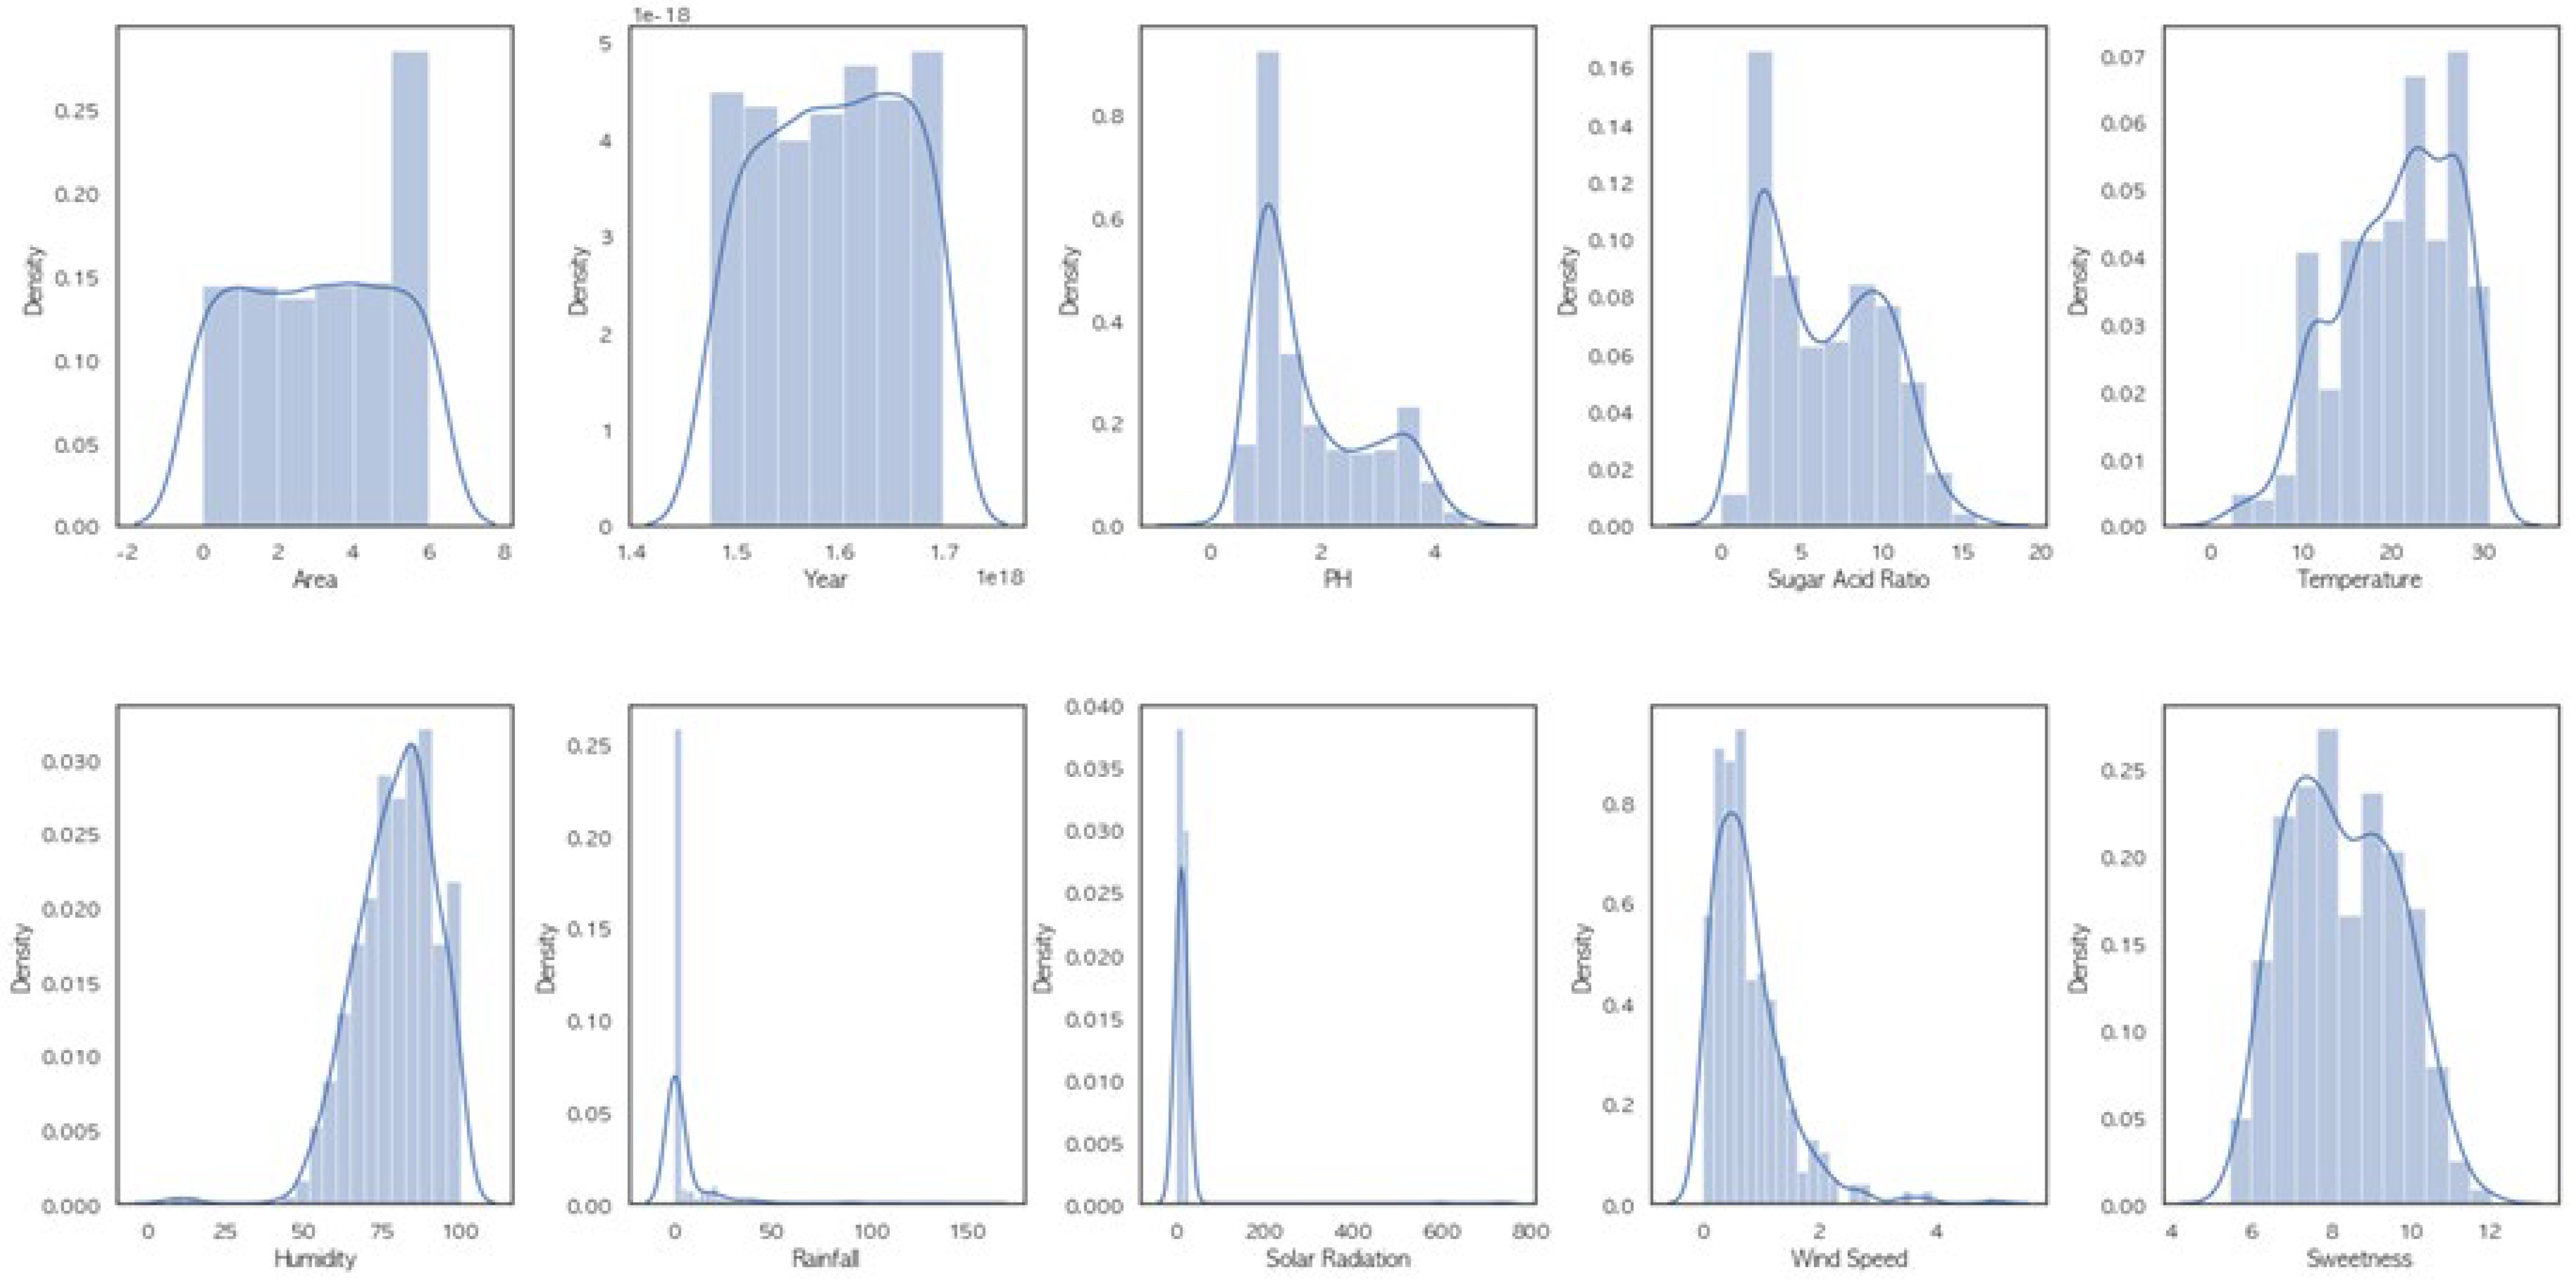
  • Data Types: We used only seven of the 13 factors in this experiment. We limited the use to seven factors to focus on aspects relevant to sweetness, including two related to sweetness and five weather-related factors applicable to smart farming. This restriction allows for adjustments and applications in smart agriculture based on research outcomes.
3.
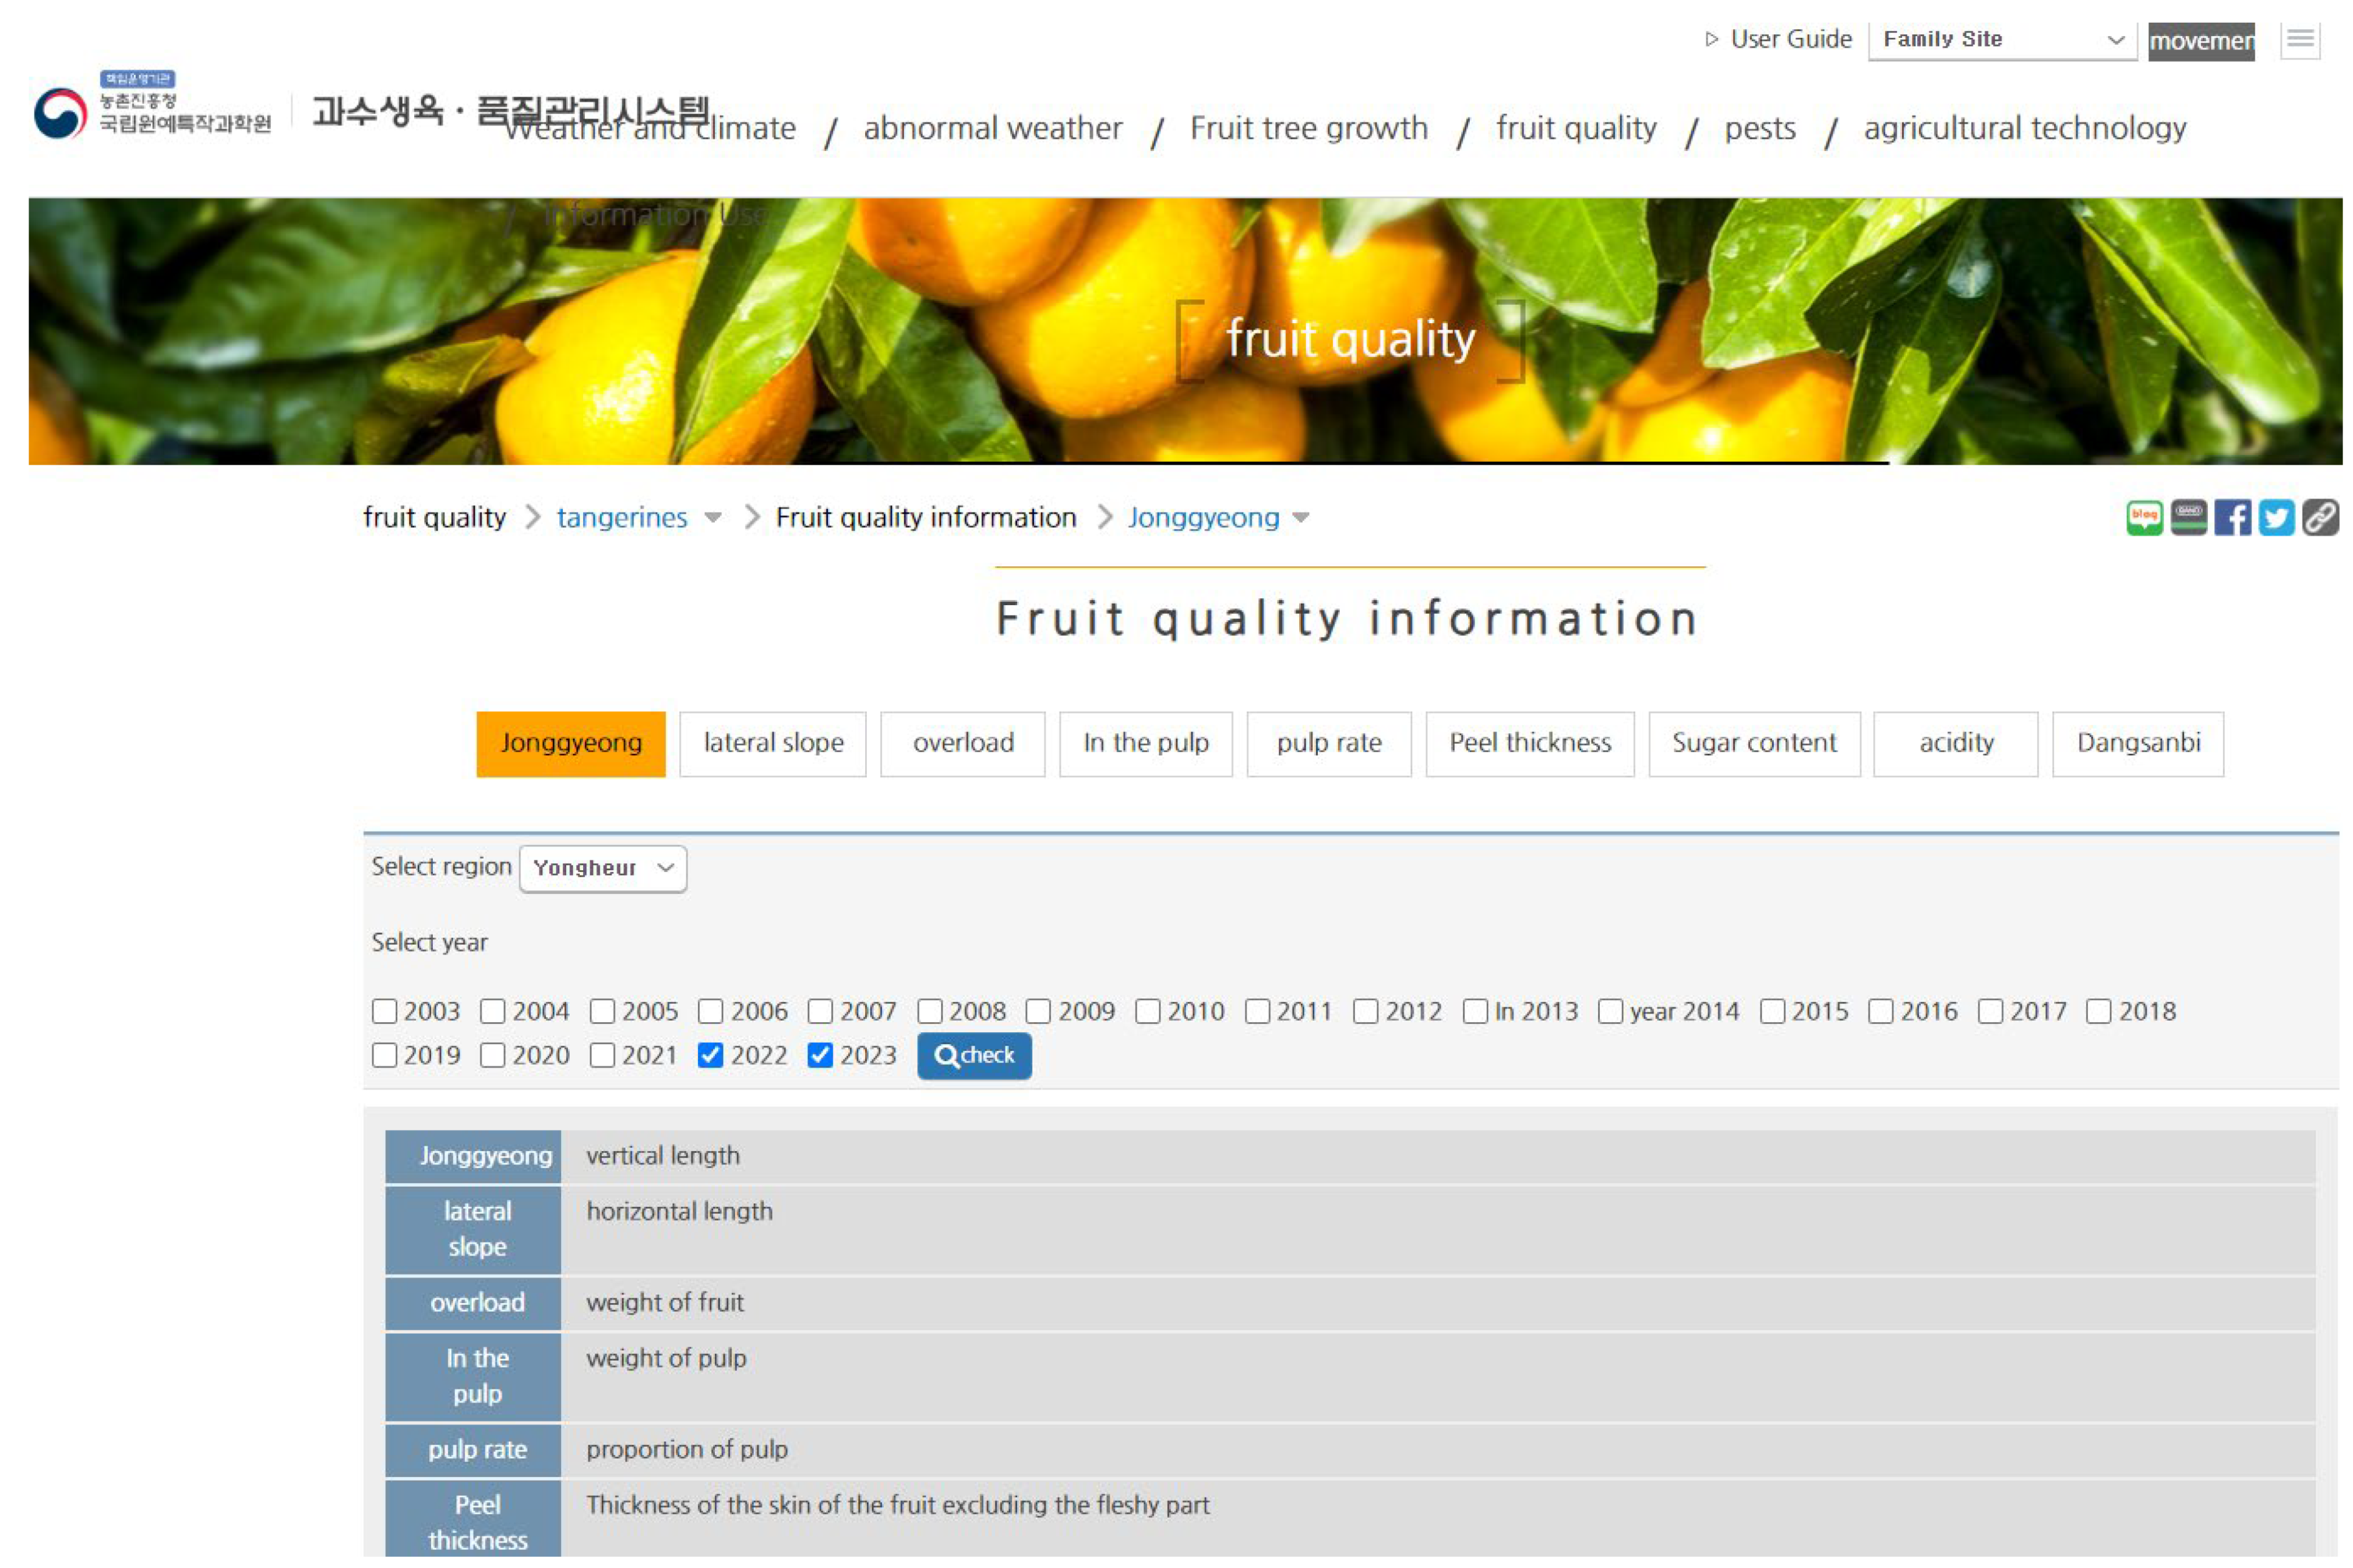
Data Collection: We obtained tangerine sweetness and weather data for seven regions in Jeju Island from the National Institute of Horticultural and Herbal Science, Rural Development Administration. The data were secured through a web page providing tangerine quality information and weather data, and we prepared the data for extensive data analysis through data augmentation techniques for deep learning.
4.
Machine Learning Method: PyCaret library.
Figure 2 and Figure 3 below depict the homepage of the National Institute of Horticultural and Herbal Science, Rural Development Administration, providing a fruit growth and quality management system. This webpage offers the fruit quality information and weather data utilized in this study.

3. Related Research

3.1. Reality of Agriculture

Population decline and urban migration have resulted in labor shortages in agriculture, and rural areas are experiencing an increasing risk of regional extinction. The number of farms and agricultural populations in Korea has steadily decreased, with the aging population becoming more pronounced. Furthermore, the aging rate in rural areas is approximately 46.8%, about 2.7 times higher than the national average of 17.1% (as of 2022).
While agriculture in Korea experienced continuous growth until the early 2000s, recent challenges such as stagnant farm income, declining self-sufficiency in grains, reduction in rural population and aging, and climate change have posed difficulties. The unpredictability of crop yields and production and price fluctuations make it challenging to ensure stable food supplies for consumers [6,7].
There has been increasing attention on smart farms as a solution to the challenges posed by aging agricultural populations, a shortage of young farmers, decreasing production areas, and reduced investment. Smart farms are characterized by their ability to control crop growth environments, such as light, air, heat, and nutrients, within artificial structures, enabling year-round production regardless of weather or seasonal changes. They offer high production efficiency and quality, with stable prices for crops like vegetables throughout the year. Moreover, they significantly reduce water and chemical fertilizer usage by about 1/100 compared to traditional farming methods. Productivity per unit area can reach up to 350 times higher than conventional farms [8].
One of the advantages of smart farms is the ability to supply agricultural products to urban consumers quickly and safely. Given that 46.8% of the rural population in Korea is over 60 years old, the smart farm industry needs to enhance its competitiveness through the integration of ICT (Information Communication Technology) and BT (Biotechnology) to address the decreasing agricultural population and the aging workforce [9].

3.2. Tangerine Production and Fruit Distribution Market

Tangerines produced in the Jeju region are typically classified into various types based on cultivation methods: field-grown tangerines, greenhouse-grown tangerines, rain-sheltered field-grown tangerines, and late-harvest varieties such as Hallabong, Cheonhyehyang, and Jinjihyang. This study focuses on field-grown tangerines, which account for a significant portion of tangerine production but have faced declining cultivation areas and income. Specifically, the study aims to explore the potential contribution of supply stability in the storage sector, which is expected to play a role in stabilizing supply and demand [10,11].
Generally, prices of primary products like tangerines fluctuate daily, weekly, monthly, and seasonally. While price volatility research has been extensively conducted for vegetables and animal products, more research needs to be done on fruits like tangerines [12]. The changing domestic and international conditions have expanded the price determination function in the domestic agricultural market through intense competition, potentially leading to positive effects on resource allocation efficiency [13,14]. However, in the case of farm products like tangerines, without public sector intervention, complete price determination through perfect competition may exacerbate supply instability and price volatility due to factors such as seasonal changes and supply uncertainties [15]. Due to seasonal factors and supply instability, Jeju tangerines are characterized by significant annual price fluctuations. Therefore, since 1996, Jeju Special Self-Governing Province has implemented policies to regulate tangerine shipments through the “Ordinance on Tangerine Production and Distribution” [16].
High price volatility in agricultural markets increases uncertainty and risk, ultimately leading to income instability for farmers. Furthermore, price volatility can result in inefficient resource allocation and distortions in resource distribution and income redistribution functions. Thus, it negatively affects all economic agents involved in tangerine production, distribution, processing, and consumption [17].
Research on price volatility has mainly focused on financial assets in financial markets (exchange rates, interest rates, stock prices, etc.), with theoretical advancements achieved. However, despite relatively fewer studies conducted in agricultural markets, research in this field has progressed since the early 2000s, starting with Kang’s study [18], followed by research mainly focused on vegetable and animal product markets.

3.3. Deep Learning and Big Data Analysis

Big data is defined as data with large volume, high velocity, and high diversity, enabled by advancements in storage technology, cost reduction, and the advent of the internet and mobile era. This has made it technically feasible to generate and maintain big data. It has been increasingly utilized across various industries, where user and consumer behavior information is collected and analyzed to inform business strategies. Furthermore, ongoing research and development efforts in academia continue to contribute to the advancement of big data by developing methods, tools, and technologies for its utilization [19].
The growth of big data has spurred research and development in techniques and technologies for data analysis. In particular, the continuous advancement of computing power and the growth of big data have fueled efforts to commercialize and practically utilize machine learning, which was once primarily confined to academic research [20].
Machine learning, a field of computer science, aims to realize computers’ ability to learn in a way similar to human learning capabilities. It involves fitting empirical datasets into specific models, training them, making predictions, and improving their performance over time. Machine learning algorithms are designed not to execute commands based on strictly defined conditions but to make predictions or decisions based on input data [21].

3.4. PyCaret Library

PyCaret is an open-source machine learning library based on Python that is designed to automate machine learning workflows. It allows users to easily and quickly create and deploy models. With just a few lines of code, it enables data preprocessing, model training, parameter tuning, model comparison and ensemble, and model analysis, catering to users ranging from beginners to experts.
PyCaret is an open-source library for automating machine-learning workflows with minimal code [22]. A machine learning workflow refers to the flow of all stages, from task definition and model development to model deployment. The first stage, task definition, involves defining a solution to a problem within a specific business context and understanding the data. The second stage, model development, involves preparing the data for processing through machine learning models, using techniques such as object detection and machine learning libraries for fruit grading algorithms, and building models and infrastructure. Finally, models are deployed and maintained for operational use in the model deployment stage, often involving additional data collection for future model iterations [23].
PyCaret supports various machine learning algorithms, allowing users to experiment with multiple models quickly without writing complex code. Additionally, it enables automatic model selection and tuning through AutoML (Automatic Machine Learning) functionality. PyCaret is a valuable tool for data scientists, analysts, and developers to rapidly prototype, test, and deploy models into production environments. Users working in Python can quickly get started and find more information and usage examples through PyCaret’s official documentation and online resources.
Using PyCaret can leverage the following key features:
  • Data preprocessing: it automatically handles processes such as handling missing values, feature scaling, encoding, and data splitting.
  • Model training and selection: it easily trains various machine learning models and compares them to select the optimal model.
  • Hyperparameter tuning: it optimizes model performance through grid search or random search.
  • Model analysis: it provides various tools (e.g., confusion matrix, ROC curve) for evaluating and analyzing model performance.
  • Model deployment: this feature enables the easy deployment of created models, either through providing APIs or integrating them into web applications.

4. Improving Fruit Quality

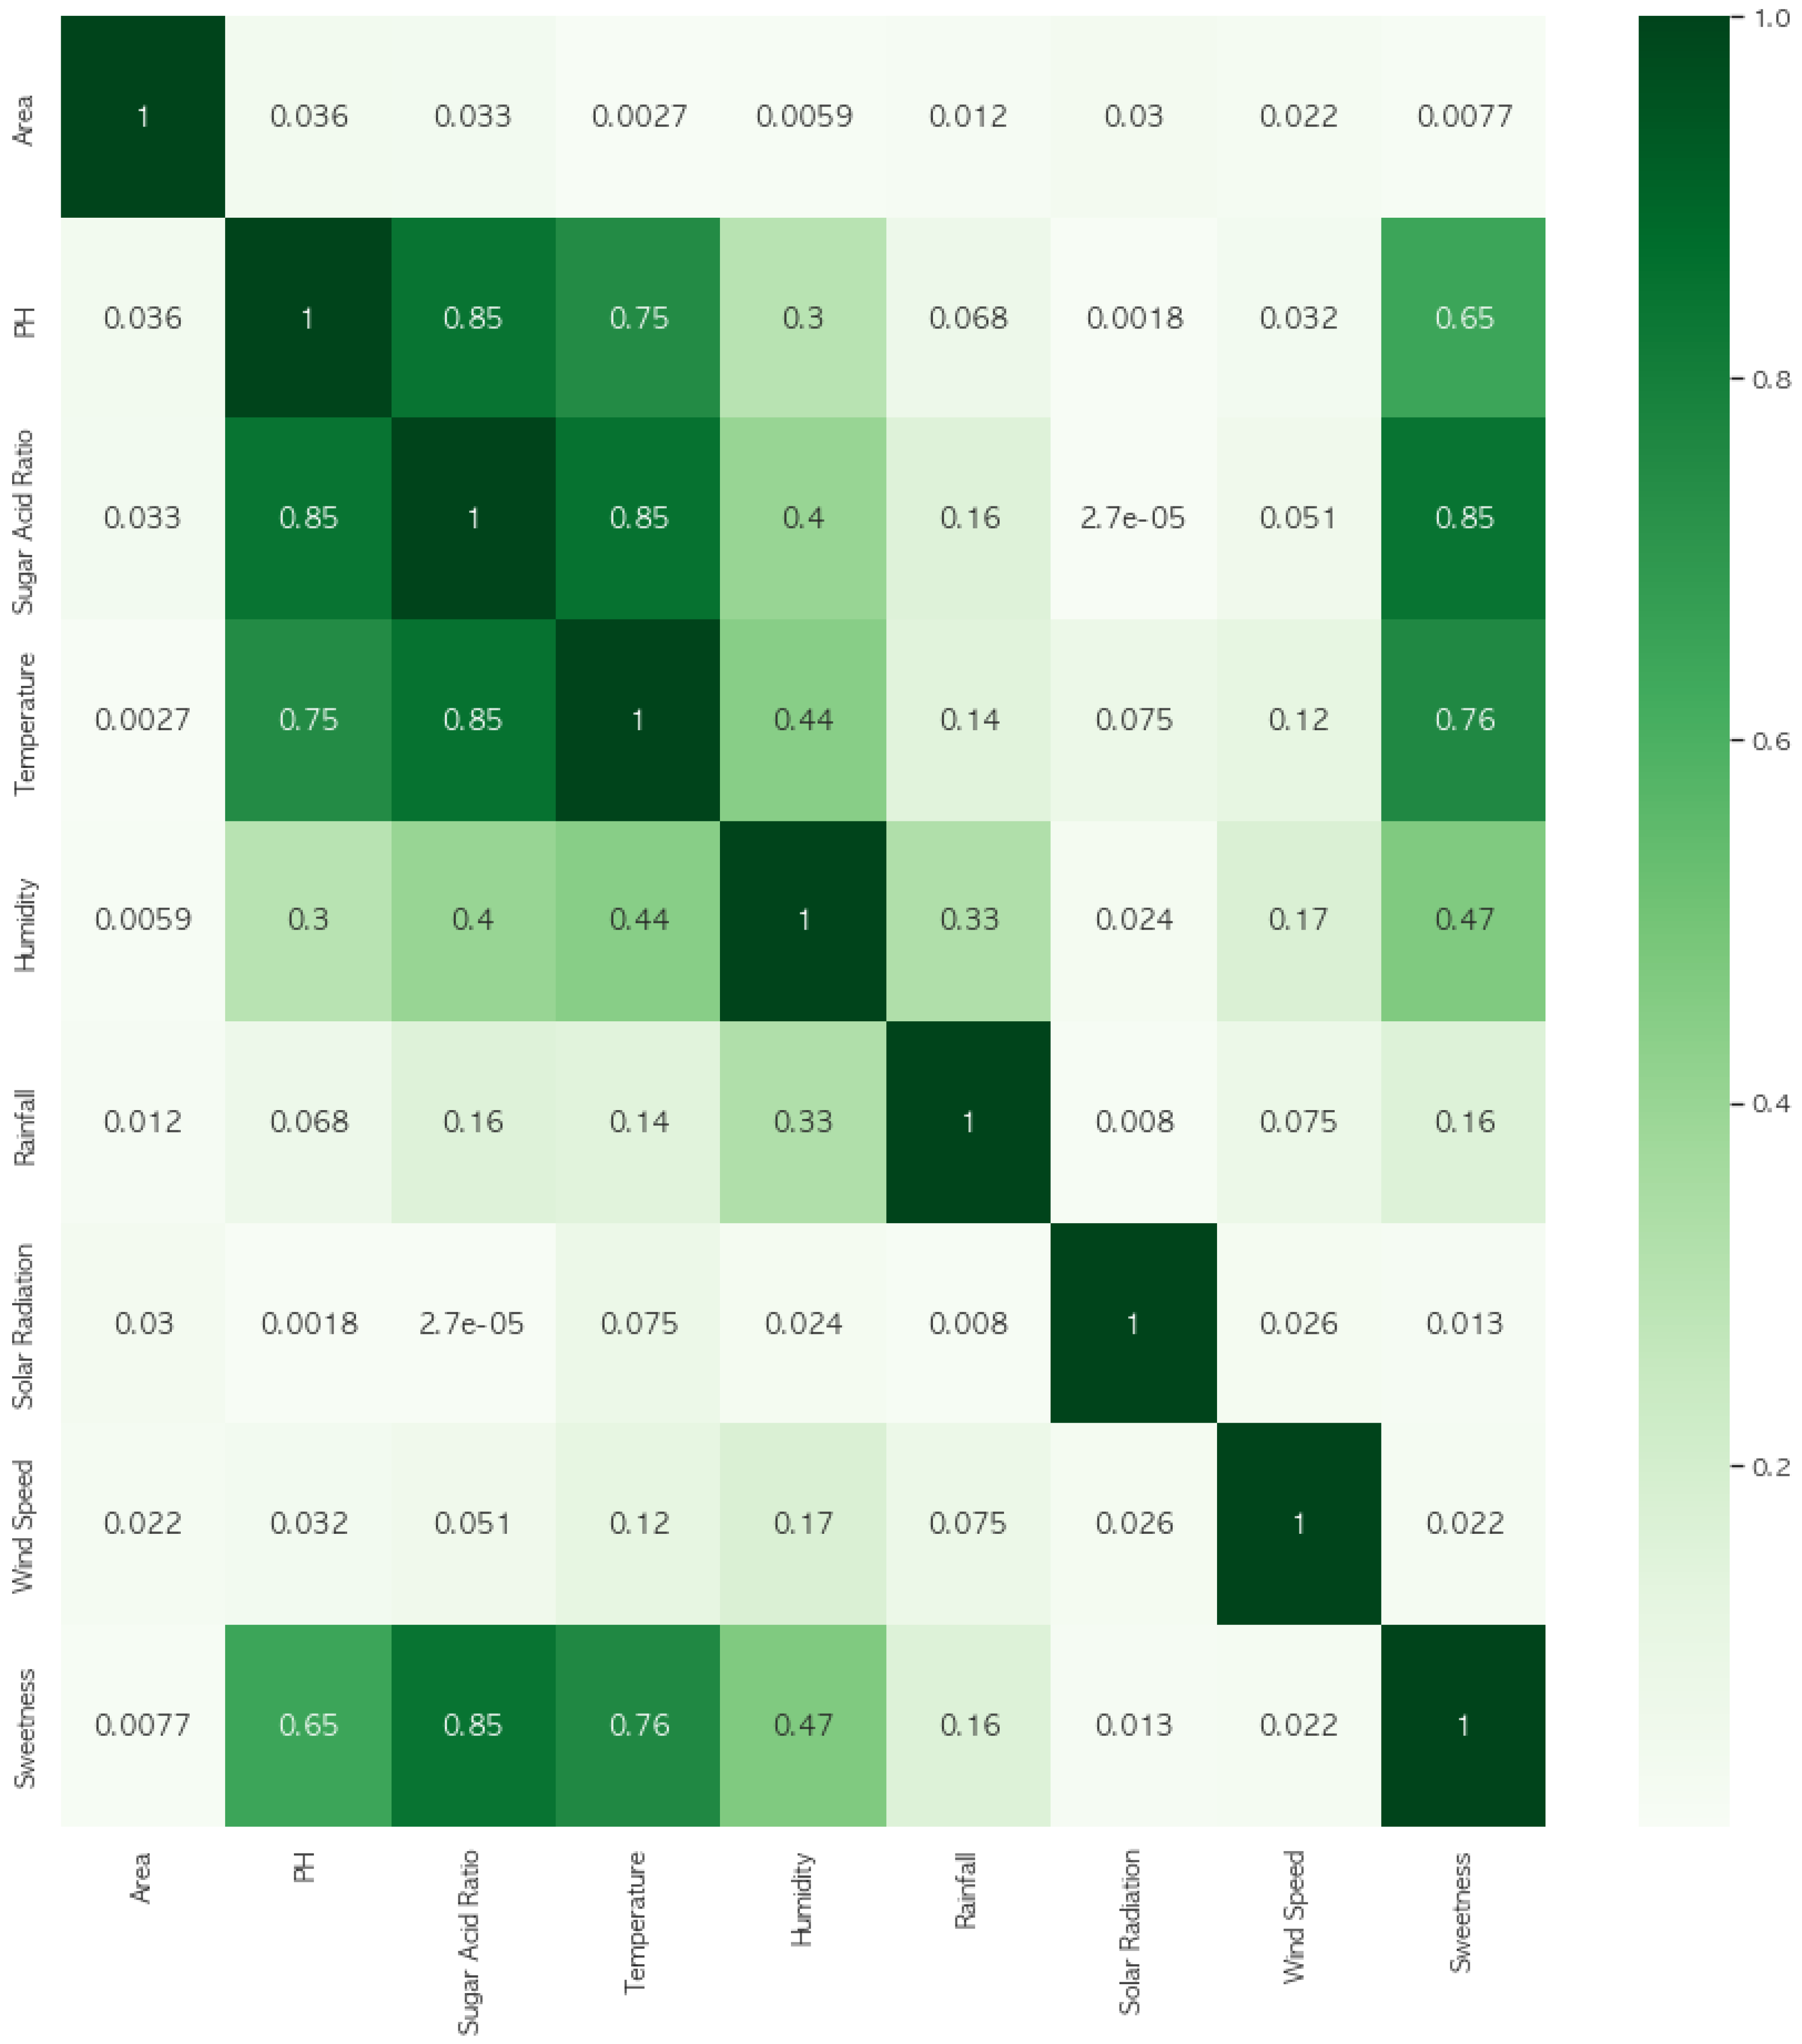
4.1. Correlation between Citrus Quality and Sugar Content

Quality and sweetness are closely correlated in fruits like tangerines. Sweetness is a significant factor determining the ripeness and taste of fruit, typically considered an important criterion when consumers evaluate fruit quality. In the case of tangerines, sweetness is used to measure how well the fruit has ripened, with higher sweetness generally indicating better quality and more delicious fruit.
The sweetness of tangerines is closely related to ripeness, taste, and consumer preferences, making it an essential factor in overall quality assessment. Tangerines with high sweetness are generally considered superior quality and provide higher satisfaction to consumers. However, judging fruit quality based on sweetness may be limited, as other factors such as appearance, freshness, and nutritional content should also be considered.
Three main factors determine the quality of tangerines, with sweetness being the most important factor among them:
  • Ripeness (Sweetness): Tangerines’ sweetness naturally increases during ripening. Ripe tangerines contain more sugars, resulting in a sweeter taste. Therefore, sweetness reflects tangerines’ ripeness, with tangerines with higher sweetness generally considered better quality.
  • Consumer Preferences: Most consumers prefer fruits with a more pungent sweet taste. As the sweetness of tangerines increases, consumer satisfaction typically rises, positively impacting the overall quality assessment of the fruit.
  • Variety Differences: There may be natural variations in sweetness depending on the variety of tangerines. Some varieties boast higher sweetness compared to others. Therefore, variety selection is an essential factor in determining the sweetness and quality of tangerines.

4.2. Correlation between Citrus Quality and Sugar Content

The critical factors determining tangerines’ sweetness can be broadly categorized into environmental, genetic, cultivation, and post-harvest management factors [24]. The sugar content within the fruit primarily measures tangerine sweetness and can vary depending on various conditions and management practices [25]. The following factors, individually or in combination, influence the sweetness of tangerines, and careful management of these factors is necessary to produce high-quality, sweet tangerines [26].
  • Environmental Factors:
    • Climate Conditions: Tangerine sweetness is greatly influenced by climate conditions, especially temperature and sunlight during the growing season. Generally, lower temperatures and higher sunlight levels help increase tangerine sweetness.
    • Soil Conditions: Well-drained soil with rich nutrients contributes to tangerines’ healthy growth and high sweetness.
  • Genetic Factors:
    • Variety Selection: Tangerine sweetness can vary significantly depending on the variety. Certain varieties are naturally bred to be sweeter than others.
  • Cultivation Practices:
    • Moisture Management: Excessive irrigation can decrease the sweetness of the fruit. Proper water management is essential for increasing the sweetness of the fruit.
    • Fertilizer Usage: Excessive use of nitrogen fertilizers can decrease sweetness, while appropriate fertilizer application enhances the sweetness and quality of the fruit.
    • Pruning and Thinning: Proper pruning and thinning provide more nutrients and light to the fruit, increasing sweetness.
  • Post-Harvest Management:
    • Harvest Timing: Since tangerines’ sweetness varies with ripeness, harvesting them at optimal ripeness is essential. Generally, fruit is the sweetest when fully ripe.
    • Post-Harvest Handling: Storing the fruit at appropriate temperature and humidity after harvest is crucial for maintaining sweetness.

4.3. 13 Comprehensive Elements of Citrus Production

The 13 factors (longitudinal diameter, transverse diameter, fruit weight, pulp weight, pulp ratio, peel thickness, acidity, sugar-acid ratio, temperature, humidity, precipitation, insolation, and wind speed) are important indicators used in agriculture, especially in the fruit industry, to evaluate the growth, development, and quality of fruits, and to monitor environmental conditions. Items 1 to 8 are related to fruit, while items 9 to 13 are related to the environment. In this study, we aim to predict sweetness using seven factors. Five (temperature, humidity, precipitation, insolation, wind speed) are meteorological data, and two (acidity, sugar-acid ratio) are sweetness-related factors (Table 1).

5. Deep Learning and Analysis Using PyCaret Library

5.1. PyCaret Deep Learning and Visualization

Several steps must be followed to create a program for forecasting time series based on citrus fruit’s weather information using the PyCaret library. PyCaret’s time series analysis feature provides various configuration options depending on the data characteristics and prediction goals. Referring to the guides and examples provided in the official documentation to find the optimal settings is crucial. This process allows the development and evaluation of a time series forecasting model based on the weather information of citrus fruits. PyCaret is a powerful tool that efficiently performs the entire time series analysis process, from model selection to tuning and prediction. Below is a concrete example explaining these steps:
  • Install PyCaret: First, PyCaret needs to be installed. Since PyCaret has various dependencies, it should be installed in a virtual environment.
  • Data Preparation: For time series forecasting, a dataset containing citrus fruit-related weather information is needed. This dataset should include weather features such as temperature, precipitation, humidity, wind speed, etc., indexed by date and time.
  • PyCaret Environment Setup: Use the setup function of PyCaret to set up the environment for time series forecasting tasks. Specify the dataset, target variable, and the periodicity of the time series data.
  • Model Creation and Comparison: Use the compare_models function to automatically compare multiple time series forecasting models and select the best-performing one.
  • Model Tuning: Tune the selected model using the tune_model function to improve performance.
  • Perform Prediction: Use the predict_model function to predict weather information for future periods.
  • Result Visualization: PyCaret provides various methods for visualizing prediction results. It can visualize the comparison between predicted and actual values, evaluate model performance, etc.
Visualizing the results of extensive data analysis by deep learning models is crucial for interpreting model performance, making results understandable, and effectively communicating information to relevant stakeholders. The following are six ways to visualize the results of deep learning models, and using these visualization techniques can help in clearly understanding the performance of deep learning models, interpreting patterns learned by the model from the data, and effectively communicating results to relevant stakeholders:
  • Performance Metric Visualization:
    • Loss and Accuracy Curves: Plot loss and accuracy during the training process epoch by epoch to visually represent how well the model is learning. This can be done using libraries like Matplotlib or Seaborn.
  • Prediction Result Visualization:
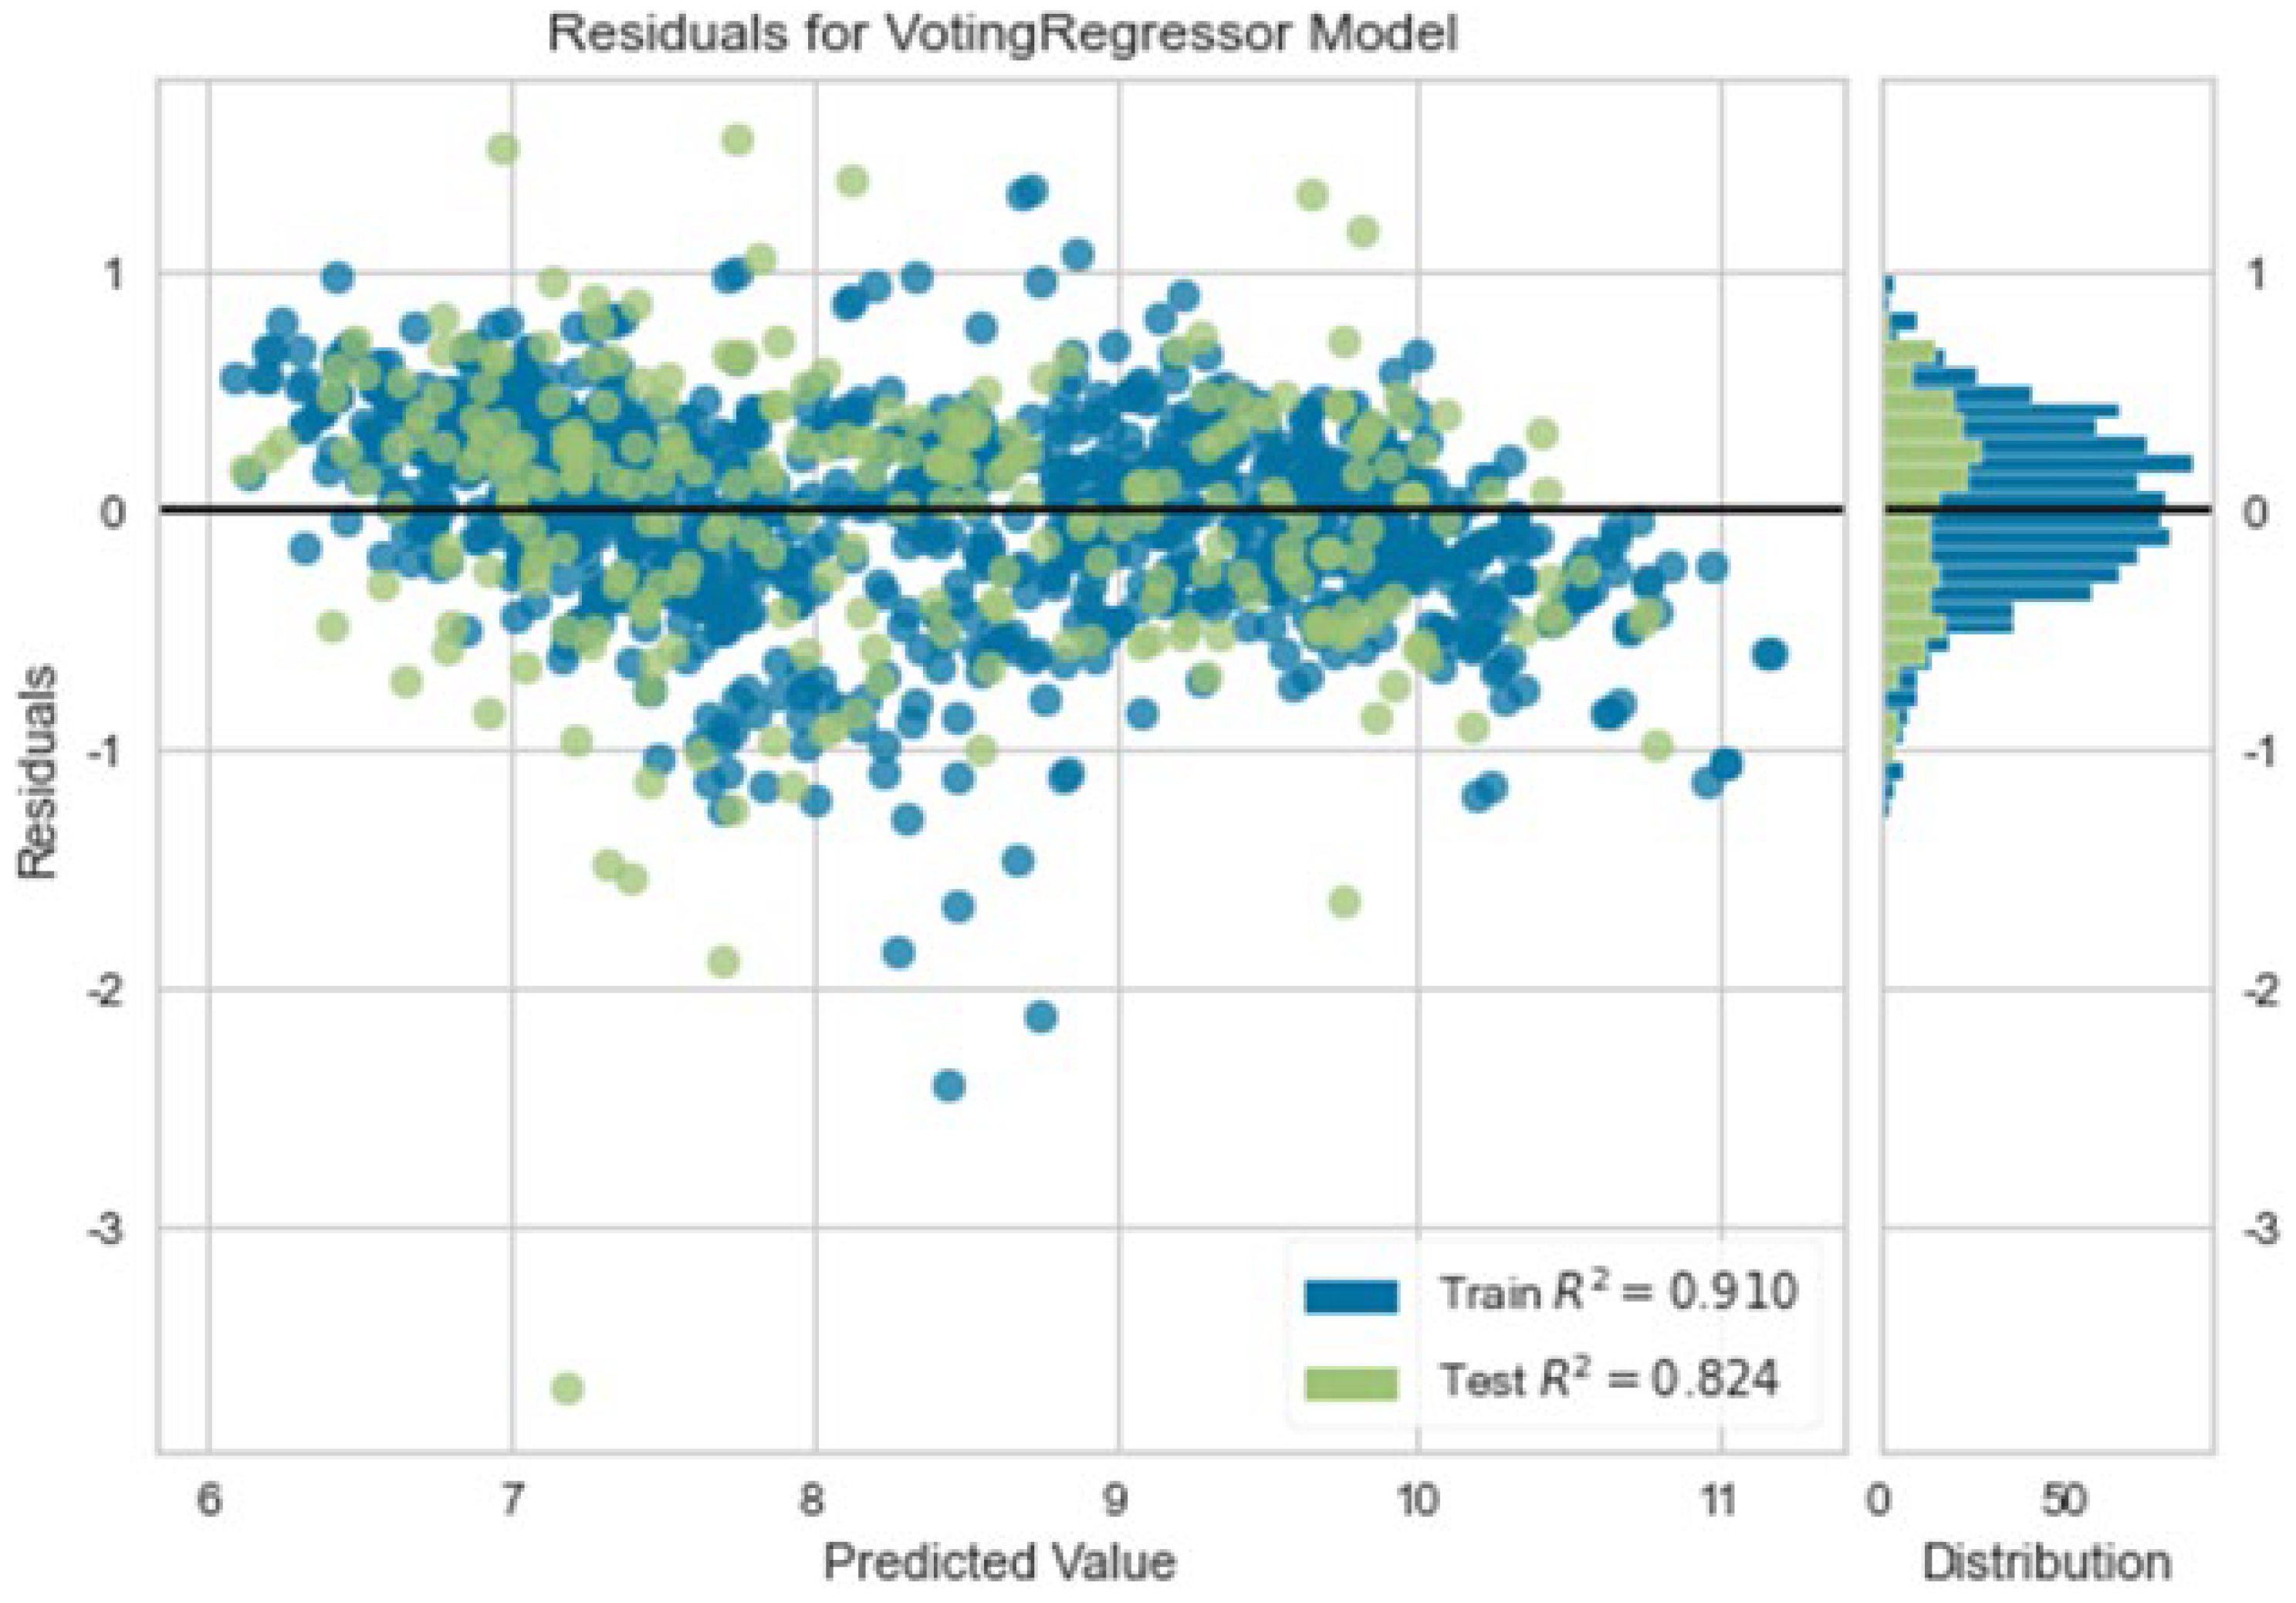
    • Actual vs. Predicted Values: For regression problems, plot a scatter plot comparing actual values with the model’s predicted values to visualize the model’s prediction accuracy.
    • Confusion Matrix for Classification Problems: Visualize the confusion matrix to understand how well the model classified different classes in a classification problem.
  • Feature Importance:
    • Feature Importance Plot: Generate a chart showing the most influential features for model prediction, especially applicable for tree-based deep learning models derived from algorithms like Random Forests.
  • Filters, Feature Maps, Activations:
    • CNN Filter Visualization: Visualize the patterns or features in images that each Convolutional Neural Network (CNN) filter responds to.
    • Feature Map Visualization: Visualize the activation of feature maps in intermediate layers of CNNs to understand what features the model has learned from the images.
  • Embedding Visualization:
    • 2D/3D Embedding of High-dimensional Data: Use dimensionality reduction techniques like t-SNE or PCA to project high-dimensional data into a 2D or 3D space. This allows for visual inspection of clustering tendencies or outliers in the data.
  • Interactive Dashboards:
    • Interactive Dashboards using Dash and Streamlit: Provide analysis results in interactive web applications, allowing users to explore the results by adjusting various parameters.

5.2. Implementation and Experimentation

5.2.1. Implementation and Experiment Environment

This study’s implementation and experimental environment are based on data from tangerine cultivation environments in seven regions of Jeju Island, using only seven selected factors out of the total 13 comprehensive factors related to tangerine production for deep learning-based sweetness prediction. Here are the details:
  • Regions: Limited to tangerine data from seven regions of non-greenhouse environments in Jeju Island (Yongheung, Seongsan, Tosan, Ara, Mureung, Hawon, Deokcheon).
  • Types of Data: Seven selected factors (acidity, sugar-acidity ratio, temperature, humidity, precipitation, insolation, wind speed) + sweetness.
Figure 4 below shows the data of the seven experimental target factors out of the 13 tangerine production factors for the seven regions. The reason for using only seven factors in this study is to apply them to smart farming. For sweetness prediction, it was intended to add weather data that can be artificially adjusted and acidity and sugar-acidity ratio directly related to sweetness. Of course, if all 13 comprehensive factors were applied, the sweetness prediction rate would be much higher. However, this study aims to use it in smart farming to produce fruits with better quality and higher sweetness. Therefore, the scope of the study was partially restricted.
3.
Data Occurrence: Actual data from October to November 2016 and from August to November annually from 2017 to 2023 were utilized.
4.
Data Augmentation: Due to the limited availability of openly accessible data, data augmentation techniques were employed to expand the dataset.
5.
Data Collection: Data on tangerine sweetness levels and weather conditions for various regions within Jeju were obtained from the National Institute of Horticultural & Herbal Science under the Rural Development Administration. Data augmentation techniques were used to prepare for data analysis to ensure reliability.
6.
Machine Learning Method: The PyCaret library was utilized to conduct deep learning.

5.2.2. Analytical Visualization of Experiments

In Figure 5, the distribution of the seven data elements is depicted, and it can be observed that graphs are formed according to the characteristics of each element. The y-axis represents density, while the x-axis represents numerical data for each component. The graphs corresponding to elements 1 (Area), 2 (year), and 10 (sweetness) should be disregarded as they are not data elements. Therefore, the layout of the data pertains to elements 3 (pH), 4 (sugar-acid ratio), 5 (temperature), 6 (humidity), 7 (precipitation), 8 (sunlight), and 9 (wind speed), demonstrating the formation of numerical data and density according to the characteristics of each element.
Figure 6 depicts the correlation between the seven data elements and sweetness. A value close to 1 indicates a positive correlation, while a value close to −1 indicates a negative correlation. As shown in the figure, the sugar-acid ratio, which has a high correlation, is displayed as 0.85, followed by the temperature at 0.76. Additionally, pH, which is relatively correlated with sweetness, is indicated as 0.65, and humidity as 0.47. Although the remaining elements show relatively lower correlations with sweetness, they are still important factors related to tangerine production, thus requiring careful consideration.
In Figure 7, the data correlation between the seven data elements and sweetness is depicted. The y-axis represents sweetness values, while the x-axis represents numerical data for each element. The graph illustrates that the correlation with sweetness varies greatly depending on the characteristics of each component, as indicated by the distribution of dense numerical data along the straight lines corresponding to each element. Except for the sugar-acid ratio, temperature, acidity, and humidity among the seven experimental factors, the remaining elements do not directly correlate with sweetness. However, they are crucial factors in tangerine production, as evidenced by their influence on sweetness based on the density of the graph according to the numerical values of each element over time.
Figure 8 depicts the training and prediction accuracy related to sweetness for seven regions plus seven data elements. A relatively good hit rate of 91% is achieved during deep learning training, indicating satisfactory performance. However, a relatively lower prediction rate of 82.4% is observed during testing. These figures reflect the application of only seven data elements out of the 13 factors determining sweetness. Despite not achieving the highest accuracy, the results are still relatively satisfactory, suggesting significant potential for application in smart farming.

5.3. Analysis of Experiment Contents

This experiment achieved a satisfactory hit rate of 82.4% using only seven out of 13 comprehensive factors determining sweetness, including acidity, sugar-acid ratio, temperature, humidity, precipitation, sunlight, and wind speed. These factors were applied in the experiment, reflecting the potential of using five meteorological data and two sweetness-related factors for application in smart farming. The results suggest that it is possible to achieve high-quality tangerine production with high sweetness through appropriate adjustments of the five meteorological data factors.
Another application of this research is the ability to roughly estimate tangerines’ quality (sweetness) for a given year based on predicting tangerine sweetness. By utilizing such analytical data, predicting changes in the distribution market is possible. For instance, if the expected results indicate high sweetness, it implies improved tangerine quality, leading to higher prices and increased farmer income. Based on these data, farmers, distribution markets, and related institutions can appropriately respond to various situations regarding shipment timing and price determination (Table 2).

6. Discussion

Our research aims to enhance the sweetness and quality of tangerines by integrating five key meteorological data points into smart farming practices and adjusting these variables based on precise timing and environmental conditions [27]. The next phase of our study will thoroughly analyze the correlations among these meteorological factors. By understanding these relationships, we can develop a more sophisticated application of these data to smart farms, adapting to varying climate conditions and the specific growth stages of tangerines in a time-series framework. This approach is expected to enable more precise and effective adjustments to the meteorological conditions, thereby optimizing the production of high-quality, high-sweetness tangerines [28].
If this methodology proves successful, it holds potential for broader application to other fruits with similar environmental requirements, such as strawberries or other crops that thrive in outdoor or smart farming systems. Implementing analogous strategies for these fruits could similarly enhance their sweetness and quality, leveraging the insights gained from our tangerine-focused research. Such advancements could significantly improve fruit production practices, yield quality, and agricultural efficiency across various crops [29,30].
By leveraging smart farming technologies and precise meteorological data, farmers can improve the quality of their produce, reduce resource wastage, and increase resilience against climate variability. This could lead to more sustainable and profitable agricultural practices, benefiting producers and consumers.

7. Conclusions

Jeju tangerines are characterized by significant annual price fluctuations due to long distances and supply instability, leading to high price volatility in the agricultural market. This uncertainty and risk increase ultimately leads to income instability for farmers. Price instability due to price fluctuations can also lead to inefficient resource use and distortions in the resource allocation and income distribution functions of prices. Therefore, it inevitably causes disadvantages to all economic entities related to tangerines, including producers, distributors, processors, and consumers.
In this paper, big data analysis and sweetness prediction for tangerines in seven regions of Jeju (Yongheung, Seongsan, Tosan, Ara, Mureung, Hawon, Deokcheon) were conducted using the PyCaret library, which automates machine learning workflows, making it easy and fast to create and deploy models. The process involved data preprocessing, model training, parameter tuning, model comparison, and model analysis, followed by visualization.
This experiment achieved a satisfactory hit rate of 82.4% using only seven out of 13 comprehensive factors determining sweetness, including acidity, sugar-acid ratio, temperature, humidity, precipitation, sunlight, and wind speed. Although applying all 13 factors would likely yield a prediction rate of over 90%, this study experimented with only five meteorological data (temperature, humidity, precipitation, sunlight, wind speed) and two sweetness-related factors (acidity, sugar-acid ratio) that can be applied in smart farming. It is expected that adjusting the five meteorological data factors appropriately will lead to the possibility of high-sweetness and high-quality tangerine production. Another potential application of these research results is to estimate tangerine quality (sweetness) for the year based on predicting tangerine sweetness. It is possible to predict changes in the distribution market by utilizing such analytical data. Therefore, if the expected results indicate high sweetness, this implies improved tangerine quality, leading to higher prices and increased farmer income. Based on these data, farmers, distribution markets, and related institutions can appropriately respond to various situations regarding shipment timing and price determination.
In future research, if these findings are successfully realized, similar applications can be extended to other types of fruits with environments identical to tangerines (such as strawberries or other crops suitable for outdoor cultivation or smart farming). The goal is to contribute to the improvement of sweetness and fruit quality.

Author Contributions

Methodology, Y.K.; Formal analysis, Y.K.; Resources, Y.-C.B.; Writing—original draft, Y.K.; Writing—review & editing, Y.K., Y.-C.B. and S.-J.L.; Visualization, Y.K.; Supervision, Y.-C.B. and S.-J.L.; Project administration, S.-J.L. All authors have read and agreed to the published version of the manuscript.

Funding

This result was supported by the “Regional Innovation Strategy (RIS)” through the National Research Foundation of Korea (NRF) funded by the Ministry of Education (MOE).

Data Availability Statement

Data are contained within the article.

Conflicts of Interest

The authors declare no conflict of interest.

References

  1. Available online: https://www.public.harvestai.com/ (accessed on 7 May 2024).
  2. Seo, D.-M. Development of an Artificial Intelligence Model for Predicting Citrus Sugar Content based on Meteorological Data. J. Korea Contents Assoc. 2021, 21, 35–43. [Google Scholar]
  3. Available online: https://www.nihhs.go.kr/usr/main/mainPage.do (accessed on 7 May 2024).
  4. Available online: http://jcitrus.or.kr/index.htm (accessed on 7 May 2024).
  5. Fruit Growth and Quality Management System. Available online: https://fruit.nihhs.go.kr/citrus/citrusMain.do (accessed on 7 May 2024).
  6. Yoon, S.H.; Choi, M.H.; Park, J.Y. Data-driven smart farm prospects. In Proceedings of the Conference on Communications and Information Sciences, February 2022; Volume 2022, pp. 930–931. Available online: https://www.dbpia.co.kr/journal/articleDetail?nodeId=NODE11047759 (accessed on 7 May 2024).
  7. Park, S.K. Trends and Development of Smart Farm Prospect. In Proceedings of the Conference on Korean Society for Food Engineering, 2022; Volume 2017, pp. 49–78. Available online: https://db.koreascholar.com/Article/Detail/352644 (accessed on 7 May 2024).
  8. Available online: http://www.kidshankook.kr/news/articleView.html?idxno=1316 (accessed on 7 May 2024).
  9. Min, K.-B.; Park, H.-J. A Study on the Patent Trend of ‘Smart Farm’ in Domestic through Network Analysis. J. Korean Inst. Inf. Electron. Commun. Technol. 2022, 10, 413–422. [Google Scholar]
  10. Hyun, J.W.; Lee, S.C.; Ihm, Y.B.; Kim, D.H.; Ko, S.W.; Kim, K.S. Protective Effect of Iminoctadine tris(albesilate) and Kresoxim-methyl Fungicides to Citrus Postharvest Diseases caused by Penicillium spp. Korean J. Pestic. Sci. 2001, 5, 37–44. [Google Scholar]
  11. Kim, B.S.; Ko, S.B.; Moon, T.W.; Kim, M.S. A Review on the Structure of Processing, Storage, and Marketing in Jeju Citrus Industry; Research Report; Korea Rural Economic Institute: Naju, Republic of Korea, 2017; pp. 41–50. [Google Scholar]
  12. Kang, T.H. Time-Series Analysis of Livestock Prices and Volatilities. Korean J. Agric. Manag. Policy 2007, 34, 369–388. [Google Scholar]
  13. Yoon, B.S. Price Volatility, Seasonality and Day-of the Week Effect in Meat Markets. Korean J. Agric. Manag. Policy 2008, 35, 21–38. [Google Scholar]
  14. Kang, T.H. The Influences of Volume on Wholesale Price Stabilities for Fresh Vegetables. J. Agric. Econ. 2008, 49, 21–38. [Google Scholar]
  15. Jeong, K.S.; Ham, Y.K. The Price Volatility Spillover in Hanwoo Marketing Channel. Korean J. Agric. Manag. Policy 2006, 33, 716–728. [Google Scholar]
  16. Jeju Special Self-Governing Province. An Ordinance on the Production and Marketing of Tangerine. 2019. Available online: https://www.law.go.kr/LSW//ordinInfoP.do?ordinSeq=1285786 (accessed on 7 May 2024).
  17. Ko, B.-H. A Study on Price Volatility and Properties of Time-series for the Tangerine Price in Jeju. J. Korea Acad.-Ind. Coop. Soc. 2020, 21, 212–217. [Google Scholar]
  18. Kang, T.H. Nonlinear Dynamics of Vegetable Prices. J. Agric. Econ. 2004, 45. [Google Scholar]
  19. VanderPlas, J. Python Data Science Handbook: Essential Tools for Working with Data; O’Reilly Media, Inc.: Sebastopol, CA, USA, 2016. [Google Scholar]
  20. Gong, S.-W.; Hwang, D.-Y. A Study of Big Data Domain Automatic Classification Using Machine Learning. J. Korea Big Data Soc. 2018, 3, 11–18. [Google Scholar]
  21. Cootes, T.F.; Ionita, M.C.; Lindner, C.; Sauer, P. Robust and Accurate Shape Model Fitting Using Random Forest Regression Voting. In Proceedings of the Computer Vision–ECCV 2012: 12th European Conference on Computer Vision, Florence, Italy, 7–13 October 2012; pp. 278–291. [Google Scholar]
  22. PyCaret Low-Code Machine Learning. Available online: https://pycaret.org/ (accessed on 21 April 2022).
  23. Roh, S.; Kang, E.; Park, D.; Kang, Y.-M. A Sweet Persimmon Grading Algorithm using Object Detection Techniques and Machine Learning Libraries. J. Korea Multimed. Soc. 2022, 25, 769–782. [Google Scholar] [CrossRef]
  24. Wang, S.; Xie, W.; Yan, X. Effects of Future Climate Change on Citrus Quality and Yield in China. Sustainability 2022, 14, 9366. [Google Scholar] [CrossRef]
  25. Dong, Z.; Chen, M.; Srivastava, A.K.; Mahmood, U.H.; Ishfaq, M.; Shi, X.; Zhang, Y.; Moussa, M.G.; Li, X.; Hu, C.; et al. Climate changes altered the citrus fruit quality: A 9-year case study in China. Sci. Total Environ. 2024, 923, 171406. [Google Scholar] [CrossRef] [PubMed]
  26. Kader, A.A. Flavor Quality of Fruits and Vegetables. J. Sci. Food Agric. 2008, 88, 1863–1868. [Google Scholar] [CrossRef]
  27. Amiri-Zarandi, M.; Dara, R.A.; Duncan, E.; Fraser, E.D.G. Big Data Privacy in Smart Farming: A Review. Sustainability 2022, 14, 9120. [Google Scholar] [CrossRef]
  28. Rodriguez-Casado, A. The Health Potential of Fruits and Vegetables Phytochemicals: Notable Examples. Crit. Rev. Food Sci. Nutr. 2016, 56, 1097–1107. [Google Scholar] [CrossRef] [PubMed]
  29. Busatto, N.; Tadiello, A.; Trainotti, L.; Costa, F. Climacteric ripening of apple fruit is regulated by transcriptional circuits stimulated by cross-talks between ethylene and auxin. Plant Signal. Behav. 2017, 12, e1268312. [Google Scholar] [CrossRef] [PubMed]
  30. Trivedi, P.; Nguyen, N.; Hykkerud, A.L.; Häggman, H.; Martinussen, I.; Jaakola, L.; Karppinen, K. Developmental and environmental regulation of cuticular wax biosynthesis in fleshy fruits. Front. Plant Sci. 2019, 10, 431. [Google Scholar] [CrossRef] [PubMed]
Figure 1. Seven open-field environments on Jeju Island.
Horticulturae 10 00630 g001
Figure 2. The webpage providing the tangerine sweetness data is the fruit quality information webpage [5].
Horticulturae 10 00630 g002
Figure 3. The webpage providing the weather data is the weather monitoring webpage [5].
Horticulturae 10 00630 g003
Figure 4. Data table of the 7 citrus production elements in 7 regions.
Horticulturae 10 00630 g004
Figure 5. Distribution layout of the 7 data elements.
Horticulturae 10 00630 g005
Figure 6. Correlation between the 7 data elements and sugar content.
Horticulturae 10 00630 g006
Figure 7. Data correlation between the 7 data elements and sugar content.
Horticulturae 10 00630 g007
Figure 8. Sugar content training and sugar content prediction hit rate for 7 regions plus 7 data elements.
Horticulturae 10 00630 g008
Table 1. The 13 comprehensive elements of citrus production and the 7 elements applied in this study.
NoFactorsCharacteristicsApplicability
1Longitudinal DiameterThis is an indicator for measuring the length of a fruit and indicates the vertical length of the fruit.X
2Transverse DiameterThis is an indicator of the width of the fruit and refers to the horizontal length of the widest part.X
3Fruit WeightThis refers to the total weight of one fruit and is a basic indicator to evaluate the size and growth of the fruit.X
4Pulp WeightThis refers to the weight of the flesh, which is the edible part of the fruit and is the weight of the pure flesh excluding the non-edible parts from the total weight of the fruit.X
5Juice YieldThis is the ratio of the amount of juice that can be extracted from a fruit divided by the total weight of the fruit, indicating the efficiency of juice production.X
6Peel ThicknessThis indicates the thickness of the fruit’s outer skin and has a significant impact on its protection and texture.X
7AcidityThis is the acid concentration in the fruit and is an indicator to evaluate the sourness and quality of the fruit.O
8Sugar to Acid RatioThis is the ratio of the sweetness and acidity of the fruit and is an indicator to evaluate the balance of the taste of the fruit.O
9TemperatureThis represents the temperature of the air and is an important environmental factor for the growth and development of fruit.O
10HumidityThis indicates the moisture content in the air and affects the moisture absorption and transpiration of plants.O
11PrecipitationThis refers to the amount of precipitation over a certain period of time and is essential for the growth of plants as a source of water.O
12Solar RadiationThis is the amount of sunlight reaching a certain area and plays an important role in photosynthesis and energy production in plants.O
13Wind SpeedThis refers to the speed of the wind and affects the transpiration and temperature control of plants.O
Table 2. Comprehensive analysis through experiments.
DivisionContents
Experiment Purpose and Meaning
-
Sugar content forecast for the current year.
-
Distribution flow prediction and response.
-
Serves as an important factor in determining the shipment date and price of farmers and related organizations.
-
Identify correlation with weather data.
-
Suggests applicability to smart farms.
Region
-
7 regions of Jeju (Yongheung, Seongsan, Tosan, Ara, Mureung, Hawon, Deokcheon).
Citrus Production Data
-
7 factors (acidity, sugar-acid ratio, temperature, humidity, rainfall, solar radiation, wind speed) + sugar content.
Data Occurrence Period
-
438 time series actual data from October to November 2016 and August to November 2017 to 2023.
Data Augmentation
-
1314 data augmentations through data augmentation technology.
Data Collection
-
Data on citrus sugar content and citrus production elements by region in Jeju provided by the National Institute of Horticultural and Herbal Science, Rural Development Administration.
Machine Learning
-
PyCaret library.
Prediction Hit Rate
-
82.4%.
-
Despite applying only 7 partial elements out of 13 comprehensive elements that determine sugar content, the hit rate was good.
-
Applies only 5 weather-data and 2 sugar-content factors (acidity, sugar-acid ratio) applicable to smart farms.
Application and Expected Effects
-
The quality (sugar content) of citrus fruits of the year can be determined almost accurately.
-
Approximately predict price changes in the distribution market.
-
Farmers and related organizations can respond appropriately to the distribution flow, including shipment timing and price decisions.
Disclaimer/Publisher’s Note: The statements, opinions and data contained in all publications are solely those of the individual author(s) and contributor(s) and not of MDPI and/or the editor(s). MDPI and/or the editor(s) disclaim responsibility for any injury to people or property resulting from any ideas, methods, instructions or products referred to in the content.

