Article

Higher Light Intensity Combined with Early Topping Improves the Yield and Quality of Pea Shoots in LED Plant Factory

Key Laboratory of Agricultural Engineering in Structure and Environment of MARA, College of Water Resources & Civil Engineering, China Agricultural University, Beijing 100083, China
*
Author to whom correspondence should be addressed.
Horticulturae 2024, 10(6), 650; https://doi.org/10.3390/horticulturae10060650
Submission received: 24 May 2024 / Revised: 15 June 2024 / Accepted: 16 June 2024 / Published: 19 June 2024
(This article belongs to the Special Issue Soilless Culture and Hydroponics in Closed Systems)

Abstract

:
Pea shoots is a popular vegetable in certain regions of the world due to their unique taste and abundance of health-promoting phytochemicals. The perishable nature and susceptibility to root rot of pea shoots necessitate a new soilless production system located close to the market. This study compared the growth of pea shoots using various cultivation methods in an LED plant factory. The results showed that early topping (4 days after transplanting, ET) promoted early harvest compared to later topping (20 days after transplanting, LT) and increased the number of harvested shoots by extending the harvest time to 2.8 times, ultimately resulting in a substantial yield improvement. Moreover, the yield of ET with a lower planting density (72 plants m−2, ET-LD) was 8.7% higher than ET with a higher planting density (126 plants m−2, ET-HD). Particularly, the average shoot fresh weight (AFW) under ET-LD exceeded that of ET-HD by 48.9%. It is advisable to consider adopting ET-LD for the cultivation of pea shoots in LED plant factories. Based on ET-LD, the yield, nutritional quality, and light use efficiency of pea shoots were further explored at different stages under three levels of light intensity (50, 100, and 150 μmol m−2·s−1). Contrasted against a light intensity of 50 μmol m−2·s−1, AFW, number of harvested shoots, and total fresh yield under a light intensity of 150 μmol m−2·s−1, increased by 60.2%, 62.8%, and 165.1%, respectively. Meanwhile, AFW, photosynthetic capacity, soluble sugar and vitamin C levels in leaves, as well as light use efficiency and photon yield, initially increased and then decreased with the extension of the planting period. Among these, soluble sugar, light use efficiency, and photon yield started to decrease after reaching the maximum value at 60–70 days after transplanting. In conclusion, a light intensity of 150 μmol m−2·s−1 with a photoperiod of 16 h d−1 using LEDs, combined with early topping within a planting period of 60–70 days, proves to be suitable for the hydroponic production of pea shoots in LED plant factories.

1. Introduction

Tender shoots of peas (Pisum sativum L.), including 2–4 pairs of leaves and immature tendrils and may also include small flower buds or blossoms, are referred to as pea shoots [1]. Pea shoots have become popular as a specialty vegetable in certain regions of Asia and Africa due to their mild “pea-pod” flavor, characterized by a delicate, crisp, light, and refreshing taste [2,3]. Notably, the levels of chlorophyll, carotenoids, vitamin C, total phenols, flavonoids, and other bioactive compounds, along with their antioxidant capacity in the leaves, exceed those found in lettuce, spinach, and celery [4,5]. Concurrently, it is also a traditional vegetable in China, which was cultivated on a certain scale in Yunnan, Sichuan, Chongqing, and other provinces [6]. The two primary cultivation methods for pea shoots are open-field cultivation and greenhouse cultivation with supplementary lighting, with the former being more prevalent. In open-field cultivation, peas are ordinarily sown in autumn, with a plant spacing of 10–15 cm and row spacing of 20–30 cm, 2–3 seeds per hole, resulting in 30 plants m−2. The initial harvest typically begins 40 to 50 days after sowing, followed by subsequent harvests approximately every 7 to 15 days, continuing until early February to early April of the following year [6]. Each cycle allows for 6 to 8 harvests, resulting in a yield of 1.87 kg m−2 [1,6]. In greenhouse cultivation, such as in Canada, pea shoots provide a low-heating alternative compared to traditional greenhouse vegetables like tomatoes, cucumbers, and peppers. However, supplemental lighting is crucial for successful production due to the limited natural light in winter [7]. Supplemental lighting in the greenhouse cultivation of peas has been shown to effectively enhance pea shoot and pod production [3,7,8]. For example, Kong et al. [7] conducted experiments on supplemental lighting for pea shoot cultivation in a greenhouse. The first harvest, targeting shoots with one fully unfolded leaf and shoot tip, was performed 32 days after sowing. Subsequent harvests occurred every 10-14 days, continuing until over 50% of the plants reached the flowering stage. The findings revealed that increasing the daily light integral (DLI) from 5.3 to the range of 8.1 to 9.8 mol m−2 d−1 resulted in an almost fourfold increase in cumulative yield.
Pea shoot production also encounters additional constraints. Harvesting, for example, is labor-intensive and substantially increases production costs in regions with high labor expenses [1]. Additionally, once harvested, pea shoots should not be squeezed or stored at room temperature for extended periods. Instead, they should be promptly sold or maintained at a temperature of 0–4 °C to preserve freshness. The perishable nature of pea shoots makes them suitable solely for local cultivation and distribution, rather than for long-distance transport. This factor presents an additional obstacle to achieving the widespread mass production of pea shoots [7]. Consequently, it is necessary to explore a suitable cultivation method that maintains high yield, high efficiency, and proximity to consumers to facilitate the development of this industry.
Recently, urban residents in Asian countries such as Japan and China have increasingly adopted indoor cultivation using plant factories with artificial light (PFALs), including household PFALs. This trend is expected to promote a new lifestyle of local production and local consumption [9,10]. PFALs are closed plant production systems designed to achieve higher crop yields and superior quality by precisely controlling the growth environment. These systems efficiently alleviate the influence of unfavorable weather conditions and unexpected emergencies on plant growth, ensuring continuous and optimized cultivation [11,12]. Additionally, the application of light-emitting diode (LED) lighting in PFALs provides the possibility of precisely regulating the light environment for crops. Previous studies have shown that increasing light intensity within a defined range enhances photosynthesis, resulting in a proportional increase in dry mass accumulation [13]. The LED lighting environment has been identified as a key factor influencing the nutritional quality of leafy vegetables [14]. On the other hand, agronomic practices (such as topping [15] and adjusting planting density [16,17]) can also affect crop yield and quality. Combining the advantages of plant factory technology and LED lighting technology, we propose that PFALs have the potential to address the challenge of pea shoots being unsuitable for long-distance transportation due to their perishable nature. Furthermore, PFAL technology, combined with agronomic practices, offers promising prospects for improving both the yield and quality of pea shoots. Therefore, there is an urgent need to develop cultivation methods and appropriate light recipes for pea shoots in PFALs.
The main objectives of this study were to establish a preliminary cultivation method and determine an appropriate light recipe for pea shoot production in PFALs. To achieve this, we conducted a comprehensive comparison of the growth of pea plants and the yield of pea shoots under various cultivation methods, while recording the phenological stages. Additionally, we explored the effects of light intensity combined with early topping on the growth of pea plants and analyzed the yield, nutritional quality, and light energy use efficiency of pea shoots at different stages.

2. Materials and Methods

2.1. Plant Materials and Growth Conditions

Pea seeds (Pisum sativum L. cv. Zhongyang) with full grains were selected, then the seeds were washed and soaked for 24 h before being placed in a petri dish to promote germination. After three to four days, the soaked seeds were placed in polyurethane sponge cubes (L23 mm × W 23 mm × H23 mm, manufactured by Shengjie Sponge Products Factory, China) in a seedling tray (L330 mm × W240 mm × H50 mm) filled with a nutrient solution in an environmentally controlled plant factory with artificial lighting (China Agricultural University, Beijing, China). The stock solution comprised the following compounds: Ca(NO3)2·4H2O, KNO3, NH4H2PO4, KH2PO4, MgSO4·7H2O, Na2B4O7·10H2O, MnSO4·H2O, ZnSO4·7H2O, CuSO4·5H2O, Na2MoO4·2H2O, and Na2Fe7-DTPA, with concentrations of 1086.0, 521.0, 139.0, 22.0, 476.0, 2.7, 1.9, 2.7, 2.4, 0.5, and 10.0 mg L−1, respectively. The electrical conductivity (EC) was adjusted with RO water ranging from 0.6 to 1.2 mS cm−1, while maintaining the pH between 5.5 and 6.5. The seedling tray was placed in a light environment with a PPFD of 100 µmol m−2 s−1 and photoperiod of 16 h d−1. Air temperatures and relative humidity of the growth ambient were maintained at 18–22 °C and 60%–75%, respectively. Approximately nine to ten days later, uniform and healthy seedlings were selected for trial treatments.

2.2. Experimental Design

For the topping method trial, pea seedlings with well-developed roots and consistent growth were chosen for cultivation trials involving late topping (LT) and early topping (ET), with different planting densities in an environmentally controlled plant factory with artificial lighting, totaling three treatments (Table 1). The cultivation shelf for LT consisted of one Acrylonitrile butadiene styrene (ABS) cultivation bed (L1200 mm × W600 mm × H70 mm) and one ABS board with a thickness of 4 mm and planting holes (20 mm in diameter). Each experimental unit (L590 mm × W400 mm) was planted with 9 plants, replicated three times, resulting in a planting density of 39 plants m−2. In contrast, the cultivation shelf for ET consisted of three ABS cultivation beds, each with a layer height of 38 cm. Each experimental unit (L590 mm × W400 mm) under ET-LD was planted with 17 plants, replicated three times, resulting in a planting density of 72 plants m−2, while each experimental unit under ET-HD was planted with 30 plants, also replicated three times, resulting in a planting density of 126 plants m−2. All plants were grown under a PPFD of 100 µmol m−2·s−1 and a photoperiod of 16 h d−1, provided by white plus red LEDs (WR-16 W, Beijing Lighting Valley Technology Co., Ltd., Beijing, China), with a red to blue ratio (R/B ratio) of 4.4. Among them, the LT method had 7 LED lamps installed on the top of the plants, and the ET method used 4 LED lamps, resulting in an average PPFD of 100 µmol m−2·s−1 for the canopy when the seedlings were transplanted to the cultivation shelf. Healthy seedlings were selected and transplanted to the cultivation shelf at 14 days after sowing. Late topping (LT) involved topping of the pea plant with a height of 50–60 cm at 20 days after transplanting, based on the open field production method of topping at 30–40 days after sowing. Early topping (ET) involved topping the plants when they reached a height of 20–30 cm, ensuring that each plant had 3-4 axillary buds to promote branching. This process was typically done around 4 days after transplanting. Each subsequent harvest every 4–6 days was determined based on whether the length of the pea shoots reached 10–15 cm.
For the light intensity trial, we evaluated the effect of light intensity combined with early topping on the yield and quality of pea shoots in an environmentally controlled plant factory with artificial lighting, totaling three treatments (Table 1). The seedlings were transplanted on a shelf with three layers with a layer height of 38 cm, and a nylon rope with 52 grids was constructed 10–15 cm above the planting board to hold the pea seedlings and prevent them from falling. Each experimental unit (L590 mm × W400 mm) was planted with 17 plants, resulting in a planting density of 72 plants m−2, and three replicates were implemented. The seedlings of all treatments grown under the photoperiod of 16 h d−1 were provided by white plus red LEDs with an R/B ratio of 4.4. The light intensity in the canopy of ET-P050, ET-P100, and ET-P150 was ensured to reach 50, 100, and 150 μmol m−2·s−1, respectively, when the seedlings were transplanted to the cultivation shelf by installing 2, 4, and 8 LED lamps on the top 15 cm of the plants.
Following transplanting, a water level of about 5 cm was maintained within the cultivation bed to facilitate the absorption of the nutrient solution by the seedling roots. The composition of the hydroponic nutrient solution remained the same as that used during the seedling stage. The pH range of the nutrient solution was 5.5–6.5, and the EC value was 2.2–2.6 mS cm−1 (the pH value of tap water was 7.59 and the EC value was 0.5 mS cm−1). A water pump was used to increase the dissolved oxygen in the nutrient solution for a 24-h cycle of irrigation, with a flow rate of approximately 10 L min−1. The ambient air temperatures and relative humidity were kept within the range of 20 ± 2 °C and 60% ± 10%, respectively.

2.3. Measurements

2.3.1. Yield of Pea Shoots

The total number of harvested pea shoots in each treatment was recorded, and the total fresh weight was measured with an electronic analytical balance (FA1204B, BioonGroup, Shanghai, China). The total fresh weight and total number of harvested pea shoots for each treatment were calculated by accumulating the fresh weight and number of pea shoots per harvest respectively. The average shoot fresh weight (AFW) of the topping method trial was calculated using the mean values from each harvest. For the light-intensity trial, the FW was determined by randomly selecting five pea shoots from each treatment at 15, 24, 53, and 65 days after transplanting (DAT), and calculating the mean values. This procedure was repeated five times for each treatment. Subsequently, the selected pea shoots were dried in an oven at 105 °C for 1 h, followed by 75 °C for 48 h. The dry weight of five pea shoots was measured, and the average shoot dry weight (ADW) was calculated. The water content was calculated according to the Equation (1):
W a t e r   c o n t e n t % = A F W s A D W s A F W s × 100

2.3.2. Leaf Gas Exchange Measurement

The LI-6400XT portable photosynthesis system (LI-COR, Inc., Lincoln, NE, USA) was utilized to assess the photosynthetic parameters of both the young and mature leaves of the pea plants. These parameters encompassed the net photosynthetic rate (Pn, µmol m−2·s−1), stomatal conductance (Gs, mol m−2·s−1), intercellular CO2 concentration (Ci, µmol mol−1), and transpiration rate (Tr, mmol m−2·s−1). Measurements were conducted at 41 and 80 days after transplanting, correspondingly. The ambient parameters of the chamber were set as follows: the light intensity remained consistent with the trial treatments, while the airflow rate, temperature, and CO2 concentration were maintained at 500 µmol s−1, 25 °C, and 400 µmol mol−1, respectively, which were the same across all treatments.

2.3.3. Chlorophyll Fluorescence Characteristics

Chlorophyll fluorescence parameters were measured using a multifunctional plant efficiency analyzer (M-PEA, Hansatech, Inc., London, UK) at 41 and 80 days after transplanting. The PSII maximal photochemical efficiency (Fv/Fm) of the new and old leaves of the pea plants were measured after a dark adaptation of 30 min.

2.3.4. Quality Determination

The quality of the leaves and stems of the pea shoots in this study was assessed at 15, 36, and 74 days after transplanting, including the content determination of soluble sugar, soluble protein, vitamin C, and nitrate, and these were determined by an anthrone colorimetric method [18], Coomassie brilliant blue G-250 method [19], 2,6-dichlorophenol indophenol titration method [18], and sulfosalicylic acid colorimetric method [20], respectively.

2.3.5. Light Energy Use Efficiency

Two indexes in this study, light use efficiency (LUE, [12]) and photon yield (PY, [21]), were used to characterize the light energy use efficiency of pea shoots at different times and stages, according to Equations (2) and (3).
L U E = f × D P A R L
P Y = F W T D L I × D A T
where, f is the conversion coefficient from dry mass to chemical energy, about 20 MJ kg−1; D (kg m−2) is the total dry weight of the pea shoots harvested per unit area after transplanting; PARL (MJ m−2) is the intercepted effective photosynthetic radiation per unit area of the pea plants after transplanting, with the photon efficacy of the LED lamps being 2.6 µmol J−1; FWT (g m−2) is the total fresh weight of pea shoots harvested per unit area; DLI (mol m−2 d−1) is the amount of light energy received by the canopy of the pea plants per unit area in a day; and DAT (d) is the days after transplanting.

2.4. Statistical Analysis

The data in this study were presented as mean ± standard deviation (SD). Statistical analysis was performed using one-way analysis of variance (ANOVA), followed by Fisher’s least significant difference (LSD) test to compare the relevant means. Significance levels were set at p < 0.01 and p < 0.05. All statistical analyses were conducted using IBM SPSS 26 (IBM Corp., Armonk, NY, USA). Based on the data trends, the logistic growth curve (Y = YM × Y0/((YM − Y0) × exp (−k × X) + Y0)) of GraphPad Prism 9 (v9.4.0, GraphPad Software, San Diego, CA, USA) was selected to fit the fresh weight per unit area, the number of harvested of pea shoots, as well as LUE and PY of whole cultivation period. A second-order polynomial (Y = A + B × X + C × X2) was chosen to fit the nutritional quality, LUE, and PY of the pea shoots.

3. Results

3.1. Growth of Pea Shoots under Different Cultivation Methods

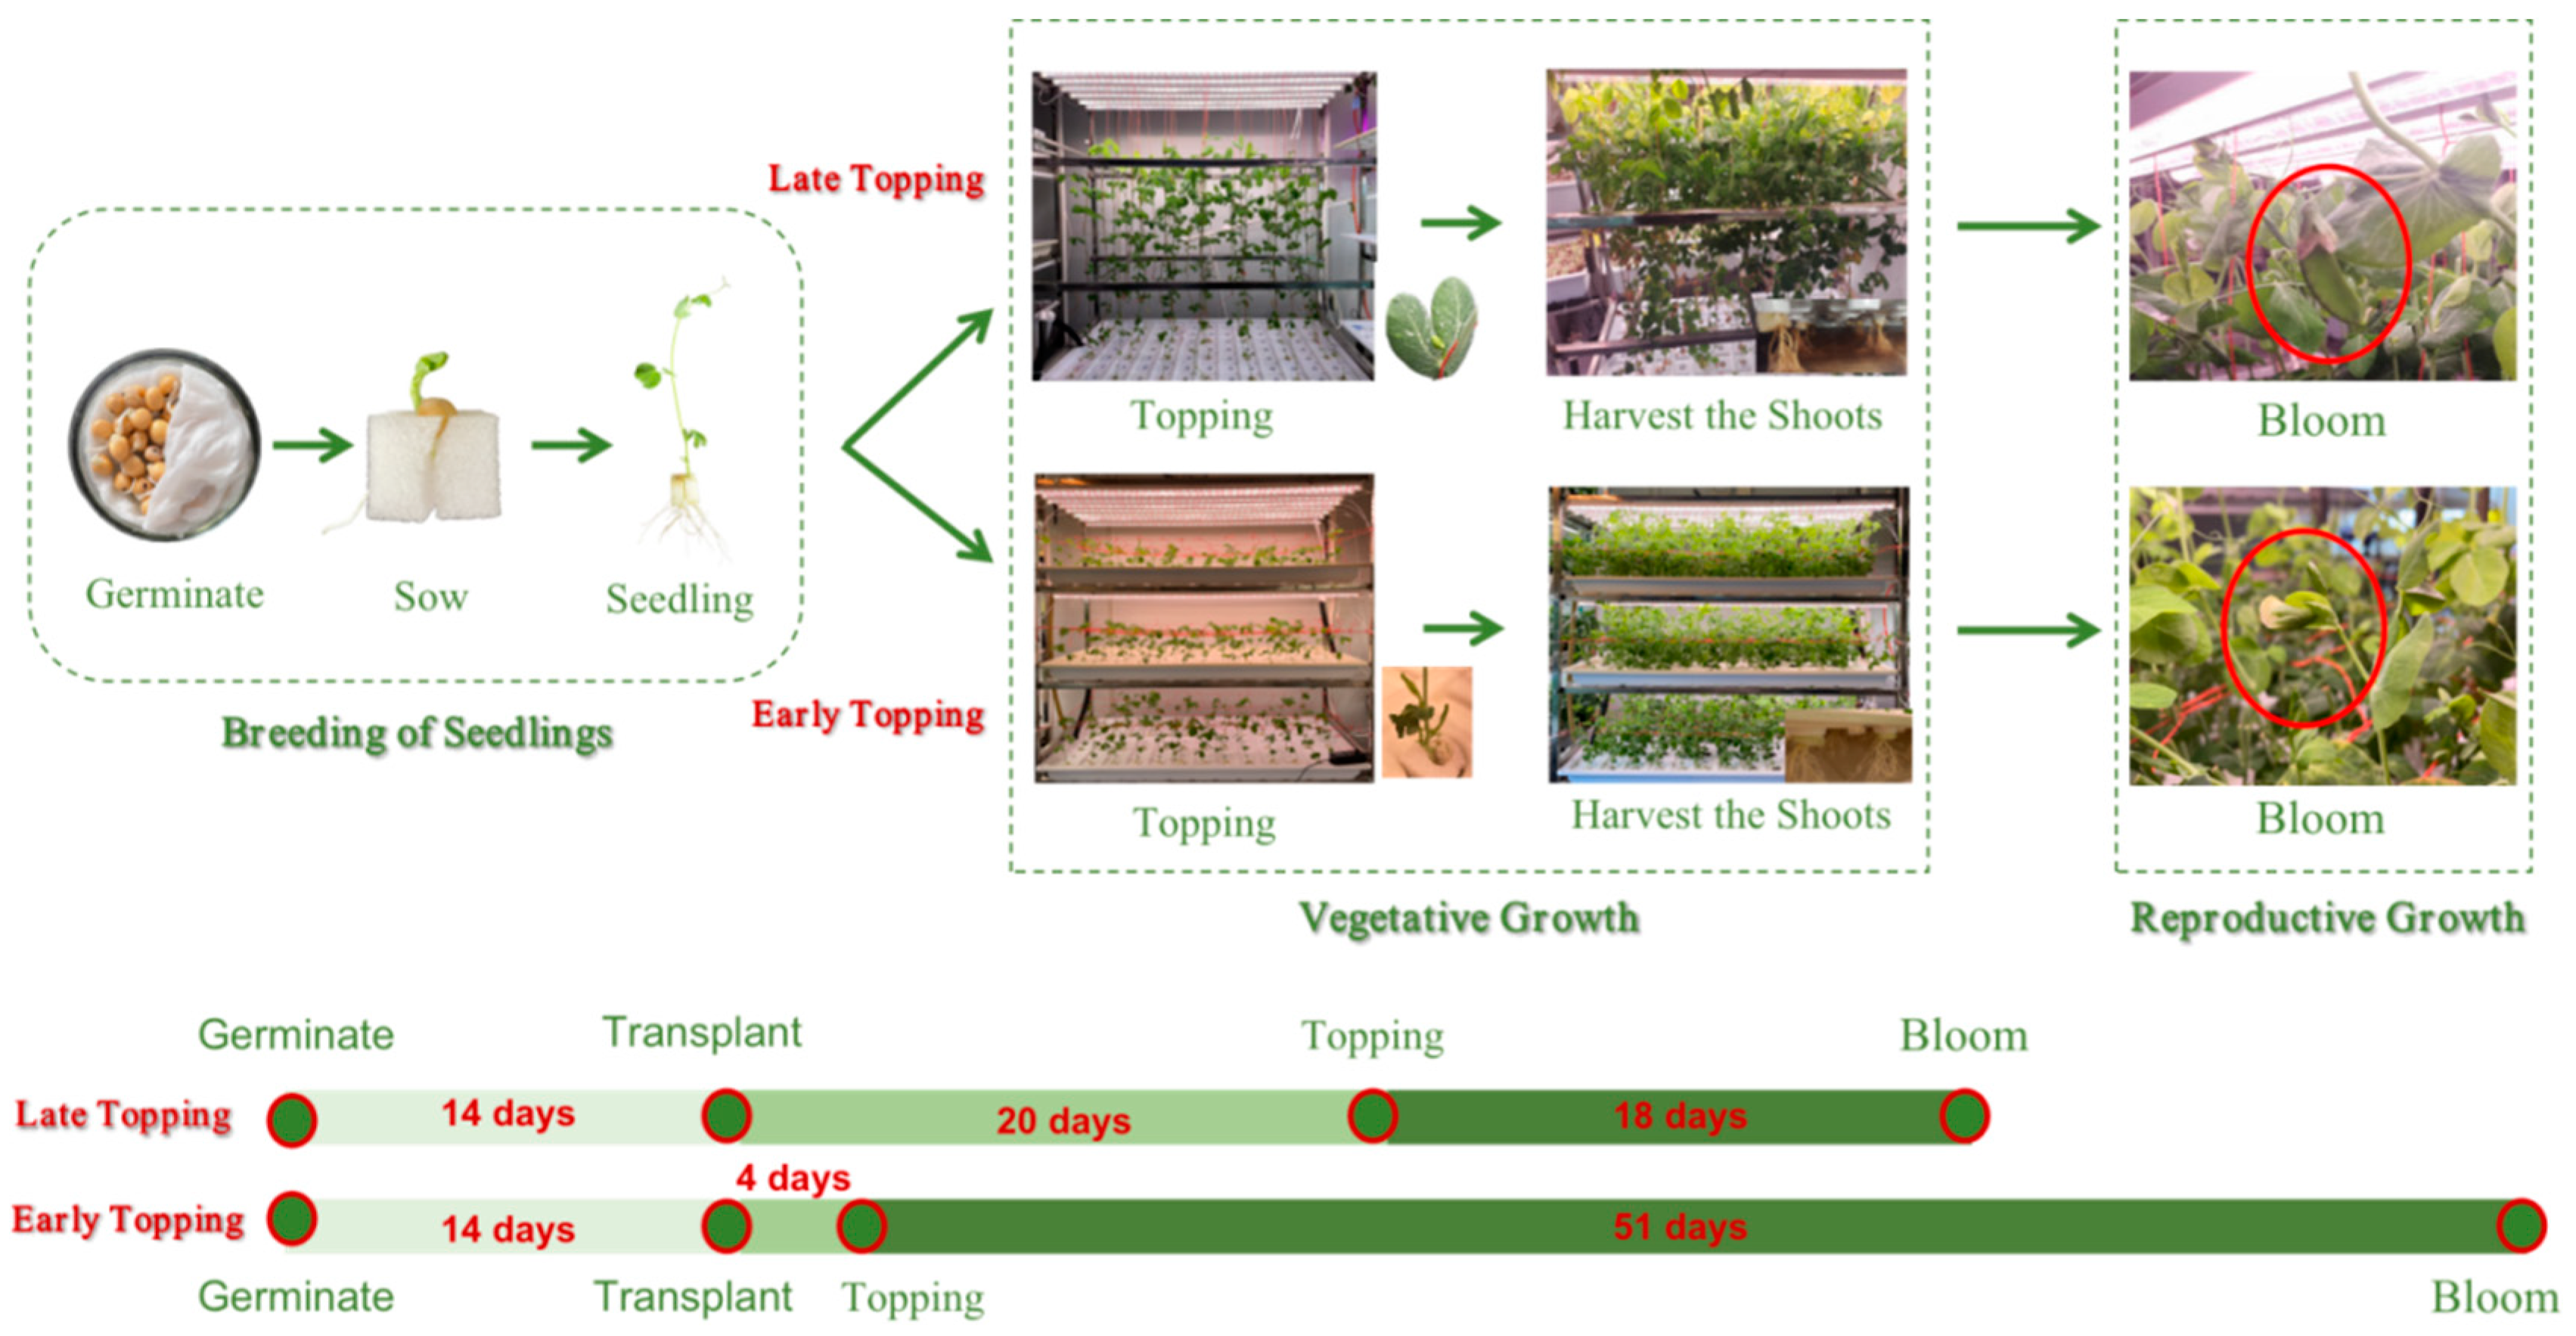
3.1.1. Growth Process of Pea Shoots under Different Cultivation Methods

The length of the pea production cycle varied between LT and ET, consequently affecting the length of the harvest period for the pea shoots (Figure 1). Although the seedling stage duration remained consistent for both methods, differences emerged in the timing of topping. Specifically, ET was implemented 16 days earlier than LT, resulting in an initial harvest advancement of 16 days. Moreover, pea pods appeared at 18 days from the first harvest under LT, while ET appeared at 51 days. Consequently, the length of the harvest period of ET was 2.8 times that of LT. Additionally, the planting period of ET was 69 days, which was 1.5 times that of LT.

3.1.2. Yield of Pea Shoots under Different Cultivation Methods

The total fresh weight, total number of harvested, and AFWs exhibited variations across different cultivation methods (Figure 2). Specifically, the total fresh weight of ET was higher than that of LT, and the cumulative yield of ET-LD reached 1136.7 g m−2 at 55 days after transplanting and was higher than that of ET-HD (Figure 2A). When the production period was less than 42 days, the total fresh weight of ET-HD was higher than that of ET-LD, which was as expected since the number of pea shoots harvested under ET-HD was higher than that in ET-LD. However, with a production period exceeding 42 days, the AFW under ET-LD increased, narrowing the gap in the number harvested, thereby resulting in a higher total fresh weight compared to ET-HD. Additionally, the AFW under ET was significantly lower than that of LT (Figure 2C), yet the number harvested under ET-LD and ET-HD was 5.9 and 8.0 times that of LT, respectively.

3.2. Effect of Light Intensity Combined with ET on Growth and Quality of Pea Shoots

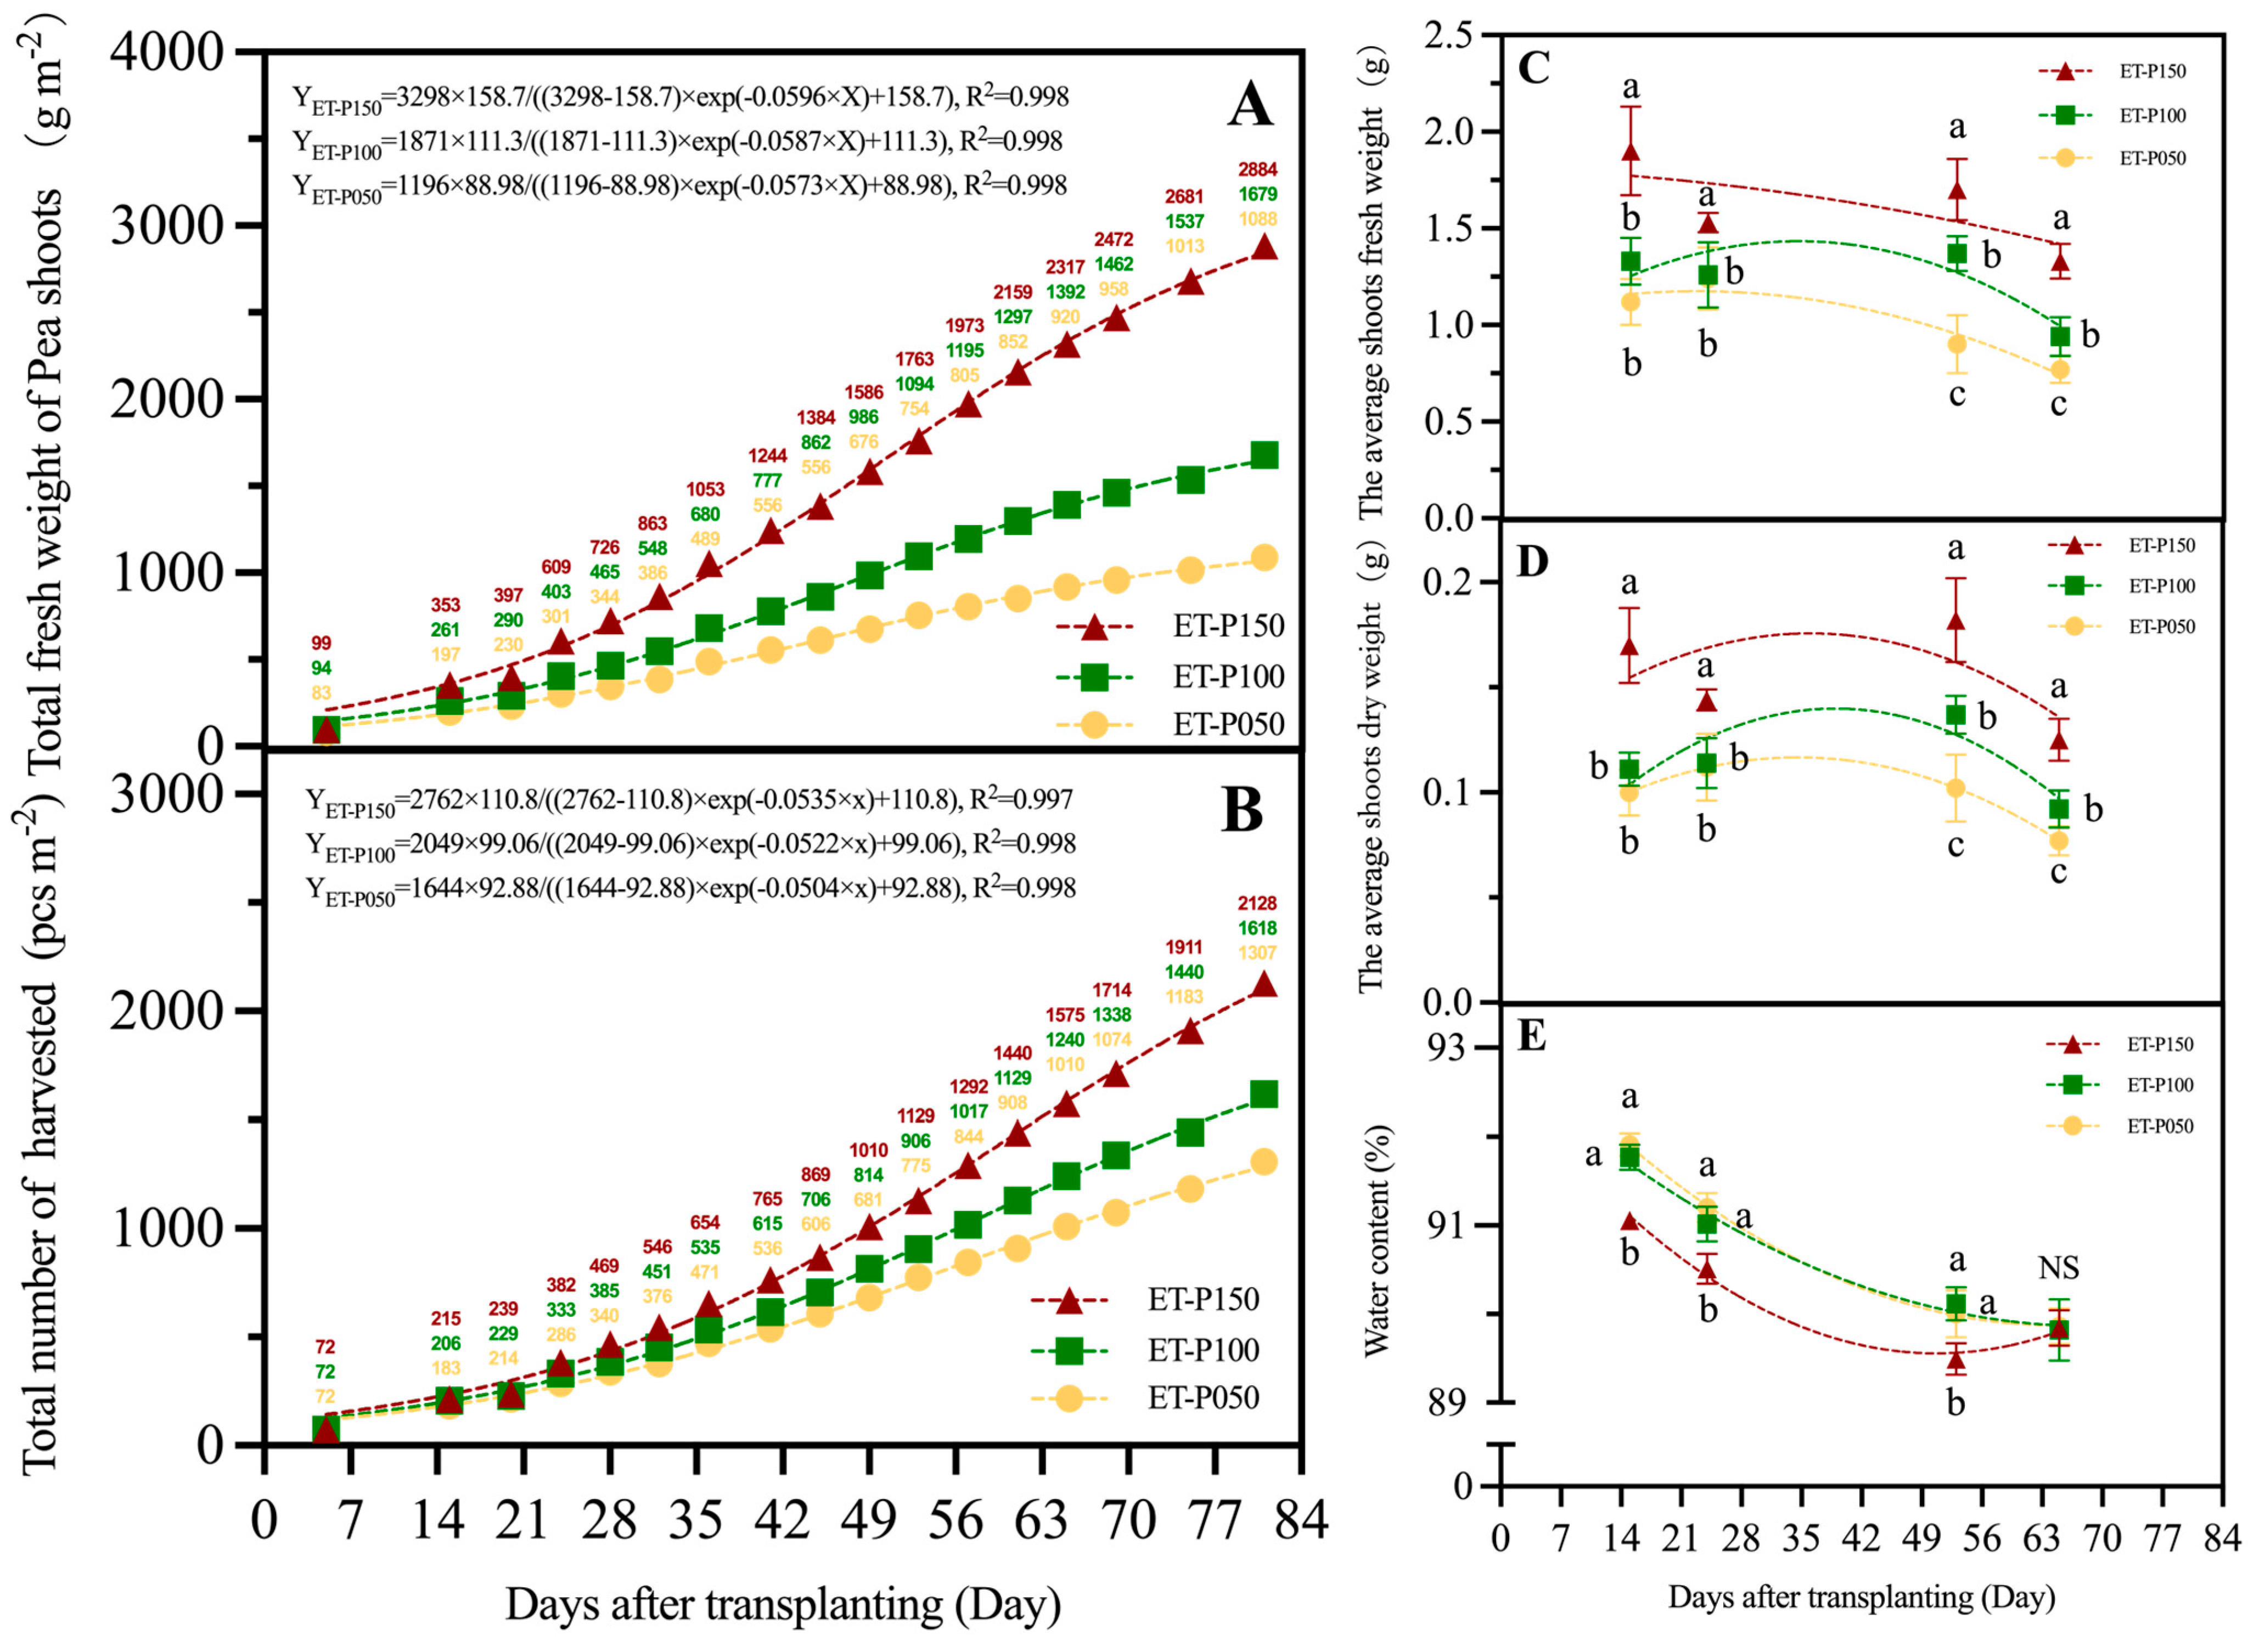
3.2.1. Biomass of Pea Shoots under Different Light Intensity Combined with ET

The effects of light intensity on total biomass, the number of harvested, as well as the average shoot fresh and dry weights were consistent (Figure 3). Throughout the cultivation process, ET-P150 exhibited the highest total biomass and total number of pea shoots harvested, reaching 2883.5 g m−2 and 2128, respectively, while ET-P050 showed the lowest values at 1087.6 g m−2 and 1307, respectively. Consequently, the total biomass of ET-P150 was 2.7 times that of ET-P050. During the entire cultivation cycle, the AFW was consistently highest under ET-P150, whereas it was consistently lowest under ET-P050.
It is evident that the AFWs and ADWs (Figure 3C,D) across all treatments steadily decline with the extension of the planting period. Furthermore, light intensity significantly influenced the water content of the pea shoots (Figure 3E). At 15, 24, and 53 days after transplanting, the water content of ET-P150 was significantly lower compared to that of ET-P050 and ET-P100, showing decreases of 0.9%, 0.8%, and 0.6% compared to ET-P050, respectively. However, no significant difference in water content was observed at 65 days after transplanting.

3.2.2. Leaf Gas Exchange Measurement of Pea Shoots at Different Periods

The photosynthetic capacity of the new (fully expanded leaves on the pea shoots) and old leaves (functional leaves retained on the plant after harvesting pea shoots) of the pea shoots was significantly affected by light intensity, and it decreased with the extension of the planting period (Table 2). The Pn of the new and old leaves of ET-P150 was the highest in the whole cultivation cycle, while that of ET-P050 was the lowest. Compared with the new and old leaves of ET-P050, the Pn of ET-P150 at 41 days after transplanting was significantly increased by 119.7% and 57.9%, respectively. Similarly, at 80 days after transplanting, the Pn of ET-P150 increased significantly by 357.5% and 51.3% compared to the new and old leaves of ET-P050, respectively. However, the trend of intercellular CO2 concentration (Ci) in the new and old leaves was opposite to that of the Pn. There was no consistent trend in stomatal conductance (Gs) and transpiration rate (Tr) of new and old leaves at 41 and 80 days after transplanting. On the other hand, new leaves showed no significant difference in Fv/Fm under different light intensities at 41 and 80 days after transplanting. Nonetheless, the Fv/Fm of old leaves in ET-P150 was significantly higher than in ET-P050, while no significant difference was observed between ET-P150 and ET-P100.

3.2.3. Quality of Pea Shoots at Different Periods

Light intensity significantly affected the quality of pea shoot leaves and stems, with changes observed as the planting period extended (Figure 4). The soluble sugar content in the leaves of ET-P150 consistently reached the highest level, peaking at 62.3 mg g−1 at 74 days after transplantation. However, in the stems of ET-P150, the soluble sugar content was only higher than that of ET-P050 and ET-P100 at 15 days post-transplantation, subsequently decreasing compared to the other treatments (Figure 4A). At 36 and 74 days after transplanting, vitamin C levels in the ET-P150 leaves were significantly higher than those in the ET-P050 leaves, showing improvements of 93.6% and 48.4%, respectively. Meanwhile, vitamin C levels in the stems of ET-P150 were significantly higher than that in the stems of ET-P050 at 15 and 74 days after transplanting, but there was no significant difference at 34 days after transplanting (Figure 4B). There was no significant difference in the soluble protein content of the pea shoot leaves under different light intensities during the whole cultivation cycle. The soluble protein content of the stems of ET-P150 was significantly higher than that of the other treatments at 15 days after transplanting, which increased by 22.7% and 27.7%, respectively. Nevertheless, it decreased to as low as 1.24 mg g−1 at 74 days after transplantation (Figure 4C).
There was no significant difference in nitrate content in leaves of different light intensities during the whole cultivation cycle. Meanwhile, the nitrate content of the stem of ET-P050 was significantly higher than that of ET-P100 and ET-P150 at 15 days after transplanting, which increased by 26.3% and 22.2%, respectively. Whereas it was always the lowest and significantly lower than that of ET-P150 at 36 and 74 days after transplanting, which decreased by 34.2% and 28.7% (Figure 4D). Additionally, the leaves consistently showed higher levels of soluble sugars, vitamin C, and soluble proteins compared to the stems, while maintaining consistently lower levels of nitrate content throughout the cultivation cycle. The levels of vitamin C and soluble protein in the leaves initially increased before decreasing, reaching peak values of 2.71 mg g−1 and 15.51 mg g−1, respectively. In contrast, the soluble sugar content in the leaves gradually increased, reaching its maximum value of 62.3 mg g−1. The nitrate content initially decreased before increasing, with its minimum value being 1098.3 mg g−1. As for the stems, the levels of soluble sugar and soluble protein initially increased before subsequently decreasing, whereas the content of nitrate and vitamin C initially decreased before increasing.

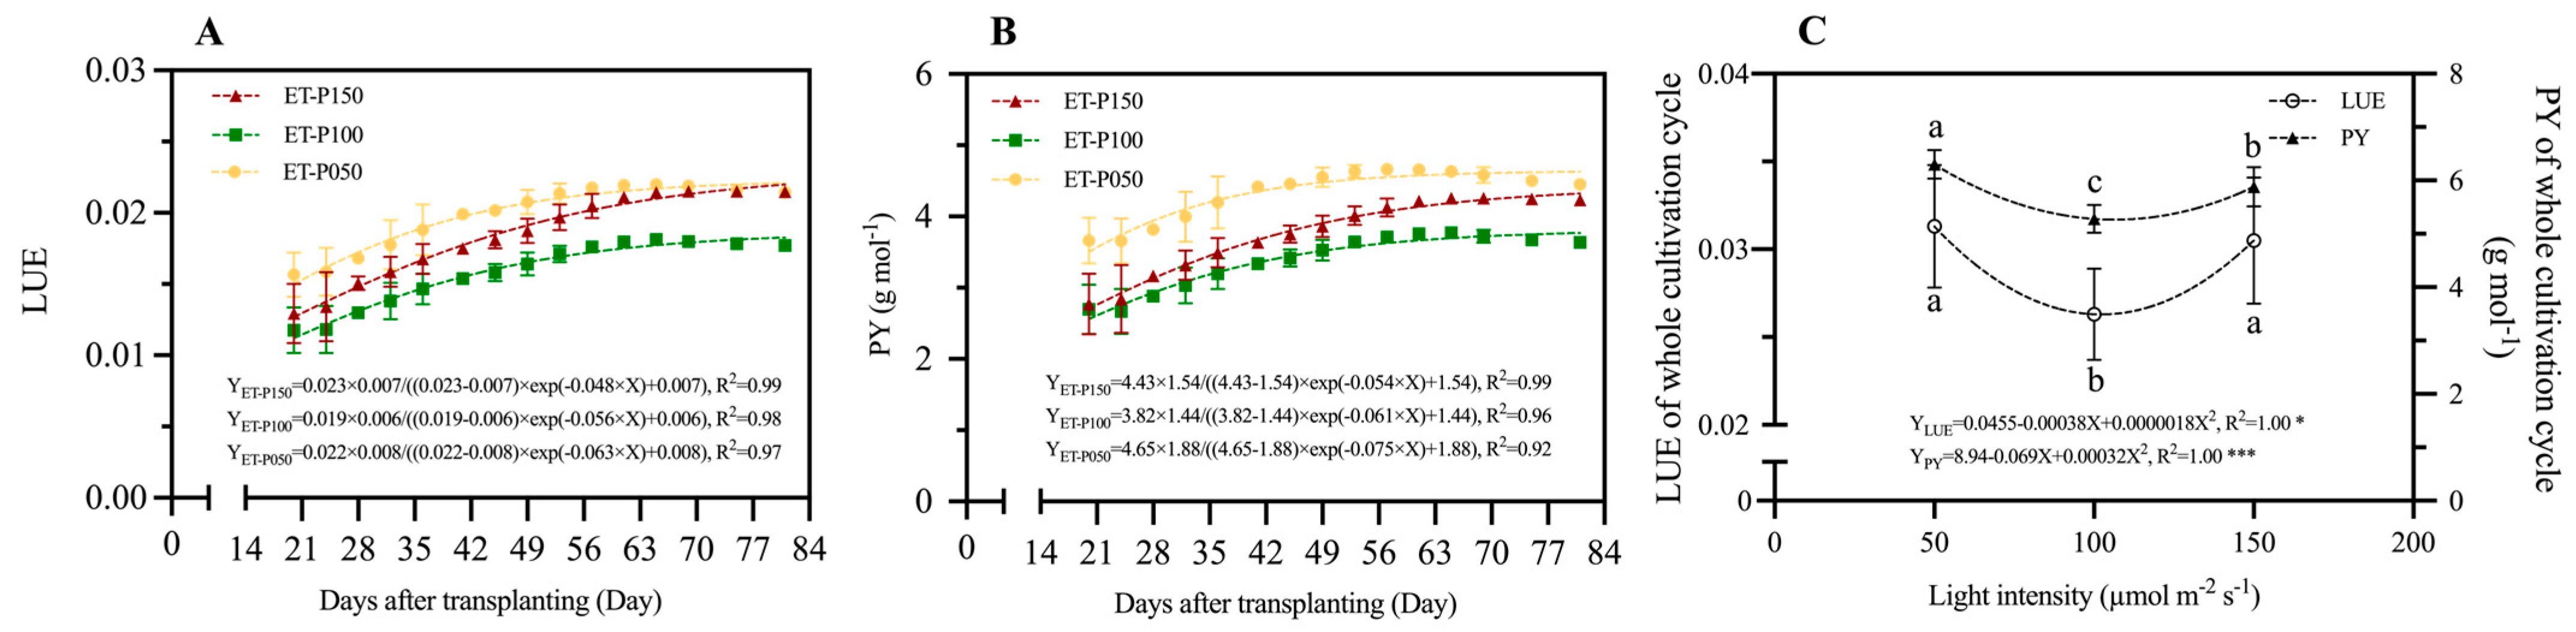
3.2.4. Light Energy Use Efficiency of Pea Shoots at Different Periods and Stages

Light intensity affected both the LUE and PY of the accumulated weight of the pea shoots. A logistic growth curve was chosen to fit the mean values, resulting in a strong fit, with an R2 exceeding 0.9 (Figure 5A,B). The LUE and PY of ET-P050 reached peak values at 60–70 days after transplanting, calculated at 0.022 and 4.7 g mol−1, respectively. In contrast, the corresponding values for the ET-P150 were lower, calculated at 0.021 and 4.3 g mol−1, respectively. In addition, light intensity significantly affected the LUE and PY of the whole cultivation cycle (Figure 5C). The LUE and PY of the whole cultivation cycle decreased significantly when the light intensity was increased from 50 to 100 µmol m−2 s−1, but the correlation values increased significantly when the light intensity was further increased to 150 µmol m−2 s−1 and gradually approached ET-P050. The LUE of the whole cultivation cycle for ET-P050 was 0.031, significantly higher than that of ET-P100, yet not significantly different from that of ET-P150. The PY of ET-P050 was 6.3 g mol−1, which was significantly higher than that of the other treatments.

3.2.5. Correlation Analysis between Light Intensity and Various Indicators

The correlations between light intensity and the various indicators of the pea shoots are shown in Figure (Figure 6). Light intensity exhibited a positive correlation with the levels of soluble sugar and vitamin C in leaves, vitamin C and nitrate in stems, as well as fresh and dry weight. Specifically, light intensity was significantly positively correlated with the levels of vitamin C in leaves and nitrate in stems, as well as fresh and dry weight. However, a negative correlation was observed between light intensity and soluble sugar content in stems, as well as water content, with the correlation being especially significant in the case of soluble sugar content in stems. Additionally, light intensity showed a negative correlation with soluble protein content, although the correlation was not statistically significant.

4. Discussion

4.1. Early Topping and Appropriate Planting Density Can Improve Yield

Topping is widely acknowledged as a crucial practice for enhancing crop yield and improving crop quality [15]. This practice primarily stimulates the generation of axillary shoots by enhancing the flow of sugars into them and reducing the inhibitory impact of auxins on cytokinins [22]. In this study, we observed that early topping enhances the total fresh yield of pea shoots (Figure 2). Although early topping reduced the individual weight of pea shoots, it led to increased harvest frequency by promoting axillary shoot production. Moreover, early topping extended the duration of the harvest period by elongating the vegetative growth stage, culminating in an overall improvement in the total yield of pea shoots (Figure 1). Consequently, early topping was conducive to the formation of pea shoots.
Planting density is a critical factor affecting both crop yield and quality, as higher densities result in competition for essential resources such as light, water, and nutrients [16,17]. This study revealed that the total fresh weight of pea shoots in the high-density treatment was highest in the early stage, while the total fresh weight of pea shoots in the low-density treatment was highest at 42 days after transplanting. This phenomenon could be attributed to the fact that the AFW under ET-LD increased by 47.8%, while the decrease in the number of harvested shoots was only 34.4%. As a result, the total fresh weight of the pea shoots under ET-LD exceeded that under ET-HD by the end of a single crop cycle. Besides, Spies et al. [23] showed that when plant density was very low, the difference in branching potential among different varieties of pea was more than twofold. The optimum economic plant density for the pea cultivars ranged between 59 and 84 plants m−2. Therefore, it is essential to consider the specific characteristics of the variety when determining the planting density in the future. Pea varieties used for pea shoot production can refer to ET-LD used in this study and cultivate 72 plants m−2.

4.2. Higher Light Intensity Combined with ET-LD Can Improve Yield and Quality

Light serves as the primary driver of photosynthesis and directly impacts the yield and quality of crops [24,25]. Low light intensity can reduce leaf photosynthetic rate, leading to a subsequent decline in dry matter accumulation. Conversely, high light intensity can trigger photoinhibition, photooxidation, and photodamage, ultimately culminating in decreased yields [26]. Kong et al. [7] suggested that the optimal supplementing light scheme for the greenhouse production of pea shoots in winter was a PPFD of 50–80 µmol m−2·s−1 with a photoperiod of 16 h·d−1. It was also proposed that DLI between 9.4 and 11.1 mol m−2·d−1 could be used as the target level for the greenhouse production of pea pods in winter [3]. Our correlation analysis (Figure 6) revealed a significant relationship between light intensity and the fresh weight and dry weight of pea shoots, suggesting a significant improvement in pea shoot yield. This contradicted the findings of Zhu et al. [27], who found that the fresh weight and chlorophyll content of pea shoots grew better under conditions of low PPFD (62–87 µmol m−2·s−1) than high PPFD (87–112 µmol m−2·s−1), suggesting that lower PPFD could increase the fresh weight of pea shoots. This difference may be attributed to the shorter growth period (10 days after sowing), which requires lower light intensity compared to this present study. In this study, we investigated the influence of three different levels of light intensity on the biomass accumulation of pea shoots within 81 days after transplanting. The findings indicated that the highest light intensity led to the optimal results. However, it is worth considering that increasing light intensity beyond that of ET-P150 could potentially be more optimal for maximizing yields in PFAL production.
PFALs exhibit higher productivity and resource use efficiency compared to conventional greenhouse systems over a shorter period [28,29]. In this study, the highest yield of pea shoots within 81 days, reaching 2.88 kg m−2, was achieved under 150 μmol m−2·s−1 combined with early topping (Figure 3). Assuming the equipment occupies 70% of the floor area and there are four planting floors in PFALs, the production efficiency is calculated to be 0.10 kg m−2·d−1, exceeding that of greenhouse supplemental LED lighting production at 0.03 kg m−2·d−1 [7]. Therefore, the method of ET-P150 with 72 plants m−2 can be used for pea shoot production in PFALs and will be more promising as the initial costs of PFALs and electricity decrease.
With the improvement of vegetable quality requirements, growers are increasingly interested in improving the nutritional quality, especially the content of vitamin C and nitrite in vegetables [30]. Numerous studies have explored the impact of light intensity on the nutritional quality of vegetables. Higher light intensity has been found to boost the activity of key enzymes involved in nitrate and vitamin C metabolism. Additionally, it provides increased energy for carbon dioxide fixation, resulting in accelerated vitamin C synthesis and nitrate assimilation [14]. In this study, it was found that light intensity was positively correlated with soluble sugar and vitamin C content in leaves, as well as vitamin C content in stems, which could significantly increase vitamin C content in leaves (Figure 6). This was similar to the results of Chen et al. [31], which showed that light intensity could improve nutritional value and that higher light intensity led to higher levels of vitamin C. However, there was no significant difference in nitrate content in the leaves of pea shoots under three levels of light intensity (Figure 4D). Nevertheless, light intensity showed a positive correlation with nitrate content in the stems of pea shoots. Thus, the conclusion of Voutsinos et al. [32] that higher light intensity provides more carbohydrate and photochemical energy to stimulate nitrate assimilation into amino acid in vegetable leaves was not confirmed. Conversely, like the research results of Maria et al. [33], light intensity had no significant effect on nitrate accumulation. This may also be because under low light conditions (50–150 μmol m−2·s−1), the nitrate content was primarily influenced by nitrogen supply rather than light intensity. Besides, nitrate reduction sites are usually located in organelles such as chloroplasts [34] and it is noted that leaves have higher chlorophyll content than stems (Supplemental Tables S1–S3). Hence, the nitrate content in the leaves was lower than that in the stems (Figure 4D).
The marketable yield of vegetables is intricately influenced by the balance between dry matter mass and water content, where a decrease in water content often indicates improved quality [35]. There was a negative correlation between light intensity and water content, although the difference was not statistically significant (Figure 6). Moreover, the water content of the ET-P150 was significantly lower when compared to that of the ET-P050 (Figure 3C). This phenomenon could be attributed to the robust photosynthetic capacity exhibited by pea plants under high light intensity, leading to the accumulation of a greater amount of dry matter [13].

4.3. The LUE of Pea Shoots Showing an Optimal Response with Planting Period

Crop yield and quality as well as input resource use efficiency are important factors for evaluating PFAL performance [36], among which the cost of electricity consumed by artificial lighting is one of the main challenges limiting commercial PFALs for leaf vegetable production. LUE was defined as the ratio of accumulated dry weight of a plant during a certain planting period to the amount of PAR absorbed by the canopy of the plant during that period [37], which is affected by factors such as light intensity [38], temperature [39] and CO2 [31,37]. Results of previous studies on the effect of light intensity on LUE are contradictory. Ye et al. [38] found that the LUE of four plant species rapidly rose to LUEmax with the increase in light intensity under low-light conditions but declined when light intensity surpassed saturation levels. Conversely, Ahmed et al. [36] proposed a negative correlation between LUE and light intensity, indicating that high electricity consumption reduced LUE during production. In this study, it was found that the LUE of the accumulated weight of the whole cultivation cycle under ET-P050 was always higher than that of ET-P100 and ET-P150 within 70 days after transplanting. However, the LUE of ET-P150 gradually approached that of ET-P050 after 70 days following transplantation (Figure 5A). This phenomenon may be attributed to the fact that the Pn and Fv/Fm of the old leaves of the pea plants under ET-P150 consistently outperformed those of both ET-P050 and ET-P100 throughout the cultivation period (Table 2). The enhanced photosynthetic performance in ET-P150 resulted in an increase in the yield of pea shoots, thus contributing to its higher LUE. Therefore, it is reasonable that the LUE of ET-P050 and ET-P150 exhibited minimal difference in the later stages (Figure 5A). This finding is consistent with the study by Pennisi et al. [18], which indicated that a PPFD of 250 µmol m−2·s−1 required higher electrical energy compared to lower light intensities, but increased yield could improve energy use efficiency (EUE) and LUE. Moreover, it corroborates with the findings of Fu et al. [40], which suggested that while the highest LUE can be achieved under low light intensity conditions, this approach may limit the potential increase in yield. Consequently, they recommended the utilization of higher light intensity during production. Based on these findings, it is suggested to use a PPFD of 150 instead of 50 µmol m−2·s−1 in PFAL production.
At 60–70 days after transplanting, the LUE and PY of the accumulated weight peaked before gradually decreasing (Figure 5A,B). This trend could be attributed to the decline in photosynthetic capacity (Table 2) and pigment content (Supplemental Tables S1–S3) within the leaves of the pea plants. Alternatively, it may correspond to the transition of the pea plants into the reproductive growth stage (Figure 1). These observations are consistent with the findings of Chen et al. [31], where the photosynthetic capacity of lettuce leaves displayed an initial increasing trend during the first 25 days after transplanting, followed by a rapid decline after 5 days. This indicated that the plant was growing poorly during this period and could not improve its growth further at the same level of energy consumption. Therefore, it is advisable to clean these pea plants at 60–70 days after transplanting.

5. Conclusions

Early topping can effectively enhance the harvest frequency and increase the quantity of pea plants by stimulating the generation of axillary shoots and extending the harvest period. Considering the yield from various cultivation methods in PFALs, it is recommended to adopt the ET method, where topping is performed when the plant height reaches 20–30 cm (about 4 days after transplanting) and a plant density of 72 plants m−2 is maintained to optimize pea shoot production. Additionally, based on the yield, quality, and LUE of pea shoots under different light intensities combined with early topping, it is advisable to use a PPFD of 150 μmol m−2·s−1 with a photoperiod of 16 h·d−1 provided by LEDs. To improve the nutritional quality and light use efficiency of pea shoots, it is recommended to replace the pea plants under the ET-P150 condition with new seedlings at 60–70 days after transplanting, enabling the cultivation of 5–6 rounds per year in PFALs.

Supplementary Materials

The following supporting information can be downloaded at https://www.mdpi.com/article/10.3390/horticulturae10060650/s1, Table S1–S3: The photosynthetic pigment content of the pea shoots at 15, 36, and 74 days after transplanting.

Author Contributions

Methodology, J.L., F.J. and D.H.; Resources, D.H.; Data curation, J.L.; Writing—original draft, J.L. and F.J.; Writing—review & editing, J.L., F.J. and D.H.; Project administration, D.H. All authors have read and agreed to the published version of the manuscript.

Funding

This research was supported by the Key Research and Development Project of Shandong Province (Grant No. 2022CXGC020708) and the earmarked fund for China Agriculture Research System (CARS-21).

Data Availability Statement

Data are contained within the article and Supplementary Materials.

Conflicts of Interest

The authors declare no conflict of interest.

References

  1. Miles, C.A.; Sonde, M. Pea Shoots; Washington State University Cooperative Extension: Pullman, WA, USA, 2003; Available online: https://www.researchgate.net/publication/242372648_Pea_Shoots (accessed on 18 July 2023).
  2. Lim, T.K. Edible medicinal and non-medicinal plants: Volume 1. Fruits 2013, 16, 132–135. [Google Scholar] [CrossRef]
  3. Kong, Y.; Zheng, Y. Response of growth, yield, and quality of edible-podded snow peas to supplemental LED lighting during winter greenhouse production. Can. J. Plant Sci. 2019, 99, 676–687. [Google Scholar] [CrossRef]
  4. Ma, J.; Sun, B.; Xue, S.L.; Xia, X.; Tian, Y.X.; Zhang, F.; Wang, S. Analysis of main nutrients, bioactive compounds and antioxidant capacities in pea tip. Food Mach. 2016, 32, 47–51. [Google Scholar] [CrossRef]
  5. Santos, J.; Herrero, M.; Mendiola, J.A.; Oliva-Teles, M.T.; Ibanez, E.; Delerue-Matos, C.; Oliveira, M.B.P.P. Assessment of nutritional and metabolic profiles of pea shoots: The new ready-to-eat baby-leaf vegetable. Food Res. Int. 2014, 58, 105–111. [Google Scholar] [CrossRef]
  6. Yu, H.T.; Yang, F.; Hu, C.Q.; Yang, X.; Wang, Y.B.; Lv, M.Y.; Wang, L.P. A New Pea Variety Specialized for Sprout Production—Yunwan No. 1. China Veg. 2020, 8, 92–95. [Google Scholar] [CrossRef]
  7. Kong, Y.; Llewellyn, D.; Zheng, Y. Response of growth, yield, and quality of pea shoots to supplemental light-emitting diode lighting during winter greenhouse production. Can. J. Plant Sci. 2018, 98, 732–740. [Google Scholar] [CrossRef]
  8. North, T.; Maki, S.L. Pisum sativum L. shoot architecture manipulation in hydroponics with LED lighting and increased dissolved oxygen. Acta Hortic. 2022, 1337, 323–326. [Google Scholar] [CrossRef]
  9. Takagaki, M.; Hara, H.; Kozai, T. Micro- and mini-PFALs for improving the quality of life in urban areas. In Plant Factory; Elsevier Inc.: Amsterdam, The Netherlands, 2016; pp. 91–104. [Google Scholar] [CrossRef]
  10. Kozai, T.; Niu, G. Plant factory as a resource-efficient closed plant production system. In Plant Factory; Elsevier Inc.: Amsterdam, The Netherlands, 2016; pp. 69–90. [Google Scholar] [CrossRef]
  11. Avgoustaki; Despoina, D.; Xydis, G. Indoor vertical farming in the urban nexus context: Business growth and resource savings. Sustainability 2020, 12, 1965. [Google Scholar] [CrossRef]
  12. Kozai, T. Resource use efficiency of closed plant production system with artificial light: Concept, estimation and application to plant factory. Proc. Jpn. Acad. Ser. B 2013, 89, 447–461. [Google Scholar] [CrossRef]
  13. He, D.X.; Kozai, T.; Niu, G.; Zhang, X. Light-emitting diodes for horticulture: Materials, processes. Devices Appl. 2019, 4, 513–547. [Google Scholar] [CrossRef]
  14. Fu, Y.M.; Li, H.Y.; Yu, J.; Liu, H.; Cao, Z.Y.; Manukovsky, N.S.; Liu, H. Interaction effects of light intensity and nitrogen concentration on growth, photosynthetic characteristics and quality of lettuce (Lactuca sativa L. Var. youmaicai). Sci. Hortic. 2017, 214, 51–57. [Google Scholar] [CrossRef]
  15. Wei, S.L.; Gao, T.M.; Zhang, H.Y.; Sun, M.Y.; Liu, Y.; Zhang, X.M.; Zheng, Y.Z.; Miao, H.M.; Wang, Y.H.; Li, X.Z. Effect on sesame yield, quality and photosynthetic character after topping in different stage in different site. Acta Agric. BorealiSin. 2010, 25, 170–174. [Google Scholar] [CrossRef]
  16. Feng, Y.P.; Shen, H.H.; Luo, Y.K.; Xu, L.C.; Liu, S.S.; Zhu, Y.K.; Zhao, M.Y.; Xing, A.J.; Fang, J.Y. Effects of planting density on growth and biomass of Medicago sativa. Chin. J. Plant Ecol. 2020, 44, 248–256. [Google Scholar] [CrossRef]
  17. Yucel, D. Impact of plant density on yield and yield components of pea (Pisum sativum ssp. sativum L.) cultivars. J. Agric. Biol. Sci. 2013, 8, 169–174. [Google Scholar] [CrossRef]
  18. Li, H.S. Experimental Principle and Technology of Plant Physiology and Biochemistry; Higher Education Press: Beijing, China, 2000; pp. 123–124. [Google Scholar]
  19. Bradford, M.M. A rapid and sensitive method for the quantitation of microgram quantities of protein utilizing the principle of protein-dye binding. Anal. Biochem. 1976, 72, 248–254. [Google Scholar] [CrossRef]
  20. Cataldo, D.A.; Haroon, M.; Schrader, L.E.; Youngs, V.L. Rapid colorimetric determination of nitrate in plant-tissue by nitration of salicylic-acid. Commun. Soil Sci. Plant Anal. 1975, 6, 71–80. [Google Scholar] [CrossRef]
  21. Pennisi, G.; Pistillo, A.; Orsini, F.; Cellini, A.; Spinelli, F.; Nicola, S.; Fernandez, J.A.; Crepaldi, A.; Gianquinto, G.; Marcelis, L.F.M. Optimal light intensity for sustainable water and energy use in indoor cultivation of lettuce and basil under red and blue LEDs. Sci. Hortic. 2020, 272, 109508–109518. [Google Scholar] [CrossRef]
  22. Gaudreau, S.; Missihoun, T.; Germain, H. Early topping: An alternative to standard topping increases yield in cannabis production. Plant Sci. Today 2020, 7, 627–630. [Google Scholar] [CrossRef]
  23. Spies, J.M.; Warkentin, T.; Shirtliffe, S. Basal branching in field pea cultivars and yield-density relationships. Can. J. Plant Sci. 2010, 90, 679–690. [Google Scholar] [CrossRef]
  24. Chen, X.L.; Yang, Q.C.; Song, W.P.; Wang, L.C.; Guo, W.Z.; Xue, X.Z. Growth and nutritional properties of lettuce affected by different alternating intervals of red and blue LED irradiation. Sci. Hortic. 2017, 223, 44–52. [Google Scholar] [CrossRef]
  25. Kromdijk, J.; Głowacka, K.; Leonelli, L.; Gabilly, S.T.; Iwai, M.; Niyogi, K.K.; Long, S.P. Improving photosynthesis and crop productivity by accelerating recovery from photoprotection. Science 2016, 354, 857–861. [Google Scholar] [CrossRef]
  26. Yi, Z.H.; Cui, J.J.; Fu, Y.M.; Yu, J.; Liu, H. Optimization of light intensity and nitrogen concentration in solutions regulating yield, vitamin C, and nitrate content of lettuce. J. Hortic. Sci. Biotechnol. 2021, 96, 62–72. [Google Scholar] [CrossRef]
  27. Zhu, X.S.; Zhou, X.L.; Liu, M.Q. Effect of LED supplemental lighting system on the growth of pea shoots. In Proceedings of the 2013 10th China International Forum on Solid State Lighting (ChinaSSL), Beijing, China, 10–12 November 2013; pp. 104–107. [Google Scholar] [CrossRef]
  28. Van Delden, S.H.; SharathKumar, M.; Butturini, M.; Graamans, L.J.A.; Heuvelink, E.; Kacira, M.; Kaiser, E.; Klamer, R.S.; Klerkx, L.; Kootstra, G.; et al. Current status and future challenges in implementing and upscaling vertical farming systems. Nat. Food 2021, 2, 944–956. [Google Scholar] [CrossRef]
  29. Kang, J.H.; Krishnakumar, S.; Atulba, S.L.S.; Jeong, B.R.; Hwang, S.J. Light intensity and photoperiod infuence the growth and development of hydroponically grown leaf lettuce in a closed-type plant factory system. Hortic. Environ. Biotechnol. 2013, 54, 501–509. [Google Scholar] [CrossRef]
  30. Hermsdorff, H.H.M.; Barbosa, K.B.F.; Volp, A.C.P.; Bressan, B.P.J.; Zulet, M.A.; Martinez, J.A. Vitamin C and fibre consumption from fruits and vegetables improves oxidative stress markers in healthy young adults. Br. J. Nutr. 2012, 107, 1119–1127. [Google Scholar] [CrossRef]
  31. Chen, D.Y.; Mei, Y.H.; Liu, Q.; Wu, Y.J.; Yang, Z.C. CO2 enrichment promoted the growth, yield and light-use efficiency of lettuce in plant factory with artificial lighting. Agron. J. 2021, 113, 5196–5206. [Google Scholar] [CrossRef]
  32. Voutsinos, O.; Mastoraki, M.; Ntatsi, G.; Liakopoulos, G.; Savvas, D. Comparative assessment of hydroponic lettuce production either under artificial lighting, or in a Mediterranean greenhouse during wintertime. Agriculture 2021, 11, 503. [Google Scholar] [CrossRef]
  33. Maria, G.; Ewa, B.; Bozena, M.; Stanislaw, K.; Jacek, D.; Waldemar, K.; Anna, W.; Justyna, S.G. Assessment of romaine lettuce cultivars grown in a vertical hydroponic system at two levels of LED light intensity. Sci. Hortic. 2023, 313, 111913. [Google Scholar] [CrossRef]
  34. Guerrero, M.G. Assimilatory Nitrate Reduction. In Techniques in Bioproductivity and Photosynthesis, 2nd ed.; Elsevier Inc.: Amsterdam, The Netherlands, 1985; pp. 165–172. [Google Scholar] [CrossRef]
  35. Acharya, U.K.; Subedi, P.P.; Walsh, K.B. Robustness of tomato quality evaluation using a portable Vis-SWNIRS for dry matter and colour. Int. J. Anal. Chem. 2017, 2017, 2863454. [Google Scholar] [CrossRef]
  36. Ahmed, H.A.; Tong, Y.X.; Li, L.; Sahari, S.Q.; Almogahed, A.M.; Cheng, R.F. Integrative effects of CO2 concentration, illumination intensity and air speed on the growth, gas exchange and light use efficiency of lettuce plants grown under artificial lighting. Horticulturae 2022, 8, 270. [Google Scholar] [CrossRef]
  37. Ye, Z.P.; Zhang, H.L.; Huang, Z.A.; Yang, X.L.; Kang, H.J. Model construction of light use efficiency and water use efficiency based on a photosynthetic mechanistic model of light response. Plant Physiol. 2017, 53, 1116–1122. [Google Scholar] [CrossRef]
  38. Ye, Z.P.; Yang, X.L.; Kang, H.J. Comparison of light-use and water-use efficiency for C3 and C4 species. Acta Agric. Zhejiangensis 2016, 28, 1867–1873. [Google Scholar]
  39. Li, Y.B.; Tao, F.L. Research progress on the mechanism of high light use efficiency in wheat. Chin. J. Agrometeorol. 2022, 43, 93–111. [Google Scholar] [CrossRef]
  40. Fu, W.G.; Li, P.P.; Wu, Y.Y. Effects of different light intensities on chlorophyll fluorescence characteristics and yield in lettuce. Sci. Hortic. 2012, 135, 45–51. [Google Scholar] [CrossRef]
Figure 1. The whole cultivation process and the key phenological period of LT and ET. LT denotes topping at 20 days after transplanting, while ET denotes topping at 4 days after transplanting.
Horticulturae 10 00650 g001
Figure 2. The total fresh weight (A) and total number of harvested pea shoots (B) per unit area at different cultivation stages under different cultivation methods. Based on the data trend, the logistic growth curve was selected to fit the total fresh weight and the number of harvested pea shoots. However, LT could not be fitted because the harvest data were only available for three timepoints. The average shoot fresh weight (C) was calculated from the mean values of each harvest. Bars that do not share the same letter are significantly different at the 5% level, according to LSD’s multiple comparison test. LT denotes later topping (20 days after transplanting) with a plant density of 39 plants m−2; ET-LD denotes early topping (4 days after transplanting) with a plant density of 72 plants m−2; ET-HD denotes early topping with a plant density of 126 plants m−2.
Horticulturae 10 00650 g002
Figure 3. The total fresh weight (A) and total number of harvested pea shoots (B) per unit area under different light intensities combined with ET. Based on the data trend, the logistic growth curve was selected to fit the total fresh weight and the number of harvested pea shoots. The average shoot fresh weight (C) and dry weight (D) per pea shoot, as well as the water content (E) of pea shoots at 15, 24, 53, and 65 days after transplanting. A second-order polynomial was chosen to fit their trends throughout the cultivation cycle. The different small letters denote significance at the 0.05 level, according to LSD’s multiple comparison test. Identical letters signify no significant differences, and “NS” represents no significant differences between all treatments. The vertical bars represent the ± SE (n = 5). ET-P050, ET-P100, and ET-P150 denote the method of early topping under light intensities of 50, 100, and 150 µmol m−2 s−1, respectively.
Horticulturae 10 00650 g003
Figure 4. The content of soluble sugar (A), vitamin C (B), soluble protein (C), and nitrate (D) in the leaves and stems of the pea shoots under different light intensities combined with ET at 15, 36, and 74 days after transplanting. A second-order polynomial was chosen to fit their trends throughout the cultivation cycle. The different small letters denote significance at the 0.05 level, according to LSD’s multiple comparison test. Identical letters signify no significant differences, and “NS” represents no significant differences between all treatments. The vertical bars represent the ± SE (n = 5). ET-P050, ET-P100, and ET-P150 denote the method of early topping under light intensities of 50, 100, and 150 µmol m−2 s−1, respectively.
Horticulturae 10 00650 g004
Figure 5. The LUE (A) and PY (B) of the accumulated weight of the pea shoots during the whole cultivation process under different light intensities combined with early topping. Based on the data trend, the logistic growth curve was selected to fit the mean values. The LUE and PY of the whole cultivation cycle (C) under light intensities of 50, 100, and 150 µmol m−2·s−1. These mean values were obtained by averaging the LUE and PY of the pea shoots from 15 harvests. The different small letters denote significance at the 0.05 level, according to LSD’s multiple comparison test. Identical letters signify no significant differences. The vertical bars represent the ± SE (n = 8). * represents a significant correlation at the 0.05 level, and *** represents a significant correlation at the 0.001 level. ET-P050, ET-P100, and ET-P150 denote the method of early topping under light intensities of 50, 100, and 150 µmol m−2·s−1, respectively.
Horticulturae 10 00650 g005
Figure 6. Correlation analysis between light intensity and the various indicators of the pea shoots. * represents a significant correlation at the 0.05 level and ** represents a significant correlation at the 0.01 level. Blue and red circles represent negative and positive correlations, respectively. The numbers are correlation coefficients and the larger circles mean stronger correlations. -L and -S denote the leaves and stems of pea shoots, respectively.
Horticulturae 10 00650 g006
Table 1. Topping methods, plant density, and light intensity in the topping method trial and the light intensity trial.
TrialTreatment
Symbol
Topping
Method
Plant DensityLight Intensity
Plants m−2μmol m−2 s−1
Topping methodLTLate39100
ET-LDEarly72100
ET-HDEarly126100
Light intensityET-P050Early7250
ET-P100Early72100
ET-P150Early72150
LT denotes later topping (20 days after transplanting); ET-LD denotes early topping (4 days after transplanting) with a plant density of 72 plants m−2; ET-HD denotes early topping with a plant density of 126 plants m−2; ET-P050, ET-P100, and ET-P150 denote the method of early topping under a light intensity of 50, 100 and 150 µmol m−2·s−1, respectively.
Table 2. The leaf gas exchange measurements (net photosynthetic rate (Pn), stomatal conductance (Gs), intercellular CO2 concentration (Ci), transpiration rate (Tr)) and the PSII maximal photochemical efficiency (Fv/Fm) of new (fully expanded leaves on the pea shoots) and old (functional leaves retained on the plant after harvesting pea shoots) leaves of pea shoots at 41 and 80 days after transplanting.
Trial TreatmentPnGsCiTrFv/Fm
μmol m−2 s−1mol m−2 s−1μmol mol−1mmol m−2 s−1
New leaves41 DATET-P0504.6 ± 0.6 C c0.29 ± 0.10 A a357.1 ± 11.8 A a1.4 ± 0.3 NS0.835 ± 0.001 NS
ET-P1007.0 ± 0.9 B b0.24 ± 0.03 A ab333.3 ± 5.7 A b1.3 ± 0.2 NS0.837 ± 0.004 NS
ET-P15010.2 ± 0.2 A a0.19 ± 0.03 A b285.4 ± 15.3 B c1.2 ± 0.2 NS0.835 ± 0.008 NS
80 DATET-P0501.2 ± 0.1 C c0.30 ± 0.06 A b385.8 ± 0.9 A a2.0 ± 0.3 NS0.842 ± 0.002 NS
ET-P1003.3 ± 0.2 B b0.51 ± 0.05 A a379.1 ± 1.5 A a2.8 ± 0.7 NS0.839 ± 0.003 NS
ET-P1505.5 ± 0.7 A a0.48 ± 0.11 A a367.0 ± 5.9 B b2.6 ±1.2 NS0.845 ± 0.003 NS
Old leaves41 DATET-P0504.8 ± 0.4 B b0.37 ± 0.11 A a362.6 ± 3.3 A a1.7 ± 0.3 A a0.814 ± 0.004 B b
ET-P1007.0 ± 0.4 A a0.20 ± 0.04 B b320.4 ± 12.5 B b1.1 ± 0.2 B b0.824 ± 0.008 AB a
ET-P1507.6 ± 1.1 A a0.22 ± 0.02 AB b321.0 ± 16.1 B b1.3 ± 0.1 AB b0.832 ± 0.001 A a
80 DATET-P0503.5 ± 0.2 B b0.52 ± 0.08 NS387.3 ± 1.7 A a2.7 ± 0.4 B b0.796 ± 0.011 B b
ET-P1003.5 ± 0.4 B b0.69 ± 0.07 NS380.8 ± 0.8 A a3.5 ± 0.2 A a0.820 ± 0.004 A a
ET-P1505.3 ± 0.1 A a0.53 ±0.25 NS367.1 ± 11.4 A b2.5 ± 0.2 B b0.831 ± 0.004 A a
DAT denotes the days after transplanting. ET-P050, ET-P100, and ET-P150 denote the method of early topping under light intensities of 50, 100, and 150 µmol m−2 s−1, respectively. The different capital letters within the same period indicate highly significant differences at the 0.01 probability level (n = 5) according to LSD’s multiple comparison test, while the different small letters denote significance at the 0.05 level. Identical letters signify no significant differences, and “NS” represents no significant differences between all treatments.
Disclaimer/Publisher’s Note: The statements, opinions and data contained in all publications are solely those of the individual author(s) and contributor(s) and not of MDPI and/or the editor(s). MDPI and/or the editor(s) disclaim responsibility for any injury to people or property resulting from any ideas, methods, instructions or products referred to in the content.

