Abstract
The mature flesh of Cornus officinalis exhibits a vibrant red color, attributed to its rich anthocyanin content, imparting significant edible and medicinal value. Vibrant colors not only enhance the visual allure of medicinal materials but also maintain a close association with their intrinsic quality. However, the intricate process of pigment formation governing the anthocyanin accumulation in the pericarp of Cornus officinalis remains poorly understood. In this study, we conducted the comprehensive sampling and analysis of pericarp tissues at three distinct developmental stages, employing morphological-structure observation and metabolomic and transcriptomic techniques. Our findings reveal a substantial increase in the anthocyanin accumulation during the transition to the red stage of Cornus officinalis fruit maturation. Metabolomic profiling identified the highest expression levels of Cyanidin-3-O-glucoside and Pelargonidin-3-O-rutinoside during the mature stage, suggesting their association with the red coloration of the fruit. Through RNA sequencing, we identified 25,740 differentially expressed genes (DEGs), including 41 DEGs associated with anthocyanin biosynthesis. The correlation between the DEG expression levels and anthocyanin content was explored, further elucidating the regulatory network. Additionally, we validated the pivotal role of the candidate gene BZ1 in the synthesis of Cyanidin-3-O-glucoside through qRT-PCR, confirming its crucial impact on anthocyanin accumulation. This study provides preliminary insights into anthocyanin accumulation in Cornus officinalis, laying the foundation for the future development of new cultivars with enhanced anthocyanin contents.
1. Introduction
Color, as a conspicuous characteristic of plants, plays a crucial role in their growth and development. Anthocyanins, water-soluble pigments within the flavonoid family, predominantly contribute to the red and blue pigmentation observed in plants. In recent years, a series of studies have illuminated the significant role of anthocyanins in shaping the distinctive coloration of various plants, such as Arabidopsis thaliana [1], apple [2], jujube [3], and tomato [4]. The biosynthetic pathway of anthocyanins is well established. In plants, this pathway initiates from the precursor phenylalanine, catalyzed by a cascade of structural enzymes, including chalcone synthase (CHS), chalcone isomerase (CHI), flavonoid-3-hydroxylase (F3H), flavonoid-3′-hydroxylase (F3′H), flavonoid-3′,5′-hydroxylase (F3′5′H), dihydroflavonol 4-reductase (DFR), and anthocyanidin synthase (ANS), ultimately resulting in the formation of unstable anthocyanidins. Subsequently, these unstable anthocyanidins undergo modification by glycosyltransferases (UPD-GTs) and methyltransferases (MT) to form stable anthocyanins [5,6,7]. Beyond the encoding of structural genes for enzymes, the regulation of anthocyanin biosynthesis also involves transcription factors such as WD40, bHLH, and R2R3-MYB [8,9]. While the anthocyanin biosynthesis pathway has been extensively scrutinized in numerous plants, our understanding of the anthocyanin synthesis in Cornus officinalis remains limited.
Cornus officinalis, a member of the Cornaceae family, is esteemed for its medicinal properties, predominantly derived from its dried and mature pulp [10]. Recognized for its role in nourishing the liver and kidneys, as well as in promoting astringency and alleviating stagnation, Cornus officinalis gained acclaim in 2023 when it was included on the homology list of medicine and food by the China National Health Commission and Market Supervision Administration. Through a historical analysis of materia medica from past dynasties, the distinctive features of Cornus officinalis Sieb. et Zucc., including a “bright red color, thick flesh, oily texture, sourness, and astringent taste”, have been crucial markers [11]. The association between the intensity of the red coloration and the quality of Cornus officinalis is widely recognized, as color plays a crucial role in determining its medicinal value [12]. The coloration of the Cornus officinalis pericarp is the most conspicuous and prominent characteristic, serving as a crucial parameter for grading its quality.
The fruit color and quality are pivotal attributes of Cornus officinalis, yet the chemical composition and the molecular regulatory mechanisms influencing the flavor quality and coloration in this species remain elusive. This raises the following question: how does the pericarp of a Cornus officinalis fruit undergo the process of turning red during ripening? The regulation of the pericarp color in Cornus officinalis is a complex process, necessitating advanced techniques such as transcriptomics (RNA-Seq) and metabolomics (LC/MS) for screening the metabolites and associated genes involved in the coloration and quality development [13,14]. We categorized Cornus officinalis into stages of young, middle, and mature fruits based on variations in the pericarp color during the different developmental phases [15]. Anthocyanins have been identified as pivotal contributors to the development of red fruits, demonstrating the link between anthocyanins and pericarp coloration [16,17,18]. We delved into the anthocyanin biosynthesis pathway in Cornus officinalis through metabolomic and transcriptomic approaches. Firstly, we performed qualitative and quantitative analyses of the metabolite changes during the pericarp color transformation. Further onwards, a functional analysis of the differentially expressed genes was conducted, along with an evaluation of the Gene Ontology (GO) annotations and Kyoto Encyclopedia of Genes and Genomes (KEGG) pathway enrichment. Finally, we conducted a correlation analysis between the transcriptomic profiles and anthocyanin contents to shed light on the underlying variations in the mechanism governing the fruit pericarp pigmentation in Cornus officinalis.
2. Results
2.1. Phenotypic Characteristics of Cornus officinalis Fruits
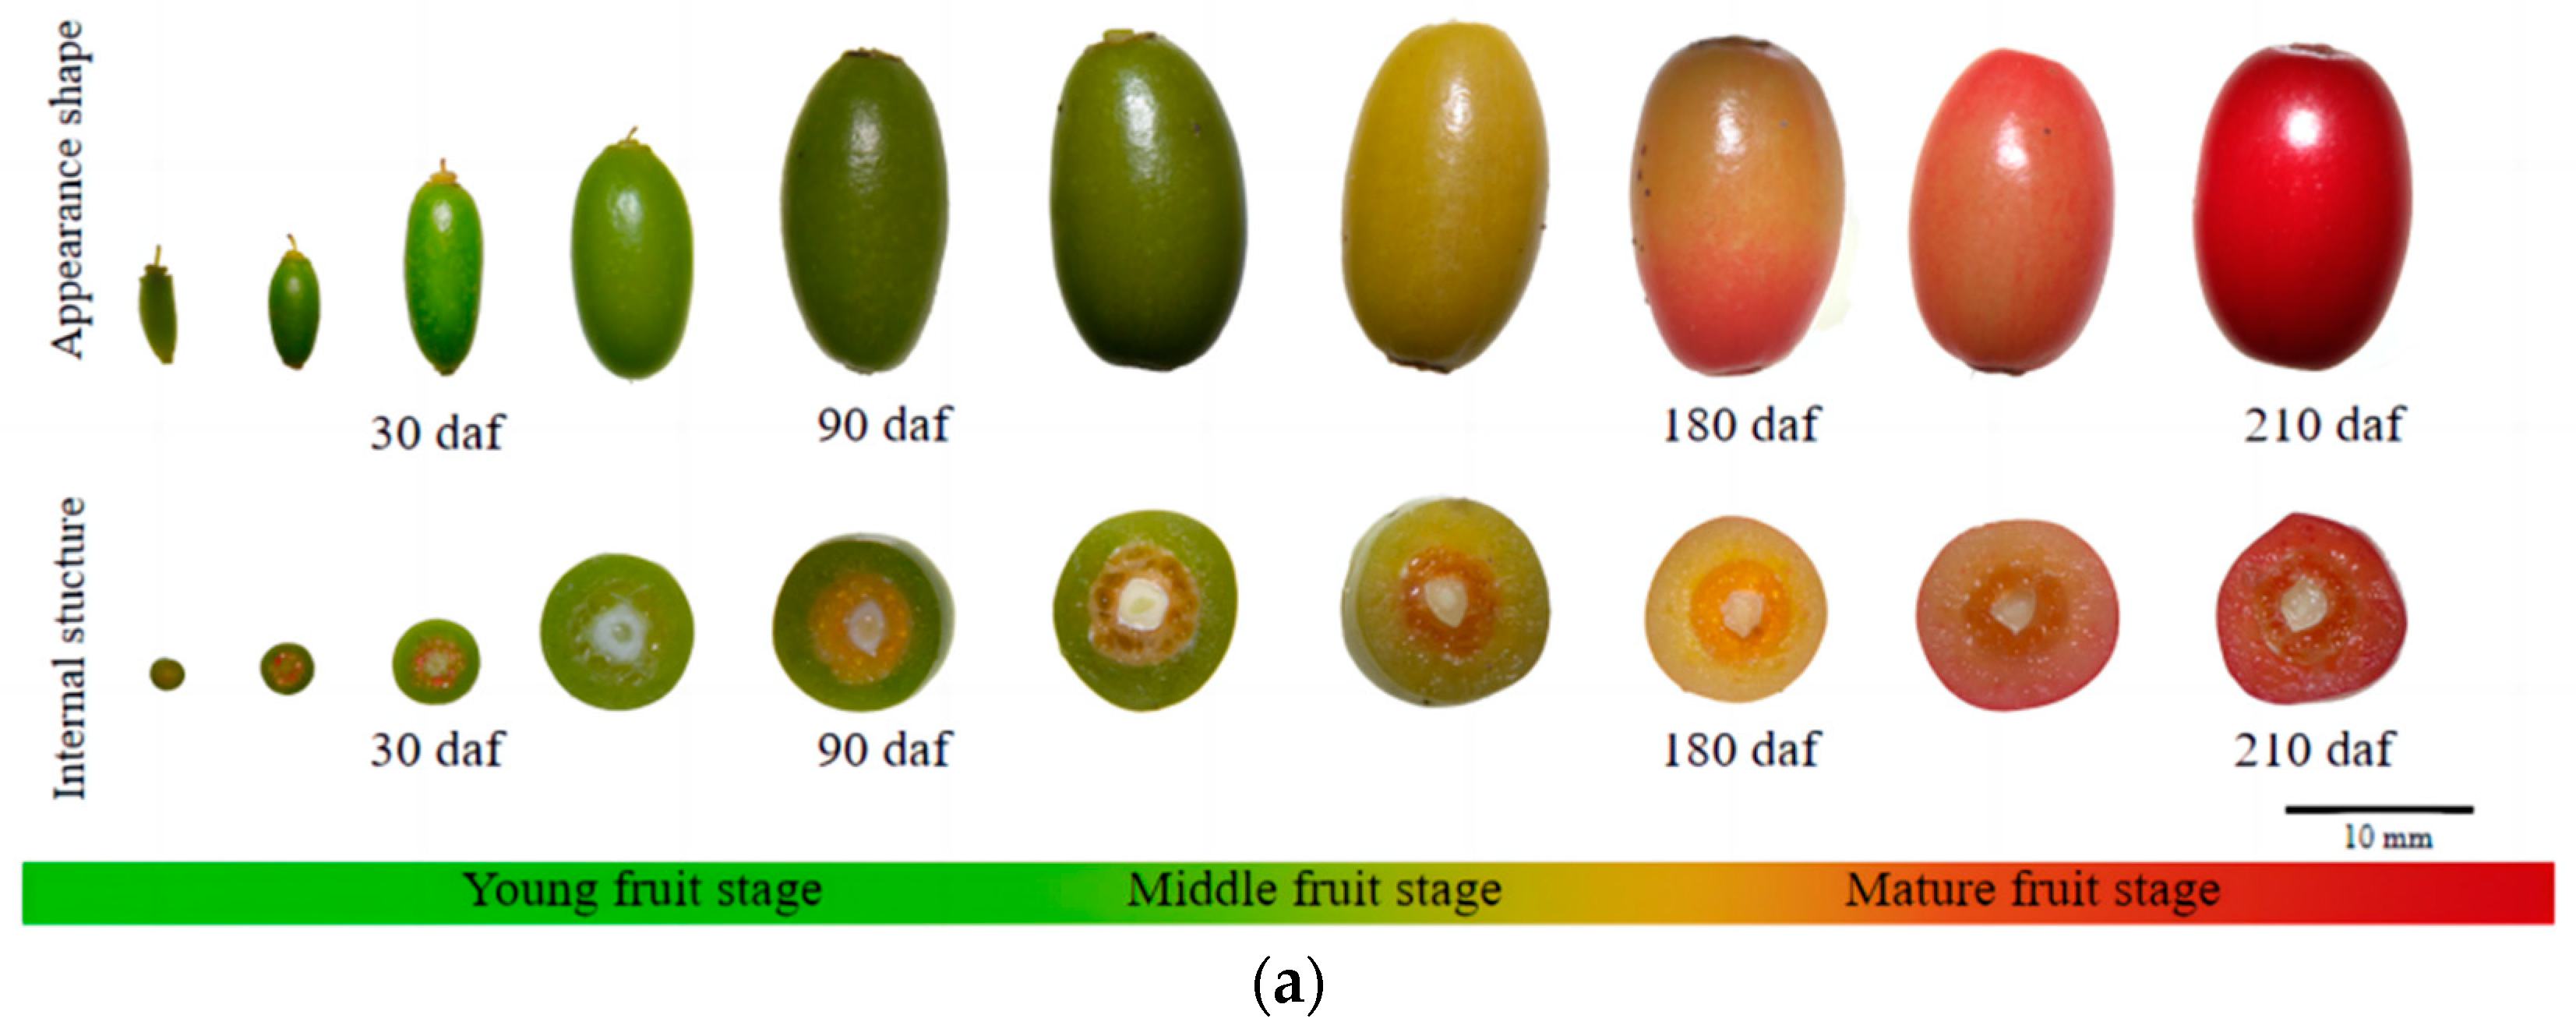
We observed that the fruit of Cornus officinalis possesses a long oval shape, and its coloration undergoes significant variations at different developmental stages. The fruit of Cornus officinalis exhibited accelerated growth from flowering to 90 days after flowering. During this period, both the longitudinal and transverse diameters of the fruit increased continuously, the average growth rate was 13.87%, and the pericarp displayed a green color. Between 90 and 180 days after flowering, the fruit’s transverse diameter reached its maximum of 8.8556 mm at 180 days after flowering (Figure 1c). Concurrent with its maturation, the pericarp transitioned from green to yellow. From 180 to 210 days after flowering, both the longitudinal and transverse diameters of the fruit stabilized, and the pericarp changed from yellow to red. Further fruit development led to a deepening of the pericarp color to a bright-red hue (Figure 1a). Further anatomical analysis revealed that the pigment cells primarily aggregate in the epicarp of Cornus officinalis. As the fruit develops, a clear transition from green to red coloration can be observed (Figure 1d). Cornus officinalis fruits from various developmental stages were longitudinally sectioned to observe changes in the pericarp. The pericarp exhibited a layer of neatly arranged rectangular cells. In the young-fruit (YG) period of the Cornus officinalis fruits, the thin-walled cells of the pericarp were smaller, and the cell size was 0.0119 ± 0.0025 mm. With the continued development of the fruits, the thin-walled cells of the pericarp in the middle-fruit (ZG) period gradually enlarged, and the cell size was 0.0415 ± 0.0143 mm, accumulating a significant amount of material. In the mature-fruit (SG) period of the pericarp, the thin-walled cells expanded, the cell size was 0.0862 ± 0.0278 mm, and the material accumulation gradually decreased (Figure 1e). The endogenous factor contributing to the alteration in the fruit color is the variation in both the pigment content and composition within the fruit. Quantitative analysis of the anthocyanin content across the three developmental periods further affirmed a continuous accumulation of anthocyanins in the Cornus officinalis fruits throughout their growth stages. Notably, a rapid increase in the anthocyanin content was observed from 180 to 210 days after flowering, and it increased to 152.6292 mg·g−1 at 210 days after flowering (Figure 1b).

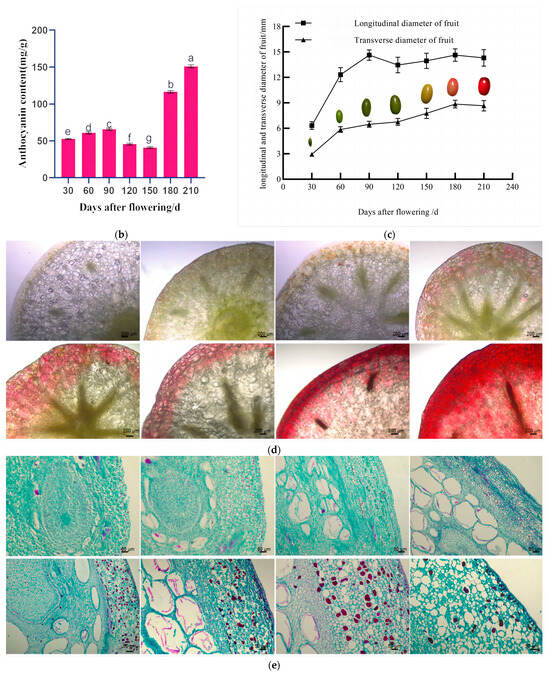
Figure 1.
Pigmentation and phenotype of Cornus officinalis pericarp in three developmental periods. (a) Fruit phenotype: young fruit stage (flowering—90 daf), middle fruit stage (90–180 daf), and mature fruit stage (180–210 daf) (daf: days after flowering). (b) Anthocyanin content of Cornus officinalis pericarp at different developmental stages. (c) Changes in fruit longitudinal and transverse diameters at different developmental stages. (d) Changes in exocarp color at different developmental stages. (e) Changes in epicarp cells at different developmental stages. Scale bars, 10 mm, 200 μm, and 50 μm; different normal letters mean p < 0.05.
2.2. Metabolome Analysis
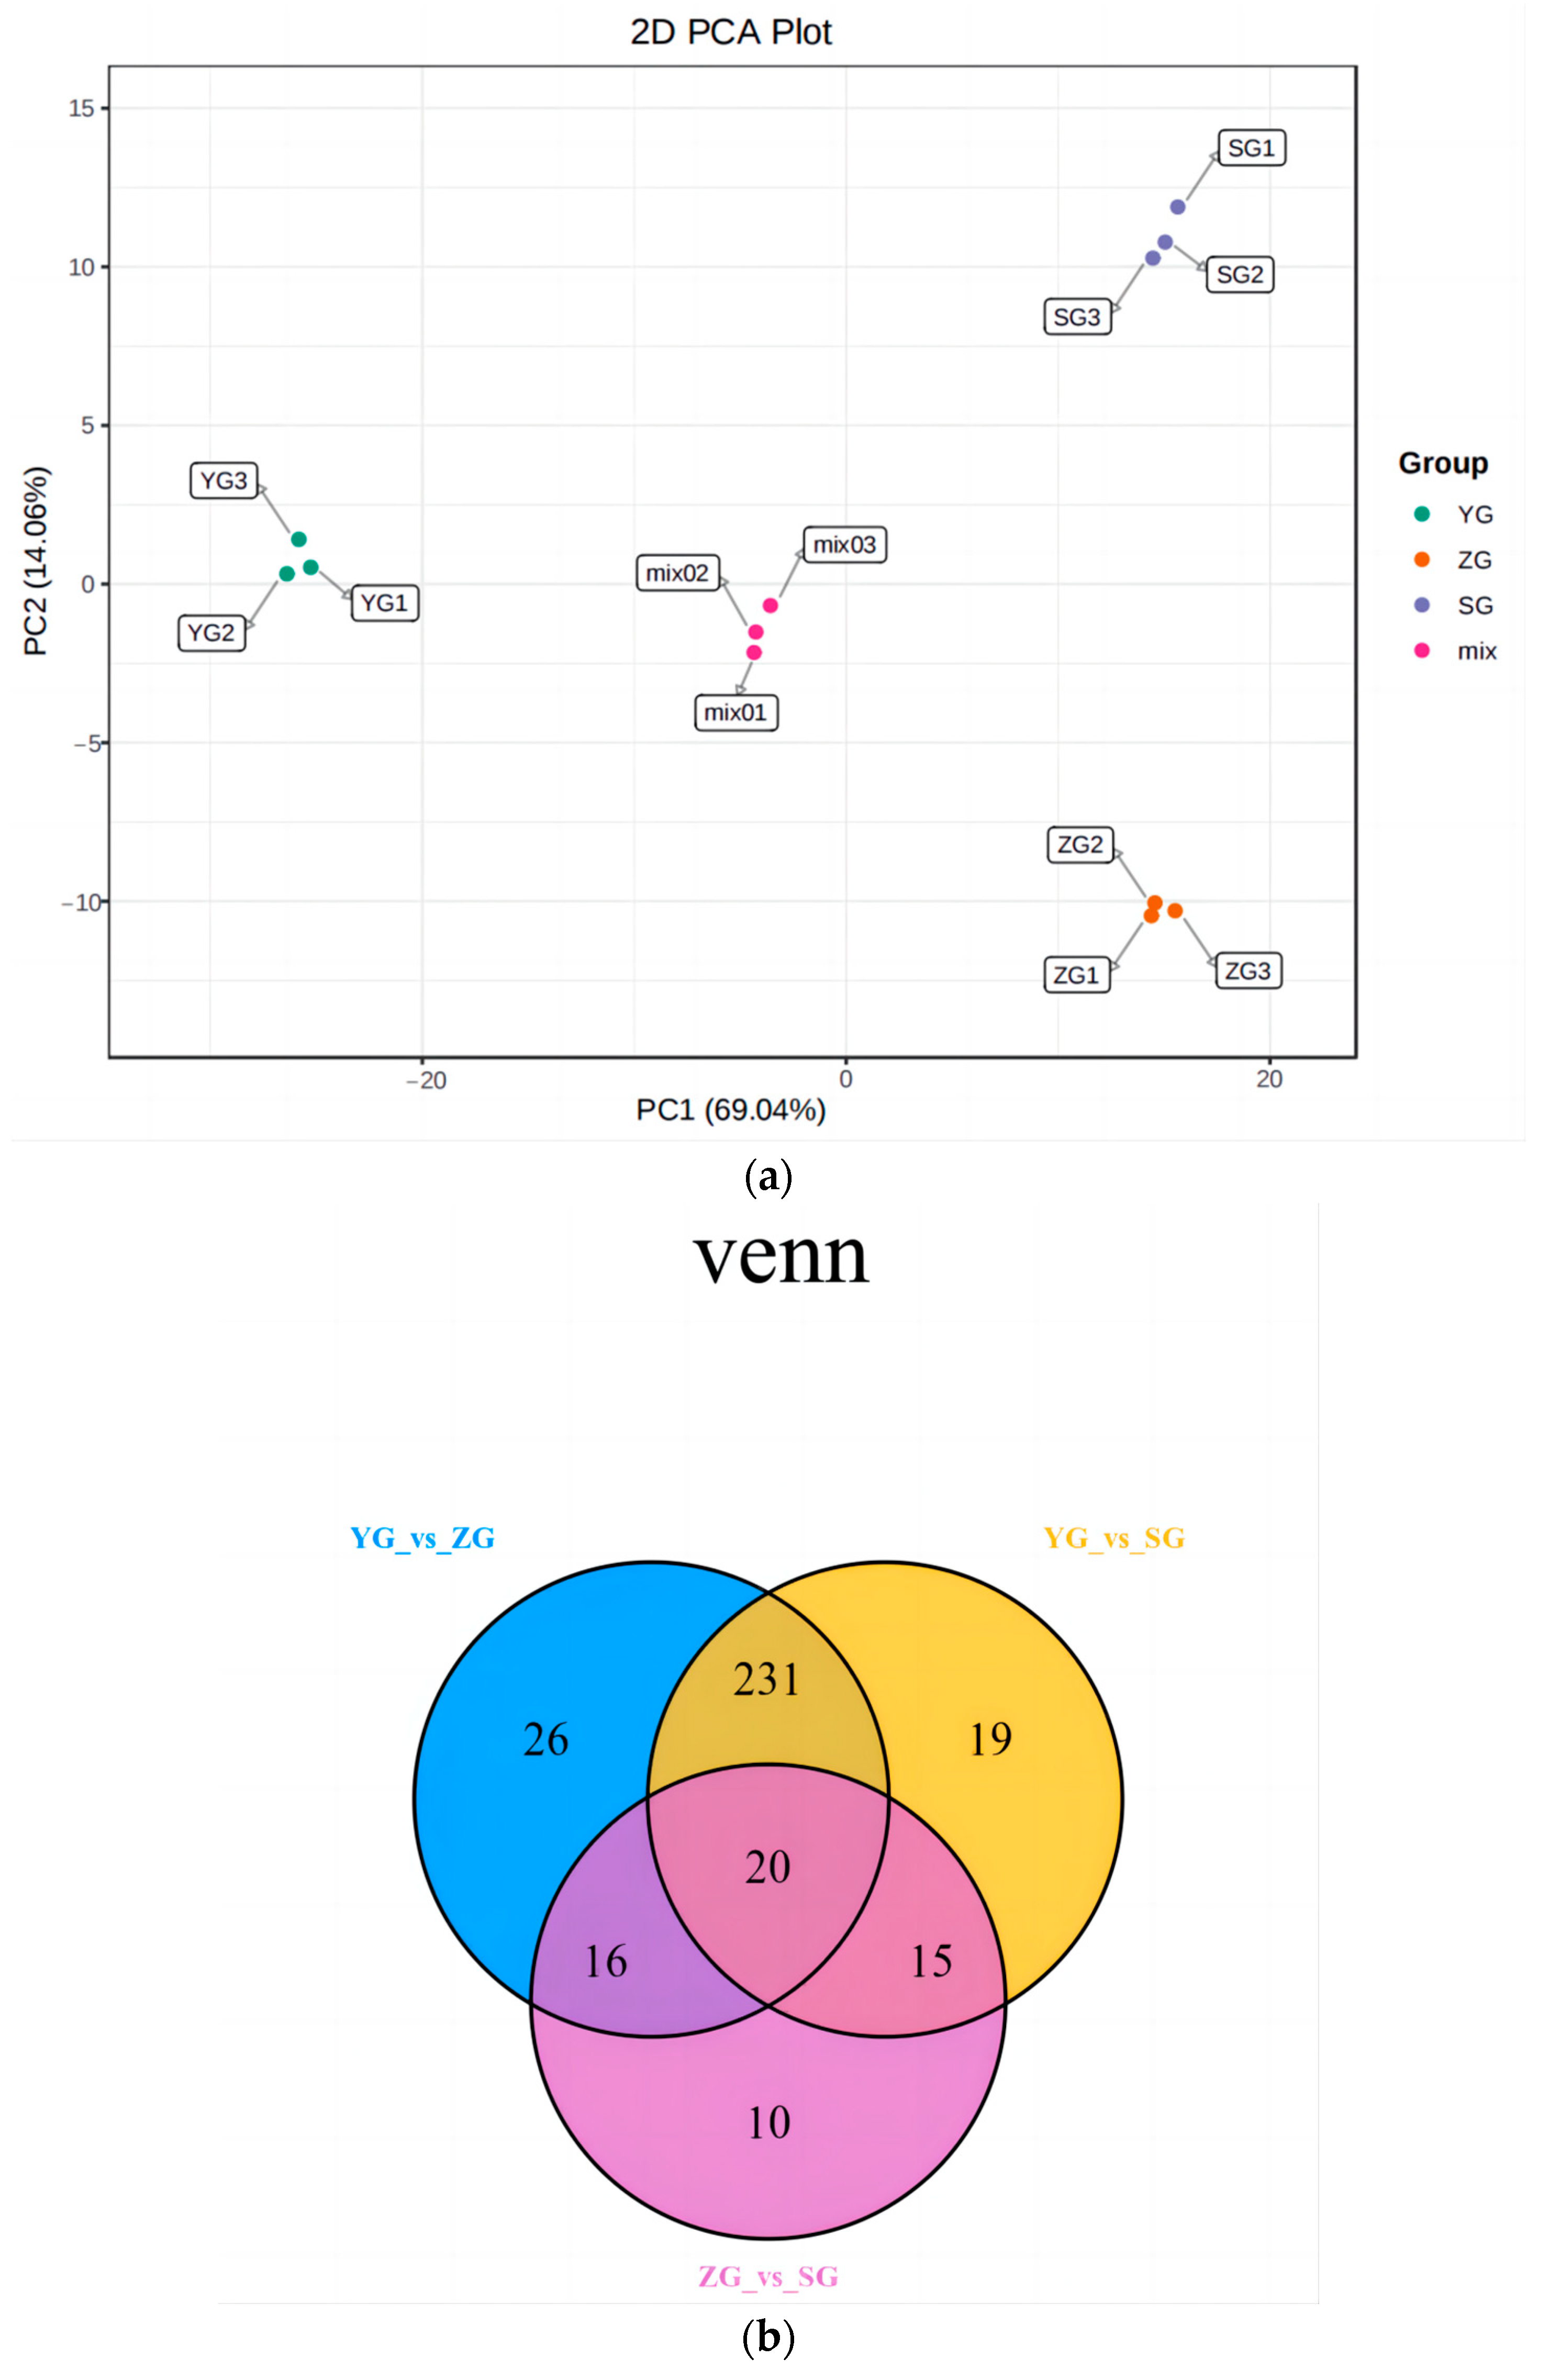
Principal component analysis (PCA) was conducted to analyze the samples from the YG phase, ZG phase, and SG phase, alongside the quality control samples (represented by the mixed samples in the figure). To obtain a preliminary insight into the overall metabolic distinctions and the extent of the variability within the groups, we analyzed the YG-, ZG-, and SG-phase samples, along with the quality control samples. In the principal component analysis (Figure 2a), the cumulative contribution of the principal components for the Cornus officinalis fruits across the various developmental periods reached 83.1%. Notably, a substantial separation was observed between the YG stage and the ZG and SG stages along principal component 1 (PC1), accounting for a significant contribution of 69.04%. This observation indicates pronounced changes in the metabolites within the Cornus officinalis fruits during the distinct developmental periods, serving as a foundation for the subsequent analysis of the differential metabolites.

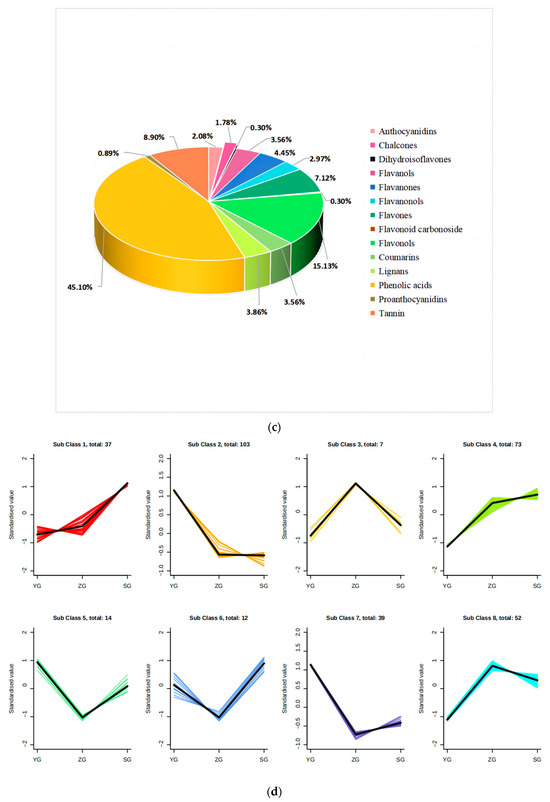
Figure 2.
Preliminary analysis of metabolomic data. (a) Plot of principal component analysis among replicate samples of Cornus officinalis fruits at different developmental periods. (b) Venn diagram between differential groupings. (c) Classification map of metabolites in fruit of Cornus officinalis. (d) Differential metabolite K-means plot.
Variable Importance in Projection (VIP) and Fold Change were employed as the criteria for screening the differential metabolites. Metabolites meeting the conditions of a Fold Change ≥ 2 and a Fold Change ≤ 0.5, along with a VIP ≥ 1, were selected. In this manner, we identified the accumulation of differential metabolites among the three groups of Cornus officinalis fruits at the YG, ZG, and SG stages. The results revealed the identification of a total of 447 metabolites classified into 14 classes (Figure 2c). Among these, the numbers of differential metabolites for the YG_vs._SG, YG_vs._ZG, and ZG_vs._SG groups were 285, 293, and 61, respectively (Figure 2b).
To examine the metabolite patterns across different tissues, we conducted a K-means cluster analysis. Subclass 1 exhibited elevated levels of certain differential metabolite correlates in the SG phase, primarily consisting of 13.5% anthocyanidins and 24.3% flavonols. In contrast, subclass 2 comprised 103 metabolites with high contents, predominantly composed of 39.8% phenolic acids and 17.4% tannins (Figure 2d; Table S2).
2.3. KEGG Enrichment of DAMs in Cornus officinalis
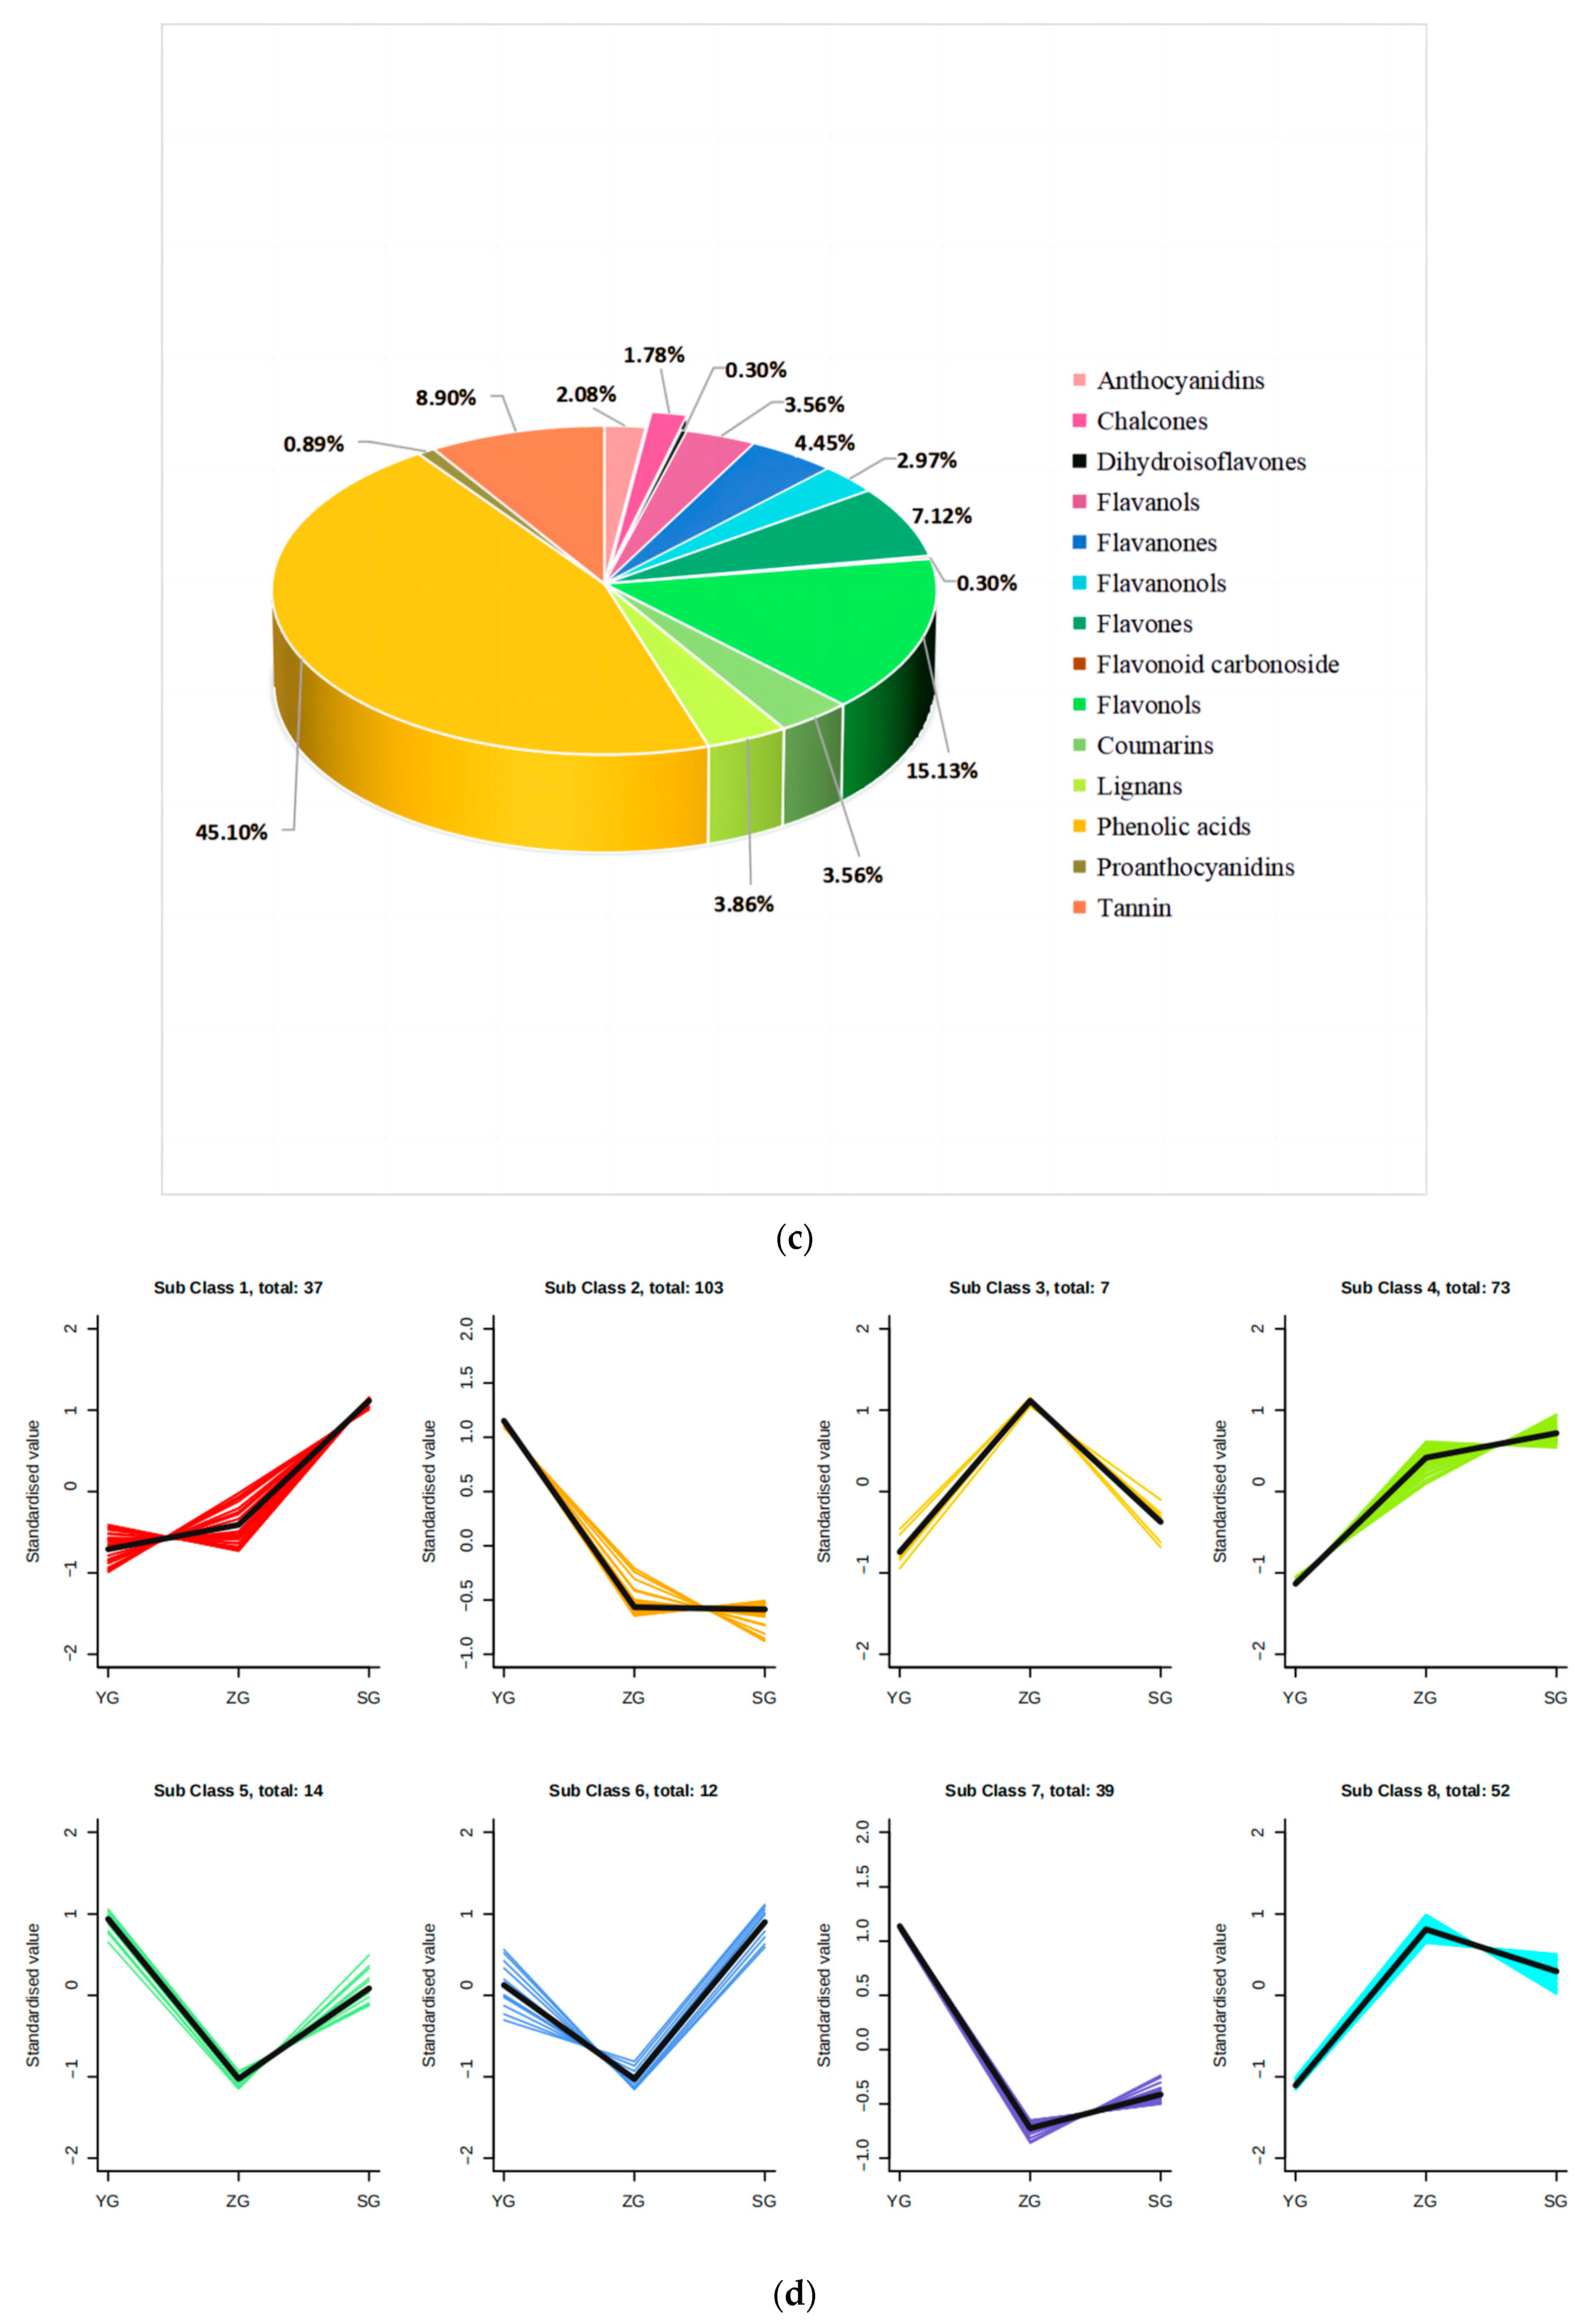
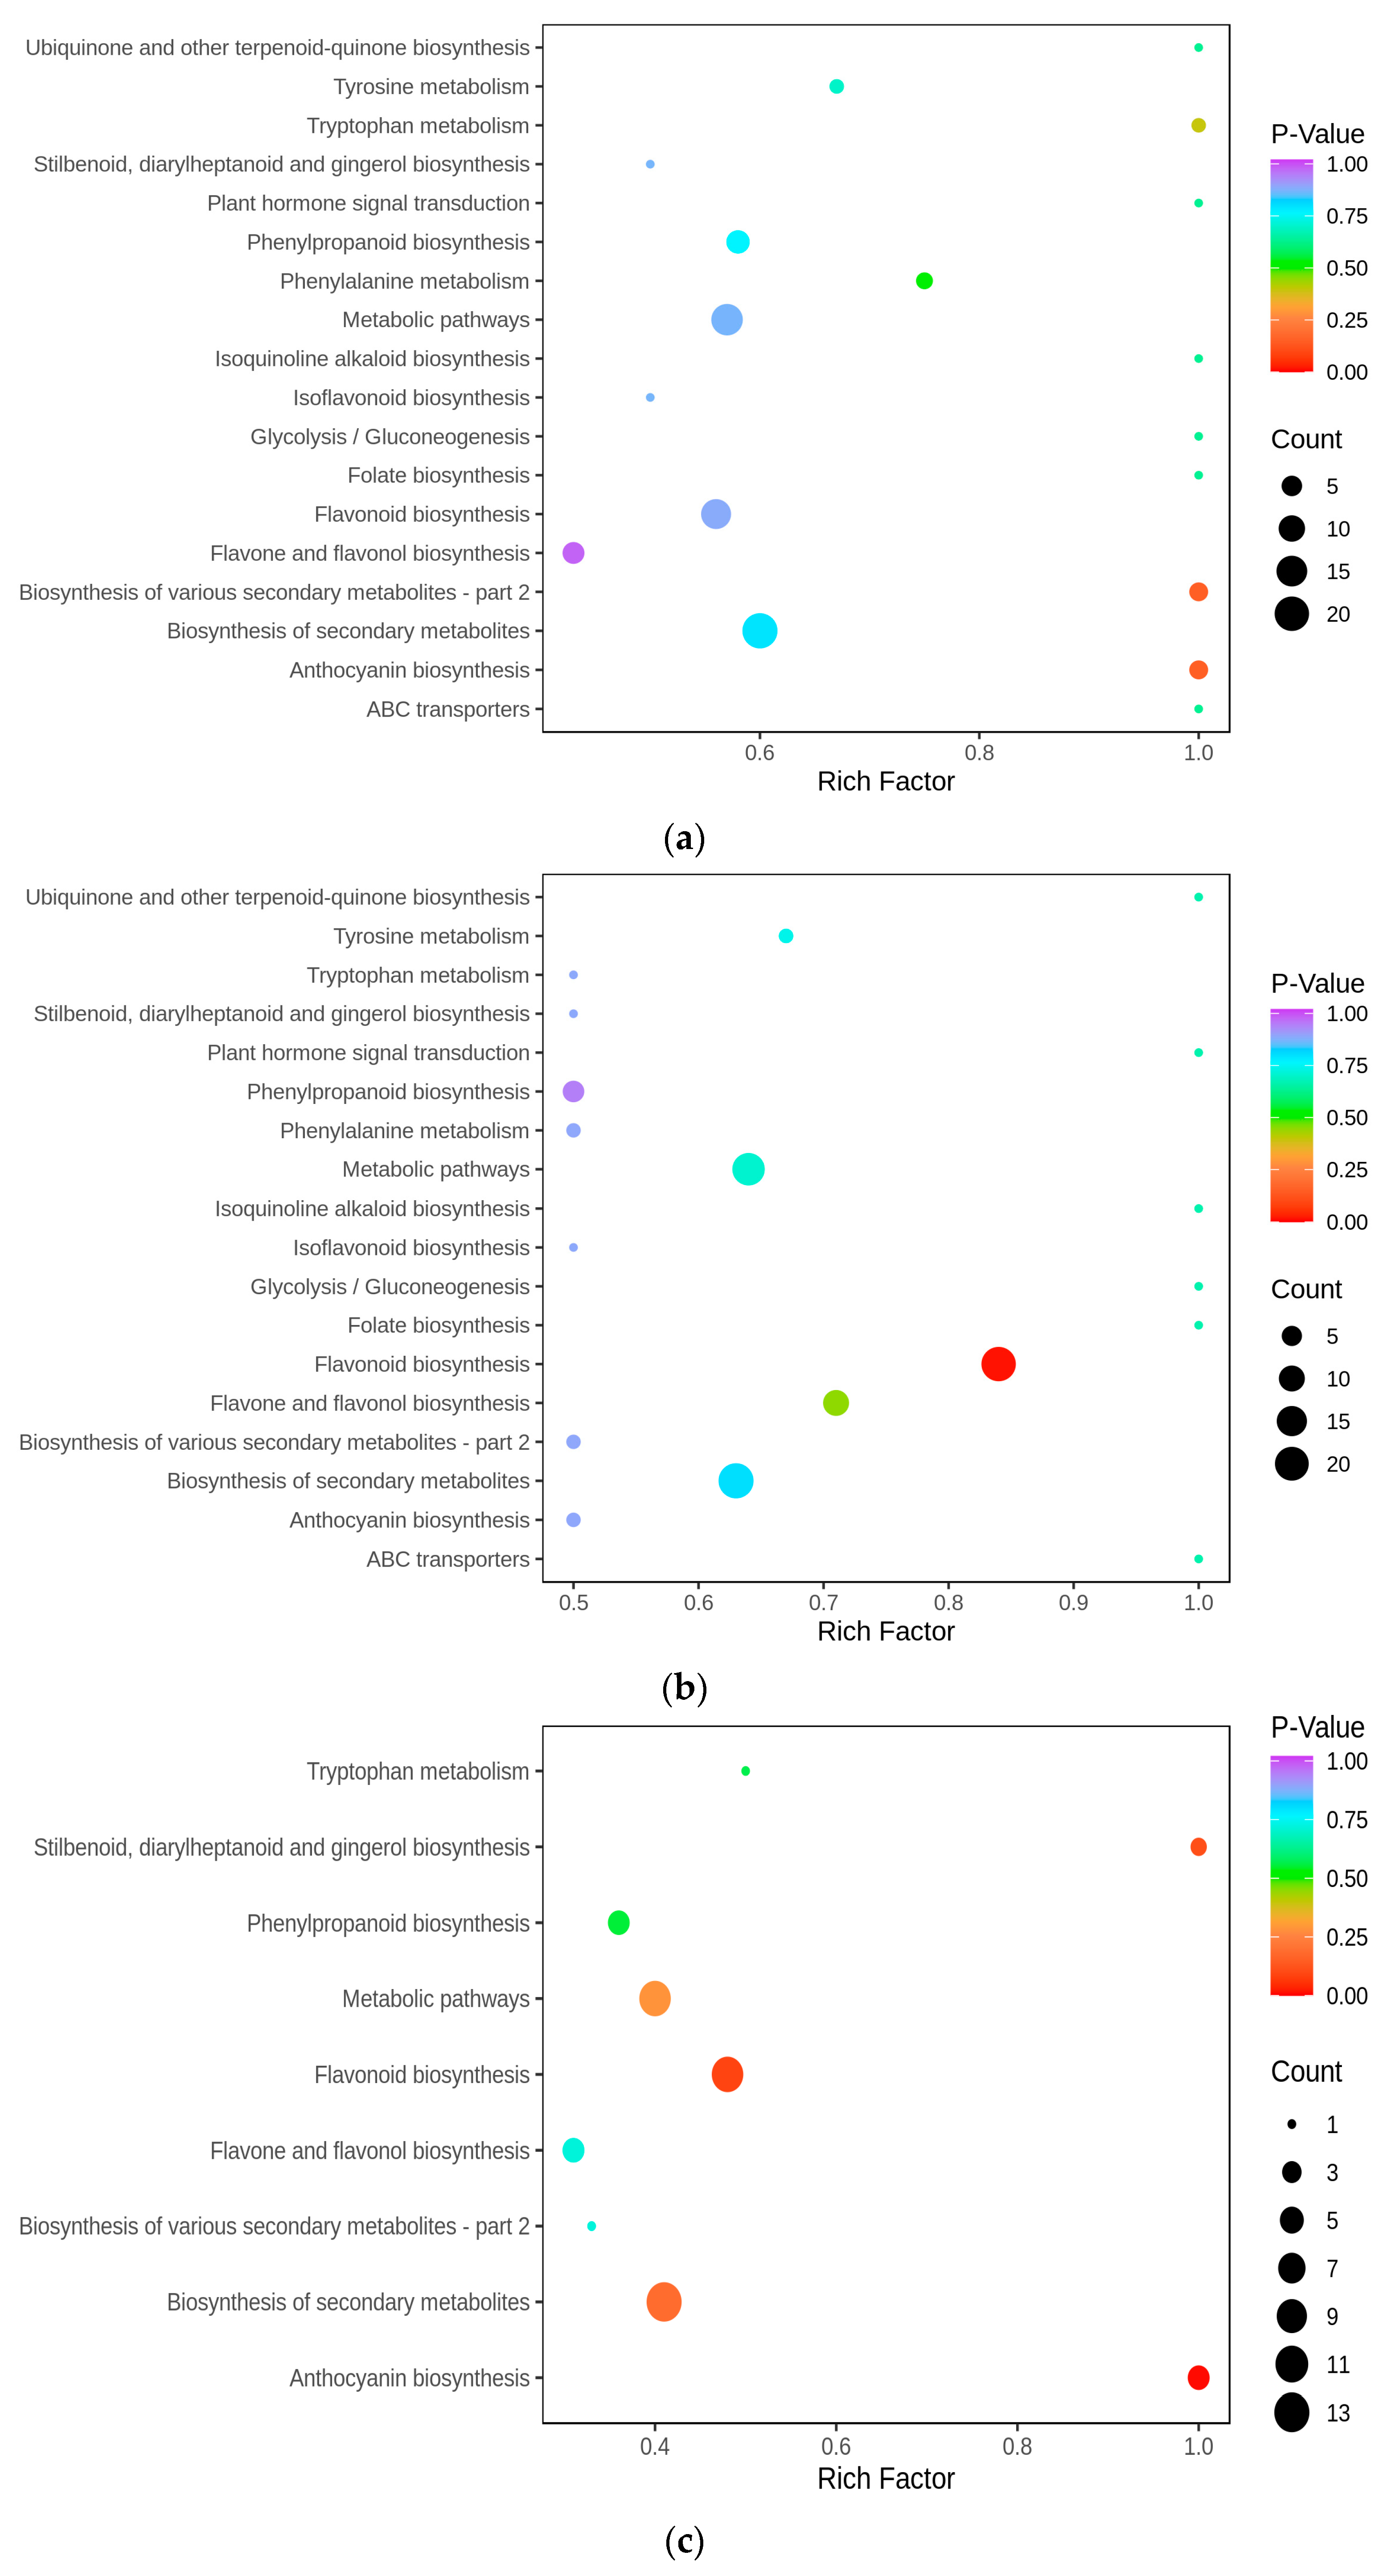
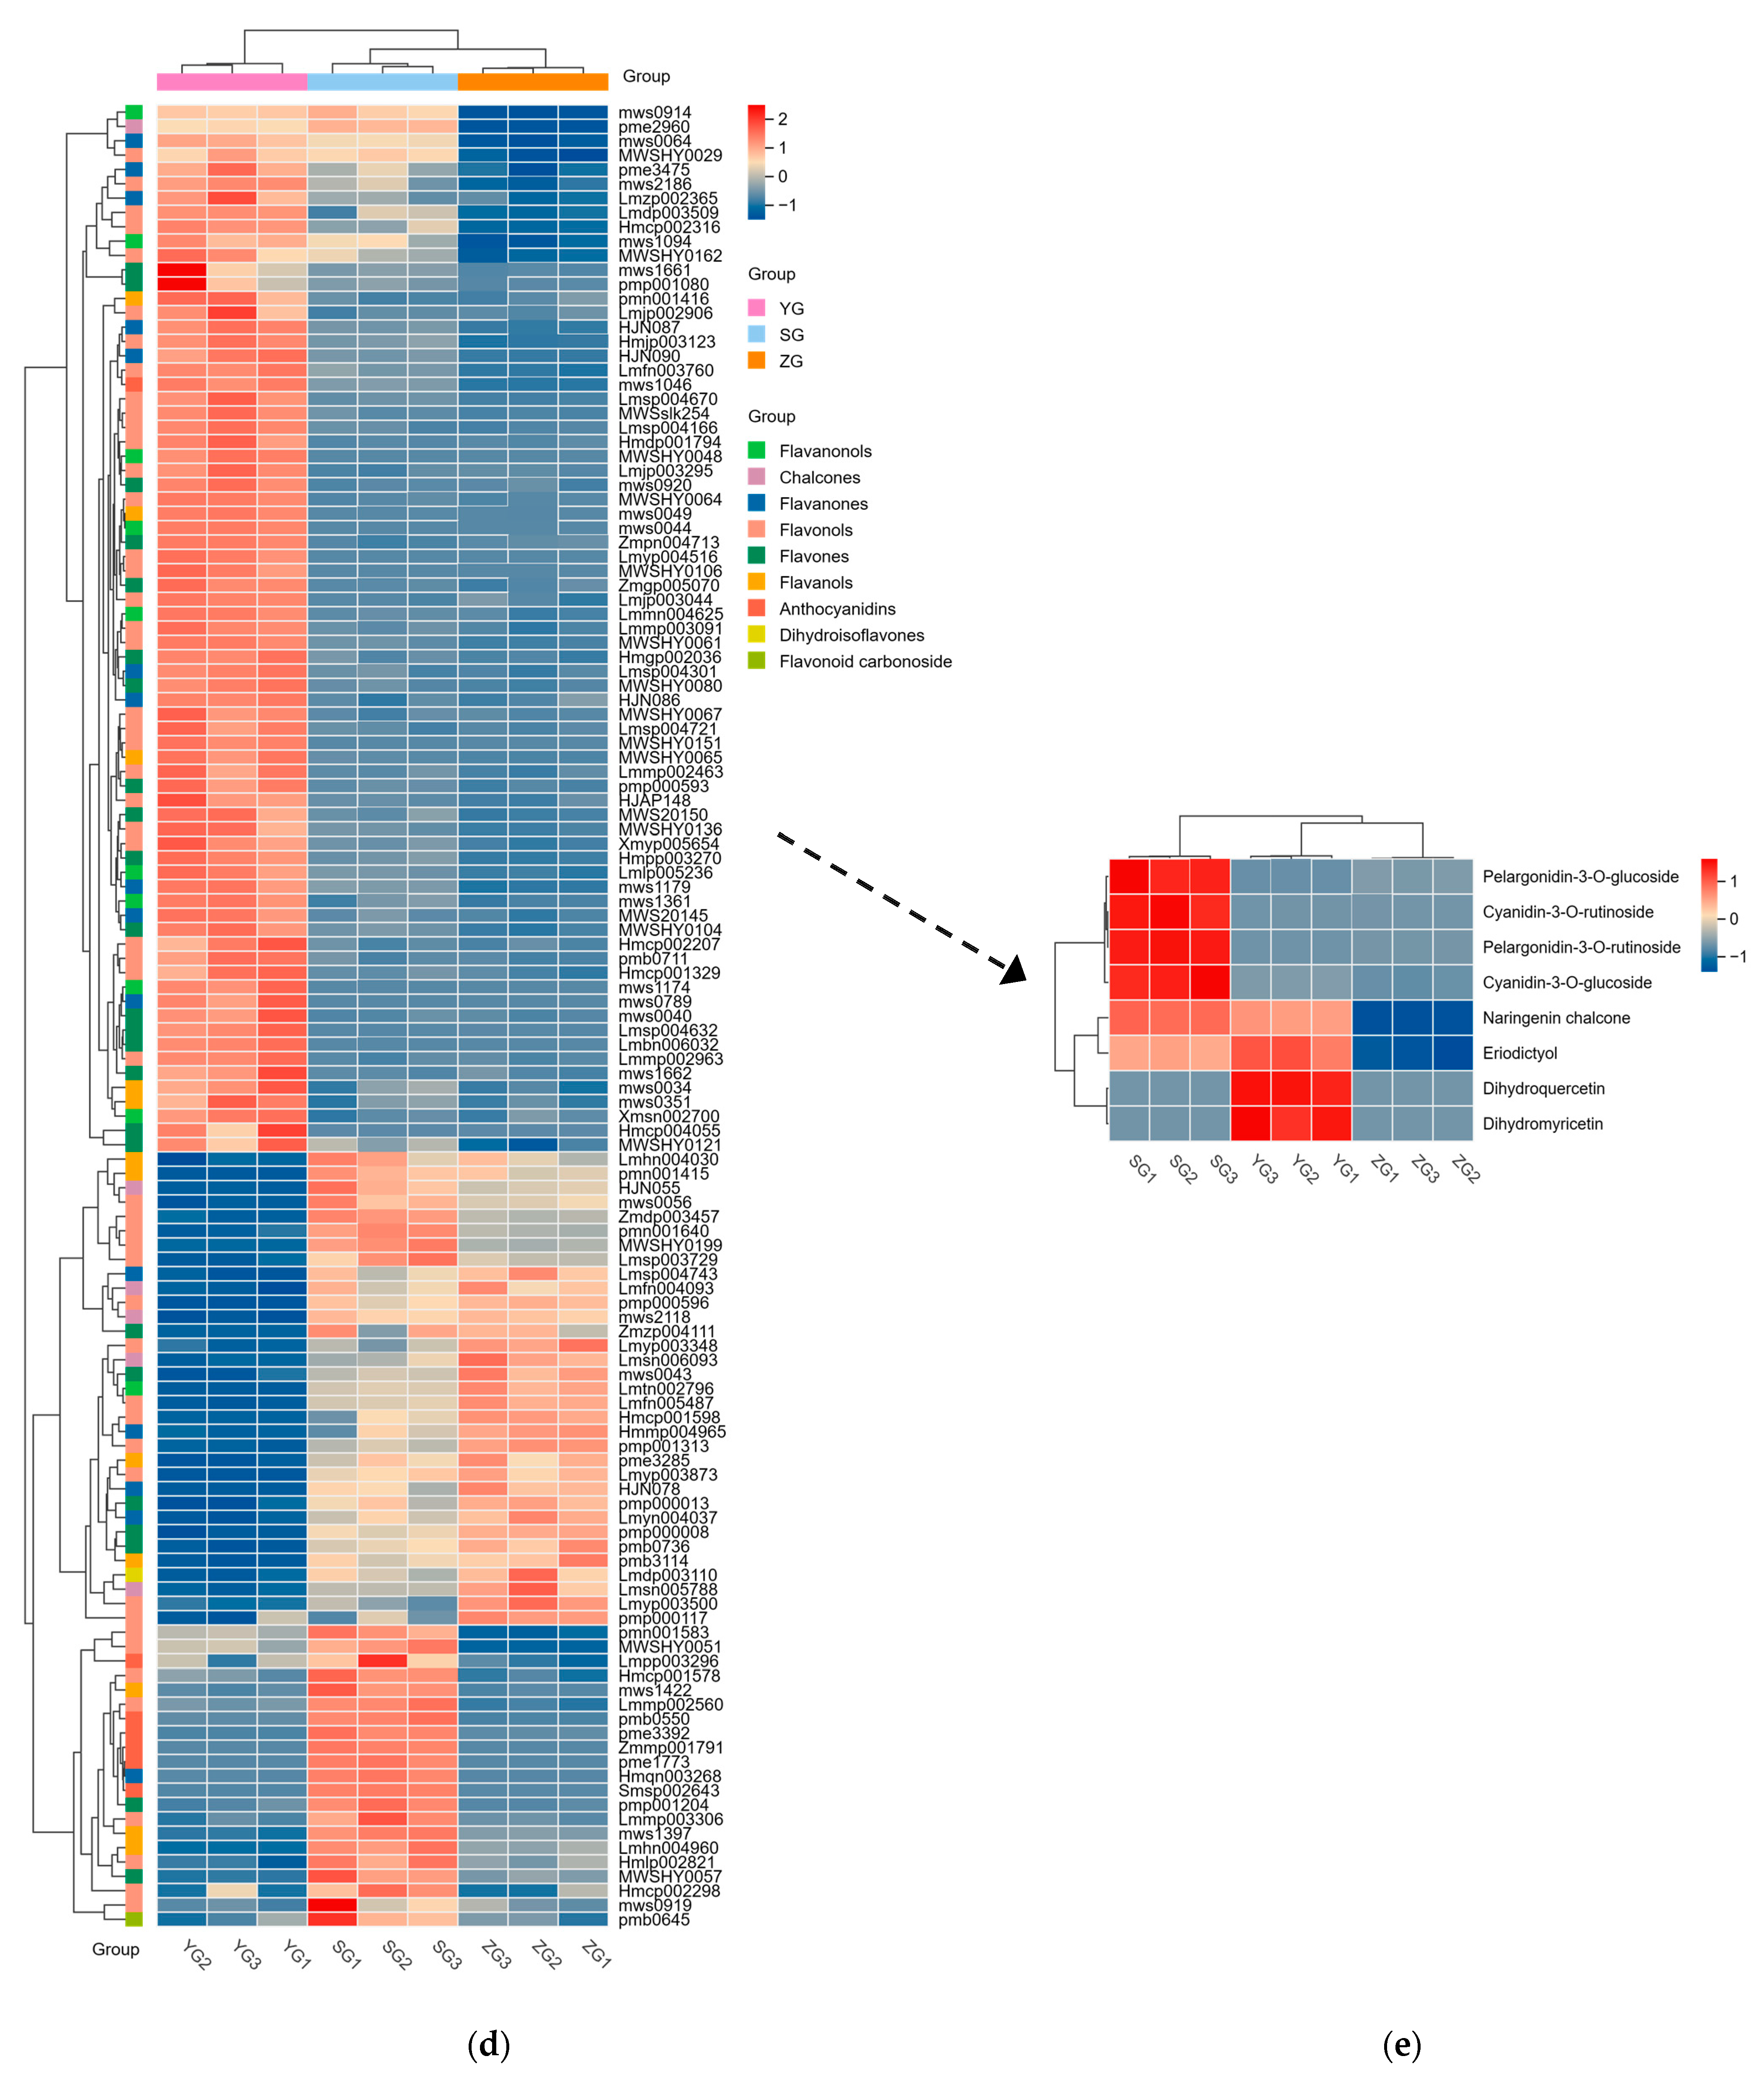
To unravel the principal pathways of the differentially accumulated metabolites (DAMs) in Cornus officinalis, this study employed KEGG enrichment analysis. The results revealed that the distinctive metabolites were predominantly enriched in five pathways. Among them, flavonoid biosynthesis and anthocyanin biosynthesis were highly correlated with anthocyanin synthesis. Other pathway enrichment results include metabolic pathways, the biosynthesis of various secondary metabolites-part2, and flavone and flavonol biosynthesis and flavonol biosynthesis (Figure 3a,c). By comparing the metabolic profiles of three samples, we discovered that 127 flavonoid metabolites have different levels of accumulation (Figure 3d). To analyze these differential metabolites and further explore the reasons for the red coloration of Cornus officinalis pericarp, eight differential metabolites associated with anthocyanin synthesis were identified (Figure 3e). Notably, the ionic abundance of Cyanidin-3-O-glucoside and Pelargonidin-3-O-rutinoside significantly increased with the fruit development, underscoring the substantial contribution of these two compounds to the mechanism of fruit pericarp coloration. Additionally, many flavonoid compounds, flavonol glycosides, flavanol compounds, and other DAMs gradually increased, including 7-O-galloyltricetiflavan and quercetin-3-O-(6″-galloyl)galactoside, suggesting that flavonoid compounds may also play an important role in the formation of the Cornus officinalis pericarp color.
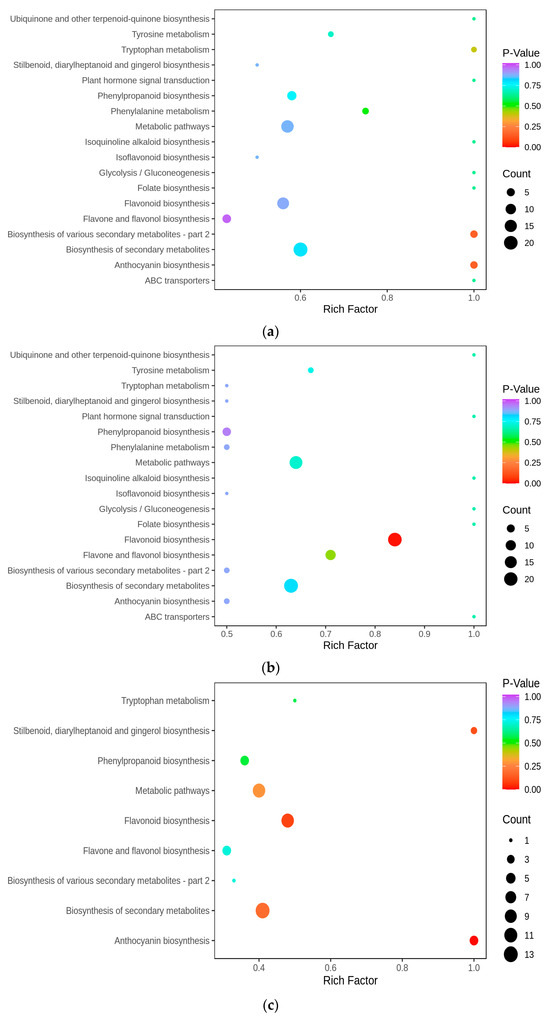
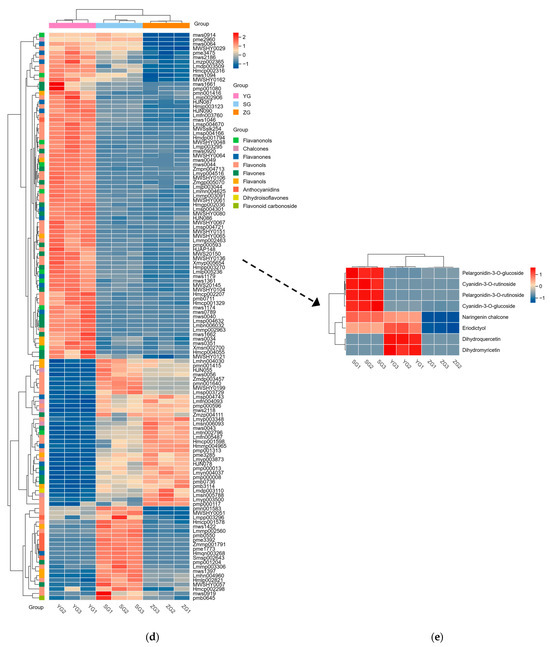
Figure 3.
Distribution and analyses of DAMs. (a–c) KEGG enrichment map of YG_vs._SG, YG_vs._ZG, and ZG_vs._SG differential metabolites. (d) Heatmaps displaying differences in flavonoid accumulation in Cornus officinalis fruits during three developmental periods. (e) Heatmap of relative contents of differential metabolites involved in anthocyanin synthesis. Note: YG, ZG, and SG represent the three different periods of fruit development of Cornus officinalis. The closer the p-value is to 0, the more significant the enrichment. The sizes of the dots in the graph represent the numbers of differentially significant metabolites enriched to the corresponding pathway. Different normal letters mean p < 0.05.
2.4. Transcriptome Analysis and Differentially Expressed Gene Identification at Different Stages of Cornus officinalis
Transcriptome analysis was conducted on the Cornus officinalis samples from three distinct developmental stages: the young-fruit (YG) stage, middle-fruit (ZG) stage, and mature-fruit (SG) stage. Fragments per kilobase of transcript per million (FPKM) values were used to calculate the gene expression abundance. The expression level distributions indicated a consistent pattern within each cluster across all the groups (Figure 4a). Within the triplicates of each group, the square values of the Pearson’s correlation coefficients (R2) were all above 0.9, demonstrating the high credibility of the gene expression (Figure 4b). The Venn diagram (Figure 4c) illustrates the overlap of differential genes in various comparative combinations. There were 18,474 DEGs between the YG and ZG groups, 21,347 DEGs between the YG and SG groups, and 6245 DEGs between the ZG and SG groups. Among these DEGs, 2112 were shared across groups, and 13 of them were identified as genes associated with the anthocyanin biosynthetic pathway (Table 1).
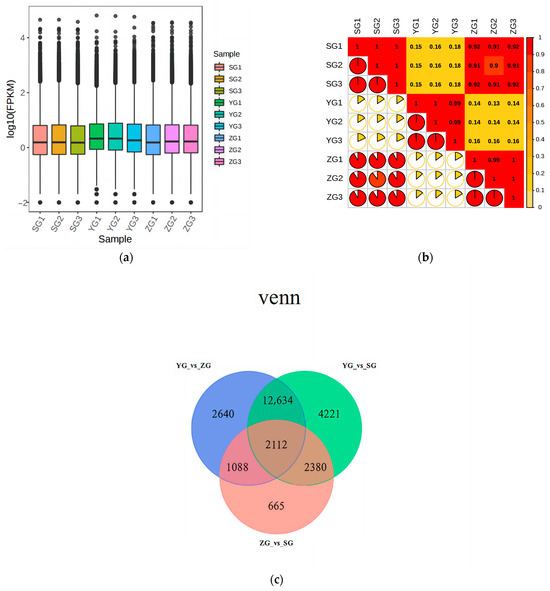
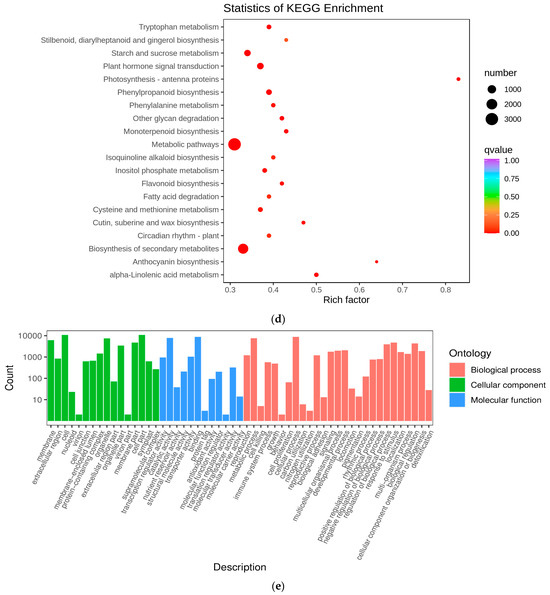
Figure 4.
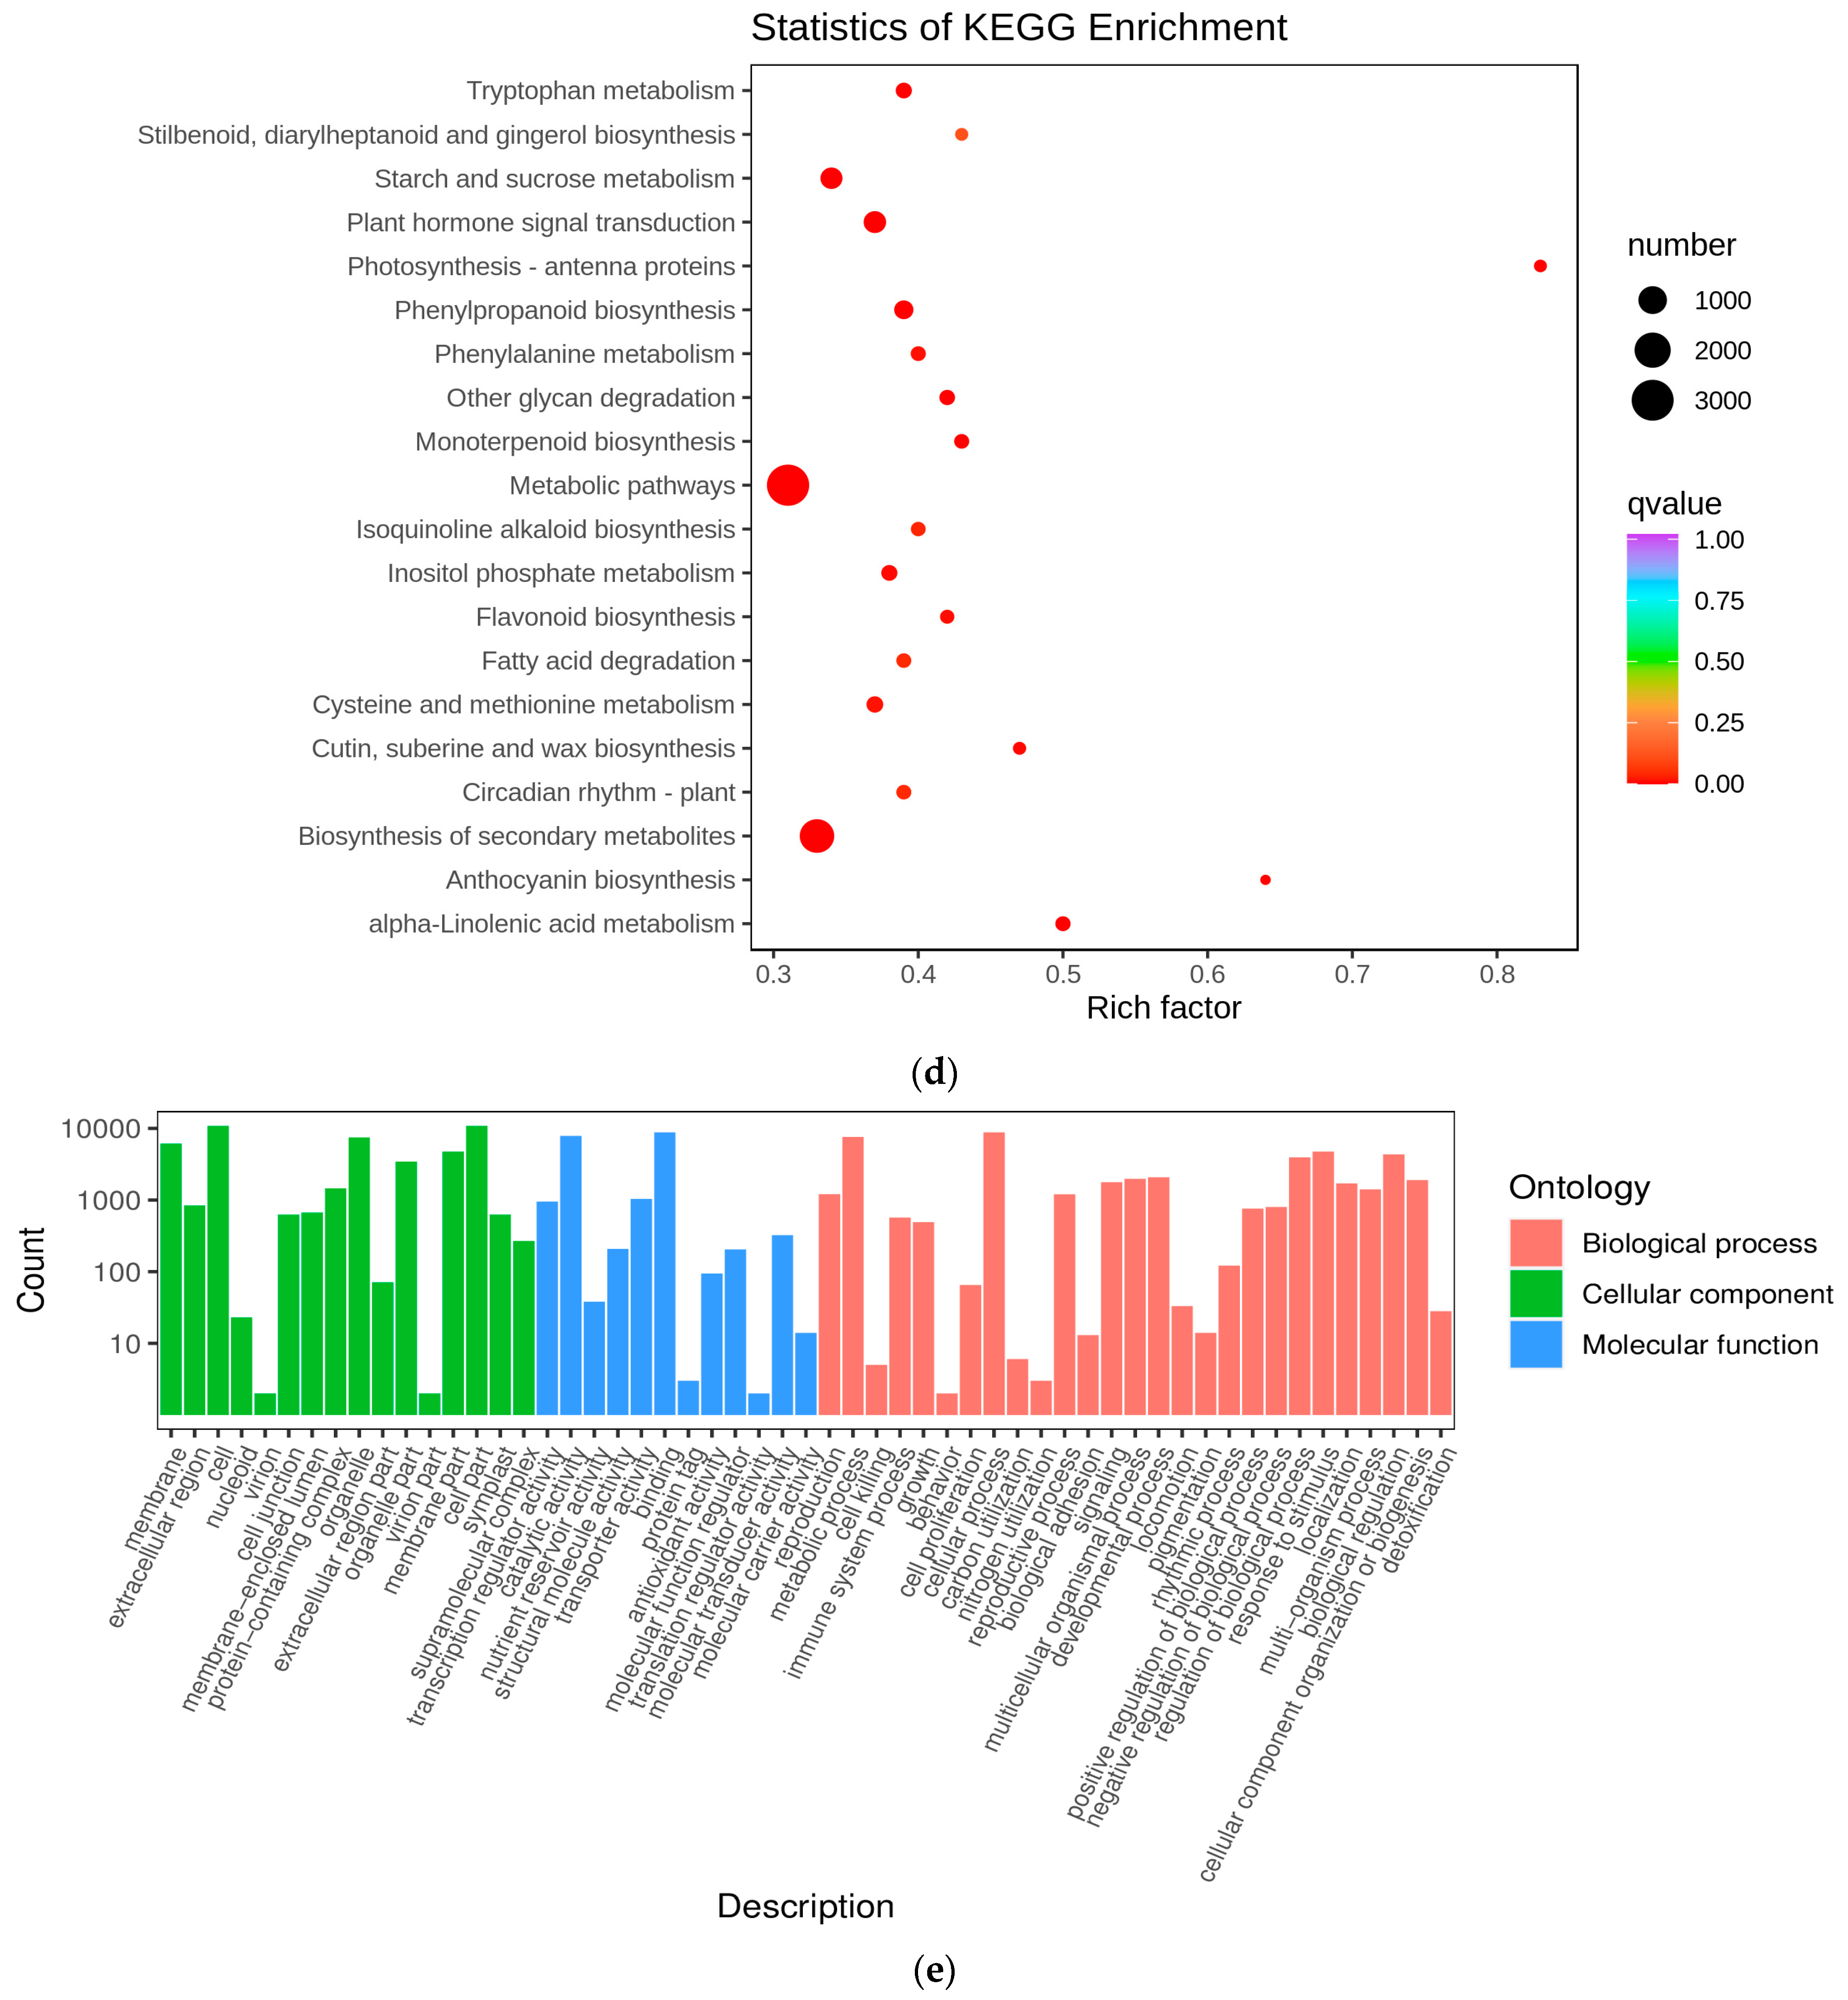
Preliminary analysis of transcriptome data. (a) Boxplot of unigenes expressed in the three groups of Cornus officinalis samples, presenting the distributions of the expression levels. (b) The square values of the Pearson’s correlation coefficients (R2). (c) Venn diagram of DEGs. (d) KEGG enrichment scatter plots of DEGs between YG and SG stages. (e) Differential gene GO enrichment analysis.

Table 1.
Genes shared by biosynthesis pathways of Cornus officinalis and anthocyanins in three groups at different developmental stages.
To identify the differentially expressed genes (DEGs) involved in the metabolic pathways at the different stages, we subjected all the DEGs to Gene Ontology (GO) and KEGG enrichment analyses. In this experiment, the differential genes were categorized by GO into three groups: molecular functions, biological processes, and cellular components. Within the biological processes, the genes associated with secondary-metabolite biosynthetic processes and hormone metabolic processes exhibited the highest abundances (Figure 4e). In Figure 4d, we present the 20 most significantly enriched pathway entries, discovering that the three distinct developmental stages of Cornus officinalis were notably enriched in anthocyanin biosynthesis, phenylpropanoid biosynthesis, flavonoid biosynthesis, metabolic pathways, and the biosynthesis of secondary metabolites. Anthocyanin biosynthesis exhibited the highest pathway enrichment factor (Rich factor). Upon scrutinizing the KEGG enrichment results, it became evident that YG_vs._SG exhibited a pronounced association with anthocyanin biosynthesis genes. Consequently, it can be inferred that the transition from the YG to SG stage represents a pivotal stage in pericarp development.
2.5. Single-Gene Analysis Related to Anthocyanin Biosynthesis Pathway in Fruit Pericarp
The anthocyanin biosynthesis pathway is situated downstream of the flavonoid synthesis pathway. Phenylalanine, serving as the direct precursor substance for anthocyanin biosynthesis, undergoes catalysis by a series of enzymes, ultimately leading to the production of diverse anthocyanins. These include Phenylalanine ammonialyase (PAL), Cinnamate 4-hydroxylase (C4H), 4-coumarate CoA ligase (4CL), Chalcone synthase (CHS), Chalcone isomerase (CHI), Flavanone-3-hydroxylase (F3H), Dihydroflavonol 4-reductase (DFR), Anthocyanin synthase (ANS), and flavonoid 3-O-glucosyltransferase (UFGT).
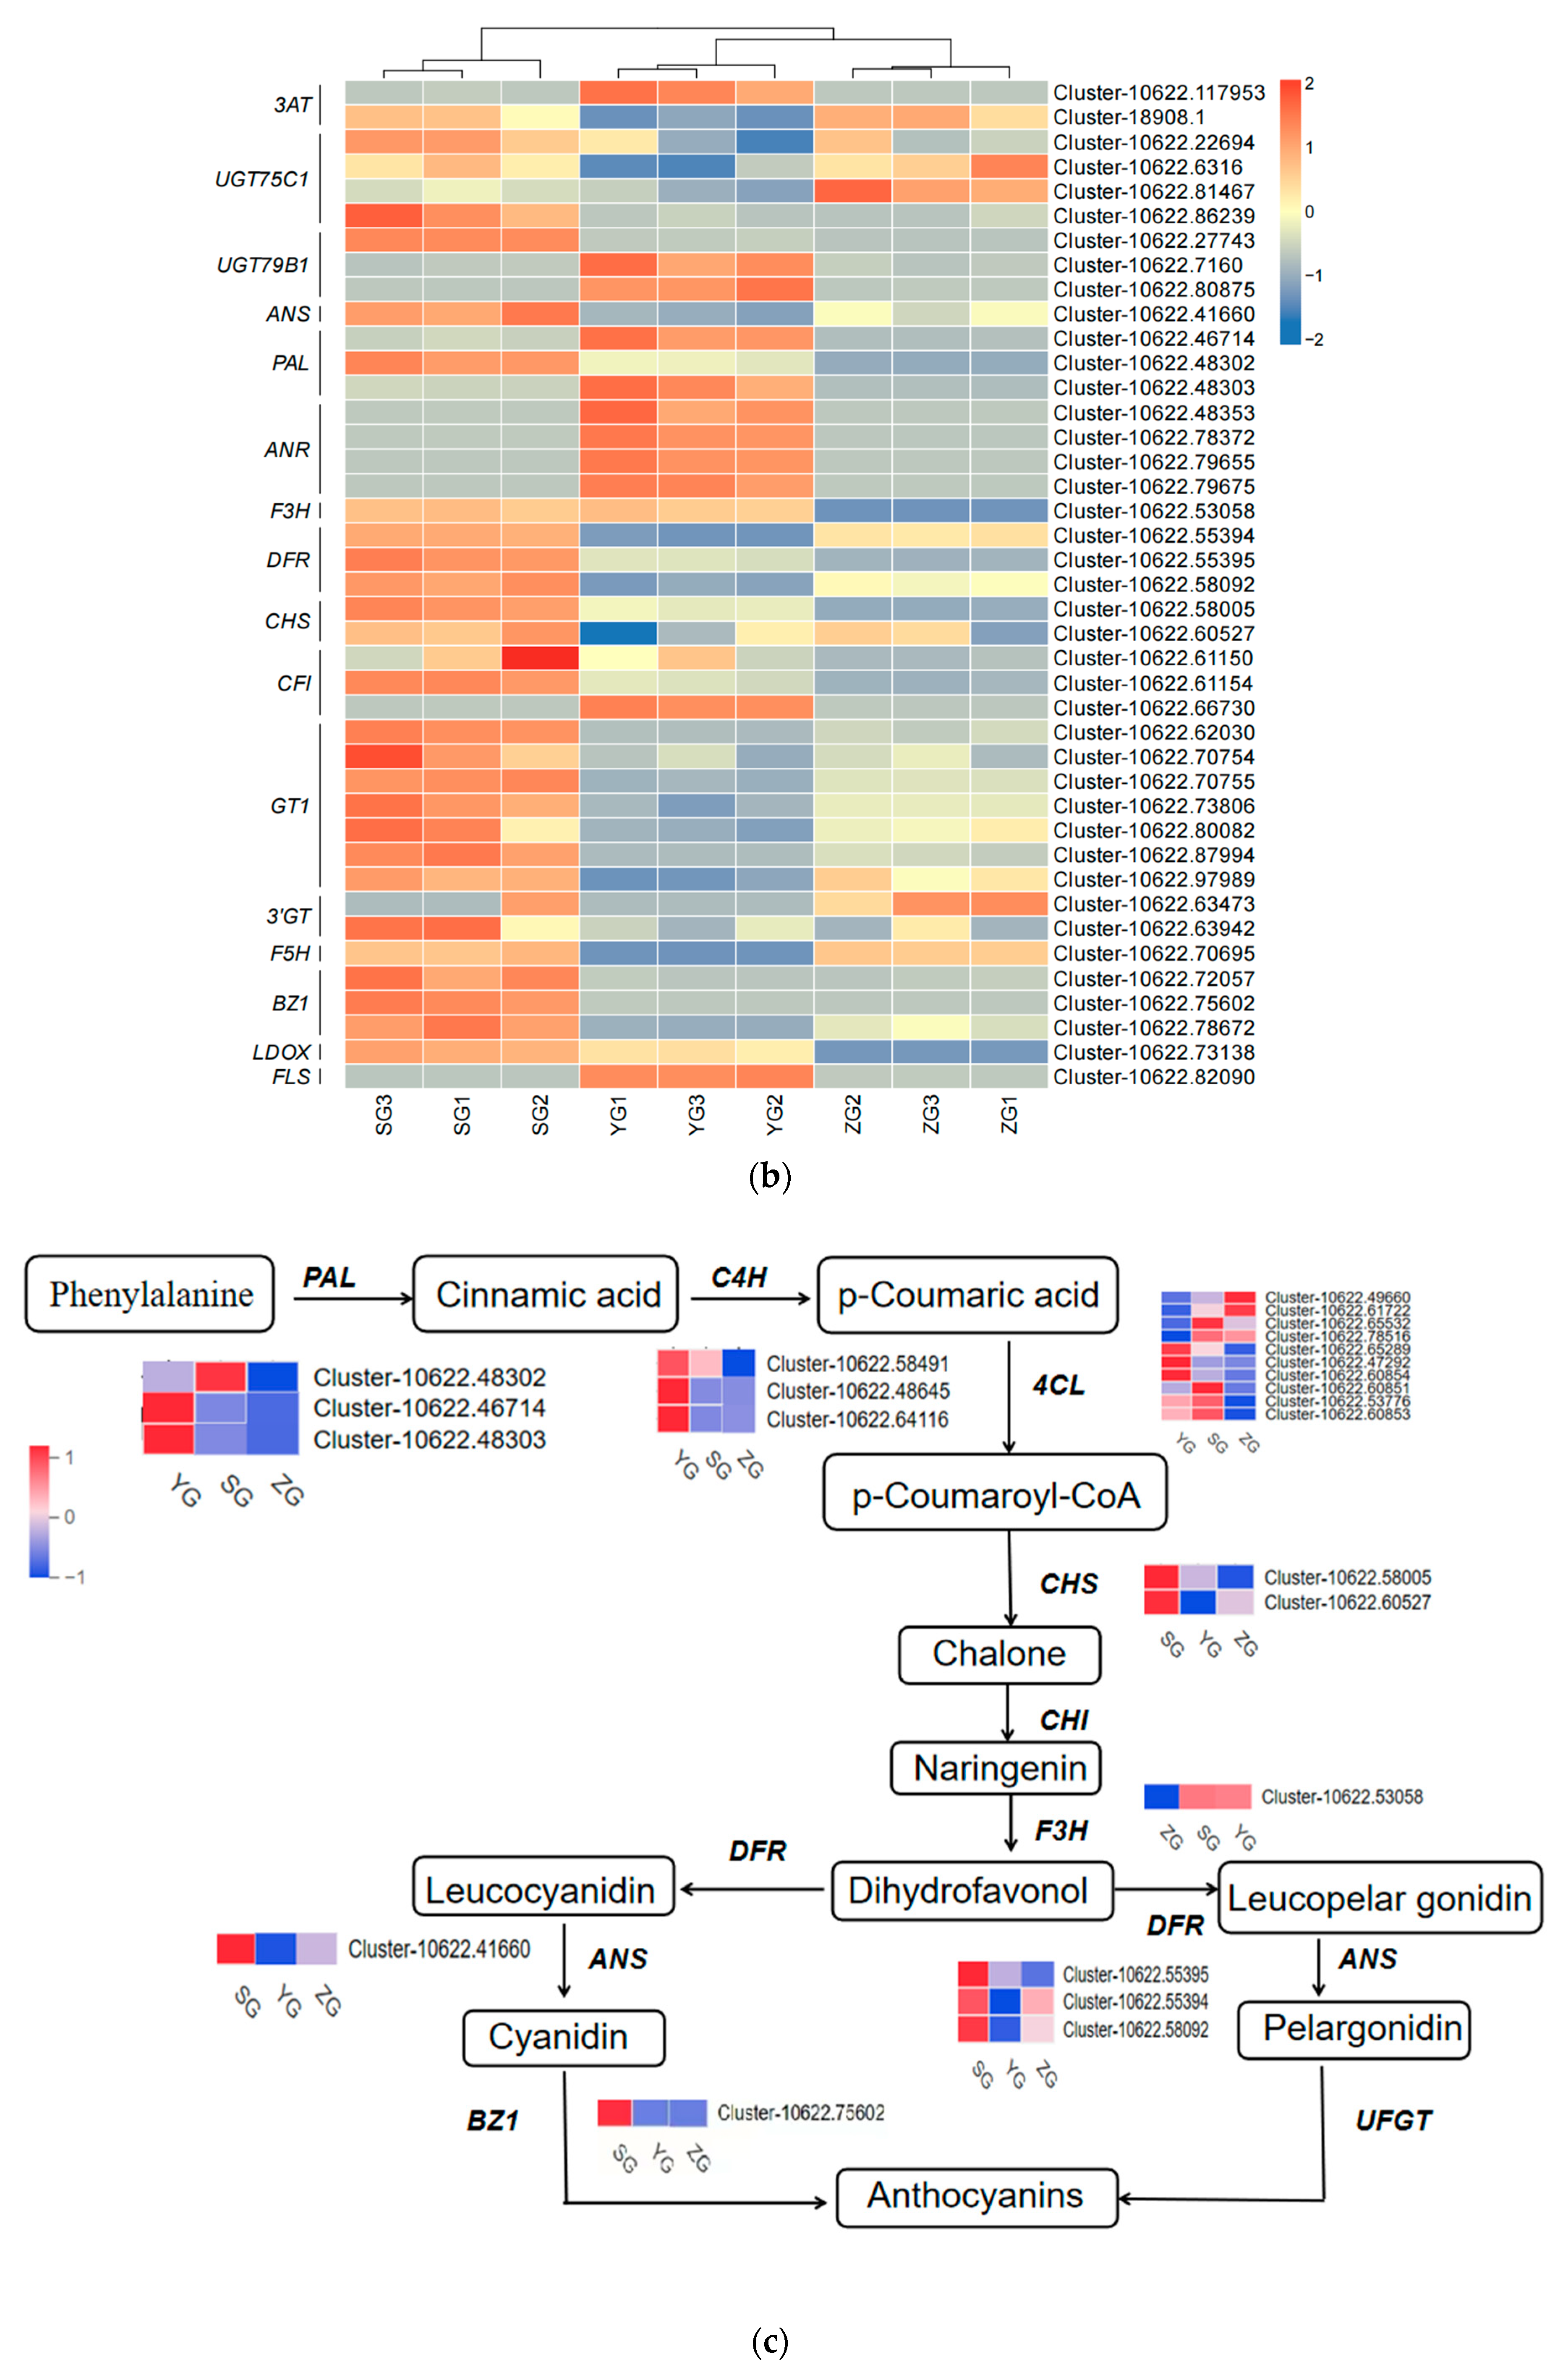
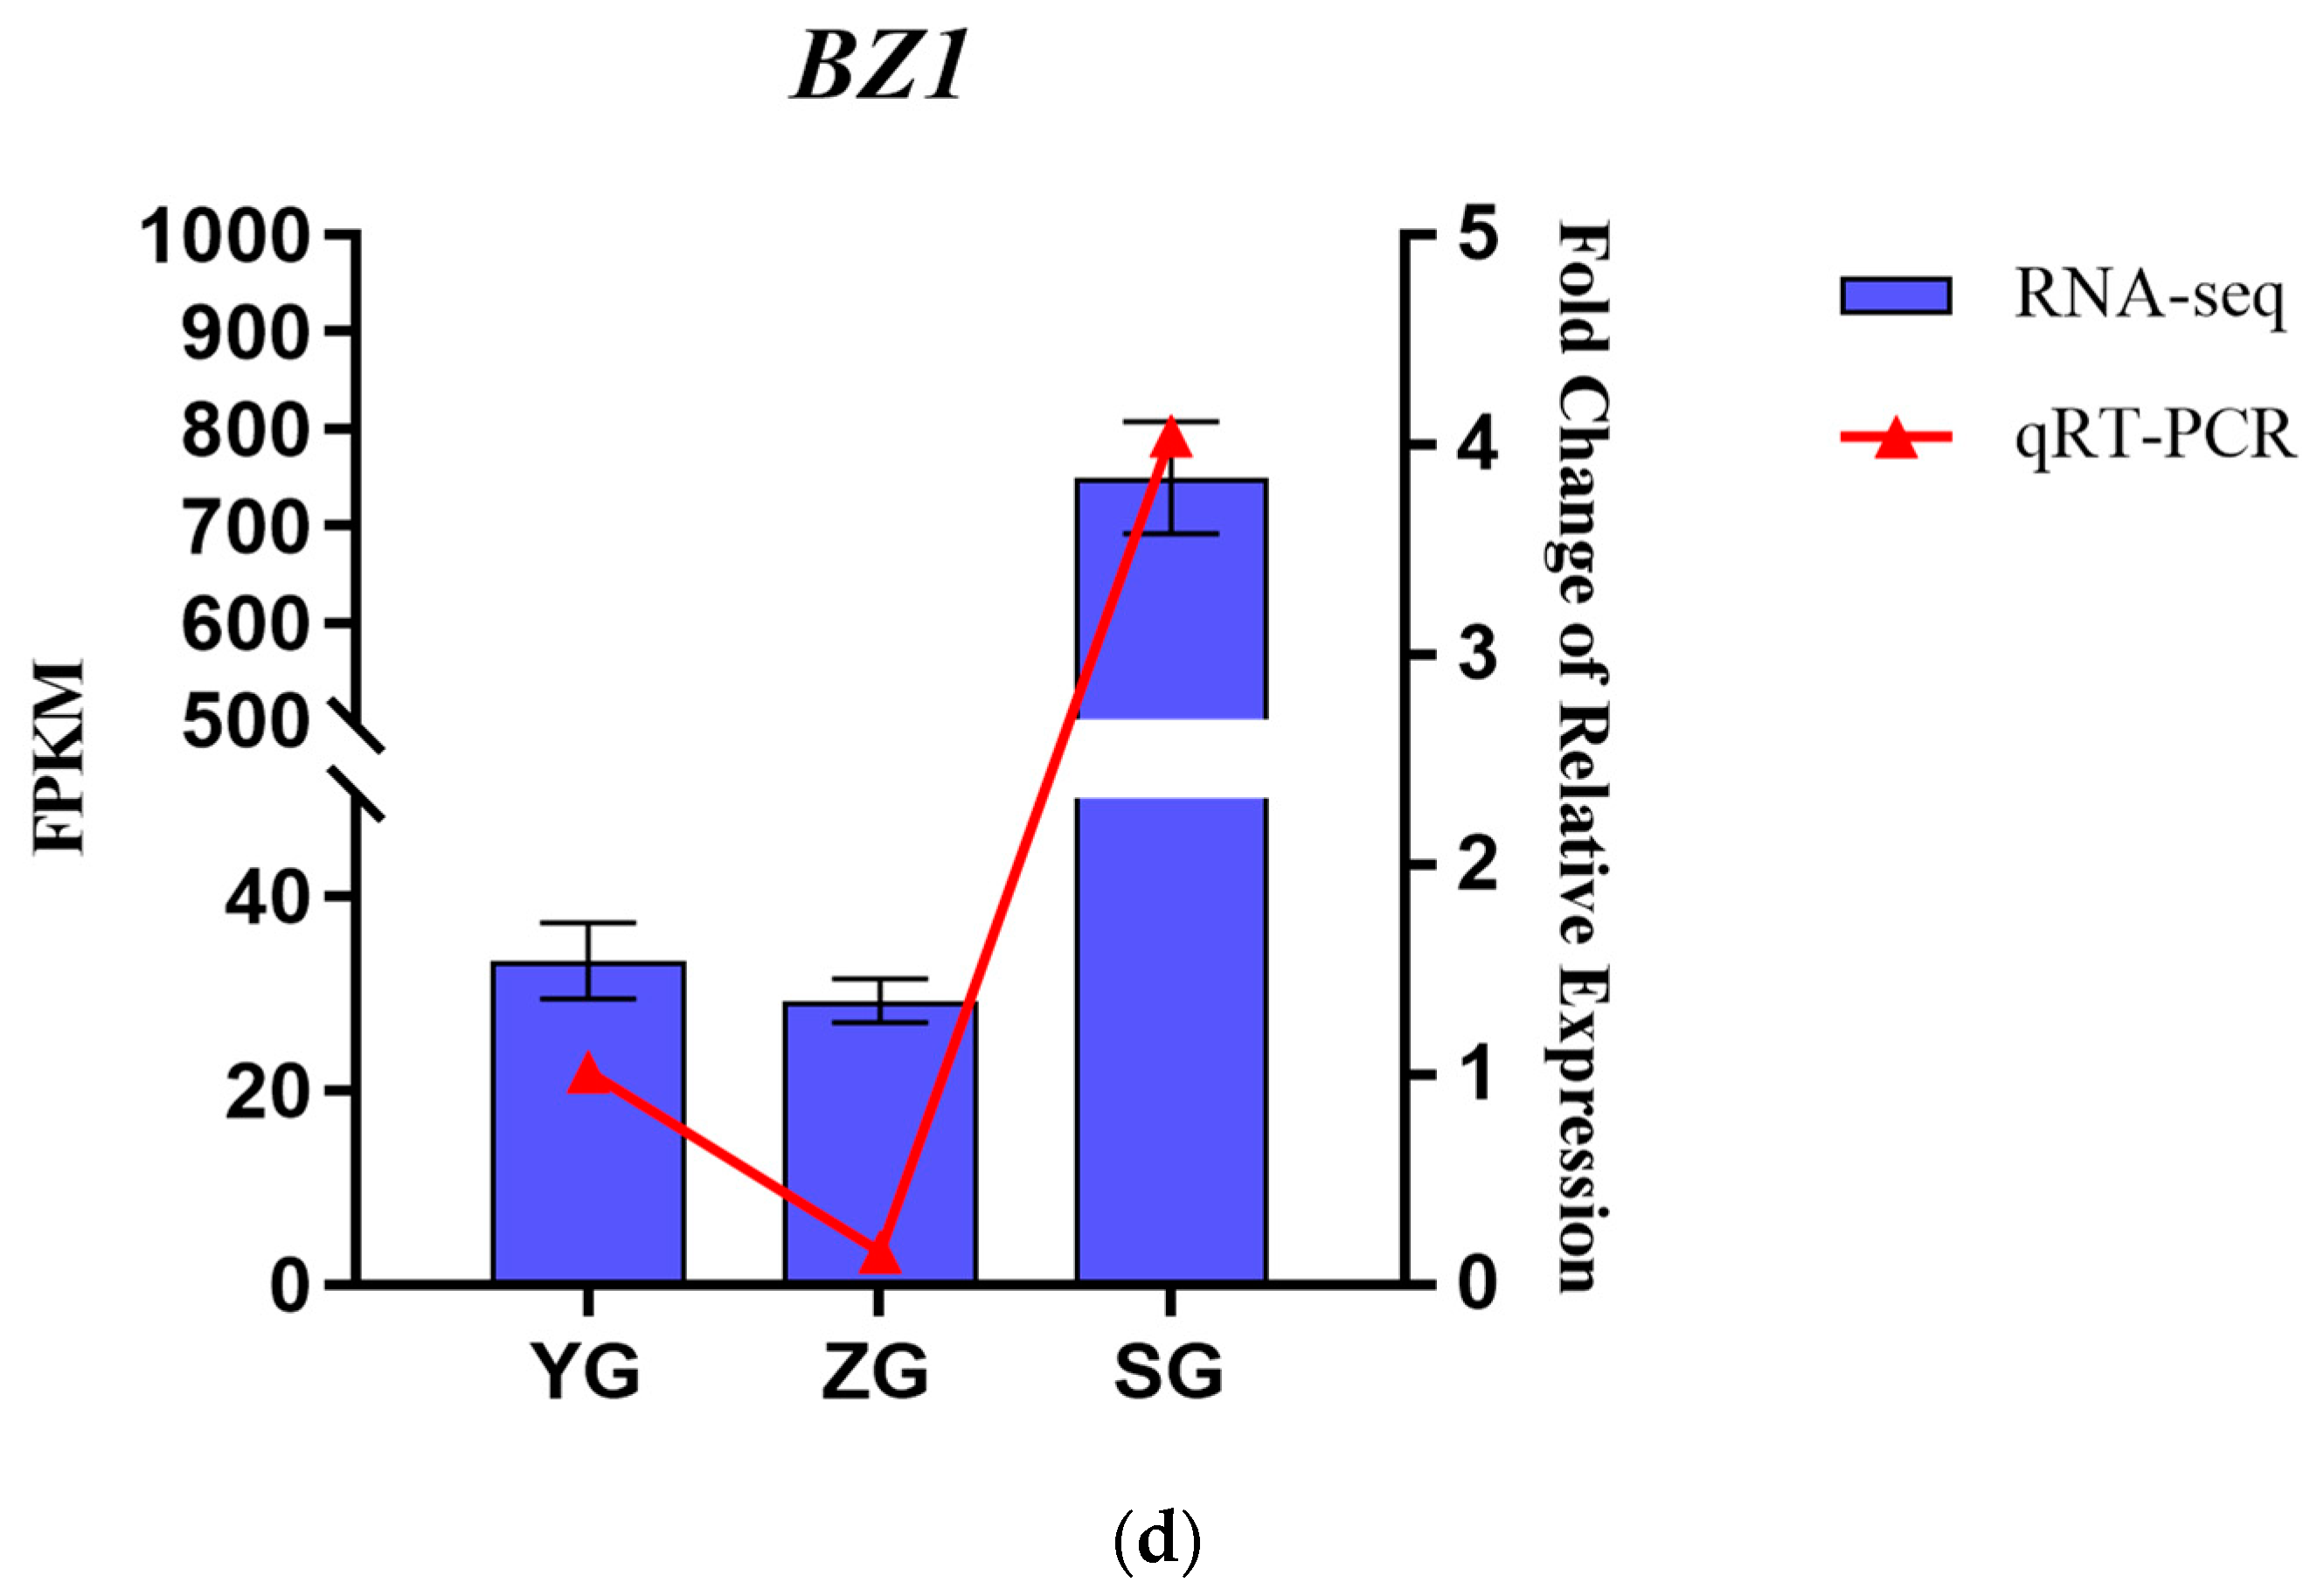
Genes related to the anthocyanin synthesis pathway, including PAL, 4CL, F3H, F5H, CHS, DFR, ANS, BZ1, and UFGT, were identified through the annotation of pathway maps in the anthocyanin biosynthesis (ko00942), flavonoid biosynthesis (ko00941), phenylpropanoid biosynthesis (ko00940), and phenylalanine metabolism (ko00360) screenings (Figure 5a,b). The gene expression heatmap was subsequently annotated on the synthesis pathway (Figure 5c). The results indicated that in the early stages of anthocyanin biosynthesis, three PAL genes, three 4CL genes, and two CHS genes exhibited differential expressions among the three stages. Specifically, the expressions of one PAL gene (Cluster-10622.48302), one 4CL gene (Cluster-10622.53776), and two CHS genes (Cluster-10622.58005 and Cluster-10622.60527) significantly increased from the YG to SG stage. The conversion of naringin to dihydrokaempferol is a pivotal step in anthocyanin biosynthesis, catalyzed by F3H genes. F3H (Cluster-10622.53058) exhibited high expression levels at the SG stage, with the level gradually increasing throughout the fruit development. The later stages of anthocyanin biosynthesis play a crucial role in the accumulation of anthocyanins. DFR (Cluster-10622.58092) and ANS (Cluster-10622.41660) exhibited high expression levels in the SG stage, displaying significant differences in expressions between the YG and SG stages. In the pathway, it was observed that BZ1 (Cluster-10622.75602) participates in the synthesis of Cyanidin-3-O-glucoside, with the highest content reached at maturity. It is hypothesized that the BZ1 gene may play a pivotal role in anthocyanin accumulation. In order to test the accuracy of the transcriptome data, we selected the BZ1 gene (Cluster-10622.75602) for qRT-PCR verification (Figure 5d). The results showed that the expression trend of the qRT-PCR was consistent with the transcriptome data, indicating that the transcriptome data have high reliability.
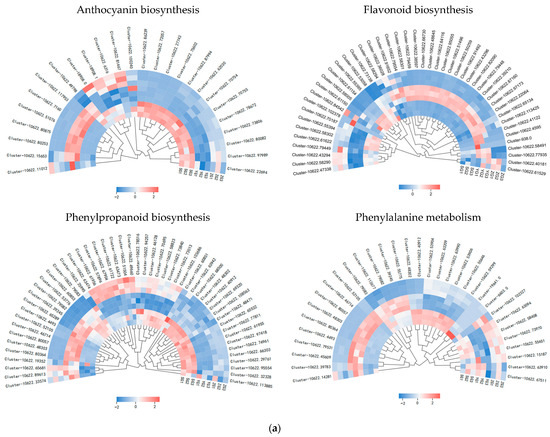
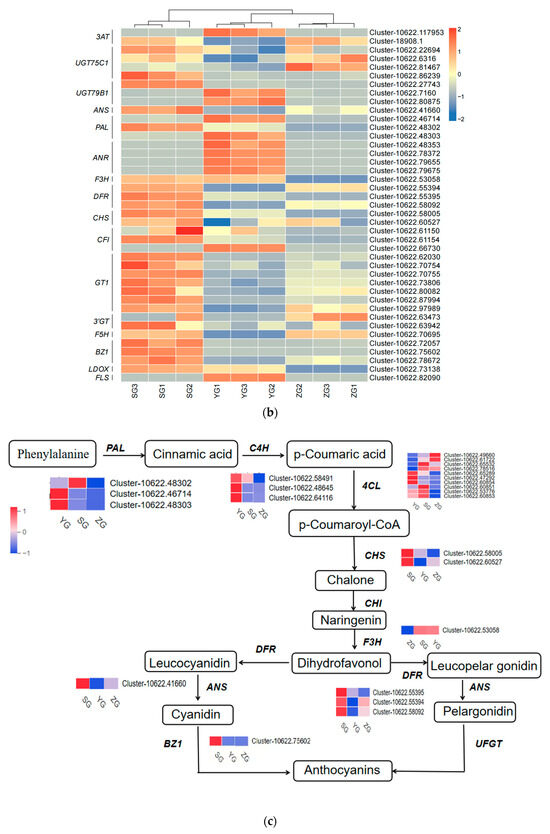
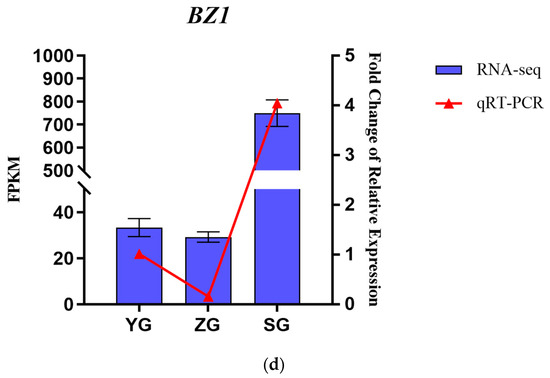
Figure 5.
Expression analysis of genes related to anthocyanin biosynthesis in Cornus officinalis. (a,b) Heatmap of genes involved in the anthocyanin biosynthesis pathway. (c) Anthocyanin biosynthesis pathway and gene expression level during fruit pericarp development. (d) qRT-PCR validation of representative anthocyanin-related genes in fruit pericarp development. Note: Differentially expressed genes include Phenylalanine ammonialyase (PAL), Cinnamate 4-hydroxylase (C4H), 4-coumarate CoA ligase (4CL), Chalcone synthase (CHS), Chalcone isomerase (CHI), Flavanone-3-hydroxylase (F3H), Dihydroflavonol 4-reductase (DFR), Anthocyanin synthase (ANS), Anthocyanin 3-O-glucosyltransferase (BZ1), and UDP-glucose: flavonoid-3-O-glycosyltranferase (UFGT); the three colored boxes show the relative gene expression levels (means) measured by RNA-seq.
2.6. Transcription Factor Profiling
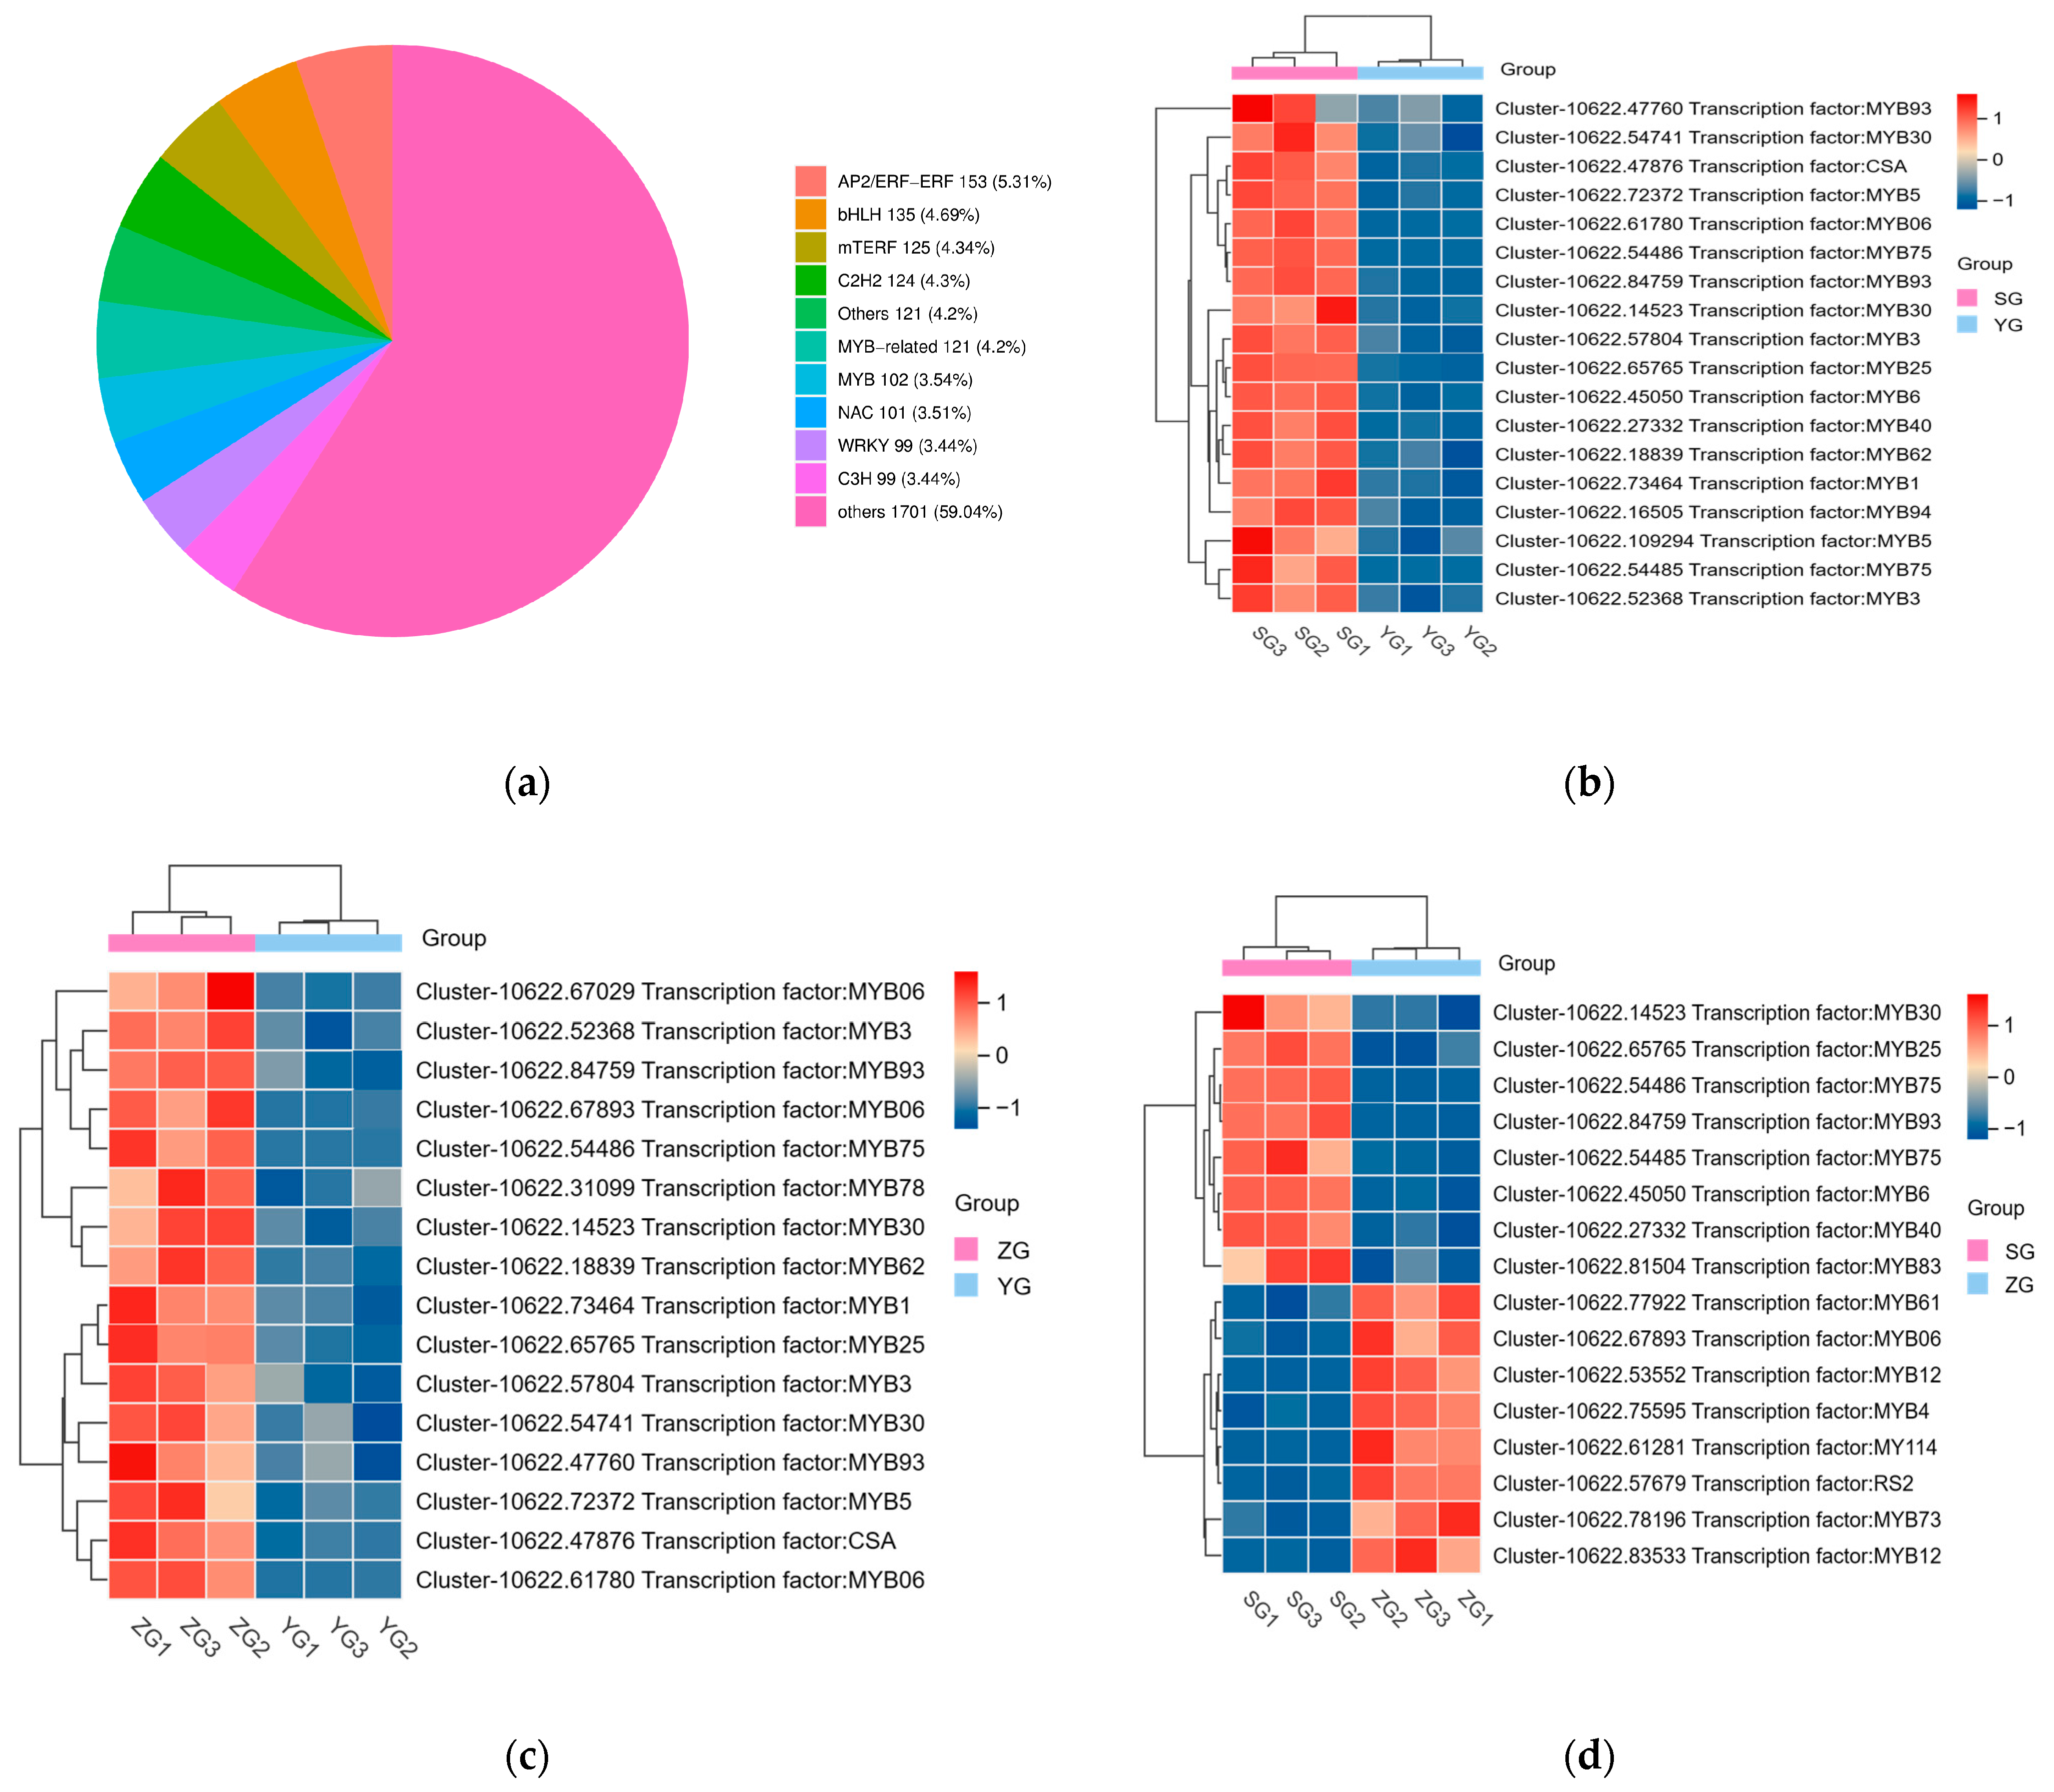
Transcription factors (TFs) play a vital role in regulating the developmental and biochemical processes in plants. They are essential in controlling gene expression and are thus crucial for plant growth and survival. The regulation of anthocyanin biosynthesis is carried out by TFs such as MYB, bHLH, and WD40, which control the expression levels of structural genes [19]. To identify the potential transcription factor (TF) genes that may regulate the pigment deposition in Cornus officinalis, we screened all differentially expressed genes (DEGs) encoding TFs. A total of 2881 TFs were identified, including the AP2/ERF−ERF, bHLH, mTERF, C2H2, NAC, MYB−related, MYB, WRKY, and C3H families (Figure 6a). In pairwise comparisons between the YG_vs._SG, YG_vs._ZG, and ZG_vs._SG groups, we identified 18, 16, and 16 differentially expressed TFs, respectively (Figure 6b–d). MYB was the major differentially expressed TF. We mainly focused on significantly upregulated MYBs concerning their major roles in anthocyanin biosynthesis. Most MYBs (MYB5, MYB30, MYB94, MYB40, MYB6, MYB75, MYB25, MYB93, etc.) significantly increased from the YG to SG stage. Among them, two MYB75 (Cluster-10622.54485 and Cluster-10622.54486) genes exhibited high expression in the SG stage.

Figure 6.
The expression profiles of the differentially expressed TFs related to the biosynthesis of anthocyanin. (a) Classification of the TFs. (b–d) Heatmap showing the transcription factors that are differentially expressed in the YG_vs._SG, YG_vs._ZG, and ZG_vs._SG groups.
2.7. Association Analysis of Metabolic and Transcriptomic Data from Cornus officinalis
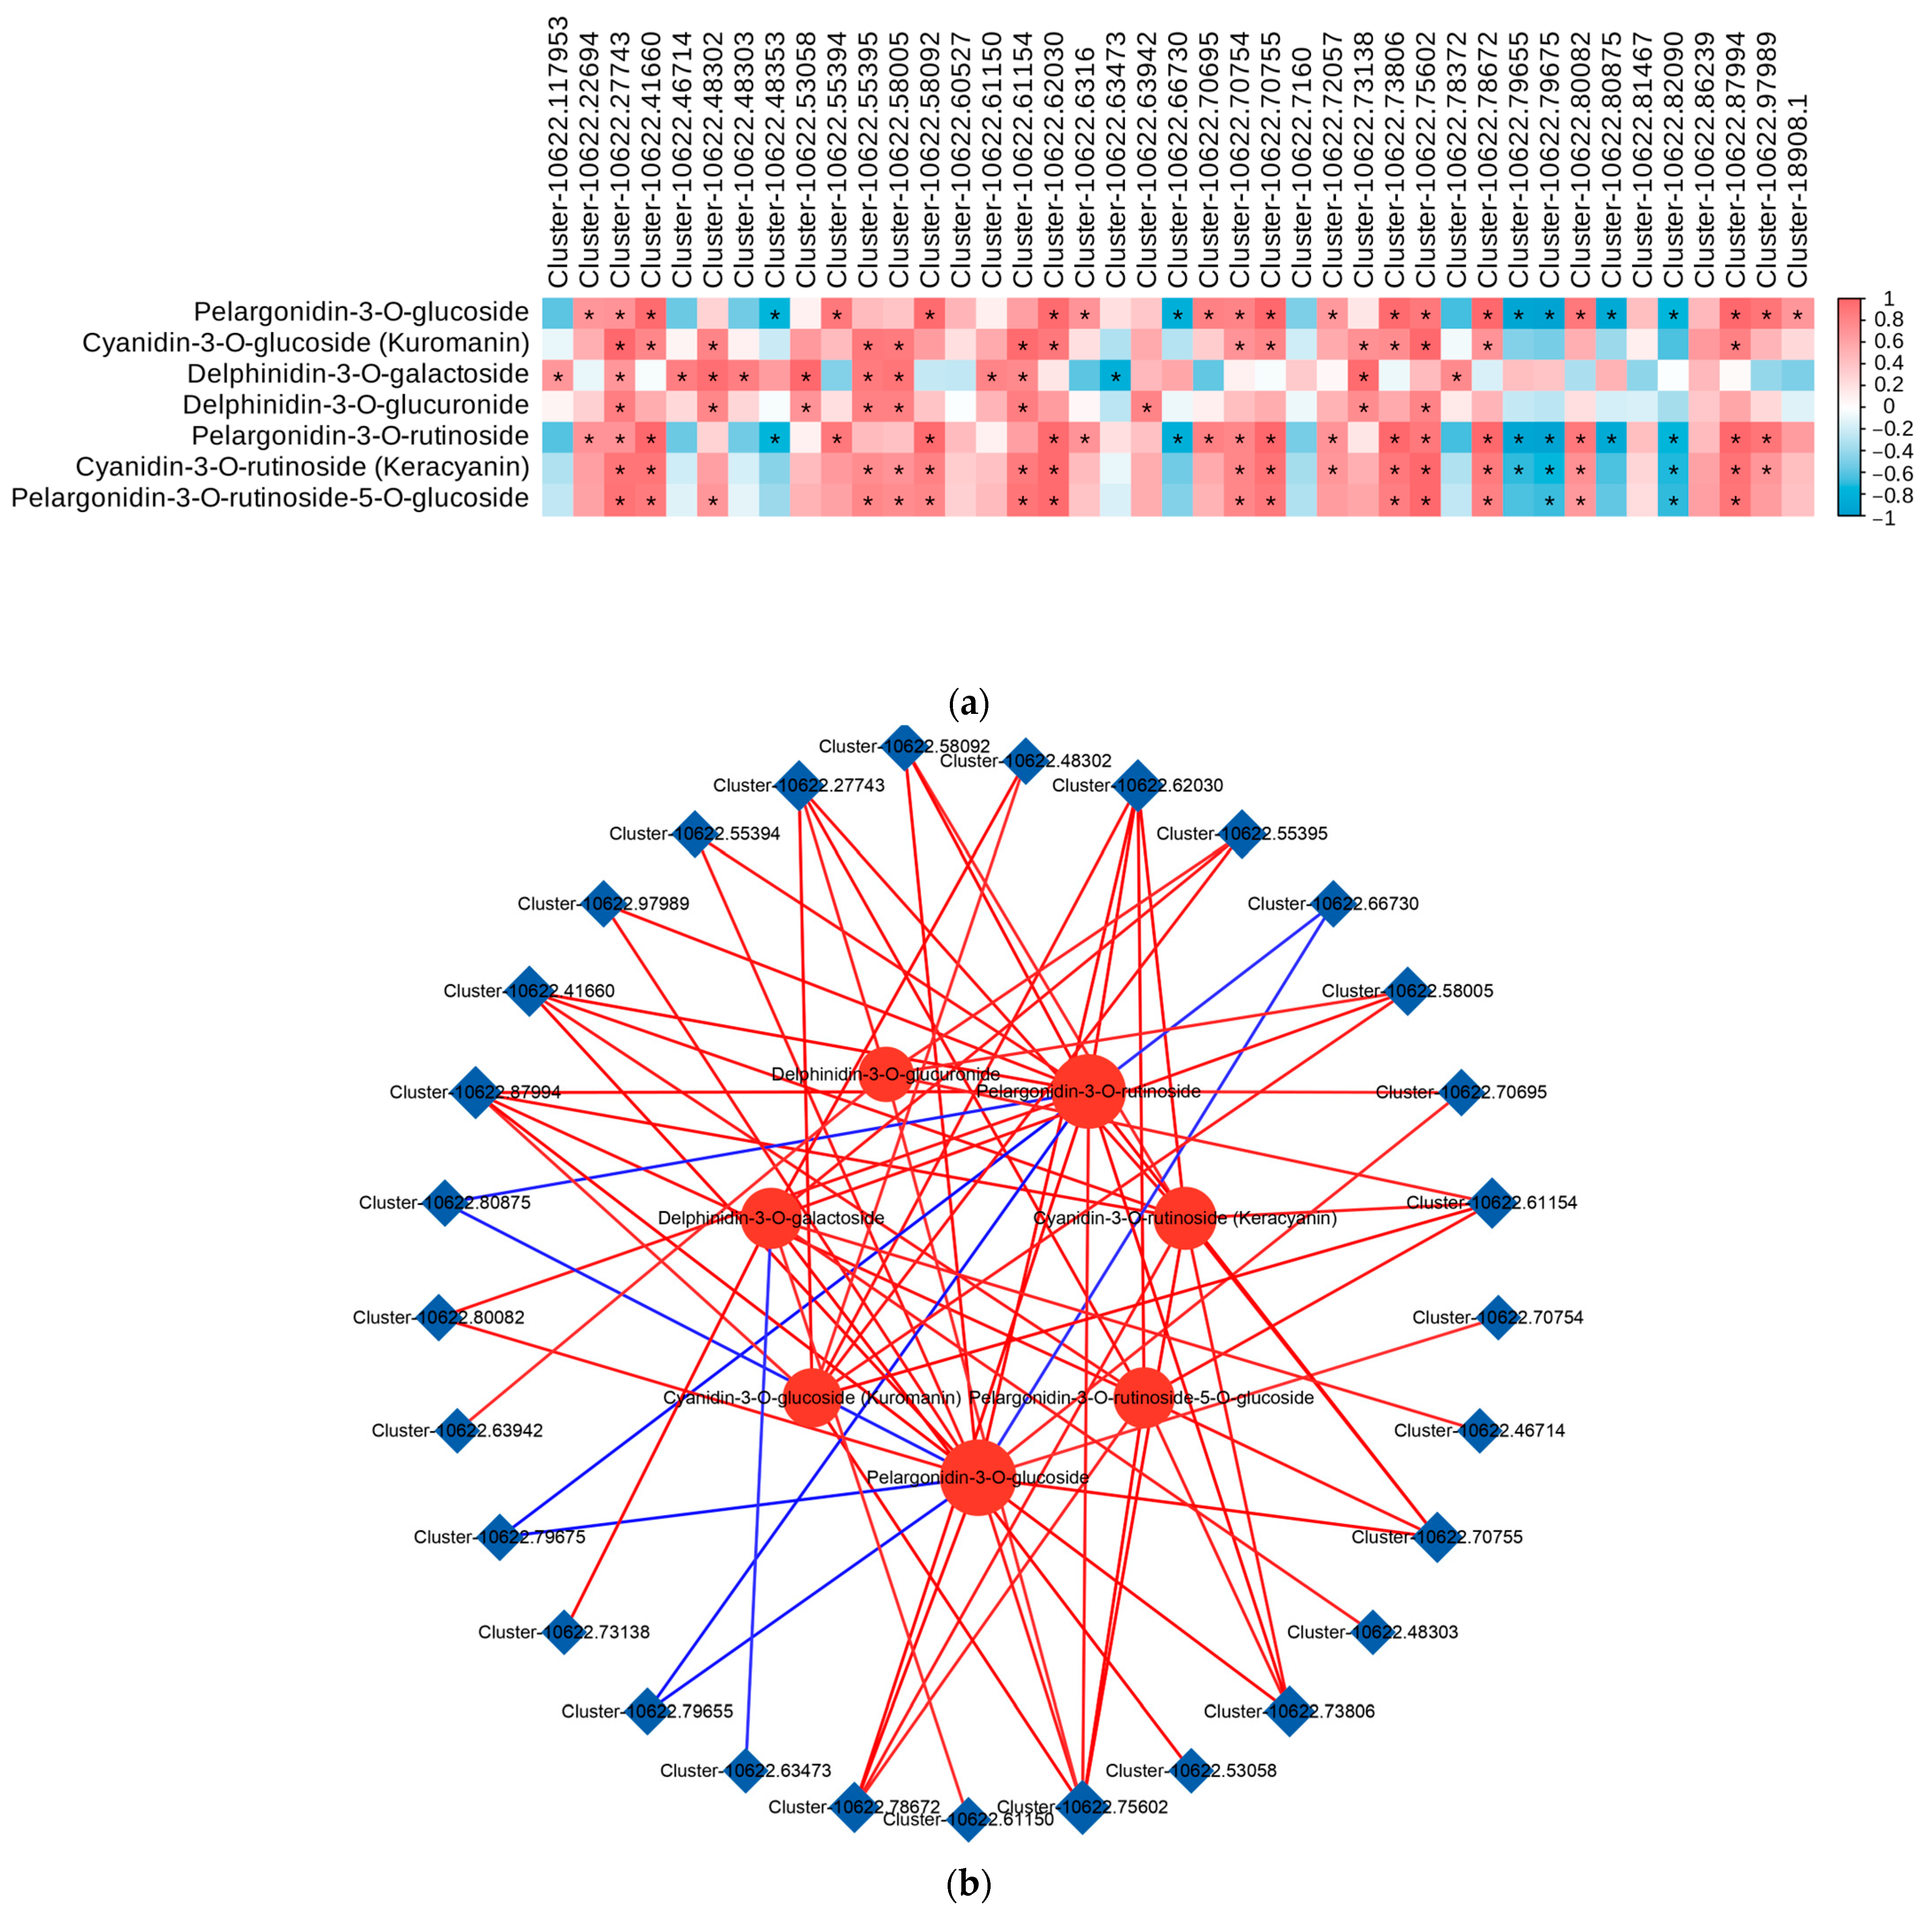
To examine the correlation between the transcriptomic data and metabolites in the anthocyanin biosynthesis pathway, we conducted a correlation analysis on the differentially expressed genes (DEGs) associated with anthocyanin biosynthesis and the differentially accumulated metabolites (DAMs) involved in the anthocyanin metabolic pathway (p < 0.05, R > 0.8). The results showed that a total of 16 DEGs (BZ1, GT1, UGT79B1, 3AT, F3H, F5H, FLS, DFR, ANR, 3′GT, ANS, CHS, CFI, LDOX, UGT75C1, and PAL) showed significant positive correlations with most DAMs involved in the anthocyanin metabolism pathways. Furthermore, UGT79B1(Cluster-10622.27743), ANS(Cluster-10622.41660), GT1(Cluster-10622.62030, Cluster-10622.70754, Cluster-10622.70755, Cluster-10622.73806, and Cluster-10622.87994), and BZ1(Cluster-10622.75602 and Cluster-10622.78672) were significantly positively correlated with the contents of cyanidin and pelargonidin, whereas F3H(Cluster-10622.53058), DFR(Cluster-10622.55395), CHS(Cluster-10622.58005), and CFI(Cluster-10622.61154) were significantly positively correlated with the contents of delphinidin. Therefore, we speculated that these eight genes play an important role in the biosynthesis of anthocyanins in Cornus officinalis (Figure 7a).
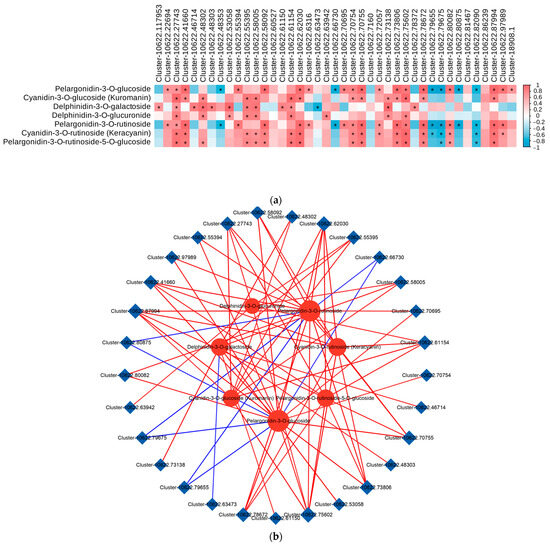
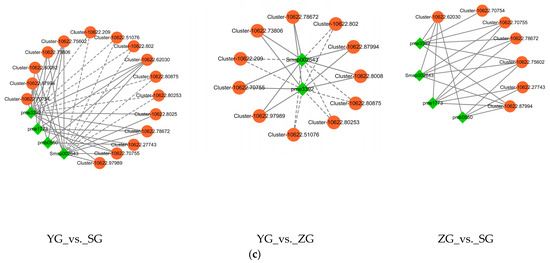
Figure 7.
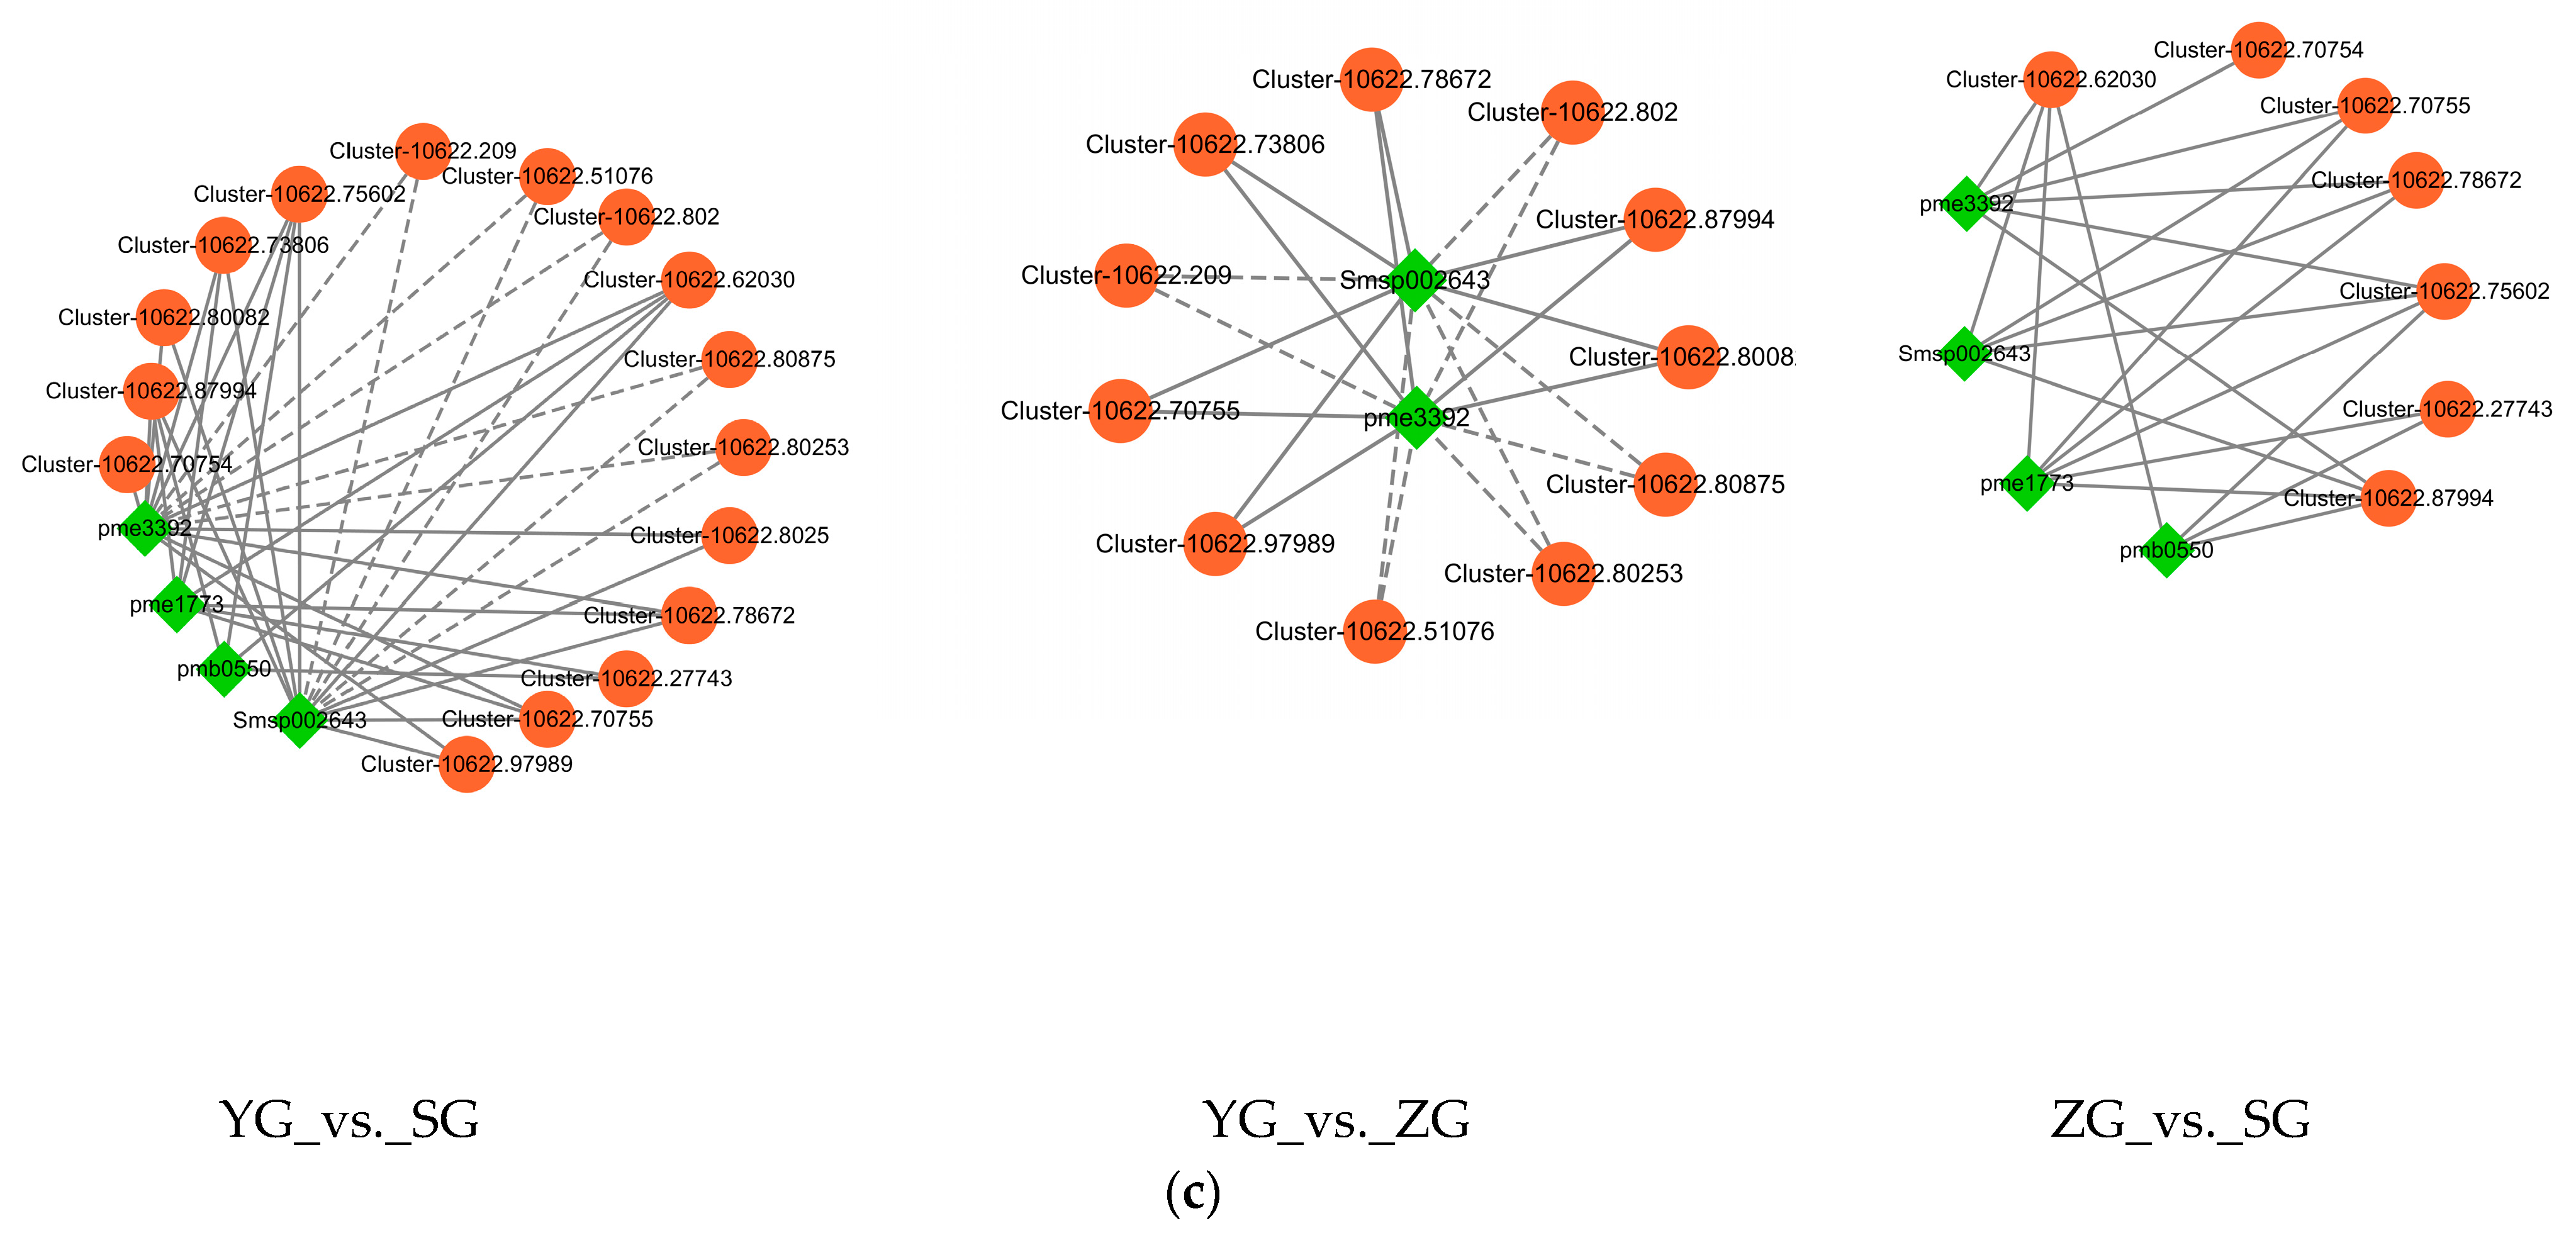
Correlation analysis of DEGs and DAMs related to anthocyanin biosynthesis. (a) Correlation analysis between DEGs related to anthocyanin biosynthesis and DAMs involved in anthocyanin metabolism. (*, significant correlation, p < 0.05, R > 0.8). (b) Network diagram for correlation analysis of DEGs with differentially expressed metabolites (DAMs). The red line indicates a positive correlation, and the blue line indicates a negative correlation. The line thickness represents the correlation index, and correlations with R > 0.8 and p < 0.05 were deemed significant. (c) Network diagram showing the correlation analysis of DEGs with DAMs in the anthocyanin biosynthesis (ko00942) in the YG_vs._SG, YG_vs._ZG, and ZG_vs._SG groups. (The differential genes and metabolites with correlation coefficients greater than 0.8 are plotted for each pathway. Metabolites are shown in green, genes are shown in orange, solid lines represent positive correlations, and dashed lines represent negative correlations).
Correlations between the transcriptional profiles of the DEGs and the various developmental stages characterized by the DAMs were analyzed using Pearson’s correlation coefficients. The results revealed that 29 DEGs involved in anthocyanin biosynthesis showed significant correlations with at least two DAMs. Among the 29 DEGs, the expression levels of 9 DEGs (BZ1 (Cluster-10622.75602 and Cluster-10622.78672), UGT79B1 (Cluster-10622.27743), GT1 (Cluster-10622.73806, Cluster-10622.62030, Cluster-10622.87994, and Cluster-10622.70755), CFI (Cluster-10622.61154), and ANS (Cluster-10622.41660)) showed significant positive correlations with all of the DAMs, while five genes (UGT79B1 (Cluster-10622.80875), ANR (Cluster-10622.79675 and Cluster-10622.79655), 3′GT (Cluster-10622.63473), and CFI (Cluster-10622.66730)) showed negative correlations with only some of the DAMs (Figure 7b). In the pairwise comparisons between the YG_vs._SG, YG_vs._ZG, and ZG_vs._SG groups, the expression levels of most differential genes, which were upregulated in YG_vs._SG, showed marked positive correlations with the levels of four anthocyanidins (cyanidin-3-O-glucoside, cyanidin-3-O-rutinoside, pelargonidin-3-O-glucoside, and pelargonidin-3-O-rutinoside). However, the levels of Cluster-10622.51076, Cluster-10622.209, Cluster-10622.51076, Cluster-10622.80875, Cluster-10622.80253, Cluster-10622.80875, and Cluster-10622.80253 demonstrated notable negative correlations with the levels of Pelargonidin-3-O-glucoside and Pelargonidin-3-O-rutinoside. Among them, four udp-glycosyltransferases (Cluster-10622.70755, Cluster-10622.75602, Cluster-10622.87994, and Cluster-10622.27743) genes exhibited high expression in the SG stage (Figure 7c).
3. Discussion
3.1. Cyanidin-3-O-glucoside and Pelargonidin-3-O-rutinoside Promote the Red Pigmentation of the Cornus officinalis Pericarp
The color of plants is influenced by the accumulation of anthocyanins [20]. In Canna glauca, the anthocyanin accumulation was significantly correlated with the petal color [21]. The anthocyanin contents were significantly increased with the development of pepper (Capsicum annuum L.) [22]. Anthocyanin, identified as one of the six anthocyanins, plays a key role in imparting a reddish color to plants. However, both its composition and concentration exhibit significant variations among distinct plant species and/or tissues [23]. In our study, we observed that the anthocyanins were mainly aggregated in the epicarp of Cornus officinalis. We assessed the anthocyanin content of Cornus officinalis across various developmental stages. Remarkably, the anthocyanin content in the red fruits at the maturity stage was significantly higher than that observed in the green fruits during the early fruit stage. We hypothesized that the elevated anthocyanidin content plays a pivotal role in the development of the red pericarp in Cornus officinalis. A parallel observation was noted in Boehmeria nivea, where the red-leaved variety exhibited significantly higher anthocyanin levels compared to its green-leaved counterpart, indicating a predominant contribution of anthocyanins to the variation in the leaf color [24]. Through our investigation, we identified two primary anthocyanins: Cyanidin-3-O-glucoside and Pelargonidin-3-O-rutinoside. During the SG stage, their metabolic levels were as high as 139,133,333 and 141,556,666, respectively. These two anthocyanins give the Cornus officinalis a red color, which is commonly observed in nature. In a study of strawberry fruit, it was discovered that the red coloration of the fruit was associated with the presence of metabolites, such as Cyanidin-3-O-glucoside [25]. Additionally, glycosylated derivatives of Pelargonidin were found to be linked with rosy-red traits [26]. The accumulation of mallowanin-3-O-glucoside (violet) and Pelargonidin-3-O-glucoside (orange-red) showed a significant correlation with the transition of the leaf color from green to purple-red in a study involving purple-leaved cherry trees [27]. In line with the experimental results, it is therefore hypothesized that the red pigmentation of the Cornus officinalis pericarp is primarily influenced by anthocyanins, specifically Cyanidin-3-O-glucoside and Pelargonidin-3-O-rutinoside.
3.2. Related Regulation of Key Enzymes in Anthocyanin Biosynthetic Pathway
Differences in the plant anthocyanin composition arise from variations in the gene expression within the anthocyanin synthesis pathway. In the past decade, significant strides have been made in defining the anthocyanin metabolic pathways in model plants, particularly advancing our understanding of anthocyanin biosynthesis-related genes in fruit trees [28]. Previous studies have elucidated that anthocyanin biosynthesis involves a multitude of enzymes encoded by early-step structural genes (PAL, CHS, and F3H) and anthocyanin-specific biosynthetic genes (DFR, ANS, and UFGT) [29]. The expression levels of PAL (Cluster-10622.46714 and Cluster-10622.48303) and C4H (Cluster-10622.58491, Cluster-10622.48645, and Cluster-10622.64116) peaked in the YG stage and then declined in the SG stage. It is possible that the feedback repression of their products regulated the upstream genes in each period, suppressing their expressions in the later stages. Among them, the expression level of PAL (Cluster-10622.48302) peaked in the SG stage. In grapes (Vitis vinifera L.), a significant positive correlation was found between PAL activity and anthocyanin synthesis [30]. These results suggest that different genes of the multiple gene families play different roles in the anthocyanin biosynthetic pathway. Further research is needed to determine the roles of these genes in the biosynthesis of specific anthocyanins.
Chalcone synthase (CHS), serving as the first key enzyme in the flavonoid pathway [31], and Flavanone 3-hydroxylase (F3H), a key enzyme in the phycocyanin biosynthesis pathway, catalyze the production of dihydro-flavonols from flavanones [32,33,34,35]. As their expression levels are highest during the SG stage, it can be concluded that this period is the crucial time for color change in Cornus officinalis. The expression level of ANS, a key enzyme at the end of the anthocyanin biosynthesis pathway [36], directly determines the amount of anthocyanin accumulation, and it exhibited a significant upregulation trend during the ZG and SG periods. The co-expression network analysis revealed a positive correlation between the expression trend of ANS (Cluster-10622.41660) and those of cyanidin and pelargonidin, indicating the crucial role of ANS (Cluster-10622.41660) in anthocyanin synthesis. In addition, it is worth noting that UDP-galactose: Anthycanidin Glycosyltransferase (UAGT) is a key enzyme in the formation of anthocyanidins and is mainly responsible for the transfer of sugar moieties to unstable anthocyanidins to convert them into stable anthocyanidins [37]. BZ1 is the gene encoding the UDP glucose flavonoid glucosyltransferase (UFGT), and further glycosylation and methylation by BZ1 and various types of methyltransferases results in the formation of a stable anthocyanin structure [38]. UGT79B1 is a GGT enzyme in glycosyltransferases, and it has been found that the modification of anthocyanosides by the UGT79B1 enzyme significantly affects the anthocyanoside biosynthesis in Arabidopsis [39]. In this study, our results suggested that during the reddening of the Cornus officinalis pericarp, UGT79B1 (Cluster-10622.27743), GT1 (Cluster-10622.62030, Cluster-10622.70754, Cluster-10622.70755, Cluster-10622.73806, and Cluster-10622.87994), and BZ1 (Cluster-10622.75602 and Cluster-10622.78672) were notably and positively correlated with the contents of cyanidin and pelargonidin. We hypothesize that UGT79B1, ANS, GT1, and BZ1 may serve as the key enzymes in the formation of cyanidin and pelargonidin, thereby further accounting for the Cornus officinalis pericarp coloration.
The major regulatory factors for anthocyanins are MYB, bHLH, and WD40. These transcription factors are capable of forming the MBW complex, which has been shown to play a critical role in anthocyanin synthesis in a wide range of plant species [40]. Notably, particular attention should be given to the candidate MYB family genes due to their recognized major function as regulators of anthocyanins in plant organs [41]. In particular, MYB75 (Cluster-10622.54485 and Cluster-10622.54486) had the highest expression in the SG period of anthocyanin biosynthesis (ko00942) compared to the YG period. The MYB TF MYB75 was found to regulate the anthocyanin synthesis and accumulation in Arabidopsis [42,43]. Therefore, we suggest that MYB75 may promote anthocyanin synthesis and accumulation by regulating the expressions of the ANS and UFGT genes. These studies provide valuable insights for optimizing the fruit quality of Cornus officinalis. Understanding the mechanisms of the anthocyanin accumulation and pericarp coloration will allow growers to time harvesting for peak pigment content, ensuring vibrant red fruits with higher levels of beneficial compounds. The identification of key genes such as UGT79B1, ANS, GT1, and BZ1 provides opportunities for breeding varieties with improved color and nutritional value. Metabolomic and transcriptomic analyses provide tools for monitoring the fruit quality throughout the growing season, allowing growers to adjust their management practices in real time to optimize the desired traits. These findings provide a practical basis for improving the fruit of Cornus officinalis to increase its market value and medicinal benefits.
4. Materials and Methods
4.1. Plant Materials
The fruits of Cornus officinalis were collected from 15-year-old healthy Cornus officinalis plants in the Medicinal Botanical Garden (34°19′ N, 108°44′ E) of Shaanxi University of Chinese Medicine from March 2019 to October 2021, at an altitude of approximately 360 m above sea level, in Shaanxi Xianyang, China. With an average annual temperature of 8–16 °C and yellow cinnamon soil, the climate is warm and humid (Supplementary Figure S1a,b). It was identified by Professor Yan Yonggang of Shaanxi University of Chinese Medicine as the fruit of Cornus officinalis of the genus Cornus of the family Cornaceae. Samples of the Cornus officinalis fruits were collected from three stages: the young-fruit (YG) stage, from flowering to 90 days after flowering, the middle-fruit (ZG) stage, from 90 days after flowering to 180 days after flowering, and the mature-fruit (SG) stage, from 180 days after flowering to 210 days after flowering. After the samples were collected, the pericarps of Cornus officinalis were pericarped, placed in centrifuge tubes, snap-frozen in liquid nitrogen, and stored in a refrigerator at −80 °C. According to the method in [44], the total anthocyanin content was measured using a UV1600 ultraviolet μspectrophotometer (Shanghai, China).
4.2. Microscopic Observation
The collected Cornus officinalis fruits underwent fixation using a 50% FAA (50% ethyl alcohol:glacial acetic acid:formalin = 18:1:1) fixative, followed by a stepwise dehydration process in gradient alcohol, xylene transparency, paraffin immersion, and embedding. Slices, cut to a thickness of 8 μm~10 μm using a Lecia RM2135 hand-operated slicer, were then dried in an electric blast dryer at 40 °C. Subsequently, the slices were stained with saffron-green, sealed with neutral gum, and observed under a Leica DM750 optical microscope. The same slices were then photographed. Changes in the external morphology and internal structure of the Cornus officinalis fruits during development were observed under a light microscope (Nikon SMZ745T, Nikon Precision (Shanghai) Co., Ltd., Shanghai, China), photographed, and recorded.
4.3. Sample Preparation and Extraction
Biological samples were freeze-dried with a vacuum freeze-dryer (Scientz-100F, Ningbo Xinzhi Biotechnology Co., Ltd., Ningbo, China). The freeze-dried samples were crushed using a mixer mill (MM 400, Retsch, Verder Shanghai Instruments and Equipment Co., Ltd., Shanghai, China) with a zirconia bead for 1.5 min at 30 Hz. An amount of 100 mg of lyophilized powder was dissolved with 1.2 mL 70% methanol solution, vortexed 30 s every 30 min for 6 times in total, and the sample was placed in a refrigerator at 4 °C overnight. Following centrifugation at 12,000 rpm for 10 min, the extracts were filtrated (SCAA-104, 0.22 μm pore size; ANPEL, Shanghai, China, http://www.anpel.com.cn/, accessed on 8 September 2021) before the UPLC-MS/MS analysis.
4.4. Metabolome Analysis
The sample preparation, analysis, and metabolite qualitative and quantification were carried out by Metware according to their standard procedures. Ultra-performance liquid chromatography (UPLC) (SHIMADZU Nexera X2, SHIMADZU, Kyoto, Japan) and tandem mass spectrometry (MS/MS) (Applied Biosystems 4500 QTRAP, AB SCIEX, Block 33, #04-06 Marsiling Industrial Estate Road 3, Singapore.) were used for the determination.
Liquid-phase conditions: Column, Agilent SB-C 18 (1.8 µm, 2.1 mm × 100 mm); the mobile phase consisted of solvent A (pure water with 0.1% formic acid) and solvent B (acetonitrile with 0.1% formic acid). Sample measurements were performed with a gradient program that employed the starting conditions of 95% A, 5% B. Within 9 min, a linear gradient to 5% A, 95% B was programmed, and a composition of 5% A, 95% B was kept for 1 min. Subsequently, a composition of 95% A, 5.0% B was adjusted within 1.1 min and kept for 2.9 min. The flow velocity was set as 0.35 mL per minute; the column oven was set to 40 °C; the injection volume was 4 μL.
The ESI source operation parameters were as follows: ion source: turbo spray; source temperature: 550 °C; ion spray (IS) voltage: 5500 V (positive-ion mode)/−4500 V (negative-ion mode); ion source gas I (GSI), gas II (GSII), and curtain gas (CUR) were set at 50, 60, and 25.0 psi, respectively; the collision-activated dissociation (CAD) was high.
Mass spectrometry data were processed using Analyst 1.6.3 software. Principal component analysis was performed to determine the overall metabolic differences among the samples of Cornus officinalis fruits (including quality control samples: prepared from a mixture of sample extracts and used to analyze the reproducibility of the samples under the same treatments) at the different developmental stages and the magnitude of the variability among the samples of the YG-stage, ZG-stage and SG-stage groups. Significantly regulated metabolites between groups were determined by a Variable Importance in Projection (VIP) ≥ 1 and an absolute log2FC (Fold Change) ≥ 1. Pathway analysis was performed using the KEGG Pathway database (http://www.kegg.jp/kegg/pathway.html, accessed on 25 August 2021).
4.5. RNA Isolation and Illumina Sequencing
The library kit used was Illumina’s NEBNext® UltraTM RNA Library Prep Kit (New England Biolabs, Ipswich, MA, USA). Agarose gel electrophoresis was used for the analysis of the sample RNA integrity and the presence of DNA contamination. After the construction of the library, it was initially quantified by using a Qubit2.0 Fluorometer, and it was then diluted to 1.5 ng/µL. Then, the insert size of the library was detected by using an Agilent 2100 bioanalyzer. After the insert size met the expectations, the effective concentration of the library was accurately quantified by qRT-PCR to ensure the quality of the library. After pooling the library inspection, different libraries were pooled according to the requirements of the effective concentration and target offline data volume, and then Illumina sequencing was carried out, and 150 bp paired terminal readings were generated. fastp v. 0.19.3 was used to filter the original data, mainly to remove reads with adapters. Transcriptome assembly was performed using Trinity (v2.11.0). Corset was used to regroup the relevant transcripts into “gene” clusters (https://github.com/trinityrnaseq/trinityrnaseq, accessed on 1 January 2021). The de-redundant transcript sequences were compared with the KEGG, NR, Swiss-Prot, GO, COG/KOG, and Trembl databases using DIAMOND software(diamond v0.9.24.125, Diamond Software Systems Ltd., London, UK), and the amino acid sequences were compared with the Pfam database using HMMER software(HMMER 3.2 package) to obtain annotation information of seven major databases of transcripts.
4.6. Transcriptome Data Analysis
For the samples with biological replicates, DESeq2 v1.22.1 was used to analyze the differential expression between the two groups. For the samples without biological replicates, difference analysis was performed using edgeR [45]. The following conditions were used to identify the DEGs: log2FC > 1 or <−1, and the FDR (false-discovery-rate) values were <0.05.
4.7. Quantitative Reverse Transcription Polymerase Chain Reaction (qRT-PCR)
The DEGs were selected for the qRT-PCR analysis, and Actin was used as the internal reference gene to correct the gene expression. RNA was isolated from the samples in the Cornus officinalis pericarp and used to generate cDNA. The gene-specific primers were designed and are listed in the primer sequence in Table S1 (Supplementary Table S1). The quantification analysis in the qRT-PCR experiment was executed employing reagent kits provided by Yeasen (Shanghai Yisheng Biotechnology Co., Ltd., Shanghai, China). For the initial reverse transcription of the first-strand cDNA, the Hifair® III 1st Strand cDNA Synthesis SuperMix for qPCR (gDNA digester plus) kit (11141es60) was utilized. Subsequent fluorescent quantification was conducted using the Hieff® qPCR SYBR Green Master Mix (Low Rox Plus) kit. Amounts of 10 µL of Hieff® qPCR SYBR Green Master Mix, 0.4 µL of 10 µM of each primer, and 1 µL of cDNA template were used on a LongGene AB-7500 Real-time PCR Detection system under 40 cycles of 10 s at 95 °C and 30 s at 60 °C after 5 min at 95 °C. In this study, all the genes were repeated three times. The mRNA expression levels of the genes were calculated using the 2−ΔΔCt method [46,47]. The relative expression values and fragments per kilobase of transcript per million (FPKM) values were calculated and normalized using log2 (Fold-Change) measurements.
4.8. Statistical Methods
Excel 2016 software was used to organize the anthocyanin-related genes and metabolite data, GraphPad Prism 9.51 software to draw line graphs, Origin2019b software was used for the principal component analysis, SPSS 25.0 software was used for the significant analysis of variance, and Adobe Photophoto CC software(Adobe Photoshop CC 2019) was used to organize the images. The Cloud platform analysis tools (https://cloud.metware.cn, accessed on 20 November 2023) were subjected to correlation analysis.
5. Conclusions
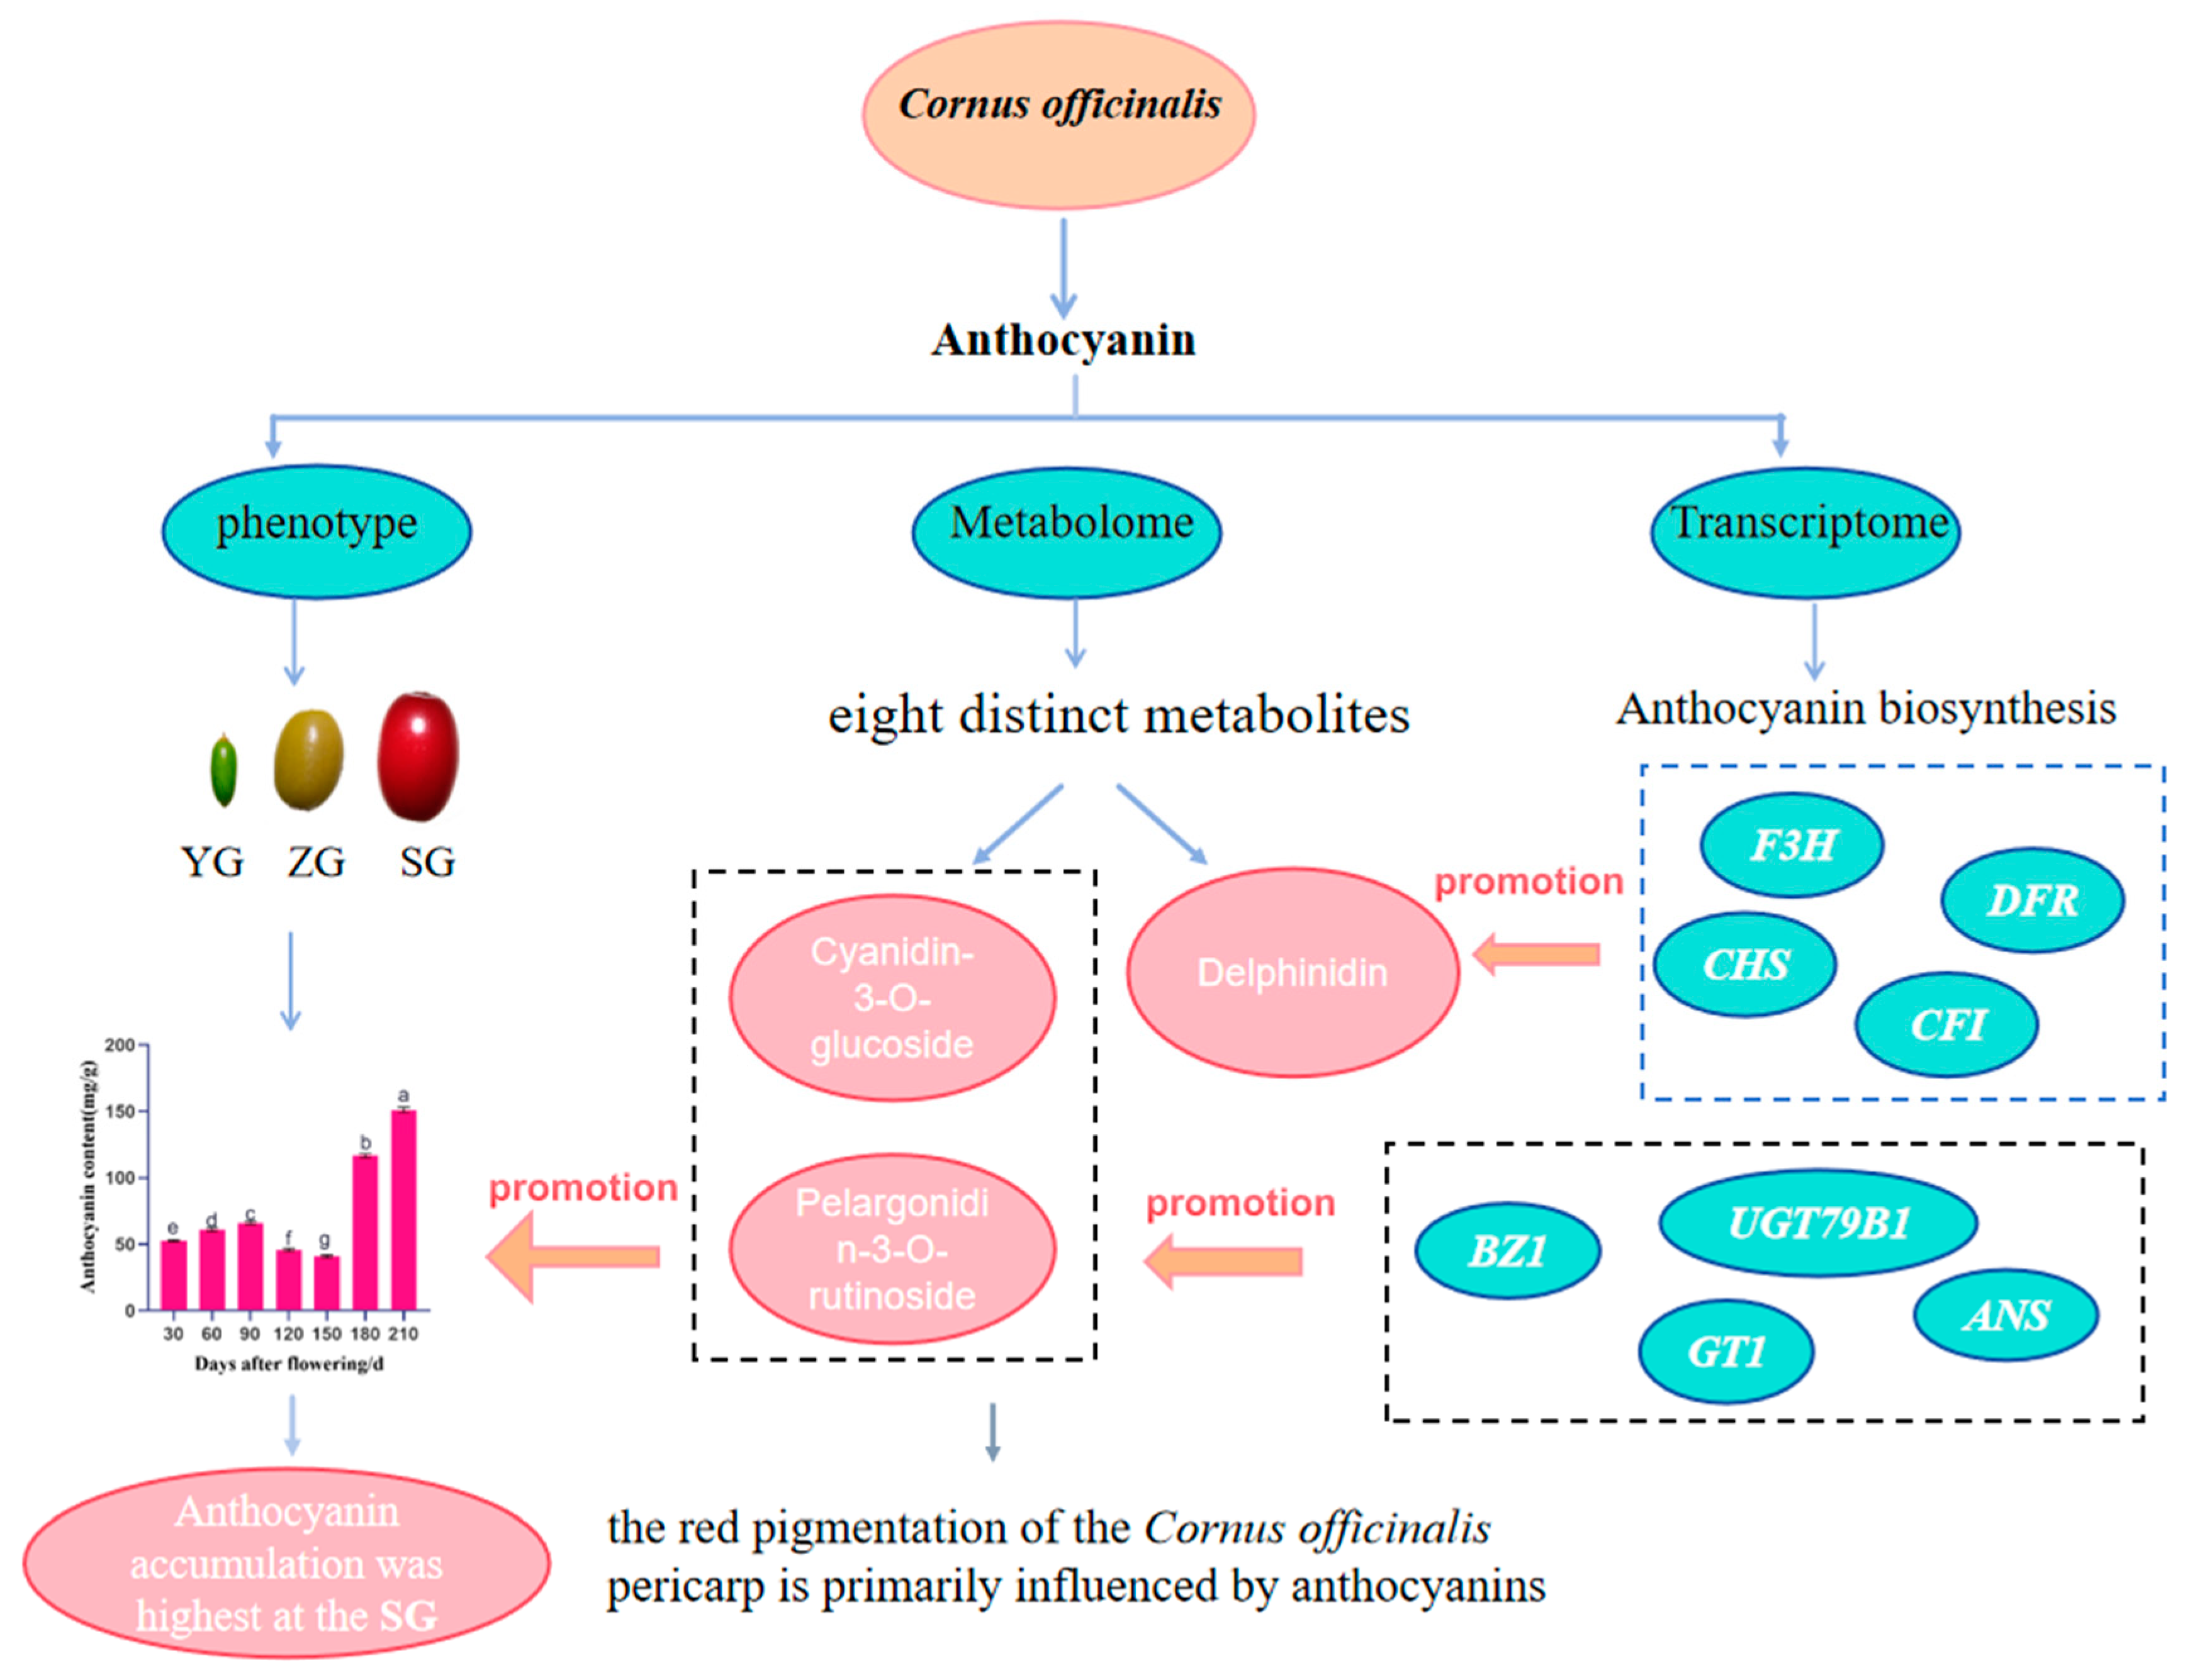
This investigation into Cornus officinalis fruit development has yielded significant insights into the anthocyanin accumulation and pericarp coloration. By conducting comprehensive sampling and analysis at different developmental stages, employing morphological observation and metabolomic and transcriptomic techniques, we observed a notable increase in the anthocyanin accumulation during the transition to the red stage of fruit maturation (Figure 8). The metabolomic profiling identified Cyanidin-3-O-glucoside and Pelargonidin-3-O-rutinoside as the key metabolites that contribute to the fruit’s vibrant red coloration. The transcriptome analysis identified 25,740 differentially expressed genes, encompassing 41 structural genes pivotal in anthocyanin biosynthesis. The integration of these genes with counterparts related to anthocyanin biosynthesis and metabolites within the anthocyanin metabolic pathway facilitated a comprehensive analysis. This scrutiny unveiled a positive correlation between the anthocyanin content and the expression of key genes—CHS, F3H, DFR, ANS, UGT79B1, GT1, CFI, and BZ1—from the early fruit stage to ripening. Particularly noteworthy were the significant and positive correlations observed in UGT79B1, ANS, GT1, and BZ1 with the cyanidin and pelargonidin levels. This observation strongly suggests their pivotal roles in steering the anthocyanin biosynthesis process. This study establishes a foundation for delving into the biochemical and molecular mechanisms underlying the anthocyanin accumulation in Cornus officinalis. Additionally, it furnishes a theoretical framework for further research into the gene regulatory network governing the anthocyanin biosynthesis in this species. These findings offer valuable insights for future studies and hold potential applications for breeding programs aimed at enhancing the fruit’s color and nutritional properties.
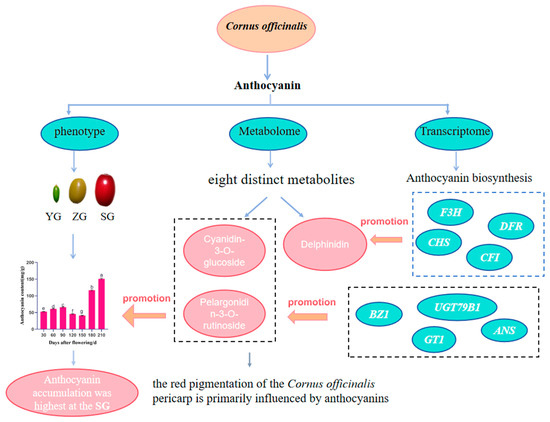
Figure 8.
Flowchart of the experiment to analyze the regulatory mechanism of the anthocyanin accumulation in the pericarp of Cornus officinalis. Different letters indicate significant differences (p < 0.05).
Supplementary Materials
The following supporting information can be downloaded at: https://www.mdpi.com/article/10.3390/horticulturae10060651/s1, Figure S1: The growing environment of Cornus officinalis; Table S1: Primers and sequences used in this study; Table S2: Classification of differential metabolite K-means plot.
Author Contributions
Y.Q. and X.C. conceived of and orchestrated the study, conducted the experiments, examined the data, and authored the paper. J.Y. conducted the microscopic observation. J.G. and G.Z. contributed to the experimental work and data analysis. Y.Y. aided in the sample collection and participated in the data analysis. X.Y., X.Z., and Y.C. played roles in the language refinement. All the authors revised the paper. All authors have read and agreed to the published version of the manuscript.
Funding
This research was financed by funds from the Shaanxi Provincial Department of Education Youth Innovation Team Research Program Project (23JP037), the Shaanxi University of Chinese Medicine Graduate Innovation Practice Ability Enhancement Project (CXSJ202309), and the Subject Innovation Team of Quality Control and Resources Development of “Qin Medicine” of Shaanxi University of Chinese Medicine (2019-QN01). The funders had no role in the study design, data collection or analysis, the decision to publish, or the preparation of the manuscript.
Data Availability Statement
The RNA-seq data were deposited in the National Center for Biotechnology Information Short Read Archive (NCBI-SRA) database (https://dataview.ncbi.nlm.nih.gov/object/PRJNA1047985?reviewer=hp6t0knvolprqa3hu8qlj4fv4h, release date: 16 July 2024) under accession number PRJNA1047985.
Acknowledgments
We would like to thank Wuhan Maiwei Metabolic Biotechnology Co., Ltd., for their help with the significant-difference analyses.
Conflicts of Interest
The authors declare no conflicts of interest.
References
- Solfanelli, C.; Poggi, A.; Loreti, E.; Alpi, A.; Perata, P. Sucrose-specific induction of the anthocyanin biosynthetic pathway in Arabidopsis. Plant Physiol. 2006, 140, 637–646. [Google Scholar] [CrossRef] [PubMed]
- Fang, H.C.; Dong, Y.H.; Yue, X.X. The B-box zinc finger protein MdBBX20 integrates anthocyanin accumulation in response to ultraviolet radiation and low temperature. Plant Cell Environ. 2019, 42, 2090–2104. [Google Scholar] [CrossRef] [PubMed]
- Zhang, Q.; Wang, L.L.; Liu, Z.G.; Zhao, Z.H.; Zhao, J.; Wang, Z.T.; Zhou, Z.F.; Liu, P.; Liu, M.G. Transcriptome and metabolome profiling unveil the mechanisms of Ziziphus jujuba Mill. peel coloration. Food Chem. 2020, 312, 125903. [Google Scholar] [CrossRef] [PubMed]
- Colanero, S.; Tagliani, A.; Perata, P.; Gonzali, S. Alternative splicing in the anthocyanin fruit gene encoding an R2R3 MYB transcription factor affects anthocyanin biosynthesis in tomato fruits. Plant Commun. 2020, 1, 100006. [Google Scholar] [CrossRef] [PubMed]
- Sunil, L.; Shetty, N.P. Biosynthesis and regulation of anthocyanin pathway genes. Appl. Microbiol. Biotechnol. 2022, 106, 1783–1798. [Google Scholar] [CrossRef] [PubMed]
- Liu, H.M.; Liu, Z.J.; Wu, Y.; Zheng, L.M.; Zhang, G.F. Regulatory mechanisms of anthocyanin biosynthesis in apple and pear. Int. J. Mol. Sci. 2021, 22, 8441. [Google Scholar] [CrossRef] [PubMed]
- Dubos, C.; Stracke, R.; Grotewold, E.; Weisshaar, B.; Martin, C.; Lepiniec, L. MYB transcription factors in Arabidopsis. Trends Plant Sci. 2010, 15, 573–581. [Google Scholar] [CrossRef] [PubMed]
- Yang, X.H.; Wang, J.R.; Xia, X.Z.; Zhang, Z.Q.; He, J.; Nong, B.X.; Luo, T.P.; Feng, R.; Wu, Y.Y.; Pan, Y.H.; et al. OsTTG1, a WD40 repeat gene, regulates anthocyanin biosynthesis in rice. Plant J. 2021, 107, 198–214. [Google Scholar] [CrossRef]
- Yan, H.L.; Pei, X.N.; Zhang, H.; Li, X.; Zhang, X.X.; Zhao, M.H.; Chiang, V.L.; Sederoff, R.R.; Zhao, X.Y. MYB-Mediated regulation of anthocyanin biosynthesis. Int. J. Mol. Sci. 2021, 22, 3103. [Google Scholar] [CrossRef]
- Chinese Pharmacopoeia Commission. Pharmacopoeia of the People’s Republic of China; China Medical Science and Technology Press: Beijing, China, 2020.
- Ma, J.X. Shennong Bencao Jing Jizhu; People’s Medical Publishing House: Beijing, China, 2013. [Google Scholar]
- Zou, Q.; Wang, T.; Guo, Q.; Yang, F.; Chen, J.; Zhang, W. Combined metabolomic and transcriptomic analysis reveals redirection of the phenylpropanoid metabolic flux in different colored medicinal Chrysanthemum morifolium. Ind. Crop. Prod. 2021, 164, 113343. [Google Scholar] [CrossRef]
- Lou, Q.; Liu, Y.L.; Qi, Y.Y.; Jiao, S.Z.; Tian, F.F.; Jiang, L.; Wang, Y.J. Transcriptome sequencing and metabolite analysis reveals the role of delphinidin metabolism in flower colour in grape hyacinth. J. Exp. Bot. 2014, 65, 3157–3164. [Google Scholar] [CrossRef]
- Li, Y.K.; Fang, J.B.; Qi, X.J.; Lin, M.M.; Zhong, Y.P.; Sun, L.M.; Cui, W. Combined analysis of the fruit metabolome and transcriptome reveals candidate genes involved in flavonoid biosynthesis in actinidia arguta. Int. J. Mol. Sci. 2018, 19, 1471. [Google Scholar] [CrossRef] [PubMed]
- Chen, X.M.; Yan, Y.G.; Zhang, G.; Peng, L.; Wei, Y.; Chen, Y. Effect of different developmental periods on the pattern of fruit quality changes in Cornus officinalis. North. Hortic. 2022, 2, 103–110. [Google Scholar] [CrossRef]
- Yan, S.S.; Chen, N.; Huang, Z.J.; Li, D.J.; Zhi, J.J.; Yu, B.W.; Liu, X.X.; Cao, B.H.; Qiu, Z.K. Anthocyanin fruit encodes an R2R3-MYB transcription factor, SlAN2-like, activating the transcription of SlMYBATV to fine-tune anthocyanin content in tomato fruit. N. Phytol. 2020, 225, 2048–2063. [Google Scholar] [CrossRef] [PubMed]
- Ji, X.L.; Ren, J.; Lang, S.Y.; Wang, D.; Zhu, L.W.; Song, X.S. Differential regulation of anthocyanins in cerasus humilis fruit color revealed by combined transcriptome and metabolome analysis. Forests 2020, 11, 1065. [Google Scholar] [CrossRef]
- Yun, Z.; Juanli, S.; Sylvia, C.; An, J.P.; Andrew, A.C.; Han, Y.P. Colorful hues: Insight into the mechanisms of anthocyanin pigmentation in fruit. Plant Physiol. 2023, 192, 1718–1732. [Google Scholar] [CrossRef] [PubMed]
- Cai, O.; Zhang, H.; Yang, L.; Wu, H.; Qin, M.; Yao, W.; Huang, F.; Li, L.; Lin, S. Integrated Transcriptome and Metabolome Analyses Reveal Bamboo Culm Color Formation Mechanisms Involved in Anthocyanin Biosynthetic in Phyllostachys nigra. Int. J. Mol. Sci. 2024, 25, 1738. [Google Scholar] [CrossRef] [PubMed]
- Zhong, Y.D.; Chen, C.H.; Gong, X.; Luan, X.Y.; Wu, Z.X.; Li, H.H.; Liu, Q.L.; Xu, M.; Yu, F.X. Transcriptome and metabolome analyses reveal a key role of the anthocyanin biosynthetic pathway cascade in the pigmentation of a Cinnamomum camphora red bark mutant (‘Gantong 1’). Ind. Crop. Prod. 2022, 175, 114236. [Google Scholar] [CrossRef]
- Zhao, T.; Wei, Z.; Liu, H.; Dong, L. Integrated Metabolome and Transcriptome Analyses Reveal That the Flavonoid Metabolic Pathway Is Associated with Pigment Differential Accumulation in Two Colors of Petaloid Staminodes in Canna glauca. Horticulturae 2024, 10, 372. [Google Scholar] [CrossRef]
- Shen, Y.; Mao, L.; Zhou, Y.; Sun, Y.; Liu, Z.; Liang, C. Integrated Transcriptome and Metabolome Analysis Revealed the Molecular Mechanism of Anthocyanin Synthesis in Purple Leaf Pepper (Capsicum annuum L.) under Different Light Intensities. Horticulturae 2023, 9, 814. [Google Scholar] [CrossRef]
- Veberic, R.; Slatnar, A.; Bizjak, J.; Stampar, F.; Maja, M.P. Anthocyanin composition of different wild and cultivated berry species. LWT-Food Sci. Technol. 2015, 60, 509–517. [Google Scholar] [CrossRef]
- Feng, X.; Gao, G.; Yu, C.; Zhu, A.; Chen, J.; Chen, K.; Wang, X.; Abubakar, A.S.; Chen, P. Transcriptome and metabolome analysis reveals anthocyanin biosynthesis pathway associated with ramie (Boehmeria nivea (L.) Gaud.) leaf color formation. BMC Genom. 2021, 22, 684. [Google Scholar] [CrossRef] [PubMed]
- Shen, J.; Shao, W.; Du, Z.; Lu, H.; Li, J. Integrated metabolomic and transcriptomic analyses reveal differences in the biosynthetic pathway of anthocyanins in fragaria nilgerrensis and fragaria pentaphylla. Sci. Hortic. 2020, 271, 109476. [Google Scholar] [CrossRef]
- Huang, P.; Lin, F.; Li, B.; Zheng, Y. Hybrid-transcriptome sequencing and associated metabolite analysis reveal putative genes involved in flower color difference in rose mutants. Plants 2019, 8, 267. [Google Scholar] [CrossRef] [PubMed]
- Li, X.; Li, Y.; Zhao, M.; Hu, Y.; Meng, F.; Song, X.; Tigabu, M.; Chiang, V.L.; Sederoff, R.; Ma, W.; et al. Molecular and metabolic insights into anthocyanin biosynthesis for leaf color change in chokecherry (Padus virginiana). Int. J. Mol. Sci. 2021, 22, 10697. [Google Scholar] [CrossRef] [PubMed]
- Bai, S.; Sun, Y.; Qian, M.; Yang, F.; Ni, J.; Tao, R.; Li, L.; Shu, Q.; Zhang, D.; Teng, Y. Transcriptome analysis of bagging-treated red chinese sand pear peels reveals light-responsive pathway functions in anthocyanin accumulation. Sci. Rep. 2017, 7, 63. [Google Scholar] [CrossRef] [PubMed]
- Jaakola, L. New insights into the regulation of anthocyanin biosynthesis in fruits. Trends Plant Sci. 2013, 18, 477–483. [Google Scholar] [CrossRef] [PubMed]
- Kataoka, I.; Sugiyama, A.; Beppu, K. Role of ultraviolet radiation in accumulation of anthocyanin in berries of ‘Gros Colman’ Grapes (Vitis vinifera L.). J. Jpn. Soc. Hortic. Sci. 2003, 72, 1–6. [Google Scholar] [CrossRef]
- Xu, W.L.; Pei, X.L.; Jing, Z.G.; Xiong, Z.L. Genome-wide identification and expression characterization of the chalcone synthase gene family of capsicum annuum. Genom. Appl. Biol. 2015, 34, 1747–1752. [Google Scholar] [CrossRef]
- Himi, E.; Taketa, S. Barley Ant17, encoding flavanone 3-hydroxylase (F3H), is a promising target locus for attaining anthocyanin/proanthocyanidin-free plants without pleiotropic reduction of grain dormancy. Genome 2015, 58, 43–53. [Google Scholar] [CrossRef]
- Li, M.; Wang, Y.H.; Li, C.S.; Hou, L.; Zhao, C.Z.; Xia, H.; Wang, X.J. Cloning and expression analysis of flavanone 3-hydroxylase gene, AhF3H, from Arachis hypogaea L. Shandong Agric. Sci. 2013, 45, 1–6. [Google Scholar] [CrossRef]
- Hall, J.; Ananga, A.; Georgiev, V.; Ochieng, J.; Cebert, E.; Tsolova, V. Molecular cloning, characterization, and expression analysis of Flavanone 3-Hydroxylase (F3H) gene during muscadine grape berry development. J. Biotechnol. Biomater. 2015, 5, 1–7. [Google Scholar] [CrossRef]
- Jiang, F.; Wang, J.; Jia, H.; Jia, W.; Wang, H.; Xiao, M. RNAi-mediated silencing of the Flavanone 3-Hydroxylase gene and its effect on flavonoid biosynthesis in strawberry fruit. J. Plant Growth Regul. 2013, 32, 182–190. [Google Scholar] [CrossRef]
- Qi, X.W.; Shuai, Q.; Fan, L.; Zeng, Q.W.; Xiang, Z.H.; He, N.J. Cloning of mulberry anthocyanin synthase (ANS) gene and its expression characteristics in two fruit-colored mulberry species. Acta Sericologica Sin. 2013, 39, 5–13. [Google Scholar] [CrossRef]
- Sui, X.; Gao, X.; Ao, M.; Wang, Q.; Yang, D.; Wang, M.; Fu, Y.; Wang, L. cDNA cloning and characterization of UDP-glucose: Anthocyanidin 3-O-glucosyltransferase in freesia hybrida. Plant Cell Rep. 2011, 30, 1209–1218. [Google Scholar] [CrossRef] [PubMed]
- Liu, G.Y.; Fang, W.; Yu, C.M.; Lian, B.L.; Chen, Y.H.; Zhong, F.; Zhang, J. Progress in the study of anthocyanin regulation of flower color in plants. J. Anhui Agric. Sci. 2021, 49, 1–4. [Google Scholar] [CrossRef]
- Yonekura-Sakakibara, K.; Fukushima, A.; Nakabayashi, R.; Hanada, K.; Matsuda, F.; Sugawara, S.; Inoue, E.; Kuromori, T.; Ito, T.; Shinozaki, K.; et al. Two glycosyltransferases involved in anthocyanin modification delineated by transcriptome independent component analysis in Arabidopsis thaliana. Plant J. 2012, 69, 154–167. [Google Scholar] [CrossRef] [PubMed]
- Liu, Y.; Ma, K.; Qi, Y.; Lv, G.; Ren, X.; Liu, Z.; Ma, F. Transcriptional Regulation of Anthocyanin Synthesis by MYB-bHLH-WDR Complexes in Kiwifruit (Actinidia chinensis). J. Agric. Food Chem. 2021, 69, 3677–3691. [Google Scholar] [CrossRef] [PubMed]
- Yang, L.; Li, Z.; Li, J.; Ma, Y.; Miao, M.; Long, H.; Zhou, Y.; Chang, W. Integrative Metabolome and Transcriptome Analyses Reveal the Pericarp Coloration Mechanisms in Bitter Melon (Momordica charantia L.). Horticulturae 2024, 10, 291. [Google Scholar] [CrossRef]
- Stracke, R.; Werber, M.; Weisshaar, B. The R2R3-MYB gene family in Arabidopsis thaliana. Curr. Opin. Plant Biol. 2001, 4, 447–456. [Google Scholar] [CrossRef]
- Gonzalez, A.; Zhao, M.; Leavitt, J.M.; Lloyd, A.M. Regulation of the anthocyanin biosynthetic pathway by the TTG1/bHLH/Myb transcriptional complex in Arabidopsis seedlings. Plant J. 2008, 53, 814–827. [Google Scholar] [CrossRef] [PubMed]
- Wu, X.X.; Xue, L.B.; Cha, D.S.; Chen, J.L. Changes in the content of major pigments during the growth and development of colored bell pepper fruits. Southwest China J. Agric. Sci. 2008, 4, 1040–1044. [Google Scholar] [CrossRef]
- Robinson, M.D.; McCarthy, D.J.; Smyth, G.K. edgeR: A bioconductor package for differential expression analysis of digital gene expression data. Bioinformatics 2009, 26, 139–140. [Google Scholar] [CrossRef] [PubMed]
- Livak, K.J.; Schmittgen, T.D. Analysis of relative gene expression data using real-time quantitative PCR and the 2−ΔΔCT method. Methods 2001, 25, 402–408. [Google Scholar] [CrossRef]
- Adnan, M.; Morton, G.; Hadi, S. Analysis of rpoS and bolA gene expression under various stress-induced environments in planktonic and biofilm phase using 2−ΔΔCT method. Mol. Cell Biochem. 2011, 357, 275–282. [Google Scholar] [CrossRef]


Disclaimer/Publisher’s Note: The statements, opinions and data contained in all publications are solely those of the individual author(s) and contributor(s) and not of MDPI and/or the editor(s). MDPI and/or the editor(s) disclaim responsibility for any injury to people or property resulting from any ideas, methods, instructions or products referred to in the content. |
© 2024 by the authors. Licensee MDPI, Basel, Switzerland. This article is an open access article distributed under the terms and conditions of the Creative Commons Attribution (CC BY) license (https://creativecommons.org/licenses/by/4.0/).