Article

Fruit Position, Light Exposure and Fruit Surface Temperature Affect Colour Expression in a Dark-Red Apple Cultivar

1
Tatura SmartFarm, Agriculture Victoria, Tatura, VIC 3616, Australia
2
School of Agriculture, Food and Ecosystem Sciences, The University of Melbourne, Parkville, VIC 3010, Australia
3
Agriculture Victoria, Epsom, VIC 3551, Australia
*
Authors to whom correspondence should be addressed.
Horticulturae 2024, 10(7), 725; https://doi.org/10.3390/horticulturae10070725
Submission received: 27 May 2024 / Revised: 28 June 2024 / Accepted: 1 July 2024 / Published: 9 July 2024
(This article belongs to the Section Fruit Production Systems)

Abstract

:
This study aimed to evaluate the effects of fruit position, light exposure and fruit surface temperature (FST) on apple fruit colour development and fruit quality at harvest, including sunburn damage severity. This was achieved by undertaking two experiments in a high-density planting of the dark-red apple ANABP 01 in Tatura, Australia. In the 2020–2021 growing season an experiment was conducted to draw relationships between fruit position and fruit quality parameters. Here, sample fruit position and level of light exposure were respectively determined using a static LiDAR system and a portable quantum photosynthetically active radiation (PAR) sensor. At harvest the sample fruit were analysed for percentage red colour coverage, objective colour parameters (L*, a*, b*, hue angle and chroma), sunburn damage, fruit diameter (FD), soluble solids concentration (SSC), flesh firmness (FF) and starch pattern index (SPI). A second experiment was conducted in the 2021–2022 growing season and focused on how fruit shading, light exposure and the removal of ultraviolet (UV) radiation affected the FST, colour development and harvest fruit quality. Five treatments were distributed among sample fruit: fully shaded with aluminium umbrellas, shaded for one month and then exposed to sunlight until harvest, exposed for one month and then shaded until harvest, covered with a longpass UV filter and a control treatment. The development of colour in this dark-red apple cultivar was highly responsive to aspects of fruit position, and the intensity and quality of light exposure. The best-coloured fruit were exposed to higher quantities of PAR, exposed to both PAR and UV radiation simultaneously and located higher in the tree canopy. Fruit that were fully exposed to PAR and achieved better colour development also displayed higher FST and sunburn damage severity.

1. Introduction

Some aspects of internal and external apple fruit quality rely on light to produce higher-quality fruit. Exposing developing fruit to at least 30% of total incident global radiation has been reported as a minimum to guarantee good quality fruit [1,2]. Red colour development, fruit size and sugar accumulation have been particularly implicated in response to differences in light exposure [3,4,5]. The amount of incident light reaching fruit within the tree canopy (light penetration) depends on many environmental, orchard design and management factors [6] and has been linked to within-tree variations in fruit quality [7,8]. Fruit position within a tree canopy has similarly been implicated in fruit quality variability due to differences in light exposure because branches, foliage and other fruit cause shading of lower and more interior fruit [9,10].
Red apple cultivars differ in their patterns of colour expression [11], but most will display an accumulation of the anthocyanins responsible for red pigmentation during the cell division growth phase and later during the maturation phase. While these patterns are, for the most part, genetically modulated, there are environmental influences that can simultaneously interact to affect red colour development. The primary external factors that influence apple colouration are light and temperature [12]. Photosynthetically active radiation (PAR, 400–700 nm) and UV light are especially implicated in red colour development in apple [13]. Lower ambient air temperature, and therefore fruit temperature, in the weeks prior to harvest, particularly at night, is understood to stimulate anthocyanin biosynthesis in red and blush apple cultivars [14,15]. Curry [16] demonstrated that skin discs of pre-climacteric fruit tissue (ethylene < 0.5 μL L−1) of Red Chief Delicious apples better accumulated anthocyanin in the temperature range of 15–35 °C, with 25 °C being the optimum temperature. In the same study it was observed that a period of two to three nights at temperatures of 2–5 °C in conjunction with warm and sunny days contributed significantly to colour development of Delicious apple skin discs. This feature has been further explained by the increase in phenylalanine ammonia-lyase, an enzyme crucial to flavonoid synthesis, in response to temperature drops [17]. The exposure of fruit to direct solar radiation also causes radiant heating of the fruit surface which, if excessive, can cause sunburn browning or sunburn necrosis [18,19].
ANABP 01 was bred by the Western Australian Department of Agriculture and Food by crossing Cripps Red (a Pink Lady® cultivar) and Royal Gala. Fruit that meets quality specifications is sold domestically in Australia under the name BravoTM and internationally under the name SolunaTM. The deep colour of ANABP 01 fruit is a vital characteristic of its quality with at least 60% of the fruit’s surface area required to be black to dark burgundy in order to be marketed under the BravoTM brand [20]. Additionally, no more than 10% of the fruit’s surface area can be uncoloured (green, cream or yellow). Inability to achieve the desired colour specifications of the BravoTM brand means that those fruit will not sell for a premium price. Consumer preference studies on apples have demonstrated that colour is important for market value and that red colour is associated with sweetness [12,21].
This study aimed to evaluate the effects of fruit position, light exposure and fruit surface temperature (FST) on ANABP 01 fruit colour development and fruit quality at harvest, including sunburn damage severity.

2. Materials and Methods

Two experiments were conducted in the Sundial Orchard at the Tatura SmartFarm (Agriculture Victoria, Tatura, Australia; 36.437° S, 145.268° E, 114 m MSL) during the 2020–2021 and 2021–2022 seasons. The first experiment utilised high-precision geolocation to construct relationships between fruit position, light exposure and harvest fruit quality parameters. The second experiment investigated how fruit shading, light exposure and the removal of ultraviolet (UV) radiation affected the fruit surface temperature (FST), colour development and harvest fruit quality of dark-red apple fruit.
The Sundial Orchard is a high-density multidirectional orchard of approximately 0.3 ha of apple trees. One half of the Sundial Orchard is ANABP 01 apple trees (Cripps Red × Royal Gala) planted in a semicircle following four different row orientations (N—S, NE—SW, E—W and SE—NW). The ANABP 01 trees were trained on a vertical trellis in a 2D system, at 1 m tree spacing, 3.5 m row spacing and approximately 2.5 m tree height. There is a total of 20 rows—5 rows per row orientation. Scions were grafted onto three dwarfing rootstocks, Budagovsky 9 (Bud.9), Malling 9 T337 (M9) and Malling 26 (M26)—and planted as one-year-old bare-rooted trees in the winter of 2018 in a complete randomised block design. Each row is subdivided into three plots (separated by posts), one for each rootstock, which is in turn composed of 11 ANABP 01 trees and one polliniser (Granny Smith). Irrigation, nutrition, pruning, fruit thinning and pest management were the same for all trees in line with established commercial practices.

2.1. Effects of Fruit Position and Light Exposure on Fruit Quality

One tree was selected from the middle of each of 36 experimental plots in the central three rows of each row orientation. Three fruit per tree were selected from three different canopy heights (<1 m, between 1 and 2 m and >2 m) for a total of 108 fruit. Rootstock effect was not analysed due to sample size limitations.
Fruit position was determined using a static LiDAR 3D laser scanner (Leica BLK360, Leica Geosystems, Heerbrugg, Switzerland). X-, Y- and Z-coordinates (XYZ-coordinates) were assigned to each fruit, with X representing horizontal shift across the row (X = 0 at the trunk), Y representing horizontal shift along the row (Y = 0 at the trunk) and Z representing vertical shift (Z = 0 at ground level). LiDAR measurements were collected at two different points for each side of the selected plots and point cloud images were generated using the software Cyclone REGISTER 360 (v. 22.1.0 Leica Geosystems, Heerbrugg, Switzerland).

2.1.1. Fruit Light Exposure

Fruit light exposure on the horizontal plane was measured three times (solar noon, solar noon − 3.5 h and solar noon + 3.5 h) on 27 January 2021, a clear-sky day, with a custom-built portable Bluetooth quantum PAR sensor (Instruments & Data Tools, Rowville, Australia). The measurement voltage was transmitted via Bluetooth to a smartphone app (IDT DataLogger, Instruments & Data Tools, Rowville, Australia) where the data were stored. A reference solar measurement in full direct sunlight was performed before measuring each trellis side. Sample fruit had three measurements performed at random points and the mean value taken. The output voltage of the sensor was calibrated against a Sunfleck ceptometer (Decagon Devices Inc., Pullman, WA, USA) to convert the values to PPFD (μmol m−2 s−1). PPFD data were expressed as the fraction of transmitted PAR, with the equation: f P A R t = P A R m / P A R s , where PARm is the measured PAR, and PARs is the solar reference measurement.

2.1.2. Harvest Fruit Quality

At harvest, the tagged fruit were assessed for red colour coverage (expressed as a percentage of the entire fruit surface area), several colour parameters (L*, a*, b*, hue angle and chroma), sunburn damage, fruit diameter (FD), soluble solids concentration (SSC), flesh firmness (FF) and SPI.
Sample fruit were harvested into trays and individually put through a fruit grader (Compac Sorting Equipment, Auckland, New Zealand) to measure the percentage coverage of dark-red colour (colours ranging from dark burgundy to black based on industry specification) and light red colour (colours ranging from red to burgundy based on industry specification). Fruit surfaces were illuminated with LED lights and images captured with RGB cameras while they moved and rotated through a cabinet. InVision software (Version 5.0.6.1111), Compac Sorting Equipment, Auckland, New Zealand) image stitching in combination with a cultivar-specific colour map determined the percentage coverage of dark-red and light-red colour for the peel of each fruit. After emerging from the grader, the sample fruit were placed back in their trays and transferred to the laboratory for further analysis.
Colour was measured using a portable Bluetooth colorimeter (Instruments & Data Tools, Rowville, Australia) with a 14 mm aperture, D65 illuminant (colour temperature 6504 K, simulates daylight) and 2° observer angle. The Commission International de l’Eclairage colour system was used to quantify colour attributes [22]. Colour parameters L*, a*, b*, hue angle and chroma were collected via a Bluetooth app (IDT DataLogger, Instruments & Data Tools, Rowville, Australia). The L* scale is a measure of lightness/darkness ranging from zero to +100; the a* scale is a measure of greenness to redness ranging from −60 (green) to +60 (red); the b* scale is a measure of blueness to yellowness ranging from −60 (blue) to +60 (yellow); hue angle ( h = tan 1 b * / a * ) is represented by a 360° wheel where 0 (or 360°) is true red, 90° is true yellow, 180° is true green and 270° is true blue; and chroma ( C * = a * 2 + b * 2 ) quantifies colour saturation or ‘vividness’ with values ranging from zero to +60. Due to the dark burgundy–black peel colour of mature ANABP 01 fruit, the resulting a* and h values are not necessarily representative of better colour in this cultivar. Therefore, a Colour Development Index (CDI) was created as a more intuitive representation of colour development, ranging from zero (less developed colour) to one (more developed, desirable colour). CDI has previously been used in peach, nectarine, bicoloured and red pear cultivars and Ruby Pink apple [23,24,25,26]. A modified version of CDI has been used in this study to accommodate the specific colour development of ANABP 01 apples, specifically incorporating L* to reflect the increase in black colour as the fruit ripens. The CDI value was derived from L*, a* and b* with Equation (1).
C D I = 1 a * + b * / 2 60 × 1 L * 100
Fruit were assessed for sunburn damage on a scale of zero (no sunburn damage) to five (necrosis; Figure 1). FD was measured using a Bluetooth calliper (OriginCal, iGAGING, San Clemente, CA, USA) integrated with a smartphone app (IDT DataLogger, ID Tools, Rowville, Australia) to log the collected values. Destructive assessments of internal quality parameters flesh firmness (FF) and soluble solids concentration (SSC) were performed, respectively, with a penetrometer (FT327, FACCHINI srl, Alfonsine, Italy) using an 11 mm probe and a digital refractometer (PR-1; Atago Co., Ltd., Tokyo, Japan). Measurements of both parameters were performed on two opposing sides of the fruit and the mean values calculated. Following this, a transverse cut was made to remove the bottom half of the fruit, which was then placed cut surface up and sprayed with a solution of potassium iodide (1% w/v) and iodine crystals (0.15% w/v). Fruit were visually assessed after ten minutes for SPI on a scale of one (high starch) to six (low starch).

2.1.3. Statistical Analysis

Boxplots for X-, Y- and Z-coordinates obtained with the LiDAR and fPARi were used to show the interquartile ranges (25th, 75th percentiles) and the sample medians. Pearson’s r correlation coefficients and significant effects of XYZ-coordinates on fPARi, and of XYZ-coordinates and fPARi on fruit quality parameters were analysed using jamovi software (Version 2.2, The jamovi project, 2021).

2.2. Effects of Shade and UV Filtration on FST and Fruit Quality

2.2.1. Experimental Design, Sampling and Treatments

The experiment was conducted as a randomized complete block design. Twenty-five sample fruit were chosen from each of three plots of trees running N–S and grown on Bud.9 rootstock (n = 75). This rootstock was selected for its reduced vigour compared to the other two rootstocks. Sample fruit were located on the western side of the trellis and were chosen based on their potential for high sun exposure. Clusters containing sample fruit were thinned to the sample fruit only. In total, five light exposure treatments were applied to five sample fruit in each block over two consecutive time periods. Sunlight shading (SS) treatment 1 (SS1) was shaded from direct sunlight from 95 to 172 days after full bloom (DAFB), SS2 was shaded from 95 to 126 DAFB and then exposed to sunlight until 172 DAFB, SS3 was exposed to sunlight from 95 to 126 DAFB and then shaded until 172 DAFB, a UV filter (UVF) treatment was applied from 95 to 172 DAFB, and the control treatment was fully exposed to sunlight for the duration of the experiment (Table 1). The treatments involved covering sample fruit with either aluminium umbrellas or a longpass UV filter. The aluminium umbrellas prevented direct sun exposure of the fruit. The longpass UV filter (MPN 39-426, Edmund Optics Inc., Singapore) was a flexible polyester film with a deep-dyed PET substrate that had a cut-on wavelength of 400 nm, i.e., UV-A, UV-B and UV-C radiation were absorbed by the filter substrate, allowing wavelengths from 400–750 nm to pass through. The aluminium and filter coverings applied to fruit were open at the bottom to ensure adequate air flow and to prevent increases in ambient air temperature.

2.2.2. FST

A subsample of six fruit per treatment spread evenly across the three rows (n = 30) were monitored for FST from 1 February 2022 (110 DAFB) until harvest. Fine-wire thermocouples (32 g copper-constantan; Type T, Tranzflo NZ Ltd., Palmerston North, New Zealand) were inserted on the face of the fruit expected to receive the most sun exposure. A small hole was made in the fruit epidermis with the thermocouple, which was then pushed along the interface of the epidermis and the fruit cortex away from the site of insertion [18]. FST data were recorded with data loggers (CR1000, Campbell Scientific, Logan, UT, USA) with measurements performed every 5 s and the data logged as one-minute averages. The thermocouples were checked at least once per week for dislodgement or breakage and replaced accordingly. Data recorded between the time of the previous thermocouple check and the discovery of a thermocouple dislodgement or breakage were disregarded from the dataset.

2.2.3. Fruit Quality

Sample fruit were monitored for peel colour parameters immediately prior to treatment application, when treatments were changed over at 126 DAFB and lastly at 172 DAFB (harvest). Peel colour parameters were measured using a handheld Bluetooth colourimeter (Instruments & Data Tools Pty Ltd., Rowville, Australia) and measurements were performed at three points on the fruit peel and the mean values used for analysis. For details on the interpretation of the CIELAB colour parameters, refer to the previous experiment. CDI was calculated using Equation (1).
At harvest, the sample fruit were assessed for FD, sunburn damage, FF, SSC and SPI. For details on these measurements, refer to previous experiment. In addition, dry matter concentration (DMC) was measured by extracting a core sample of the fruit cortex, measuring the fresh weight and placing the core sample in a food dehydrator for four days at 50 °C. Afterwards, the core samples were assessed for dry weight and the DMC calculated.

2.2.4. Statistical Analysis

Data were analysed with analysis of variance (ANOVA) to evaluate differences between treatment means of maximum and minimum daily temperatures, colour and fruit quality parameters. Analysis was undertaken using the Jamovi software (Version 2.2, The jamovi project, 2021).

3. Results

3.1. Effects of Fruit Position and Light Exposure on Fruit Quality
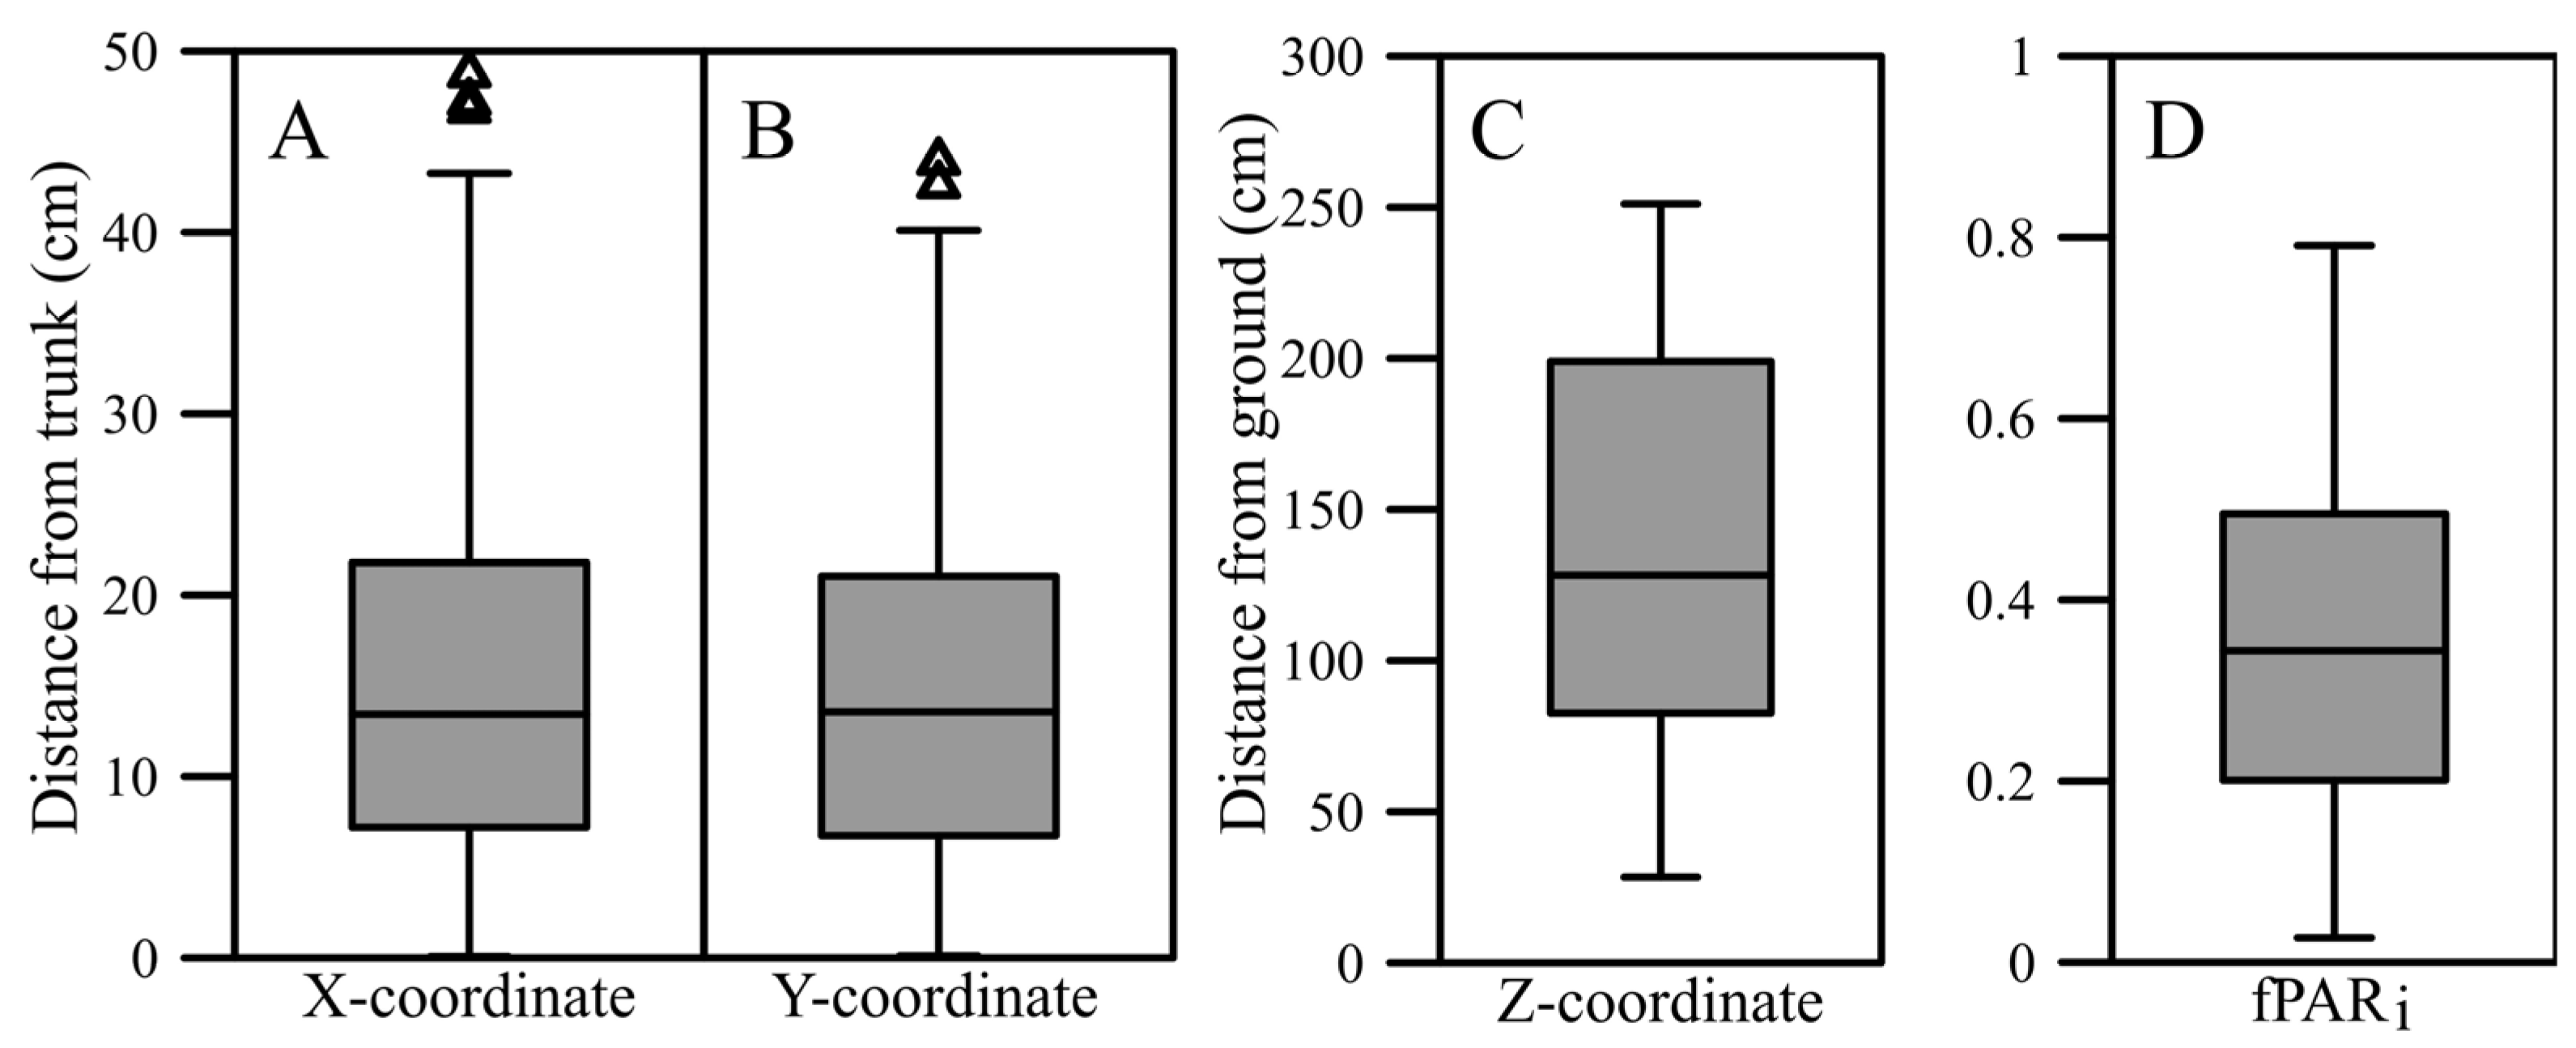
3.1.1. Sample Range

The sample fruit were well spread spatially for the X-, Y- and Z-coordinates (Figure 2A–C). X-coordinate values ranged from 0.07 to 49.05 cm; Y-coordinate values ranged from 0.09 to 35.37 cm; and Z-coordinate values ranged from 28.34 to 251.13 cm. The sample fruit were also exposed to a wide range of light levels, with the minimum fPARt value being 0.03 and the maximum being 0.79 (Figure 2D).

3.1.2. Correlations

Fruit Position and Light Exposure

The correlations (coefficient Pearson’s r) between fPARi and the XYZ-coordinates are presented in Table 2 to show what effects fruit position had on its level of light exposure. There was a highly significant positive correlation (r = 0.607, p < 0.001) between light exposure and fruit height (Z) but no correlation between light exposure and horizontal shift across (X) or along (Y) the row.

Fruit Position and Harvest Fruit Quality

Table 2 also presents the correlations of XYZ-coordinates and light exposure against fruit quality parameters. All fruit colour parameters, except for total red colour and hue angle, correlated with spatial factors. Dark-red coverage negatively correlated with horizontal shifts (r = −0.293 and −0.373 for X- and Y-coordinate, respectively) but did so positively with vertical shift (r = 0.266, p < 0.05). The opposite was the case with light-red coverage, which positively correlated with the horizontal shifts and negatively with vertical shift. L* and b* positively correlated with the X- and, particularly, Y-coordinates but negatively with the Z-coordinate. There was a highly significant positive correlation between a* and the Y-coordinate (r = 0.420, p < 0.001) but a highly significant negative correlation between CDI and the Y-coordinate (r = −0.411, p < 0.001). Sunburn damage severity and fruit diameter were not affected by any spatial factor. SSC showed a negative correlation with horizontal shift from the trunk across (i.e., X-coordinates), but not along (i.e., Y-coordinates), the row (Pearson’s r = −0.285 and −0.167, respectively). The vertical shift (i.e., Z-coordinate) was strongly correlated with FF (Pearson’s r = 0.379, p < 0.001).

Light Exposure and Harvest Fruit Quality

Light exposure level had significant effects and positive correlations with dark-red coverage (r = 0.286, p < 0.01) and CDI (r = 0.243, p < 0.05) and significant negative correlations with light-red coverage (r = −0.273, p < 0.01), L* (r = −0.260, p < 0.05), b* (r = −0.260, p < 0.05) and FD (r = −0.250, p < 0.05; Table 2). There were significant effects of light exposure on total red coverage and chroma (p < 0.05) but no significant correlations. FF had a strong positive correlation with light exposure. The remaining parameters—a* value, hue angle, sunburn damage severity, SSC and SPI—were not significantly correlated with light exposure.

3.2. Effects of Shade and UV Filtration on FST and Fruit Quality
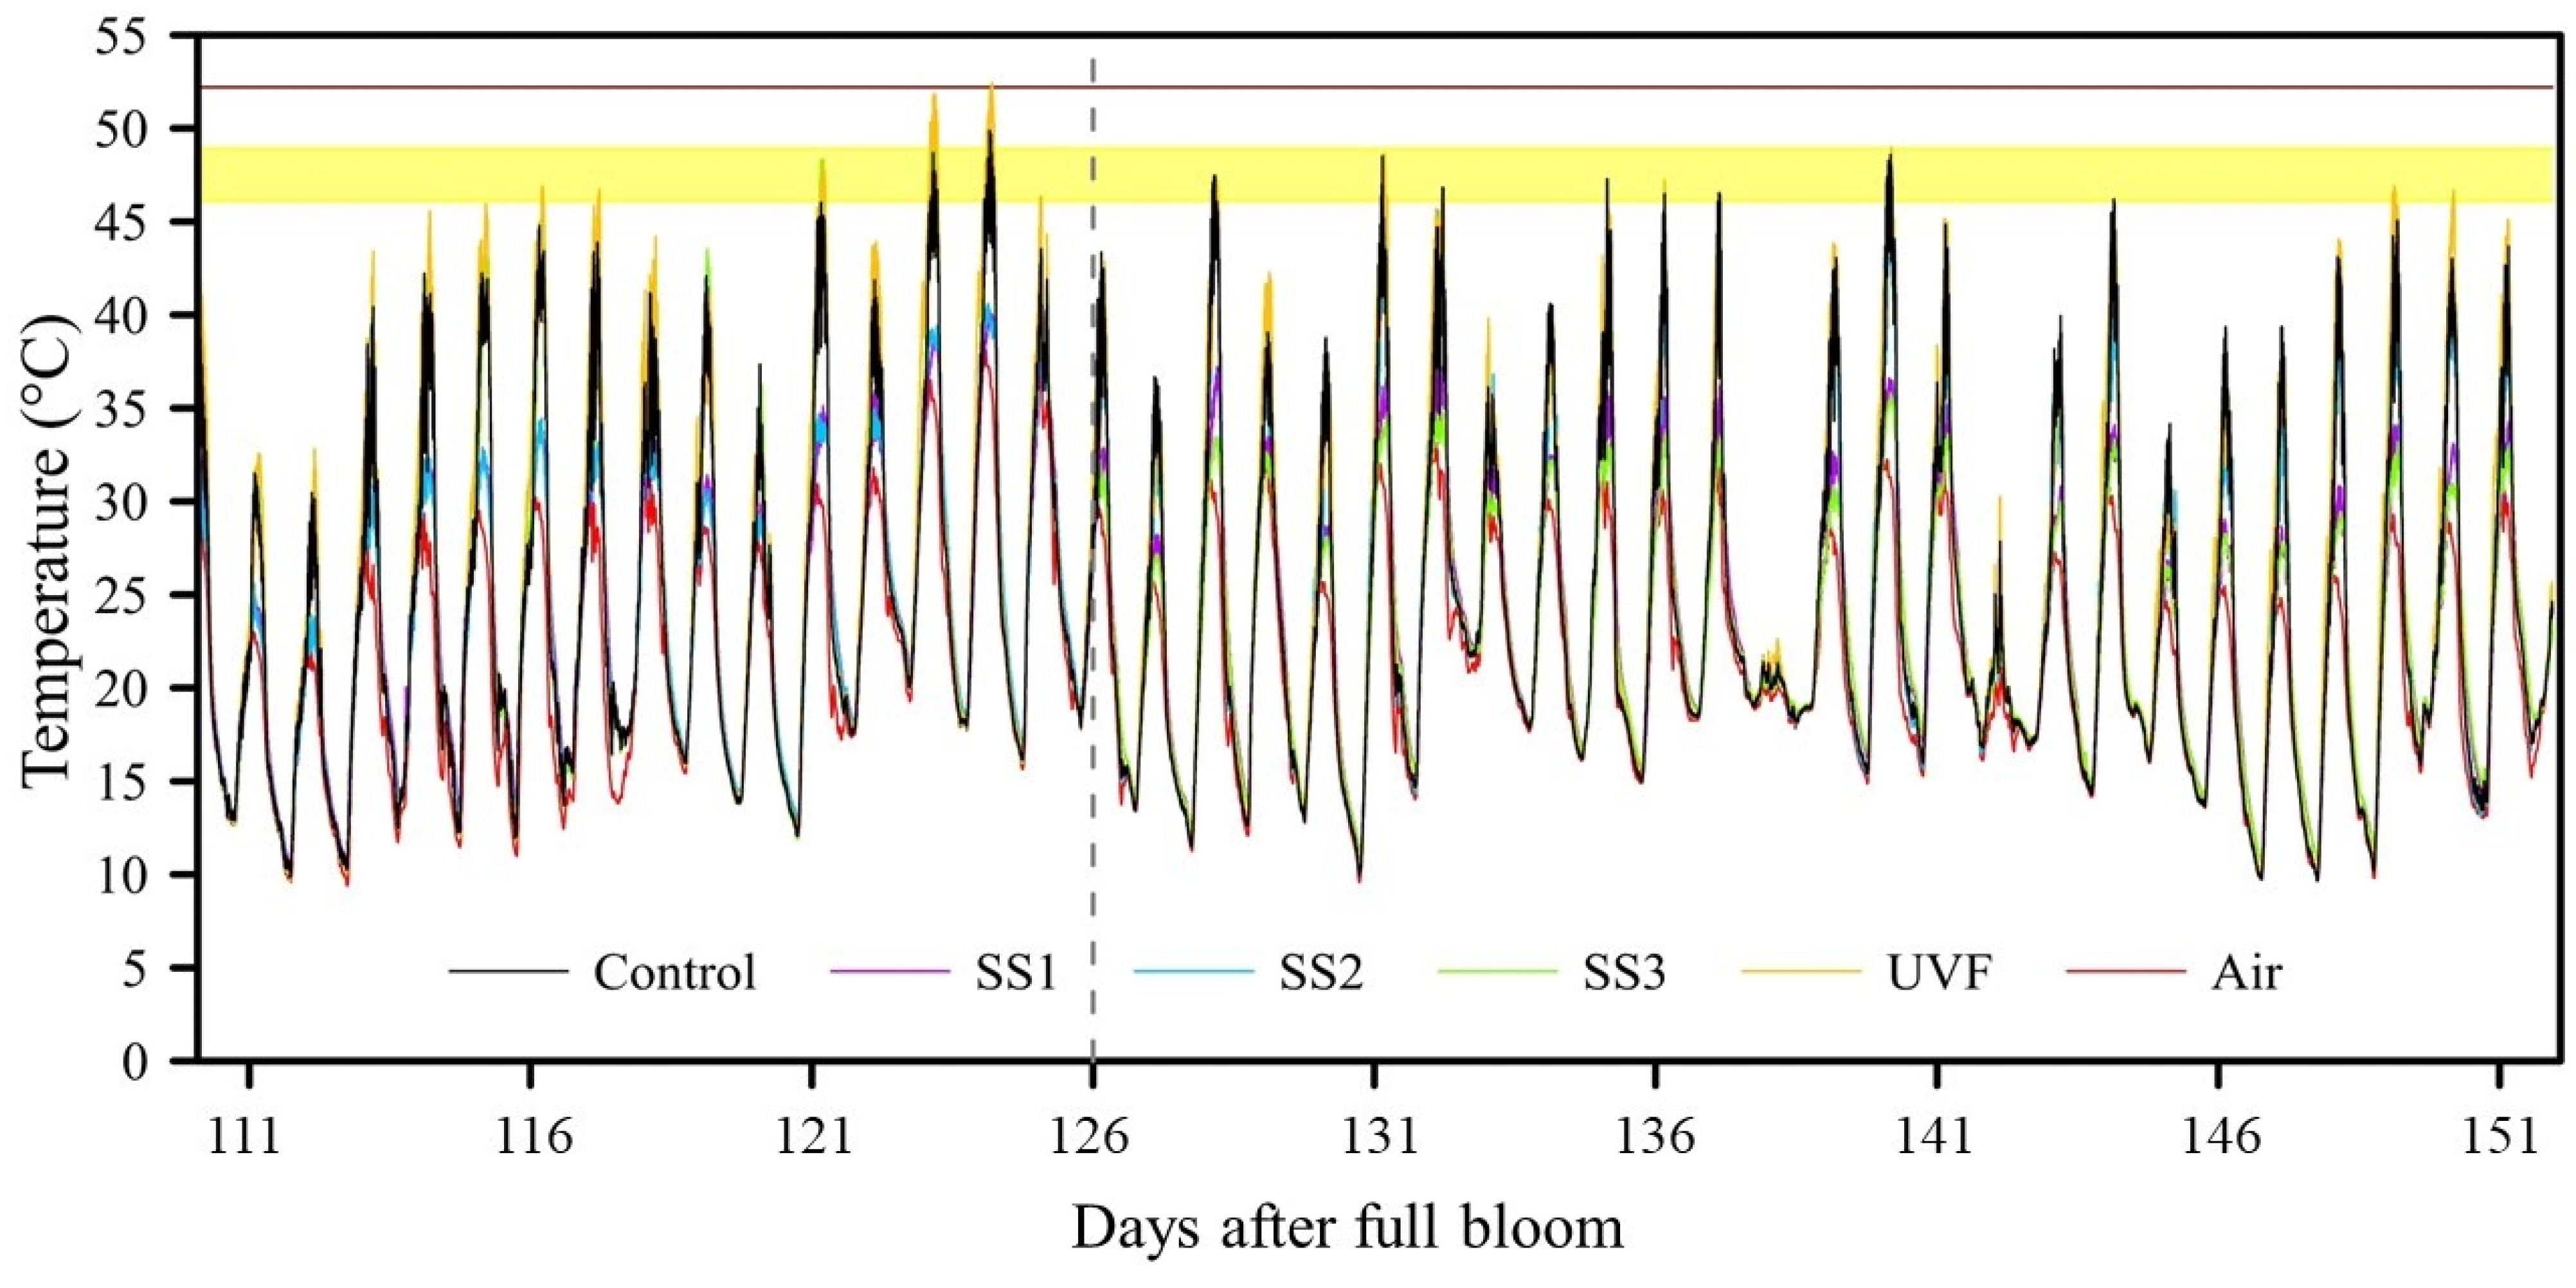
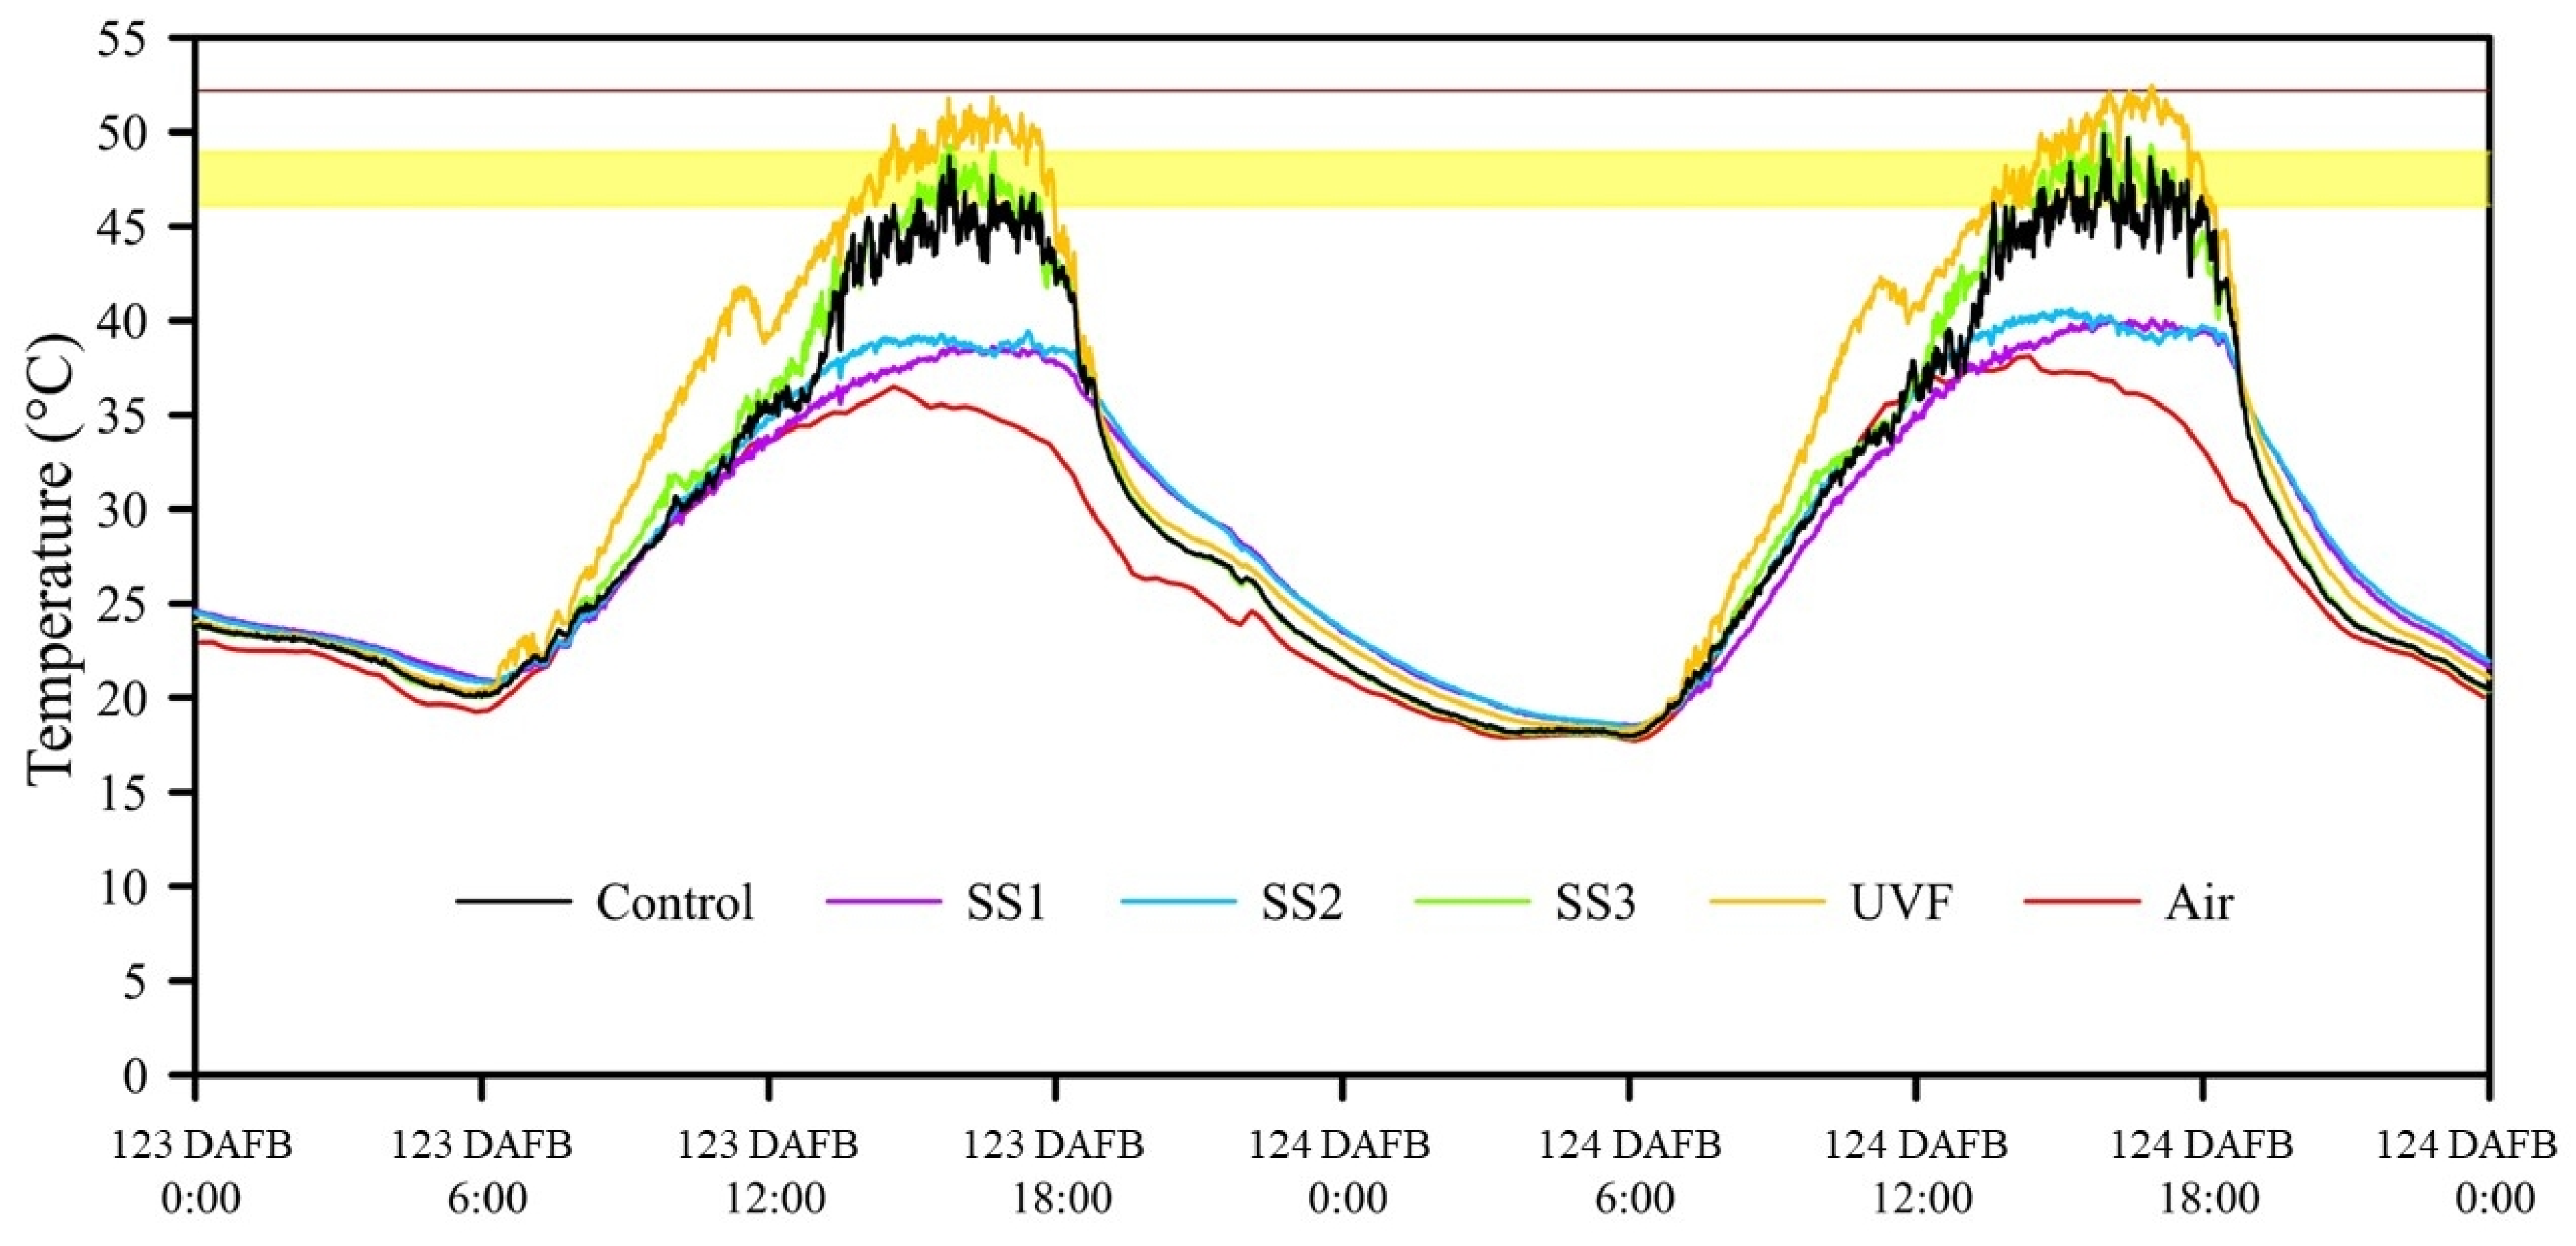
3.2.1. FST

The progression of maximum FST of the different light exposure treatments can be observed in Figure 3. There were several days during the monitoring period when the FST of the sun-exposed treatments reached the one-hour threshold for sunburn browning development. The UVF-treated fruit reached maximum FSTs of 51.9 and 52.5 °C at 123 and 124 DAFB, respectively, which is over the ten-minute threshold for sunburn necrosis (52.2 ± 1 °C; Figure 4).
Sun-exposed fruit consistently displayed significantly higher FST (p < 0.001) with UVF-treated fruit reaching the highest values, although these were not significantly different from those of the control (Table 3). At 126 DAFB, when light/shade changeover occurred, there was a visible switch in the maximum FST for SS2 and SS3 (Figure 3). Prior to this date, the exposed SS3 treatment did not have a significantly different maximum FST from the control and UVF treatments and it was significantly higher than that of the shaded SS1 and SS2 treatments (p < 0.001; Table 3). In contrast, after the foil umbrellas were respectively removed from SS2 and applied to SS3, the now-exposed SS2 treatment was not significantly different in maximum FST from the control and UVF treatments and was significantly higher than the shaded SS1 and SS3 treatments (p < 0.001). There were no significant differences in minimum daily FST during both time periods (p > 0.05). Low daytime FSTs were observed on 1 March, with a maximum FST of 21.7 °C for the C treatment, although air temperature only reached a maximum of 20.2 °C on that particular day (Figure 3).

3.2.2. Fruit Quality

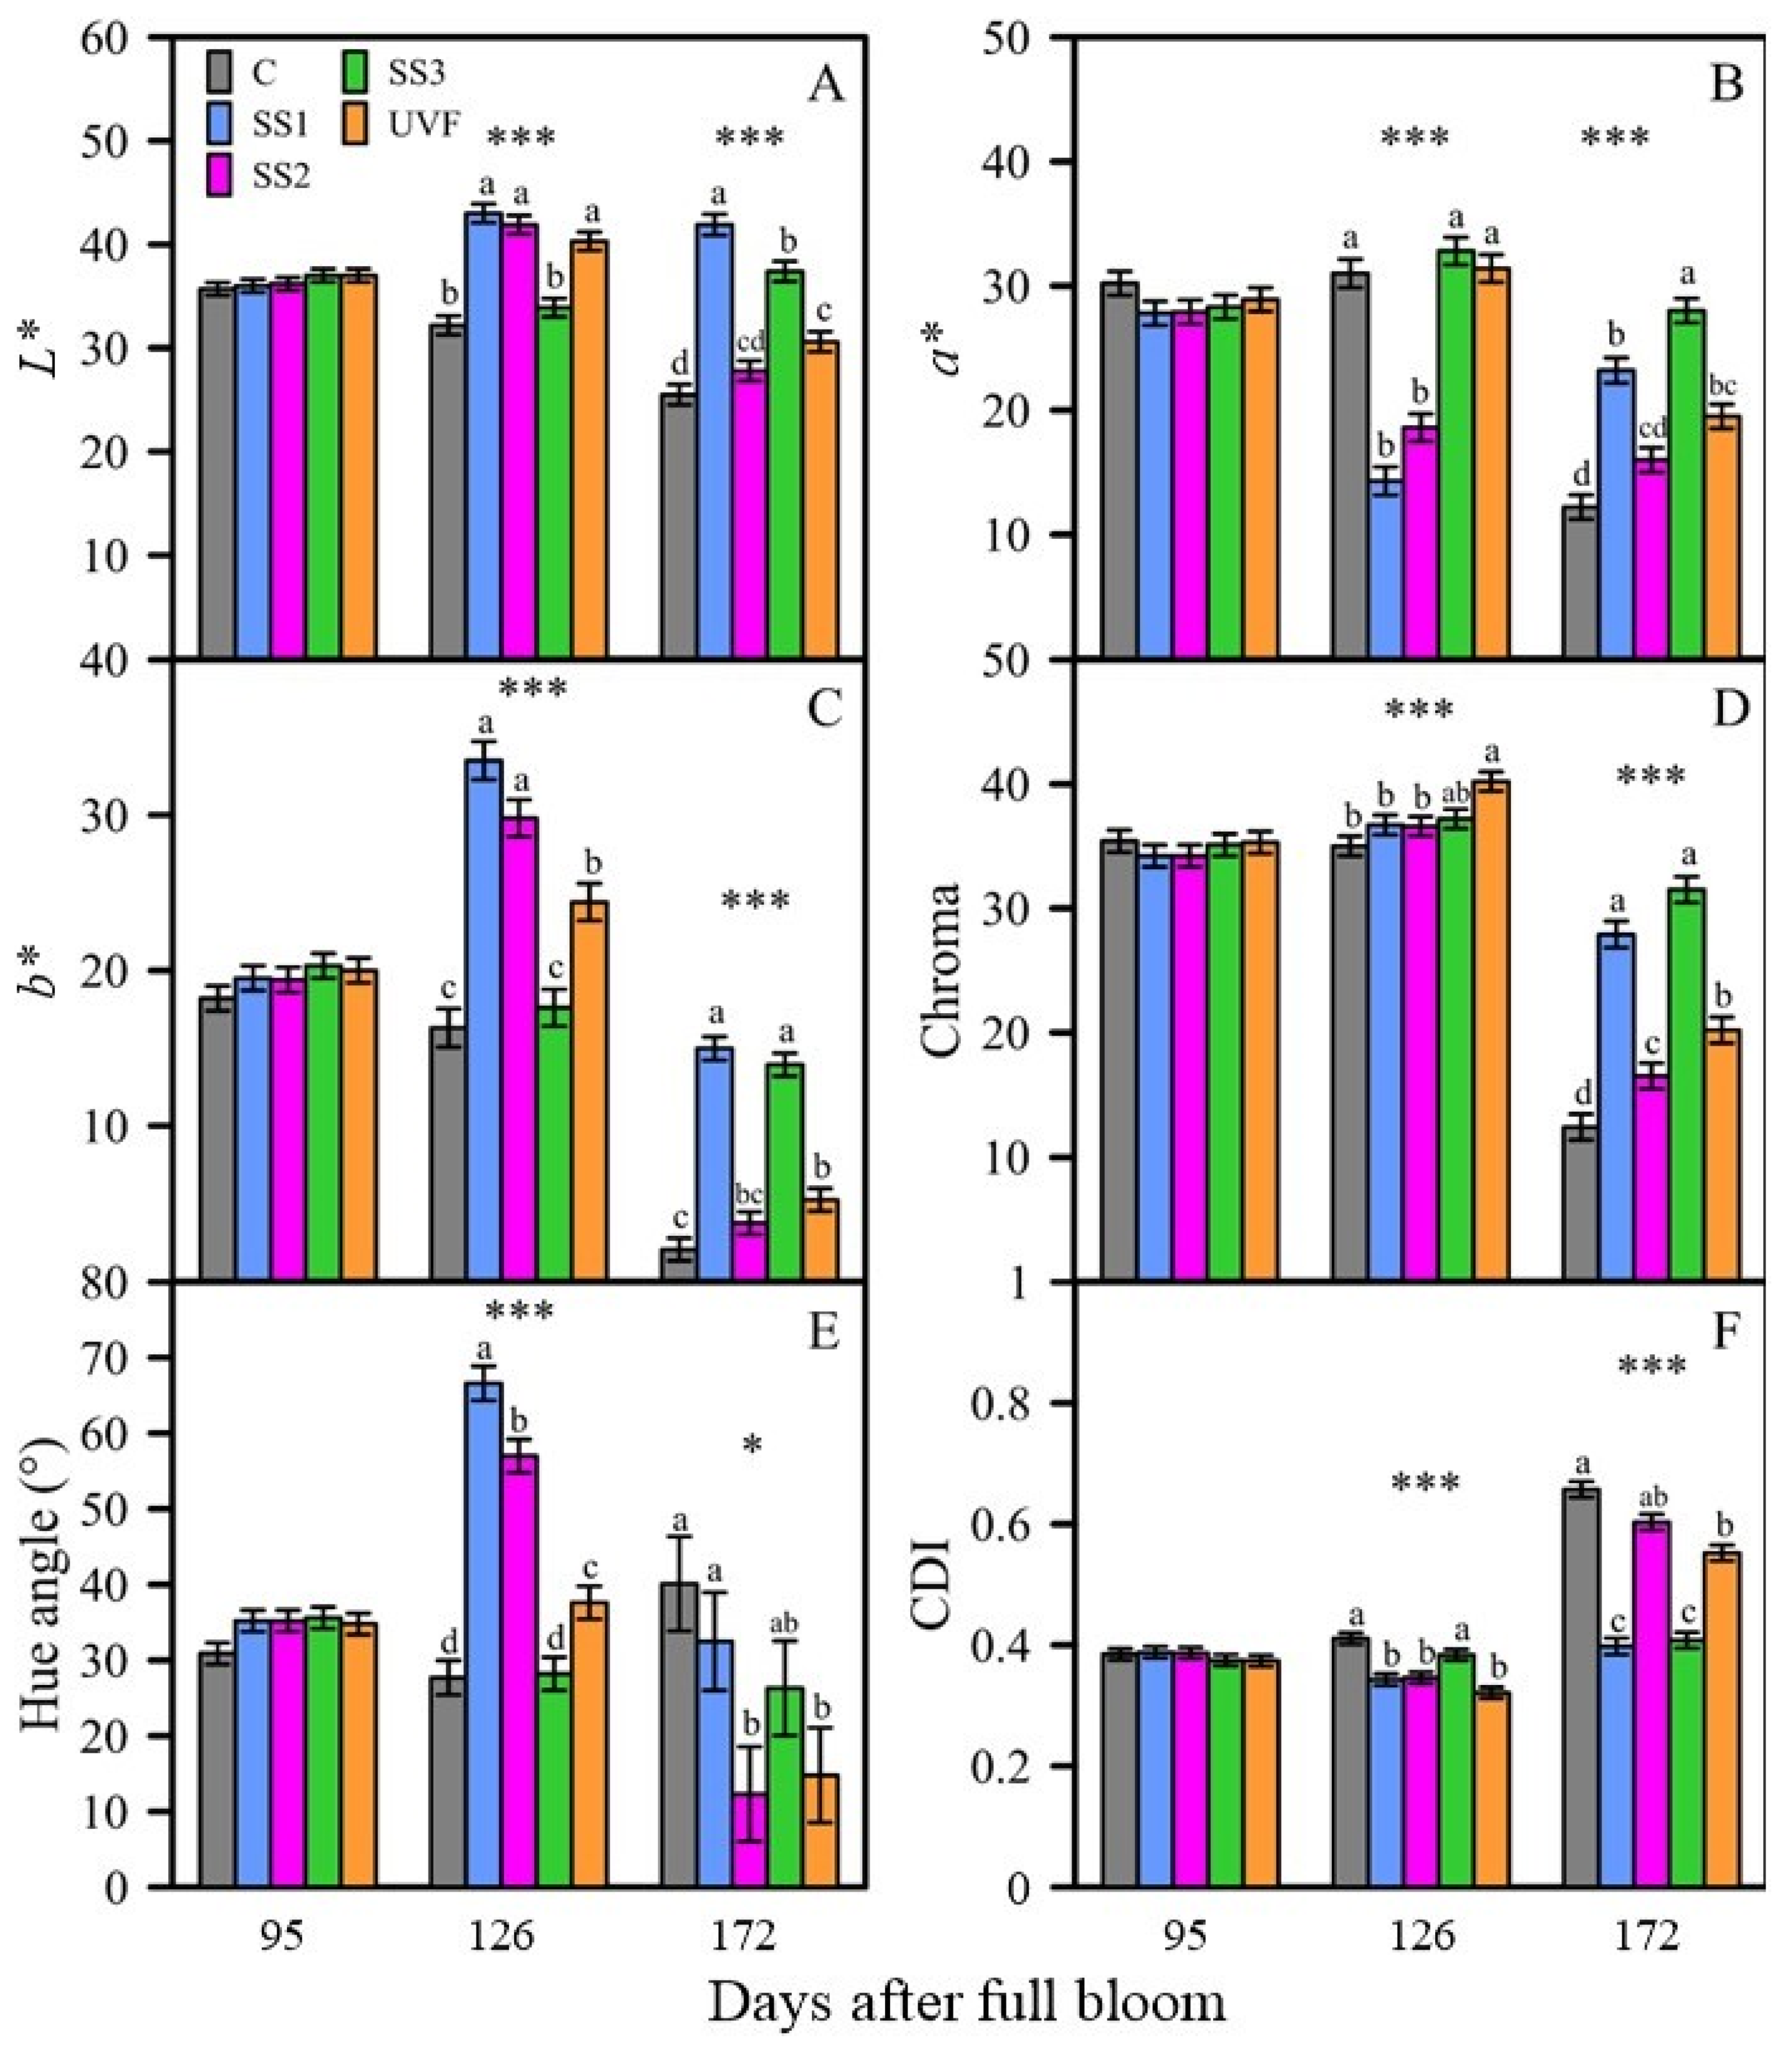
Peel Colour Development

Individual ANOVAs for each colour parameter showed no differences between treatments at the beginning of the experiment, but significant differences were evident for all parameters thereafter (Figure 5).
The control treatment showed that the lightness of the fruit peel decreased with maturation while being fully exposed to sunlight (Figure 5A). With progression of the experiment, a pattern of increasing L* value after a period of shading from direct sunlight was evident. At 126 DAFB, SS1 and SS2 treated fruit had higher L* values (43.0 and 41.9, respectively) in comparison to 95 DAFB (36.0 and 36.2, respectively). In contrast, the fully exposed control and SS3 fruits reduced their L* values between 95 DAFB (35.7 and 37.0, respectively) and 126 DAFB (32.2 and 33.9, respectively) to significantly higher values than those of the fully exposed control and SS3 fruit. Furthermore, after removing the shade umbrellas from SS2 fruit and installing them on SS3 fruit at 126 DAFB, the respective values of L* decreased (27.8) and increased (37.4). At harvest, SS2 was not significantly different from the control (p > 0.05).
The fruit under the UVF treatment behaved differently, initially increasing in L* value alongside the shaded SS1 and SS2 fruit, but then decreased by harvest to be significantly different from the other shaded treatments (SS1 and SS3).
Redness of the fruit peel decreased naturally with maturation, as shown by the control (Figure 5B). With shading from direct sunlight, there was initially a clear pattern of decreasing redness of the fruit peel. SS1 and SS2 treatments dropped dramatically between 95 DAFB (27.8 and 27.9, respectively) and 126 DAFB (14.3 and 18.6, respectively), whereas values of the fully exposed treatments (control and SS3) remained relatively high. However, by harvest this pattern had reversed, evidenced by the SS1 and SS3 shaded treatments displaying significantly higher a* values (23.2 and 28.0, respectively) compared to the fully exposed control and SS2 treatments (12.2 and 16.0, respectively; p < 0.05).
Initially, the redness of UVF-treated fruit remained similar at 126 DAFB to that of the fully exposed control and SS3 fruit (p > 0.05). At harvest, the a* value had decreased, as with the fully exposed treatments (control and SS2), but remained significantly higher (redder) than the control (p < 0.05).
The yellowness of the fruit peel of the control fruit decreased at each measurement point, but most noticeably between 126 DAFB (16.3) and harvest at 172 DAFB (2.1), when the b* value dropped dramatically (Figure 5C). The fruit peel tended to be more yellow when being shading from direct sunlight. Shaded fruit had significantly higher b* values than fully exposed fruit at 126 DAFB and at harvest (p < 0.05).
The peel of UVF-treated fruit initially increased in yellowness between 17 January and 17 February to sit between and significantly differ from the two statistical groups of shaded and fully exposed treatments (p < 0.05). By harvest, the b* value of UVF fruit dropped but remained significantly higher than that of the control fruit and lower than that of the shaded fruit (SS1 and SS3).
The fully exposed control treatment showed little change in chroma between 95 DAFB (35.4) and 126 DAFB (35.0) but then dropped considerably by harvest (12.4; Figure 5D). Shading from direct sunlight did not display any effect on chroma at 126 DAFB, with SS1 and SS2 treatments not being significantly different from control and SS3 treatments (p > 0.05). However, by harvest the shaded treatments SS1 (27.9) and SS3 (31.5) were significantly higher in chroma value compared to the fully exposed control (12.4) and SS2 (16.5; p < 0.001).
The peel of fruit under the UVF treatment had significantly higher chroma values than exposed fruit at 126 DAFB and at harvest (p < 0.05), although at harvest this treatment’s chroma value was significantly lower than that of shaded fruit (p < 0.05).
From the beginning of the study until harvest, hue angle overall increased slightly for the control fruit (Figure 5E). Between 95 and 126 DAFB, SS1 and SS2 fruit’s hue angle increased (to 66.6° and 57.0°, respectively) to be significantly higher than that of the fully exposed control (27.7°) and SS3 (28.2°) fruit at 126 DAFB (p < 0.05). At harvest, no clear pattern was evident between the shaded and exposed treatments, with the control treatment having a similar hue angle to SS1 and SS3.
The hue angle of the UVF treatment, as with its b* values, was significantly different from and sat between the statistical groups of shaded and exposed treatments at 126 DAFB (p < 0.05). However, by harvest the UVF-treated fruit had similar hue angle values to the exposed SS2 and shaded SS3 treatments (p > 0.05).
The progression of the fully exposed control treatment showed a slight increase in CDI between 95 DAFB (0.385) and 126 DAFB (0.411) and then a large increase by harvest (0.657; Figure 5F). At 126 DAFB, shaded treatments SS1 (0.343) and SS2 (0.346) displayed significantly lower CDI values in comparison to the sun-exposed C (0.411) and SS3 treatments (0.384; p < 0.05). This pattern was also evident at harvest, with the exposed control (0.67) and SS2 (0.603) treatments having significantly higher CDI values than the shaded SS1 (0.398) and SS3 treatments (0.408; p < 0.05).
The CDI value of UVF-treated fruit initially grouped with that of the shaded fruit at 126 DAFB (0.321) but then increased (0.552) to be similar to that of the exposed SS2 (0.603) at harvest (p > 0.05).

Harvest Fruit Quality

There were significant differences in some aspects of harvest fruit quality but not others. The SS2 treatment had the highest degree of sunburn damage severity (1.2) and it was significantly higher than that of the fully shaded SS1 treatment (p < 0.05; Table 4). In terms of SSC, the control (15.4 °Brix) and UVF (15.9 °Brix) treatments achieved the highest levels. The SS1 and SS3 treatments, which were shaded from 127 DAFB until harvest, recorded the lowest SSC values (14.3 and 14.2 °Brix, respectively; p < 0.001). Starch degradation was accelerated under the UVF treatment (4.0) compared to the shaded SS1 treatment (2.8; p < 0.05). There were no significant differences between treatment means for FD, FF and DMC, although it was noted that UVF-treated fruit had the highest values of FF and DMC.

4. Discussion

In the first experiment, we saw only a positive correlation between light exposure and canopy height but no correlation with movement from the canopy interior to the exterior. Most literature on the topic will report higher levels of light exposure in the outer portions of the canopy. This was not the case in our study. Hamadziripi et al. [27] found light levels increased almost 30-fold for the outer canopy compared to the inner canopy of Starking apple trees. Our result was likely due to the trees having a narrow canopy extending approximately 50 cm out from the central leader into the interrow which, as suggested by the results, did not allow for enough variation in fruit light exposure on the horizontal plane. This result was corroborated by a lack of positive correlation between horizontal shift and total red colour coverage, despite a weakly positive correlation between fruit light exposure and total red colour coverage.
The contrasting effects of fruit position on dark- and light-red colour coverage were likely due to a proportional change in relation to the total red colour coverage. Total red colour coverage remained the same regardless of fruit position, but the ratio of dark- to light-red colour changed depending on the fruit position. This was also true in response to light exposure, with dark red increasing and light red decreasing, but the total red colour coverage also increased with increasing light exposure. In fact, out of the fruit position parameters, only fruit height (Z) correlated positively with both light exposure and dark-red coverage, demonstrating the positive response of ANABP 0 colour to light exposure. A previous study of this cultivar corroborates these results and found increased dark-red colour coverage in trees grown on a less vigorous rootstock with a more open canopy, allowing for better light penetration [28].
The pattern of change of the objective colour parameters associated with desirable colour development in ANABP 01 was less focused on an increase in red colour and more on an increase in colour darkness. This was evidenced by the control treatment, which displayed decreasing a* and increasing hue angle values in the months leading up to harvest. An appropriate increase in CDI between 127 DAFB and harvest demonstrated the potential use of such an index to predict colour-based fruit maturity. Scalisi et al. [24] used a similar CDI based on hue angle in a study on peach and nectarine to predict harvest maturity; however, this specific CDI would not work with darker coloured fruits such as ANABP 01 due to the different behaviour of the colour parameters.
While not clearly evident in the presented colour parameter data, it was visually noted that the UVF-treated fruit developed a yellow–orange hue that enveloped all of the foreground colour. There are two possible explanations for this response; however, at this stage it is difficult to distinguish the predominant factor. Firstly, this could be an indication of the importance of UV radiation in the development of desirable red to dark-red colour in this apple cultivar. Arakawa et al. [13] previously demonstrated that UV-B light works synergistically with white (visible) light in the stimulation of anthocyanin production in apple peel. Secondly, while not significantly different from the control treatment, the slight increase in the maximum FST of UVF fruit during extreme heat periods—possibly due to a greenhouse effect—could have caused the developed red pigments to degrade. Anthocyanin biosynthesis and degradation occur simultaneously during apple fruit development and high temperatures are known to downregulate the pathways involved in its synthesis, resulting in an overall reduction in anthocyanins [29,30]. A similar response has been observed at the Tatura SmartFarm in the blush pear ANP-0534 [31].
An unexpected result from the first experiment was the lack of correlation between sunburn damage severity and fPARt. This could be explained by the La Niña weather pattern that occurred in Australia from mid-2020 until late 2022, bringing reduced average maximum temperatures to the region. Data recorded by a weather station located in a nearby block of pears showed a rapidly decreasing number of days over 35 and 40 °C from the 2018–2019 season until the 2020–2021 season (Table 5). Fourteen sample fruit from the first experiment were lost due to bird damage, resulting in a total of 94 fruit available at harvest for fruit quality analysis. Of these, 13 fruit showed signs of sunburn damage (13.8%), which is likely too low a subsample number from which to draw correlations. The same experiment performed in a different year with a different weather pattern may yield other results.
Acclimation of fruit to high light and temperature levels was clearly demonstrated in the second experiment, where SS2 treated fruit showed higher levels of sunburn damage severity. The development of sunburn damage in response to the sudden exposure of previously shaded fruit to sunlight was first described by Brooks and Fisher [32]. They compared fruit growing in an exposed position in the canopy to fruit that were once shaded and then fully exposed and reported no sunburn damage to fruit that were always exposed, but severe sunburn damage occurred on the suddenly exposed fruit. More recent classification of sunburn damage describes photo-oxidative sunburn (PS), which develops on suddenly exposed apple fruit as a white bleached area. It was demonstrated that this type of sunburn was not mitigated by the removal of UV-A or UV-B radiation, and it was therefore suggested that the primary induction factor of PS is PAR [33]. In support of this, it was visually noted that PS was the predominant type of sunburn damage affecting the SS2 treated fruit, but PS was not noted in the UVF-treated fruit.
As supported by the second experiment, higher levels of SSC in apple fruit exposed to sunlight is commonly, but not always, reported [10,34,35].
Modern-day and future orchard designs and management practices strive to optimise canopy light penetration and fruit light exposure. Doing so is beneficial from the perspective of improving colour development and, in most cases, soluble solids accumulation, but not so advantageous from the perspective of susceptibility to sunburn damage, as further demonstrated by the results of this study. In the context of a changing climate with increasing frequency of extreme heat events, this is an important consideration when planting a new apple orchard and installing permanent orchard management infrastructure (i.e., evaporative cooling system, overhead shade netting). In comparison to sunburn mitigation through management practices such as shade netting and evaporative cooling [36,37], the benefits of smart orchard design to form a canopy light environment which minimises sunburn risk while maintaining fruit quality is much less well understood and warrants exploration. The push for increasingly dwarfing rootstocks in recent decades has indeed improved canopy light penetration but increases the risk of sunburn damage [38]. This, in combination with the increasing adoption of the narrow two-dimensional fruiting wall growing system and preharvest pneumatic defoliation, further increase the risk. Further exploration of different orchard design systems (i.e., row orientation, tree architecture) and management techniques (i.e., pruning, timing of defoliation) that allow for adequate fruit light exposure yet provide protection against harsh afternoon weather conditions would be advantageous. More research is needed on this cultivar to properly distinguish how its internal fruit quality level responds to fruit position and light exposure.

5. Conclusions

The results from these experiments support the enhancement of fruit light exposure throughout apple growth to improve overall fruit quality. The development of colour in the dark-red apple ANABP 01 was highly responsive to factors of fruit position, intensity and quality of light exposure. The best-coloured fruit were exposed to higher quantities of PAR, exposed to both PAR and UV radiation simultaneously and located higher in the tree canopy. Fruit that were fully exposed to PAR and achieved better colour development also displayed higher FST and sunburn damage severity. The effects on internal fruit quality parameters and sunburn damage severity were variable between the two experiments; however, exposing fruit to sunlight earlier in the season may lessen, to a degree, the severity of sunburn damage through acclimation. As long as the tree canopy is well-managed to allow for appropriate early season light exposure, this cultivar would perform well in growing regions subjected to a high light environment.

Author Contributions

Conceptualization, A.S. and M.P.; methodology, A.S., M.S.I. and M.P.; software, A.S. and M.S.I.; formal analysis, M.P. and A.S.; resources, A.S. and M.P.; data curation, M.P., A.S. and M.S.I.; writing—original draft preparation, M.P.; writing—review and editing, M.P., A.S., M.S.I. and I.G.; visualization, M.P.; supervision, I.G.; project administration, A.S. and I.G.; funding acquisition, I.G. All authors have read and agreed to the published version of the manuscript.

Funding

The project AP22004 “Optimising apple production systems” is a component of the apple and pear industry’s PIPS 4 Profit program of research and development funded by Hort Innovation, using the Hort Innovation Apple and Pear research and development levy, contributions from the Australian Government and co-investment from Agriculture Victoria (10224). Hort Innovation is the grower-owned, not-for-profit research and development corporation for Australian horticulture.

Data Availability Statement

The raw data supporting the conclusions of this article will be made available by the authors on request.

Acknowledgments

The authors acknowledge the funding organisations of this study.

Conflicts of Interest

The authors declare no conflicts of interest.

References

  1. Cain, J.C. Effects of Mechanical Pruning of Apple Hedgerows with a Slotting Saw on Light Penetration and Fruiting. J. Am. Soc. Hortic. Sci. 1971, 95, 664–667. [Google Scholar] [CrossRef]
  2. Corelli-Grappadelli, L.; Sansavini, S. Light interception and photosynthesis related to planting density and canopy management in apple. Acta Hortic. 1989, 243, 159–174. [Google Scholar] [CrossRef]
  3. Chen, Z.; Yu, L.; Liu, W.; Zhang, J.; Wang, N.; Chen, X. Research progress of fruit color development in apple (Malus domestica Borkh.). Plant Physiol. Biochem. 2021, 162, 267–279. [Google Scholar] [CrossRef] [PubMed]
  4. Musacchi, S.; Serra, S. Apple fruit quality: Overview on pre-harvest factors. Sci. Hortic. 2018, 234, 409–430. [Google Scholar] [CrossRef]
  5. Steyn, N. Red Colour Improvement in Apple Fruit (Malus domestica Borkh.). Master’s Thesis, Stellenbosch University, Stellenbosch, South Africa, 2020. [Google Scholar]
  6. Jackson, J.E. Light Interception and Utilization by Orchard Systems. In Horticultural Reviews; Janick, J., Ed.; The AVI Publishing Company: Westport, CT, USA, 1980; pp. 208–267. [Google Scholar] [CrossRef]
  7. Robinson, T.; Seeley, E.J.; Barritt, B.H. Effect of Light Environment and Spur Age on ‘Delicious’ Apple Fruit Size and Quality. J. Am. Soc. Hortic. Sci. 1983, 108, 855–861. [Google Scholar] [CrossRef]
  8. Zhang, J.; Serra, S.; Leisso, R.; Musacchi, S. Effect of light microclimate on the quality of ‘d’Anjou’ pears in mature open-centre tree architecture. Biosyst. Eng. 2016, 141, 1–11. [Google Scholar] [CrossRef]
  9. Bhusal, N.; Bhusal, S.J.; Han, S.G.; Yoon, T.M. Canopy light distribution and fruit quality in excessive tall spindle apple production system. Acta Hortic. 2019, 1261, 209–217. [Google Scholar] [CrossRef]
  10. Kviklys, D.; Viškelis, J.; Liaudanskas, M.; Janulis, V.; Laužikė, K.; Samuolienė, G.; Uselis, N.; Lanauskas, J. Apple Fruit Growth and Quality Depend on the Position in Tree Canopy. Plants 2022, 11, 196. [Google Scholar] [CrossRef]
  11. Ben-Yehudah, G.; Korchinsky, R.; Redel, G.; Ovadya, R.; Oren-Shamir, M.; Cohen, Y. Colour accumulation patterns and the anthocyanin biosynthetic pathway in ‘Red Delicious’ apple variants. J. Hortic. Sci. Biotechnol. 2005, 80, 187–192. [Google Scholar] [CrossRef]
  12. Saure, M.C. External control of anthocyanin formation in apple. Sci. Hortic. 1990, 42, 181–218. [Google Scholar] [CrossRef]
  13. Arakawa, O.; Hori, Y.; Ogata, R. Relative effectiveness and interaction of ultraviolet-B, red and blue light in anthocyanin synthesis of apple fruit. Physiol. Plant. 1985, 64, 323–327. [Google Scholar] [CrossRef]
  14. Gouws, A.; Steyn, W.J. The effect of temperature, region and season on red colour development in apple peel under constant irradiance. Sci. Hortic. 2014, 173, 79–85. [Google Scholar] [CrossRef]
  15. Gurnsey, S.; Lawes, G. Improving Apple Colour; Tree Fruit Research and Extension Centre, Washington State University: Wenatchee, WA, USA, 1999. [Google Scholar]
  16. Curry, E.A. Temperatures for optimum anthocyanin accumulation in apple tissue. J. Hortic. Sci. 1997, 72, 723–729. [Google Scholar] [CrossRef]
  17. Faragher, J.D. Temperature regulation of anthocyanin accumulation in apple skin. J. Exp. Bot. 1983, 34, 1291–1298. [Google Scholar] [CrossRef]
  18. McClymont, L.; Goodwin, I.; Turpin, S.; Darbyshire, R. Fruit surface temperature of red-blushed pear: Threshold for sunburn damage. N. Z. J. Crop Hortic. Sci. 2016, 44, 262–273. [Google Scholar] [CrossRef]
  19. Schrader, L.E.; Zhang, J.; Duplaga, W.K. Two Types of Sunburn in Apple Caused by High Fruit Surface (Peel) Temperature. Plant Health Prog. 2001, 2, 3. [Google Scholar] [CrossRef]
  20. Department of Primary Industries and Regional Development, Government of Western Australia, Australia. Premium Grade ANABP-01 Quality Specification—2021 Season; Department of Primary Industries and Regional Development, Government of Western Australia, Australia: Perth, Australia, 2021. [Google Scholar]
  21. Matsuoka, K. Anthocyanins in Apple Fruit and Their Regulation for Health Benefits. In Flavonoids—A Coloring Model for Cheering up Life; Badria, F.A., Ananga, A., Eds.; IntechOpen: London, UK, 2020. [Google Scholar] [CrossRef]
  22. ISO/CIE 11664-4:2019; CIE 1976 L*a*b* Colour Space. International Organisation for Standardisation: Geneva, Switzerland, 1976.
  23. Islam, M.S.; Scalisi, A.; O’Connell, M.G.; Morton, P.; Scheding, S.; Underwood, J.; Goodwin, I. A Ground-based Platform for Reliable Estimates of Fruit Number, Size, and Color in Stone Fruit Orchards. HortTechnology 2022, 32, 510–522. [Google Scholar] [CrossRef]
  24. Scalisi, A.; O’Connell, M.G.; Islam, M.S.; Goodwin, I. A Fruit Colour Development Index (CDI) to Support Harvest Time Decisions in Peach and Nectarine Orchards. Horticulturae 2022, 8, 459. [Google Scholar] [CrossRef]
  25. Scalisi, A.; McClymont, L.; Peavey, M.; Morton, P.; Scheding, S.; Underwood, J.; Goodwin, I. Using Green Atlas Cartographer to investigate orchard-specific relationships between tree geometry, fruit number, fruit clustering, fruit size and fruit colour in commercial apples and pears. Acta Hortic. 2023, 1360, 203–210. [Google Scholar] [CrossRef]
  26. Scalisi, A.; McClymont, L.; Peavey, M.; Morton, P.; Scheding, S.; Underwood, J.; Goodwin, I. Detecting, mapping and digitising canopy geometry, fruit number and peel colour in pear trees with different architecture. Sci. Hortic. 2024, 326, 112737. [Google Scholar] [CrossRef]
  27. Hamadziripi, E.T.; Theron, K.I.; Muller, M.; Steyn, W.J. Apple Compositional and Peel Color Differences Resulting from Canopy Microclimate Affect Consumer Preference for Eating Quality and Appearance. HortScience 2014, 49, 384–392. [Google Scholar] [CrossRef]
  28. Peavey, M.; Scalisi, A.; McClymont, L.; Goodwin, I. Light interception, productive performance and red colour coverage of ‘ANABP 01’ apple trees grown on different rootstocks in a multidirectional orchard. Acta Hortic. 2023, 1366, 103–110. [Google Scholar] [CrossRef]
  29. Lin-Wang, K.; Micheletti, D.; Palmer, J.; Volz, R.; Lozano, L.; Espley, R.; Hellens, R.P.; Chagnè, D.; Rowan, D.D.; Troggio, M.; et al. High temperature reduces apple fruit colour via modulation of the anthocyanin regulatory complex. Plant Cell Environ. 2011, 34, 1176–1190. [Google Scholar] [CrossRef]
  30. Steyn, W.J.; Wand, S.J.E.; Jacobs, G.; Rosecrance, R.C.; Roberts, S.C. Evidence for a photoprotective function of low-temperature-induced anthocyanin accumulation in apple and pear peel. Physiol. Plant. 2009, 136, 461–472. [Google Scholar] [CrossRef]
  31. Visscher, I.; Peavey, M.; McClymont, L.; Goodwin, I.; Chandra, S. The effects of light exposure on colour development in the blush pear ‘ANP-0534’. Acta Hortic. 2021, 1303, 529–536. [Google Scholar] [CrossRef]
  32. Brooks, C.; Fisher, D.F. Some high-temperature effects in apples: Contrast in the two sides of an apple. J. Agric. Res. 1926, 32, 1–16. [Google Scholar]
  33. Felicetti, D.A.; Schrader, L.E. Photooxidative sunburn of apples: Characterization of a third type of apple sunburn. Int. J. Fruit Sci. 2008, 8, 160–172. [Google Scholar] [CrossRef]
  34. Nilsson, T.; Gustavsson, K.E. Postharvest physiology of “Aroma” apples in relation to position on the tree. Postharvest Biol. Technol. 2007, 43, 36–46. [Google Scholar] [CrossRef]
  35. Solomakhin, A.; Blanke, M.M. Can coloured hailnets improve taste (sugar, sugar: Acid ratio), consumer appeal (colouration) and nutritional value (anthocyanin, vitamin C) of apple fruit? LWT—Food Sci. Technol. 2010, 43, 1277–1284. [Google Scholar] [CrossRef]
  36. Goodwin, I.; McClymont, L.; Turpin, S.; Darbyshire, R. Effectiveness of netting in decreasing fruit surface temperature and sunburn damage of red-blushed pear. N. Z. J. Crop Hortic. Sci. 2018, 46, 334–345. [Google Scholar] [CrossRef]
  37. Wünsche, J.N.; McGhie, T.; Bown, J.; Ferguson, I.; Woolf, A. Sunburn on Apples—Causes and Control Mechanisms. Acta Hortic. 2004, 636, 631–636. [Google Scholar] [CrossRef]
  38. Racskó, J.; Szabó, Z.; Miller, D.D.; Soltész, M.; Nyéki, J. Sunburn incidence of apples is affected by rootstocks and fruit position within the canopy but not by fruit position on the cluster. Int. J. Hortic. Sci. 2009, 15, 45–51. [Google Scholar] [CrossRef]
Figure 1. Post-harvest visual classification of sunburn damage in ANABP 01 apple fruit.
Horticulturae 10 00725 g001
Figure 2. Boxplots for (A) X-, (B) Y- and (C) Z-coordinates (distance from the trunk) and (D) the fraction of transmitted photosynthetically active radiation (fPARi). Horizontal lines show sample medians. Lower whiskers show the interquartile range. Triangles show outliers.
Horticulturae 10 00725 g002
Figure 3. Recorded air temperature and maximum FST progression of sample fruit under different light exposure treatments from 110 to 152 DAFB. The grey dotted line represents the changeover day for SS2 and SS3 treatments. The yellow area represents the minimum one-hour threshold region for sunburn browning development and the brown line represents the 10-min threshold for sunburn necrosis according to Schrader et al. (2001) [19].
Horticulturae 10 00725 g003
Figure 4. Recorded air temperature and maximum sample FST of sample fruit under different light exposure treatments from 123 to 124 DAFB. The yellow area represents the minimum one-hour threshold region for sunburn browning development (46.1–48.9 °C) and the brown line represents the 10-min threshold for sunburn necrosis (52.2 ± 1 °C) according to Schrader et al. (2001) [19].
Horticulturae 10 00725 g004
Figure 5. ANOVA results of ANABP 01 apple peel colour parameters L* (A), a* (B), b* (C), chroma (D), hue angle (E) and Colour Development Index (CDI, (F)) for measurements performed at 95, 126 and 172 DAFB. Error bars represent the standard error of the means and letters represent Tukey’s honestly significant differences. * = p < 0.05, ** = p < 0.01, *** = p < 0.001.
Horticulturae 10 00725 g005
Table 1. The five light exposure treatments applied to sample fruit. Cells with one asterisk (*) indicate when the fruit were covered with aluminium umbrellas. Cells with two asterisks (**) indicate when fruit were covered with the longpass UV filter. Cells with en dashes (–) indicate when sample fruit were fully exposed to sunlight.
Light Exposure TreatmentTime Period
95–126 DAFB127–172 DAFB
SS1**
SS2*
SS3*
UVF****
Control
Table 2. Pearson’s r correlation coefficients and significant effects of XYZ-coordinates on light exposure levels (fPARt), and of XYZ-coordinates and fPARt on fruit quality parameters. Significant Pearson’s r < −0.230 or >0.230.
XYZfPARt
fPARt0.0540.0930.607 ***
Dark-red coverage−0.293 **−0.373 ***0.266 *0.286 **
Light-red coverage0.288 **0.389 ***−0.252 *−0.273 **
Total red coverage−0.1310.0150.1930.207 *
L*0.286 **0.350 **−0.274 *−0.260 *
a*0.1980.420 ***−0.141−0.175
b*0.271 *0.329 **−0.278 **−0.260 *
Hue angle (°)0.107−0.068−0.196−0.106
Chroma0.243 *0.417 ***−0.191−0.211 *
CDI−0.266 *−0.411 ***0.234 *0.243 *
Sunburn damage severity−0.075−0.047−0.1090.164
Fruit diameter−0.099−0.1450.000−0.250 *
SSC−0.285 **−0.167−0.0400.097
FF0.0990.1670.379 ***0.371 ***
SPI−0.268 *−0.185−0.211−0.107
* p < 0.05, ** p < 0.01, *** p < 0.001. CDI = Colour Development Index; SSC = soluble solids concentration; FF = flesh firmness; SPI = starch pattern index.
Table 3. Estimated marginal means of the treatment samples for the maximum and minimum daily FST during the two periods between 95 and 126 DAFB and 127 and 172 DAFB. Standard errors of the means (SE) are reported. Letter separation by Tukey’s honestly significant differences.
Light Exposure Treatment95–126 DAFB127–172 DAFB
Mean Max Daily FST (°C)SEMean Min Daily FST (°C)SEMean Max Daily FST (°C)SEMean Min Daily FST (°C)SE
SS133.3 b1.114.10.831.9 b0.915.20.5
SS233.2 b1.114.10.838.8 a0.314.10.6
SS342.4 a1.313.30.730.6 b0.715.10.5
UVF43.7 a1.513.70.741.0 a1.414.50.6
Control41.7 a1.313.50.840.7 a1.414.10.6
p<0.0010.934<0.0010.474
SS1 = shaded from 95 DAFB until harvest at 172 DAFB; SS2 = shaded from 95–126 DAFB; SS3 = shaded from 126 DAFB until harvest; UVF = ultraviolet radiation filtered out from 95 DAFB until harvest; control = fully exposed to sunlight.
Table 4. ANABP 01 apple fruit harvest fruit quality data collected at harvest for the different light exposure treatments. Standard errors of the means (SE) are reported. Letter separation by Tukey’s honestly significant differences.
Light Exposure TreatmentFD (mm)Sunburn
Damage
Severity (0–5)
FF (N)SSC (°Brix)DMC (%)SPI
MeanSEMeanSEMeanSEMeanSEMeanSEMeanSE
SS182.21.80.0 b0.083.81.514.3 b0.317.90.42.8 b0.3
SS282.21.01.2 a0.583.11.815.1 ab0.317.30.43.3 ab0.3
SS382.81.30.3 ab0.385.31.714.2 b0.217.20.33.1 ab0.2
UVF81.11.21.0 ab0.387.82.415.9 a0.218.50.34.0 a0.2
Control79.61.30.2 ab0.185.52.015.4 a0.417.90.53.4 ab0.3
p0.4540.0230.478<0.0010.1390.015
FD = fruit diameter; FF = flesh firmness; SSC = soluble solids concentration; DMC = dry matter concentration; SPI = starch pattern index.
Table 5. Recorded number of days with air temperature (°C) at different levels at the Tatura SmartFarm for the 2018–2019, 2019–2020, 2020–2021 and 2021–2022 growing seasons.
SeasonNumber of Days
30.0–31.9 °C32.0–34.9 °C35–39.9 °C>40.0 °C
2018–20191926246
2019–20202034125
2020–20212319151
2021–20223024111
Disclaimer/Publisher’s Note: The statements, opinions and data contained in all publications are solely those of the individual author(s) and contributor(s) and not of MDPI and/or the editor(s). MDPI and/or the editor(s) disclaim responsibility for any injury to people or property resulting from any ideas, methods, instructions or products referred to in the content.

