Article

Does the Daily Light Integral Influence the Sowing Density of Tomato Plug Seedlings in a Controlled Environment?

1
Key Laboratory of Ministry of Education of Modern Agricultural Equipment and Technology, Jiangsu University, Zhenjiang 212013, China
2
College of Agricultural Engineering, Jiangsu University, Zhenjiang 212013, China
*
Author to whom correspondence should be addressed.
Horticulturae 2024, 10(7), 730; https://doi.org/10.3390/horticulturae10070730
Submission received: 14 June 2024 / Revised: 6 July 2024 / Accepted: 10 July 2024 / Published: 11 July 2024
(This article belongs to the Special Issue Soilless Culture and Hydroponics in Closed Systems)

Abstract

:
To achieve high-density tomato seedlings in a plant factory with artificial lighting, tomatoes (Solanum lycopersicum Mill. cv. “Zhongza NO.9”) were used as the experimental material. This study expected to analyze the effects of light intensity (150, 200, 250, and 300 μmol·m−2·s−1) and light time (12 and 14 h), as well as daily light integral (DLI, 10.80, 12.60, and 12.96 mol·m−2·d−1) and sowing density (50, 72, and 105 holes per tray), on seedling quality. The results indicated that biomass accumulation, seedling quality, and energy use efficiency of seedlings significantly improved with an increase in DLI. At a DLI of 12.96 mol·m−2·d−1, seedlings sown at a density of 72 holes per tray exhibited comparable growth characteristics and biomass accumulation to those sown at 50 holes per tray. However, under lower DLIs, seedlings at 50 holes per tray displayed superior growth morphology and seedling quality compared to those at 72 holes per tray. This indicates that increasing the DLI can partially mitigate the negative effects of higher sowing density on seedling quality. Light use efficiency (LUE) and energy use efficiency (EUE) were not significantly different between seedlings at 72 and 105 holes per tray but were higher than those at 50 holes per tray. Therefore, optimizing parameters such as DLI and sowing density can effectively enhance the seedling quality, spatial use efficiency, and light use efficiency in industrial seedling production. Based on the results of this study, a DLI of 12.96 mol·m−2·d−1 (achieved with a light intensity of 300 μmol·m−2·s−1 and a light time of 12 h) and sowing density of 72 holes per tray are recommended for cultivating high-quality tomato seedlings while reducing energy consumption.

1. Introduction

Currently, tomatoes are a widely cultivated vegetable crop globally. In 2020, China allocated 1.33 million hectares to tomato cultivation, yielding 65 million tons, which accounted for 22.0% and 34.7% of the global totals, respectively [1]. The ongoing expansion of tomato cultivation has stimulated the growth and development of the seedling market. The global demand for tomato seedlings is substantial, with China alone requiring 60 billion seedlings annually [1]. Due to the advantages of a short production cycle, high-quality, minimal environmental stress, and automated production, facility-based tomato seedling cultivation has emerged as the predominant method for tomato seedling production. Premium quality seedlings have excellent morphological and physiological traits, such as thick stems, uniform height, numerous healthy leaves, and well-developed roots [2]. They also have high chlorophyll content and optimal root–shoot ratio [3]. In contrast, substandard seedlings often show signs of poor growth conditions or health issues, such as thin stems, uneven height, fewer leaves, and poorly developed roots [4]. While high-quality seedlings need optimal environmental conditions, they are often grown in suboptimal environments in practical production. Therefore, regulating the seedling environment is beneficial for cultivating high-quality and vigorous seedlings.
Light serves as the primary driving force for plant growth and development, directly influencing seedling quality and fruit yield [5]. However, suboptimal conditions, such as insufficient sunlight in winter and spring, as well as intense sunlight in summer and autumn, can impede growth and compromise the seedling quality of the tomato [6]. Hence, optimizing the light environment for tomato seedlings is imperative to enhance seedling quality, shorten the seedling period, and decrease energy consumption. Artificial lighting in plant factories offers a significant improvement in seedling cultivation conditions, facilitating standardized, industrial, and intelligent seedling production. Nevertheless, challenges such as high energy consumption, substantial initial investment, and high operating costs hinder the widespread commercial application of these systems [7]. Current research endeavors focus on reducing the energy consumption in artificial lighting in plant factories and enhancing the light use efficiency of seedling systems. To mitigate lighting energy consumption in plant factories, increasing seedling sowing density to a certain extent can be effective. However, while increasing sowing density enhances spatial use efficiency, it may also lead to issues such as excessive seedling elongation.
Compared to traditional soil-based seedling cultivation, plug seedlings offer notable advantages such as time efficiency, labor savings, and suitability for long-distance transportation, rendering them indispensable for greenhouse tomato seedling production [8,9]. Therefore, plug trays have become essential equipment for tomato seedling cultivation [10]. Furthermore, the seedling quality of plug trays directly influences the subsequent crop yield and quality [11,12]. However, the seeding density of tomato seedlings is determined by the size of the plug trays; fewer holes result in larger volumes per hole, providing ample growth space and nutrients for the roots, which enhances biomass accumulation and significantly reduces transplant shock [13,14]. However, increasing hole volume also escalates the cost per seedling while diminishing space and light use efficiency [15,16]. In a plant factory with artificial lighting, the selection of plug tray size is pivotal for optimizing seedling efficiency, light use efficiency, and space use efficiency.
Current research on optimizing the light environment for tomato seedlings primarily focuses on light intensity, light time, and light quality within a controlled environment. However, there is a scarcity of studies exploring the influence of the daily light integral (DLI) and its interaction with sowing density on the seedling quality of the tomato [6]. Enhancing the DLI to boost the sowing density of tomato seedlings is essential for optimizing space and light use efficiency. However, it is imperative to examine whether increasing sowing density may cause seedling etiolation and diminish seedling quality, and if a higher DLI might reduce light use efficiency. These critical questions require a thorough investigation. This study delves into the effects of the DLI and sowing density on tomato seedling quality, with the aim of achieving high-density tomato seedlings in a plant factory with artificial lighting based on the optimal parameters for both the DLI and sowing density.

2. Materials and Methods

2.1. Materials and Sample Cultivation

Tomatoes (Solanum lycopersicum Mill.) cv. “Zhongza No.105” were used as the experimental material, with the seeds provided by the Institute of Vegetables and Flowers, Chinese Academy of Agricultural Sciences. The experiment was conducted in a plant factory with artificial lighting in the Key Laboratory of Modern Agricultural Equipment and Technology of the Ministry of Education at Jiangsu University (32.2° N, 119.5° E). Considering that standardized plug trays measuring 540 mm × 280 mm are commonly used for tomato seedling production in a plant factory with artificial lighting, we used such plug trays as the seeding containers. Tomato seeds were germinated, sown, and cultured in trays using a mixed substrate of peat, vermiculite, and perlite (3V:V:V). The environmental conditions in the plant factory during seed germination were strictly controlled with a temperature of (24 ± 1) °C and relative humidity of (70 ± 5)%, while the CO2 concentration was not regulated. The environmental conditions during the seedling stage were maintained at the day/night temperature of (24 ± 1) °C/(20 ± 1) °C, relative humidity of (60 ± 5)%/(70 ± 5)% and the CO2 concentration of (600 ± 50) μmol·mol−1 during the illumination period.

2.2. Experimental Design

Two groups of experiments were designed in this study, and a light emitting diode (LED) lamp (Beijing Shengyanggu Technology Co., Ltd., Beijing, China) with a red/blue ratio (R/B) of 1.2 was used as the light source (Figure 1). In the first experiment, the light intensity was set at 150 μmol·m−2·s−1, 200 μmol·m−2·s−1, 250 μmol·m−2·s−1, and 300 μmol·m−2·s−1, with the light time of 12 h d−1 and 14 h d−1. These treatments were designated as P150-H12, P150-H14, P200-H12, P200-H14, P250-H12, P250-H14, P300-H12, and P300-H14. Consequently, a total of six daily light integral (DLI) values (6.48, 7.56, 8.64, 10.08, 10.80, 12.60, 12.96, and 15.12 mol·m−2·d−1) were established, and there were three 72-hole seedling trays in each treatment.
At the end of the first experiment, three kinds of DLI (based on the results from the first experiment) and three kinds of sowing density (50, 72, and 105 holes per tray) were selected for the second experiment to investigate the interaction between the DLI and sowing density on the seedling quality of the tomato. These treatments were labeled as D1-K50, D1-K72, D1-K105, D2-K50, D2-K72, D2-K105, D3-K50, D3-K72, and D3-K105. Both designed experiments were replicated three times.
After the germination of tomato seeds, irrigation was performed using one-third of the concentration of the Japanese Yamazaki nutrient solution for tomatoes [17]. Following the expansion of the cotyledons, the concentration was increased to two-thirds. Upon the emergence of the first true leaf, irrigation was carried out every two days using the full standard concentration of the nutrient solution.

2.3. Analysis of the Growth

Twelve tomato seedlings were randomly selected from each treatment group to analyze growth. The plant height (the length from the base of the seedling stem to the apical growth point), stem diameter (the diameter measured at 1 cm below the cotyledon), leaf number (total number of true leaves), and leaf area (total area of true leaves) were measured. These measurements were conducted when the seedlings reached the four-leaf-one-heart stage, with units recorded as centimeters for plant height, millimeters for stem diameter, pieces for leaf number, and square centimeters for leaf area. The specific measurement and calculation methods were based on the approaches outlined by Song et al. [5] and Ma et al. [18].

2.4. Analysis of the Gas Exchange Parameters

Six fresh leaves were randomly selected from each treatment for the measurement of the gas exchange parameters. The gas exchange parameters of the leaves were measured 2–4 h after the onset of illumination, where the net photosynthetic rate, stomatal conductance, intercellular CO2 concentration, and transpiration rate were assessed using a portable photosynthesis measurement system (LI-6400XT, LI-COR Inc., Lincoln, NE, USA) equipped with a standard light source (LI-6400-02b). Within the leaf chamber, the settings were as follows: light intensity at 250 μmol·m−2·s−1, leaf temperature at 24 °C, CO2 concentration at 800 μmol·mol−1, and airflow rate at 500 μmol·s−1 [7,19].

2.5. Root Activity

Eight tomato seedlings were randomly selected from each treatment for the measurement of the root activity. The root activity of the tomato seedlings was determined using the triphenyl tetrazolium chloride (TTC) method for measuring dehydrogenase activity, following the specific measurement procedures outlined by Song et al. [5].

2.6. Analysis of Biomass Accumulation

Eight tomato seedlings were randomly selected from each treatment for biomass accumulation measurements. The shoot fresh weight and root fresh weight of the plant samples were measured using the electronic balance (ME204E, Mettler Toledo Technology Co., Ltd., Greifensee, Switzerland). Then, the plant samples were placed in an oven. After being deactivated at 105 °C for 3 h, the plant samples were dried at 80 °C until a constant weight was attained. The dry weight of each plant sample was recorded using the electronic balance. Total fresh weight was calculated as the sum of the shoot fresh weight and root fresh weight of the tomato seedlings, while total dry weight was the sum of the shoot dry weight and root dry weight.

2.7. Analysis of Seedling Quality

The seedling quality of the tomato was assessed using the root–shoot ratio (RSR) and the healthy index (HI), and calculated according to the following Formulas (1) and (2) [5]:
R S R = W r d W s d
H I = D s H p × W r d + W s d
where Wrd represents the dry weight of the seedling root (g·plant−1), Wsd represents the dry weight of the seedling shoot, (g·plant−1), Ds represents the stem diameter (mm), and Hp represents the plant height (cm).

2.8. Analysis of Energy Consumption

The energy consumption of tomato seedlings in a controlled environment was evaluated by light use efficiency (LUE) and energy use efficiency (EUE). LUE and EUE were calculated according to the following Formulas (3) and (4) [5].
L U E = K × W d P A R
E U E = K × W d E t
where K represents the chemical energy per KWh·g−1 DW of tomato seedlings (commonly valued at 20 MJ·kg−1), Wd represents the dry weight of tomato seedlings per unit area (kg·m−2), PAR represents the photosynthetically active radiation (W·m−2), and Et represents the total energy consumption of the light source (kW·h).

2.9. Statistical Analysis

Statistical analysis was conducted using Microsoft Excel 2019 and IBM SPSS version 26.0. A graphic drawing was created with GraphPad Prism version 6.01. The experimental data were analyzed using analysis of variance (ANOVA) with Fisher’s Least Significant Difference (LSD) test at p ≤ 0.05, following a two-factor experimental design. Additionally, regression analyses were employed to establish the relationship between DLI and biomass accumulation in tomato seedlings.

3. Results and Analysis

3.1. Effects of Light Intensity and Light Time on the Seedling Quality of Tomato

3.1.1. Biomass Accumulation

As depicted in Figure 2, both light intensity and light time exhibited significant effects on the biomass accumulation of tomato seedlings in a controlled environment. The total fresh weight and total dry weight of P300-H12 tomato seedlings were the highest, reaching 14.26 g·plant−1 and 1.01 g·plant−1, respectively. However, the total fresh weight of P300-H12 tomato seedlings did not significantly differ from that of P250-H14 and P300-H14, while the total dry weight was not significantly different from that of P300-H14. A trend of initial increase followed by stabilization was observed in the total fresh weight and total dry weight of tomato seedlings with increasing DLI, corresponding to the total light energy received by the seedlings. Furthermore, the total fresh weight and total dry weight of the tomato seedlings exhibited a quadratic regression with the DLI.

3.1.2. Seedling Quality

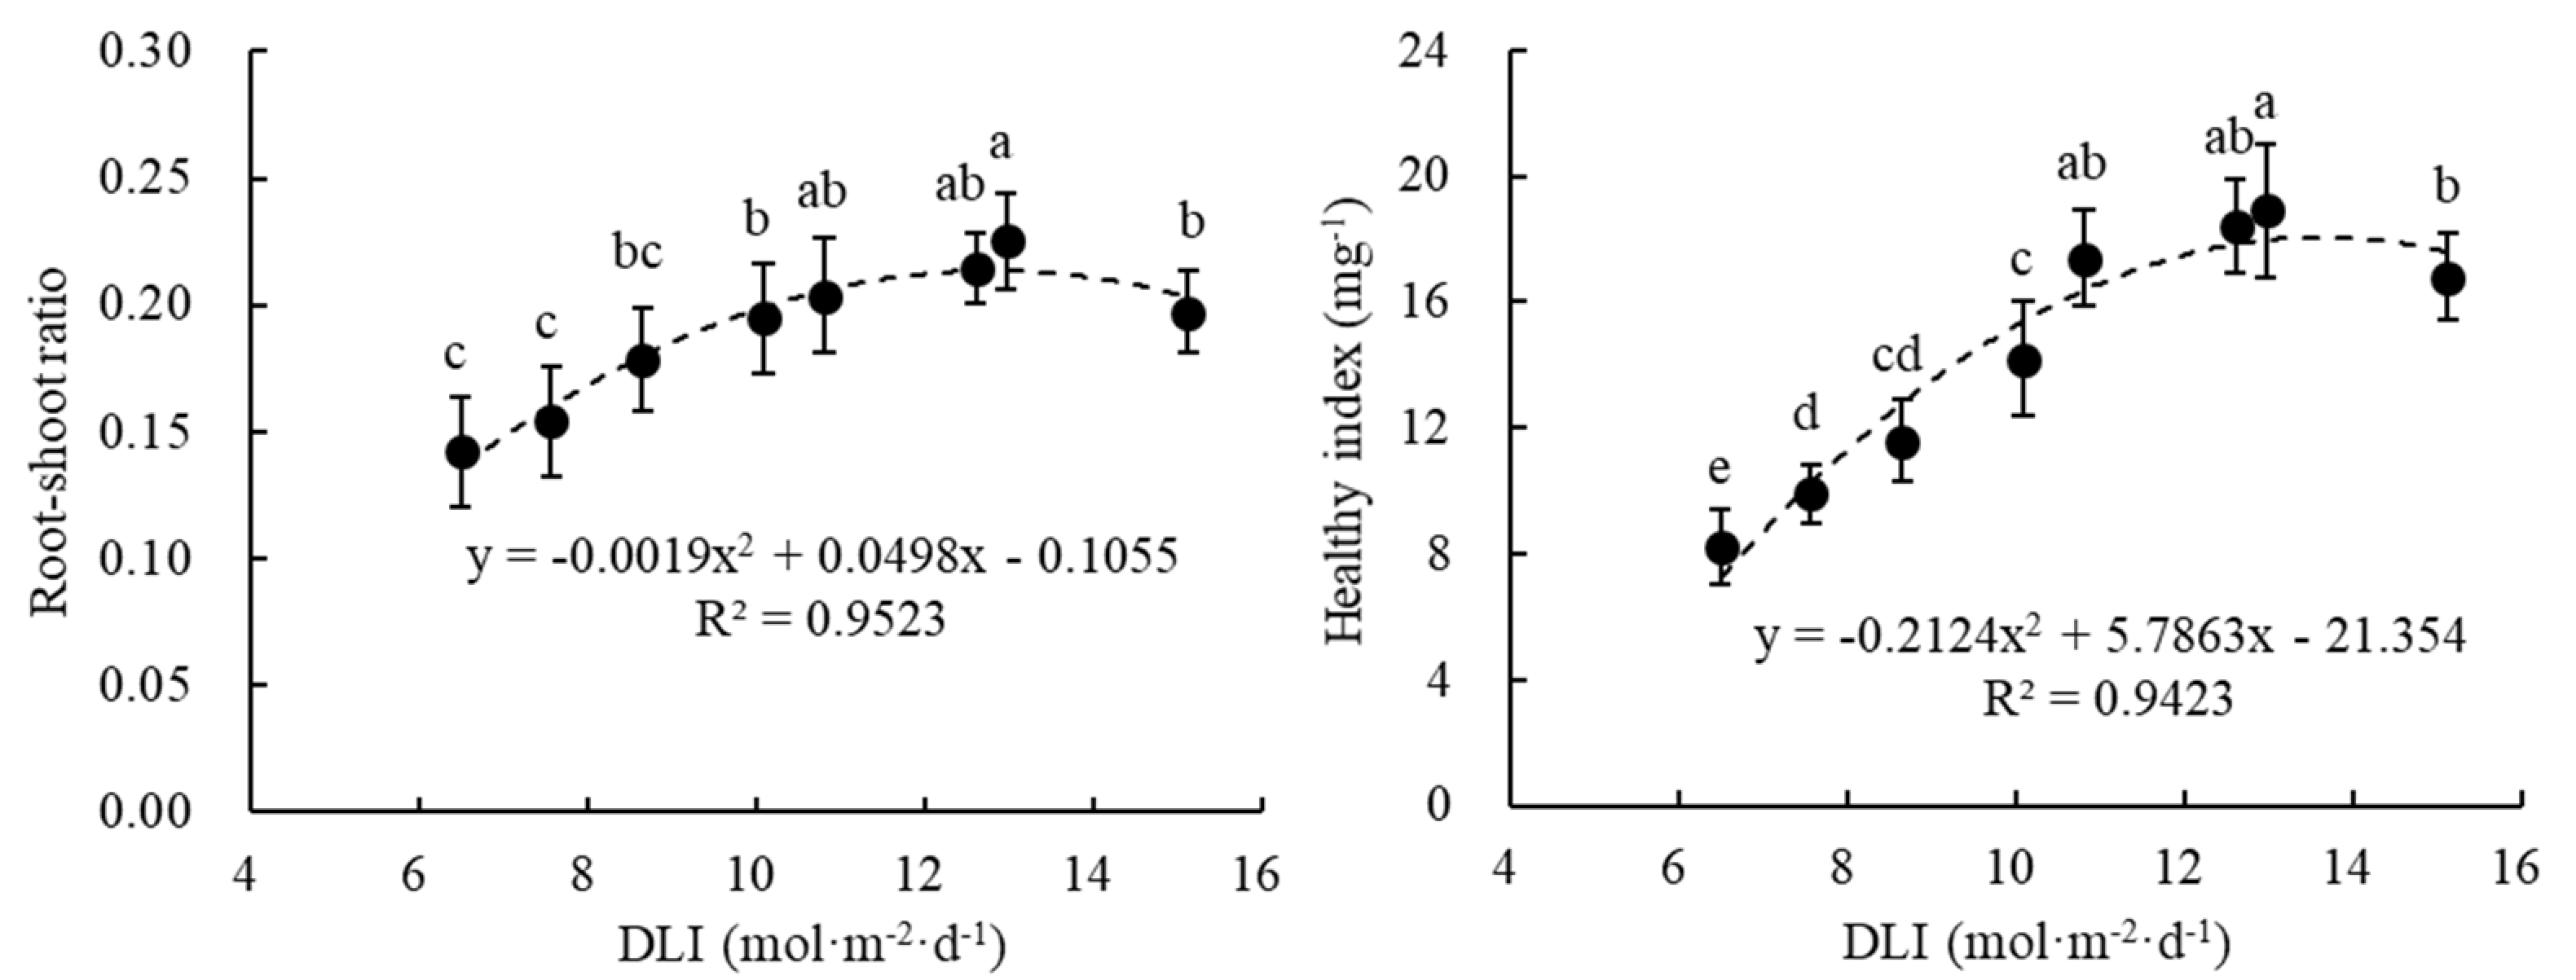
Light intensity and light time also had significant effects on the root–shoot ratio and healthy index of tomato seedlings (Figure 3). The root–shoot ratio and healthy index of the P300-H12 tomato seedlings were the highest, but there was no significant difference compared to P250-H12 and P250-H14. The results indicated an initial increase followed by a decrease in the root–shoot ratio and healthy index of the tomato seedlings with the increasing DLI. According to the quadratic regression between the root–shoot ratio and healthy index of the tomato seedlings and the DLI, the optimal DLIs for promoting these parameters were determined to be 13.11 mol·m−2·d−1 and 13.62 mol·m−2·d−1, respectively.

3.1.3. Energy Consumption

The energy consumption per KWh·g−1 DW of the P250-H12, P300-H12, and P250-H14 tomato seedlings was significantly lower than that of the tomato seedlings exposed to light intensities of 150 μmol·m−2·s−1 and 200 μmol·m−2·s−1 (Table 1). The LUE and EUE of the P300-H12 tomato seedlings were the highest, reaching 0.101 and 0.032, respectively. These values were significantly higher than those of tomato seedlings exposed to light intensities of 150 μmol·m−2·s−1 and 200 μmol·m−2·s−1, but not significantly different from those exposed to 250 μmol·m−2·s−1. Within a certain range, both the LUE and EUE of the tomato seedlings gradually increased with the increasing DLI. However, beyond a certain threshold, further increases in the DLI did not result in significant increases in the LUE and EUE of the tomato seedlings.
In conclusion, light intensity and light time significantly influenced the biomass accumulation, seedling quality, and energy use efficiency of tomato seedlings. With the increase in the DLI, the biomass accumulation, seedling quality, and energy use efficiency of the tomato seedlings increased significantly. However, there was no significant difference in the biomass accumulation among the P250-H14, P300-H12, and P300-H14 tomato seedlings. Similarly, no significant difference in seedling quality and energy use efficiency was observed among the P250-H12, P250-H14, and P300-H12 tomato seedlings, with only minor differences in biomass accumulation.

3.2. Effect of DLI and Sowing Density on the Seedling Quality of Tomato

3.2.1. Growth

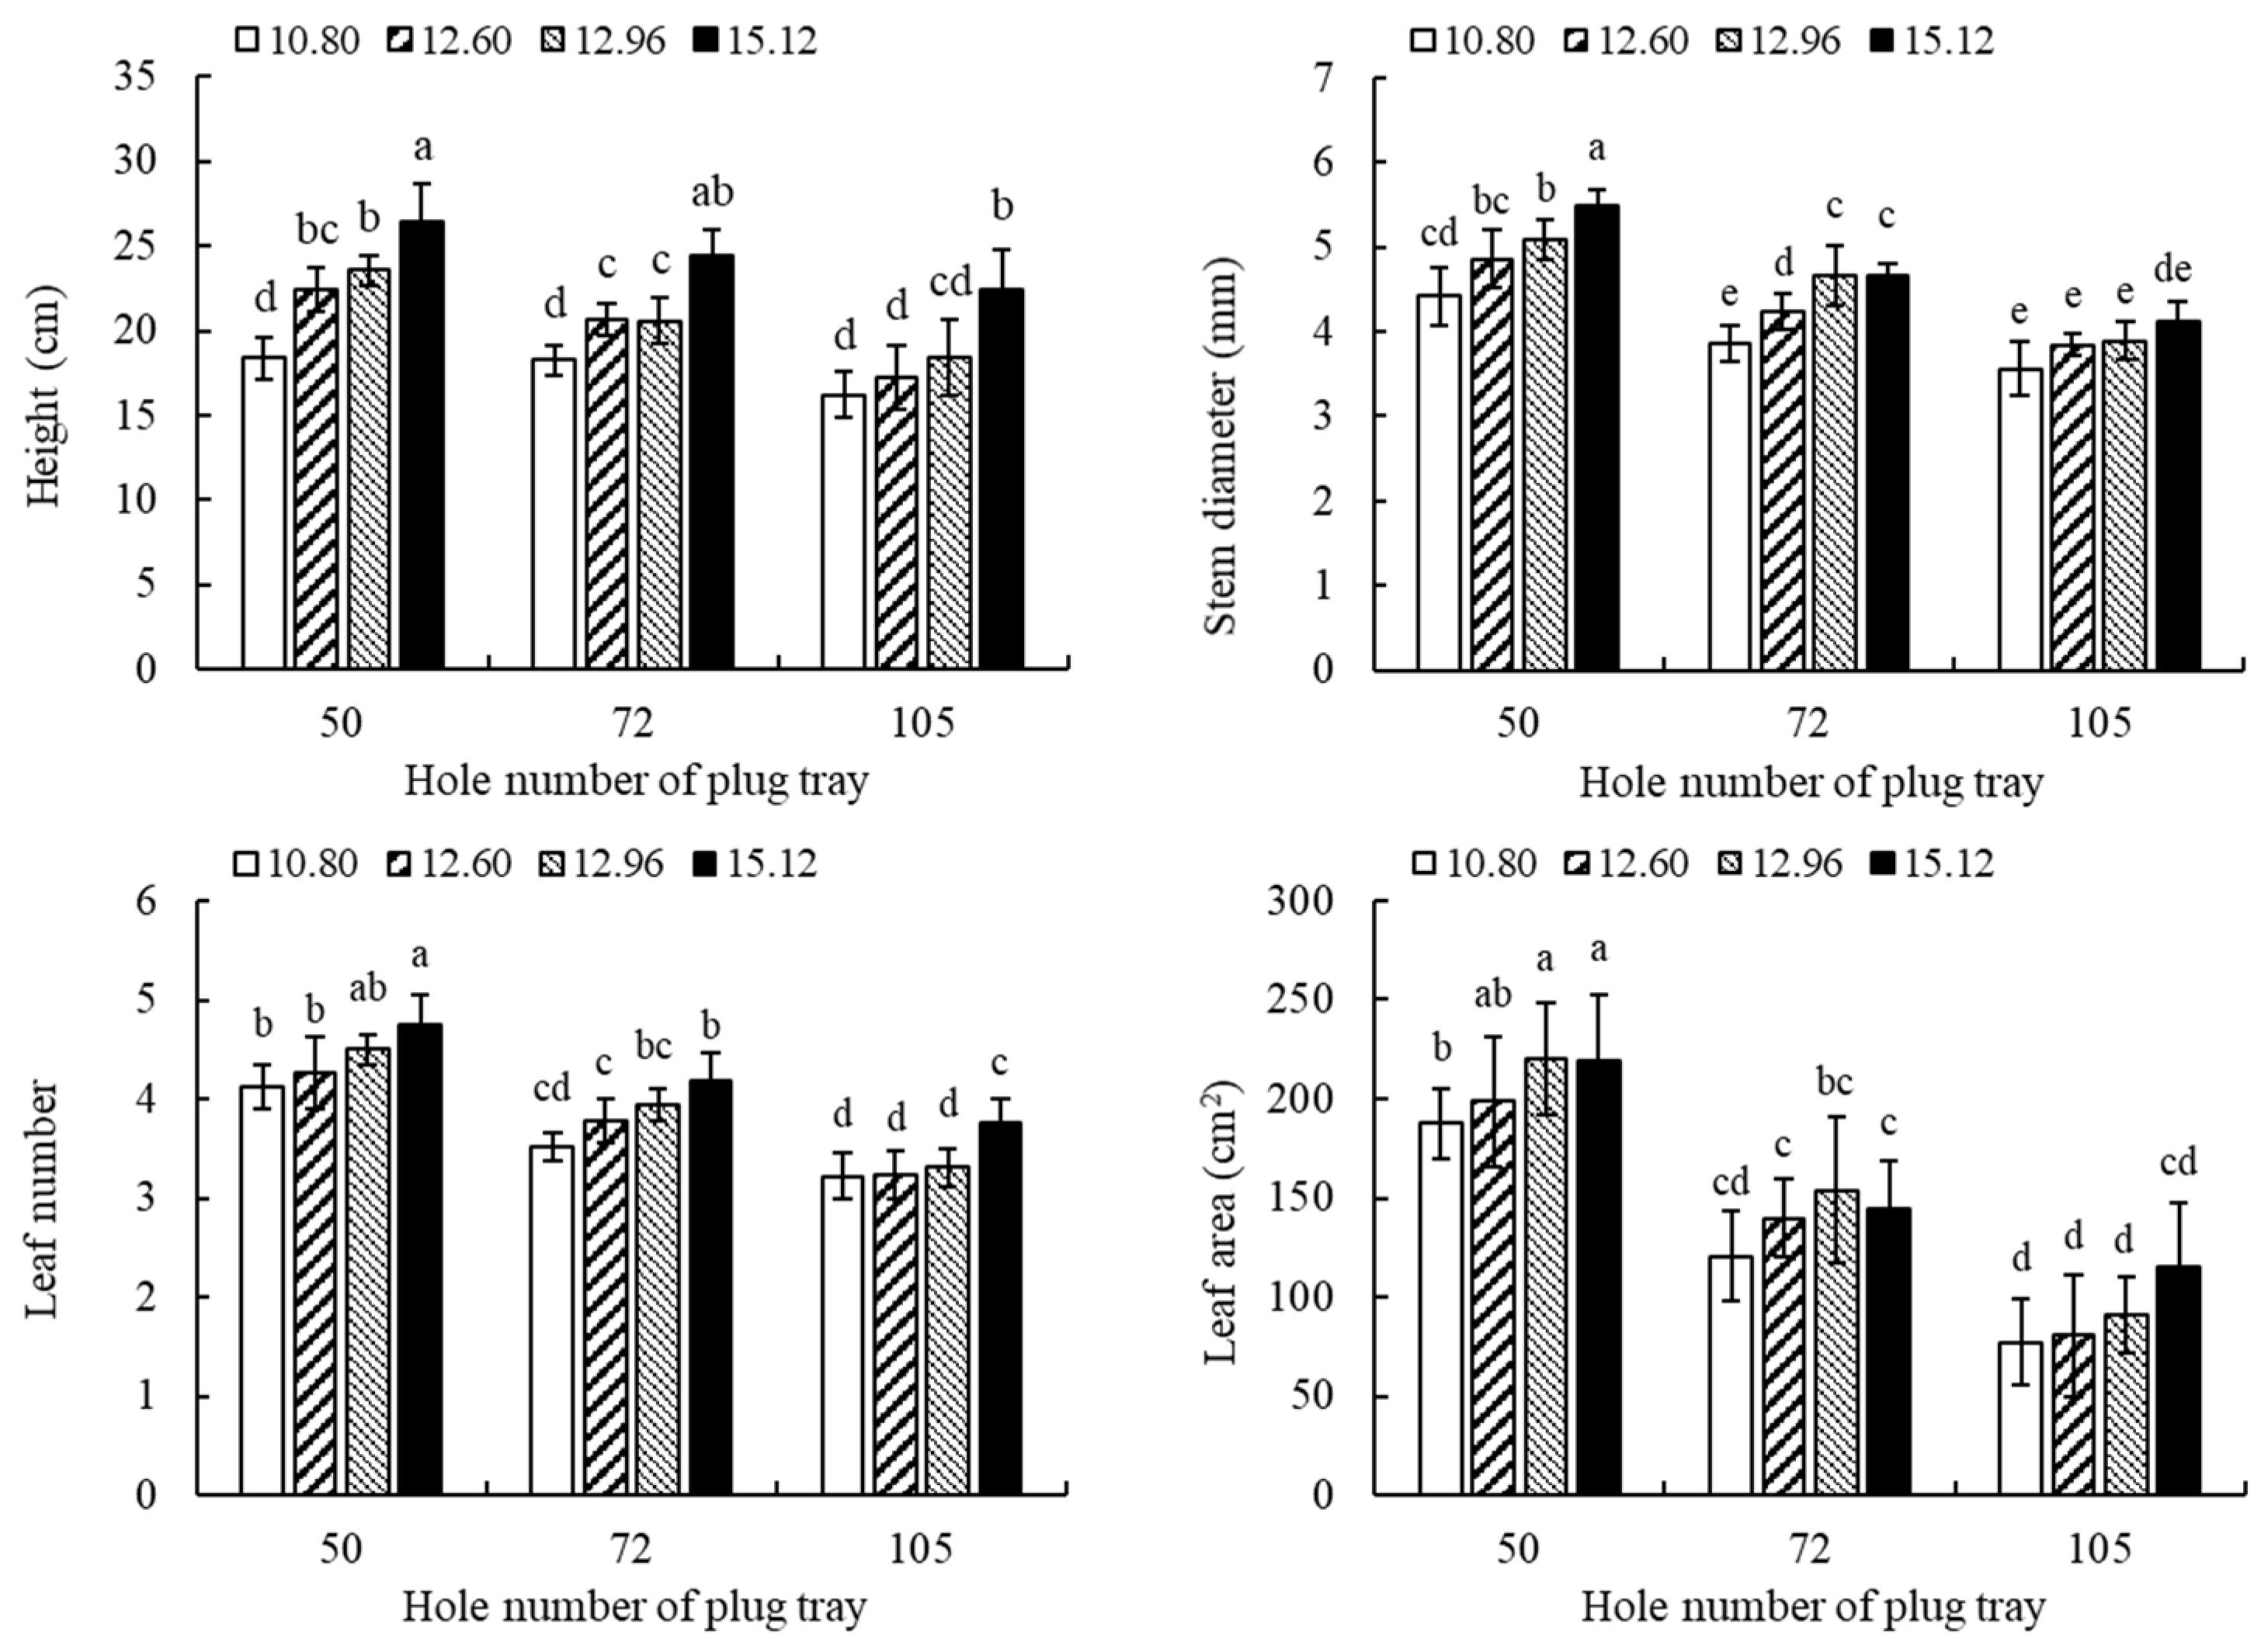
According to the experimental results above, the light environments with the DLIs of 10.80 mol·m−2·d−1, 12.60 mol·m−2·d−1, 12.96 mol·m−2·d−1 (corresponding to the DLIs for P250-H12, P250-H14, and P300-H12 tomato seedlings in the initial experiment) were selected to investigate the effect of DLI and sowing density on the seedling quality of the tomato.
The growth morphology of the tomato seedlings in each treatment varied significantly under different DLIs and sowing densities (Figure 4). The plant height of tomato seedlings with sowing densities of 50 and 72 holes per tray was significantly increased by the increasing DLI. However, the plant height of the tomato seedlings with a DLI of 12.96 mol·m−2·d−1 was not significantly affected by sowing density. When the sowing densities were 50 and 72 holes per tray, the stem diameter of tomato seedlings with a DLI of 12.96 mol·m−2·d−1 was significantly higher than those of seedlings with a DLI of 10.80 mol·m−2·d−1. There was no significant difference in the stem diameter of tomato seedlings among treatments with a sowing density of 105 holes per tray. The effect of the DLI on leaf number and leaf area of the tomato seedlings was not significant. Sowing density had significant effects on plant height, stem diameter, leaf number, and leaf area of tomato seedlings. At a low DLI, no significant differences in plant height, stem diameter, leaf number, and leaf area were observed between seedlings grown in the trays with 72 and 105 holes.

3.2.2. Photosynthetic Capacity

Both the DLI and sowing density had significant effects on the photosynthetic capacity of tomato seedling leaves (Table 2). At the sowing densities of 50 and 72 holes per tray, the net photosynthetic rate of the seedlings leaves with a DLI of 12.96 mol·m−2·d−1 was significantly higher than that of seedlings with a DLI of 10.80 mol·m−2·d−1, but not significantly different from seedlings with a DLI of 12.60 mol·m−2·d−1. There were no significant differences in the stomatal conductance of the seedling leaves across different DLIs at the same sowing density. At a sowing density of 50 holes per tray, the intercellular CO2 concentration of seedling leaves with a DLI of 10.80 mol·m−2·d−1 was significantly higher than that of seedlings with a DLI of 12.96 mol·m−2·d−1. For a sowing density of 72 holes per tray, tomato seedlings with a DLI of 12.96 mol·m−2·d−1 had significantly higher transpiration rates than seedlings under other DLIs. No significant differences in the net photosynthetic rate, stomatal conductance, intercellular CO2 concentration, or transpiration rate of the seedling leaves at a sowing density of 105 holes per tray across the different DLIs. Under the same DLI conditions, the net photosynthetic rate and transpiration rate of the seedling leaves with low sowing densities were significantly higher than those of seedlings with high sowing densities. When the DLIs were 10.80 mol·m−2·d−1 and 12.96 mol·m−2·d−1, the intercellular CO2 concentration of the seedling leaves with low sowing densities was significantly lower than in those with high sowing densities.

3.2.3. Root Activity

The effect of DLI and sowing density on the root activity of tomato seedlings is shown in Figure 5. For the tomato seedlings with sowing densities of 50 and 72 holes per tray, root activity exhibited an upward trend with increasing DLI. Conversely, at a sowing density of 105 holes per tray, there were no significant differences in root activity across different DLIs. When DLI was 12.60 mol·m−2·d−1 and 12.96 mol·m−2·d−1, root activity of the tomato seedlings decreased with increasing sowing density. However, at a DLI of 10.80 mol·m−2·d−1, no significant differences in root activity were observed across the different sowing densities.

3.2.4. Biomass Accumulation

Both the DLI and sowing density have significant effects on the fresh and dry weights of tomato seedlings (Figure 6). Tomato seedlings grown at a sowing density of 50 holes per tray and a DLI of 12.96 mol·m−2·d−1 exhibited the highest fresh and dry weights, reaching 10.31 g·plant−1 and 678 mg·plant−1, respectively. However, these values were not significantly different from those observed in D12.60-K50 and D12.96-K72. Except for the dry weight of the tomato seedlings at a sowing density of 72 holes per tray, both fresh and dry weights increased with increasing DLI at the same sowing density. Under the same DLI, the fresh and dry weights of the tomato seedlings decreased with increasing sowing density, but there were no significant differences between seedlings at 50 and 72 holes per tray.
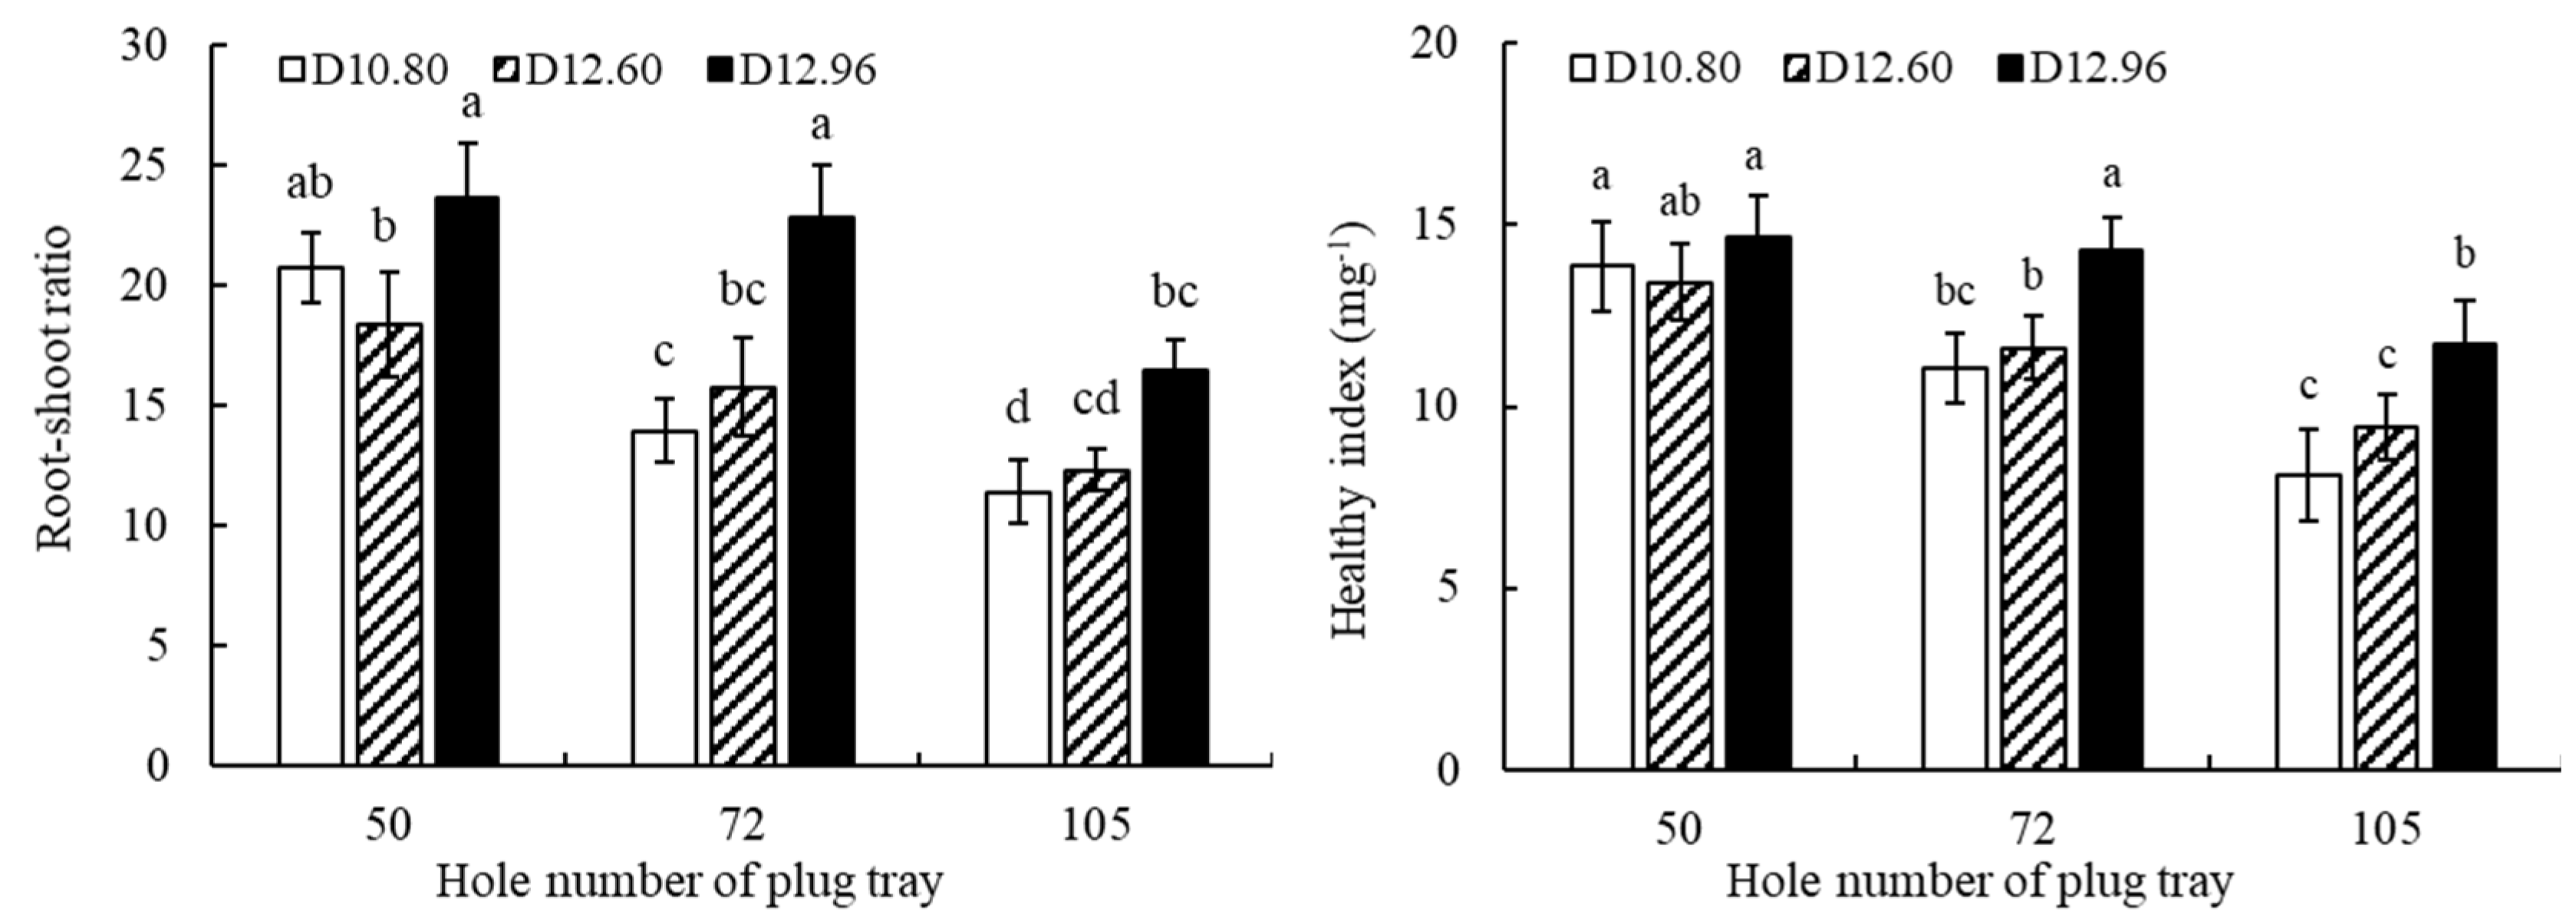
The root–shoot ratio of tomato seedlings at D12.96-K50, D12.96-K72, and D10.80-K50 was high, with no significant differences among these treatments (Figure 7). For sowing densities of 72 and 105 holes per tray, the root–shoot ratio was significantly higher at a DLI of 12.96 mol·m−2·d−1 compared to a DLI of 10.80 mol·m−2·d−1, whereas there was no difference between these two treatments at a sowing density of 50 holes per tray. At the same DLI, the root–shoot ratio decreased with increasing sowing density. The healthy index of tomato seedlings exhibited a similar trend to the root–shoot ratio.

3.2.5. Energy Consumption

The energy consumption per KWh·g−1 DW of tomato seedlings at a sowing density of 50 holes per tray was significantly higher compared to seedlings at sowing densities of 72 and 105 holes per tray (Table 3). At the same DLI, the energy consumption per KWh·g−1 DW of tomato seedlings decreased with increasing sowing density, but there was no significant difference between seedlings at 72 and 105 holes per tray. The tomato seedlings at a DLI of 12.96 mol·m−2·d−1 and a sowing density of 105 holes per tray exhibited the highest LUE and EUE. However, there were no significant differences in the LUE and EUE among the seedlings at 72 and 105 holes per tray under the different DLIs. At the same, the DLI, LUE, and EUE of the tomato seedlings increased with increasing sowing density, although the differences between the seedlings at 72 and 105 holes per tray were not significant.

4. Discussion

Light acts as both an energy and signal source for plant growth and development, directly influencing the quality and structural characteristics of tomato seedlings [20,21]. Studies have indicated that the plant height, root–shoot ratio, hypocotyl length, and healthy index gradually decline as light intensity decreases [22]. Conversely, leaf area increases, and a larger proportion of biomass is allocated to the roots as the light intensity decreases [23]. Prolonging the light time can promote the accumulation of photosynthetic products in seedling leaves, thereby improving the root–shoot ratio and leaf area of the plants [24]. In recent years, the daily light integral (DLI), representing the total amount of light energy received by plants, has been paid more attention [25]. Yu et al. found that under the same light time, an increase in light intensity resulted in a gradual increase in the plant height and underground dry mass in tomato seedlings, although there were no significant changes in the total chlorophyll content and maximum photochemical efficiency of PSII (Fv/Fm) [26]. When the light intensity was 200 μmol·m−2·s−1, increasing the light time improved the leaf area, net photosynthetic rate, biomass accumulation, and healthy index of tomato seedlings [26]. The research results demonstrate that the interaction between LED light intensity and light time has a significant impact on tomato seedlings. Song et al. discovered that increasing DLI can mitigate the adverse effects of intense light, enhancing biomass accumulation in plant seedlings [5].
It was found in this study that with the increasing DLI, the biomass accumulation, root–shoot ratio, and healthy index of the tomato seedlings were significantly enhanced [27]. These findings are consistent with the conclusions of many researchers, indicating that increasing the total amount of light energy received by the seedling leaves can improve tomato seedling growth and promote the generation of photosynthetic products [28]. Notably, the total fresh weights and total dry weights of the P300-H12 and P300-H14 seedlings were higher, although the differences were not significant compared to the P250-H14 seedlings. Additionally, the root–shoot ratio and healthy index of tomato plants showed a quadratic relationship with the DLI, consistent with the findings of Zhang et al. [29] and Yan et al. [30]. There were no significant differences in the root–shoot ratio and healthy index among the P250-H12, P250-H14, and P300-H12 seedlings, but these were higher than those in the P300-H14 seedlings. This may be due to the decline in biomass accumulation in tomato seedlings when the DLI exceeds a certain range, potentially due to light inhibition [19]. In this study, the optimal DLI inferred from the quadratic relationship between the root–shoot ratio and healthy index and the DLI were 13.11 mol·m−2·d−1 and 13.62 mol·m−2·d−1, respectively, which were close to the DLI of the P300-H12 treatment. The results of this study indicate that the energy consumption of tomato seedlings at DLIs of 12.96 mol·m−2·d−1, 12.60 mol·m−2·d−1, and 10.80 mol·m−2·d−1 did not show significant differences, yet these were markedly higher than other experimental treatments. Therefore, considering the seedling quality and economic efficiency, a DLI of 12.60 mol·m−2·d−1 (achieved with a light intensity of 250 μmol·m−2·s−1 and a light time of 14 h) is more suitable for tomato seedling cultivation. This conclusion is also in agreement with the findings of Fan et al. [31].
Sowing density determines the growth space and available nutrients for tomato seedlings [32]. A larger cell volume is more conducive to root development and nutrient absorption, but it can also reduce the energy use efficiency, light use efficiency, and substrate use efficiency per plant [33,34]. To cultivate high-quality tomato seedlings while reducing the energy consumption of seedlings, the interaction effects of the DLI and sowing density on tomato seedling quality were analyzed in this study in a controlled environment. The results showed that increasing the DLI significantly enhanced the plant height of tomato seedlings at sowing densities of 50 and 72 holes per tray. However, plant height at a DLI of 12.96 mol·m−2·d−1 was not significantly affected by sowing density. This indicates that DLI has a significant impact on the plant height of tomato seedlings, and increasing DLI can mitigate the elongation caused by higher sowing densities to some extent. This should be related to the increase in the DLI which is beneficial to reduce the shading between seedlings [34,35]. The effect of the DLI on the leaf number and leaf area of the tomato seedlings was not significant. Sowing density had a significant impact on the plant height, stem diameter, leaf number, and leaf area. The tomato seedlings with lower sowing densities exhibited significantly higher plant height, stem diameter, leaf number, and leaf area compared to those with higher sowing densities, particularly at a DLI of 12.96 mol·m−2·d−1. These findings are consistent with the results of Kim et al. [36]. This may be attributed to the improved airflow among seedlings at lower densities, which enhances transpiration and photosynthesis in the leaves [37,38].
Under the same DLI, the net photosynthetic rate and transpiration rate of tomato seedlings at low sowing densities were significantly higher than those at high densities, which effectively validated the conclusions of the aforementioned studies. However, there was no significant difference between seedlings at sowing densities of 50 and 72 holes per tray. At the same sowing density, there was no significant difference in net photosynthetic rate between tomato seedlings at DLIs of 12.60 mol·m−2·d−1 and 12.96 mol·m−2·d−1. The biomass accumulation of tomato seedlings followed a similar pattern to the net photosynthetic rate, indicating that the treatment with a DLI of 12.60 mol·m−2·d−1 and a sowing density of 72 holes per tray was beneficial for photosynthesis in the seedling leaves. At low sowing densities, increasing the DLI enhanced root activity. This may be because tomato leaves receive more light, which can enhance the specific surface area of roots to promote the absorption of water and fertilizer by seedlings [39]. But there was no significant difference in root vitality between seedlings at DLIs of 12.60 mol·m−2·d−1 and 12.96 mol·m−2·d−1. When the DLI was 12.60 mol·m−2·d−1, the root activity of the seedlings at a sowing density of 50 holes per tray was significantly higher than those at 72 holes per tray. However, there was no difference in root activity between the two sowing densities when DLI was 12.96 mol·m−2·d−1. These findings suggest that increasing the DLI is beneficial for mitigating the adverse effects associated with higher sowing densities. Similar patterns were also observed in the seedling quality of the tomato. Therefore, it can be concluded that there were no significant differences in root activity and seedling quality between tomato seedlings at a DLI of 12.96 mol·m−2·d−1 and a sowing density of 72 holes per tray compared to those at a sowing density of 50 holes per tray under high DLI. There were no significant differences between tomato seedlings at a DLI of 12.96 mol·m−2·d−1 and a sowing density of 72 holes per tray compared to those at a sowing density of 50 holes per tray under low DLI.
Under the same DLI, the total fresh weight and total dry weight of tomato seedlings gradually decreased with increasing sowing density, consistent with the findings of many researchers [40,41]. At DLIs of 12.60 mol·m−2·d−1 and 12.96 mol·m−2·d−1, there were no significant differences in the total fresh weight and total dry weight of tomato seedlings at sowing densities of 50 and 72 holes per tray. At the same sowing density, the total fresh weight and total dry weight of tomato seedlings at a DLI of 12.96 mol·m−2·d−1 were significantly higher than those at a DLI of 10.80 mol·m−2·d−1, but neither showed significant differences compared to seedlings at a DLI of 12.60 mol·m−2·d−1. This indicates that an appropriate DLI can enhance the sowing density of tomato seedlings [34]. The root–shoot ratio and healthy index of tomato seedlings under the same DLI exhibited trends similar to biomass accumulation, indicating that higher sowing density increases the risk of seedling etiolation [35]. However, when the sowing density was 72 and 105 holes per tray, both the root–shoot ratio and healthy index of tomato seedlings significantly increased with higher DLI. Furthermore, at DLIs of 12.60 mol·m−2·d−1 and 12.96 mol·m−2·d−1, there were no significant differences in the root-shoot ratio and healthy index of tomato seedlings between sowing densities of 50 and 72 holes per tray. This suggests that an appropriate DLI can increase the sowing density of tomato seedlings without compromising the seedling quality of the tomato.

5. Conclusions

In summary, both the DLI and sowing density significantly affect the seedling quality of the tomato in a controlled environment. Increasing DLI can mitigate the adverse effects of high sowing density on seedling quality. Specifically, under a high DLI environment, there were no significant differences in plant height, stem diameter, net photosynthetic rate, biomass accumulation, and healthy index between tomato seedlings at a sowing density of 72 holes per tray compared to those grown at a density of 50 holes per tray, especially at a DLI was 12.96 mol·m−2·d−1. Additionally, the LUE and EUE of the tomato seedlings at a sowing density of 72 holes per tray were not significantly different from those at a density of 105 holes per tray but were significantly higher than those at 50 holes per tray. Therefore, optimizing parameters such as DLI and sowing density in tomato seedling cultivation can effectively enhance seedling quality, space use efficiency, and light use efficiency. According to the results of this study, a DLI of 12.96 mol·m−2·d−1 (achieved with a light intensity of 300 μmol·m−2·s−1 and a light time of 12 h) and the use of 72 holes per tray are conducive to cultivating high-quality tomato seedlings while also reducing energy consumption.
The results in this study indicate that continuously increasing the DLI or sowing density does not necessarily lead to greater economic benefits. While the parameters of DLI and sowing density only offer guidance for cultivating high-quality tomato seedlings in a plant factory with artificial lighting, seedling growth is influenced by numerous environmental factors. This study focused solely on plug tray specifications and DLIs. Future studies should investigate additional environmental factors such as water, substrate, and light quality to provide a technical foundation for the large-scale production of vegetable seedlings.

Author Contributions

Formal Analysis, X.X.; Investigation, J.S., R.Z. and W.C.; Data Curation, X.X. and F.Y.; Writing—Original Draft, J.S.; Writing—Review and Editing, X.X. All authors have read and agreed to the published version of the manuscript.

Funding

This work was supported by the National Natural Science Foundation of China (42307428), the Project Funded by the Priority Academic Program Development of Jiangsu Higher Education Institutions (PAPD-2023-87), Postdoctoral Science Foundation General Project of China (2021M691316), the Project Funded by National Engineering Laboratory for Wheat and Corn Deep Processing (KFQ202303).

Data Availability Statement

The data presented in this study are available on request from the corresponding author.

Conflicts of Interest

The authors declare no conflicts of interest.

References

  1. Sun, Y.; He, J.; Wei, F.; Yang, W. Evaluation on the development and international competitiveness of China’s tomato industry during the 13th Five-Year Plan period. China Cucurbits Veg. 2023, 36, 112–116. (In Chinese) [Google Scholar]
  2. Ali, A.; Cavallaro, V.; Santoro, P.; Mori, J.; Ferrante, A.; Cocetta, G. Quality and physiological evaluation of tomato subjected to different supplemental lighting systems. Sci. Hortic. 2024, 323, 112469. [Google Scholar] [CrossRef]
  3. Zhang, G.; Li, Z.; Cheng, J.; Cai, X.; Cheng, F.; Yang, Y.; Yan, Z. Morphological and physiological traits of greenhouse-grown tomato seedlings as influenced by supplemental white plus red versus red plus blue LEDs. Aronomy 2022, 12, 2450. [Google Scholar] [CrossRef]
  4. Mašková, T.; Herben, T. Root: Shoot ratio in developing seedlings: How seedlings change their allocation in response to seed mass and ambient nutrient supply. Ecol. Evol. 2018, 8, 7143–7150. [Google Scholar] [CrossRef]
  5. Song, J.; Fan, Y.; Li, X.; Li, Y.; Mao, H.; Zuo, Z.; Zou, Z. Effects of daily light integral on tomato (Solanum lycopersicon L.) grafting and quality in a controlled environment. Int. J. Agric. Biol. Eng. 2022, 15, 44–50. [Google Scholar] [CrossRef]
  6. Ji, F.; Gan, P.; Liu, N.; He, D.; Yang, P. Effects of LED spectrum and daily light integral on growth and energy use efficiency of tomato seedlings. Trans. Chin. Soc. Agric. Eng. 2020, 36, 231–238. (In Chinese) [Google Scholar]
  7. Kozai, T.; Niu, G. Plant Factory: Chapter 4: Plant Factory as a Resource-Efficient Closed Plant Production System; Academic Press: Cambridge, MA, USA, 2016; pp. 69–90. [Google Scholar]
  8. Costa, E.; Curi, T.; Figueiredo, T.; Binotti, F.; Cardoso, E. Kale seedlings production in different substrates, cell volumes and protected environments. Eng. Agrícola 2017, 37, 46–53. [Google Scholar] [CrossRef]
  9. Han, L.; Mo, M.; Gao, Y.; Ma, H.; Xiang, D.; Ma, G.; Mao, H. Effects of new compounds into substrates on seedling qualities for efficient transplanting. Agronomy 2022, 12, 983. [Google Scholar] [CrossRef]
  10. Singh, B.; Yadav, H.; Kumar, M.; Sirohi, N. Effect of plastic plug-tray cell size and shape on quality of soilless media grown tomato seedlings. Acta Hortic. 2007, 742, 57–60. [Google Scholar] [CrossRef]
  11. Zhou, M.; Sun, H.; Xu, X.; Yang, J.; Wang, G.; Wei, Z.; Xu, T.; Yin, J. Study on the method and mechanism of seedling picking for pepper (Capsicum annuum L.) plug seedlings. Agriculture 2024, 14, 11. [Google Scholar] [CrossRef]
  12. Goncalves, G.; Prins, C.; Diel, M.; Lucio, A. Plot and sample sizes for biometric variables in lettuce seedlings. Ciência Rural. Santa Maria 2024, 54, e20220471. [Google Scholar] [CrossRef]
  13. Wenneck, G.; Saath, R.; Rezende, R.; Vila, V.; Andrean, A.; Terassi, D. Cucumber seedlings production: Tray size impact on development. Braz. J. Biosyst. Eng. 2022, 16, 1079. [Google Scholar] [CrossRef]
  14. Kumi, F.; Korkpoe, F.; Osei, G. Influence of plug cell volume and substrate type on the development of cucumber seedlings for transplanting. Int. J. Technol. Manag. Res. 2020, 4, 50–64. [Google Scholar] [CrossRef]
  15. Garcia, C.; Lopez, R. Supplemental radiation quality influences cucumber, tomato, and pepper transplant growth and development. HortScience 2020, 55, 804–811. [Google Scholar] [CrossRef]
  16. Song, J.; Cao, K.; Hao, Y.; Song, S.; Su, W.; Liu, H. Hypocotyl elongation is regulated by supplemental blue and red light in cucumber seedling. Gene 2019, 707, 117–125. [Google Scholar] [CrossRef] [PubMed]
  17. Song, J.; He, D.; Wang, J.; Mao, H. How to diagnose potassium abundance and deficiency in tomato leaves at the early cultivation stage. Horticulturae 2023, 9, 1225. [Google Scholar] [CrossRef]
  18. Ma, G.; Mao, H.; Bu, Q.; Han, L.; Shabbir, A.; Gao, F. Effect of compound biochar substrate on the root growth of cucumber plug seedlings. Agronomy 2020, 10, 1080. [Google Scholar] [CrossRef]
  19. Garland, K.; Burnett, S.; Day, M.; Iersel, M. Influence of substrate water content and daily light integral on photosynthesis, water use efficiency, and morphology of heuchera americana. J. Am. Soc. Hortic. Sci. 2012, 137, 57–67. [Google Scholar] [CrossRef]
  20. Zha, L.; Liu, W. Effects of light quality, light intensity, and photoperiod on growth and yield of cherry radish grown under red plus blue LEDs. Hortic. Environ. Biotechnol. 2018, 59, 511–518. [Google Scholar] [CrossRef]
  21. Wu, Y.; Gong, W.; Yang, W. Shade inhibits leaf size by controlling cell proliferation and enlargement in soybean. Sci. Rep. 2017, 7, 9259. [Google Scholar] [CrossRef]
  22. Feng, L.; Raza, M.; Li, Z.; Chen, Y.; Khalid, M.; Du, J.; Liu, W.; Wu, X.; Song, C.; Yu, L.; et al. The influence of light intensity and leaf movement on photosynthesis characteristics and carbon balance of soybean. Front. Plant Sci. 2019, 9, 1952. [Google Scholar] [CrossRef]
  23. Yang, Y.; Dong, L.; Shi, L.; Guo, J.; Jiao, Y.; Xiong, H.; Dickson, R.; Shi, A. Effects of low temperature and low light on physiology of tomato seedlings. Am. J. Plant Sci. 2020, 11, 162–179. [Google Scholar] [CrossRef]
  24. Wang, D.; Wang, S.; Wang, Y. Responses of seedlings to light temporal heterogeneity in different habitats. Chin. J. Ecol. 2024, 43, 86–95. [Google Scholar]
  25. Oh, W.; Runkle, E.; Warner, R. Daily light integral during the seedling stage influences transplant quality and subsequent performance in selected annual plants. Hortscience 2008, 43, 1123. [Google Scholar]
  26. Yu, P.; Song, J.; Cai, W.; Li, Y.; Fan, Y.; Shen, C.; Qu, K.; Mao, H. Effects of LED supplementary light intensity and supplementary light time at night on seedling quality of tomato in the controlled environment. Jiangsu J. Agric. Sci. 2023, 39, 1917–1926. (In Chinese) [Google Scholar]
  27. Yang, Z.; He, W.; Mou, S.; Wang, X.; Chen, D.; Hu, X.; Chen, L.; Bai, J. Plant growth and development of pepper seedlings under different photoperiods and photon flux ratios of red and blue LEDs. Trans. Chin. Soc. Agric. Eng. 2017, 33, 173–180. [Google Scholar]
  28. Gao, W.; He, D.; Ji, F.; Zhang, S.; Zheng, J. Effects of daily light integral and LED spectrum on growth and nutritional quality of hydroponic spinach. Agronomy 2020, 10, 1082. [Google Scholar] [CrossRef]
  29. Zhang, X.; He, D.; Niu, G.; Yan, Z.; Song, J. Effects of environment lighting on the growth, photosynthesis, and quality of hydroponic lettuce in a plant factory. Int. J. Agric. Biol. Eng. 2018, 11, 33–40. [Google Scholar] [CrossRef]
  30. Yan, Z.; He, D.; Niu, G.; Zhou, Q.; Qu, Y. Growth, nutritional quality, and energy use efficiency of hydroponic lettuce as influenced by daily light integrals exposed to white versus white plus red light-emitting diodes. Hortscience 2019, 54, 1737–1744. [Google Scholar] [CrossRef]
  31. Fan, X.; Xu, Z.; Liu, X.; Tang, C.; Wang, L.; Han, X. Effects of light intensity on the growth and leaf development of young tomato plants grown under a combination of red and blue light. Sci. Hortic. 2013, 153, 50–55. [Google Scholar] [CrossRef]
  32. Cavalcanti, S.; Gomes, N.; Pandorfi, H.; Almeida, G.; Montenegro, A. Variação espaço-temporal da temperatura do substrato em bandejas de produção de mudas. Rev. Agric. Neotrop. 2019, 6, 66–73. [Google Scholar] [CrossRef]
  33. Al-Menaie, H.; Al-Ragam, O.; Al-Dosery, N.; Zalzaleh, M.; Mathew, M.; Suresh, N. Effect of pot size on plant growth and multiplication of water lilies (Nymphaea sp). Am.-Eurasian J. Agric. Environ. Sci. 2012, 12, 148–153. [Google Scholar]
  34. Takashi, F.; Kunio, S.; Takashi, O.; Mansu, C. Growth characteristics of cabbage plug seedlings due to mutual shading among neighboring seedlings. Biosyst. Eng. 2014, 121, 77–84. [Google Scholar]
  35. Poel, B.; Runkle, E. Evaluating light-emitting diodes for use in supplemental greenhouse lighting for seedling plug production. Hortscience 2015, 50, 252. [Google Scholar]
  36. Kim, S.; Jung, T.; Lee, Y.; Song, D.; Yu, H.; Lee, C.; Kim, Y. Effect of nursery stage and plug cell size on seedling growth of waxy corn. Korean J. Crop Sci. 2009, 54, 407–415. [Google Scholar]
  37. Zhang, C.; Akhlaq, M.; Yan, H.; Ni, Y.; Liang, S.; Zhou, J.; Xue, R.; Li, M.; Adnan, R.; Li, J. Chlorophyll fluorescence parameter as a predictor of tomato growth and yield under CO2 enrichment in protective cultivation. Agric. Water Manag. 2023, 284, 108333. [Google Scholar] [CrossRef]
  38. Hou, M.; Ni, J.; Mao, H. Effects of airflow disturbance on the content of biochemical components and mechanical properties of cucumber seedling stems. Agronomy 2023, 13, 1125. [Google Scholar] [CrossRef]
  39. Hermans, C.; Hammond, J.; White, P.; Verbruggen, N. How do plants respond to nutrient shortage by biomass allocation. Trends Plant Sci. 2006, 11, 610–617. [Google Scholar] [CrossRef] [PubMed]
  40. Jang, D.; Kwon, Y.; Choi, K.; Kim, S. Comparison of growth characteristics fruit vegetable seedlings grown on cylindrical paper pot trays of plug trays. Prot. Hortic. Plant Fact. 2018, 27, 381–390. [Google Scholar] [CrossRef]
  41. Costa, E.; Durante, L.; Santos, A.; Ferreira, C. Production of eggplant from seedlings produced in different environments, containers and substrates. Hortic. Bras. 2013, 31, 139–146. [Google Scholar] [CrossRef]
Figure 1. Spectral distribution of LED lamp with red-to-blue ratio (R:B) of 1.2.
Horticulturae 10 00730 g001
Figure 2. Effect of light intensity and light time on biomass accumulation in tomato seedlings. Note: The error line is expressed by standard deviation (SD, n = 8), and treatments with different letters are significantly different at p ≤ 0.05.
Horticulturae 10 00730 g002
Figure 3. Effects of light intensity and light time on the root–shoot ratio and healthy index of tomato seedlings. Note: The error line is expressed by standard deviation (SD, n = 8), and treatments with different letters are significantly different at p ≤ 0.05.
Horticulturae 10 00730 g003
Figure 4. Effect of DLI and sowing density on the growth morphology of tomato seedlings. Note: The error line is expressed by standard deviation (SD, n = 12), and treatments with different letters are significantly different at p ≤ 0.05.
Horticulturae 10 00730 g004
Figure 5. Effect of DLI and sowing density on root activity of tomato seedlings. Note: The error line is expressed by standard deviation (SD, n = 5), and treatments with different letters are significantly different at p ≤ 0.05.
Horticulturae 10 00730 g005
Figure 6. Effect of DLI and sowing density on biomass accumulation in tomato seedlings. Note: The error line is expressed by standard deviation (SD, n = 8), and treatments with different letters are significantly different at p ≤ 0.05.
Horticulturae 10 00730 g006
Figure 7. Effects of DLI and sowing density on the root–shoot ratio and healthy index of tomato seedlings. Note: The error line is expressed by standard deviation (SD, n = 8), and treatments with different letters are significantly different at p ≤ 0.05.
Horticulturae 10 00730 g007
Table 1. Energy consumption for tomato seedlings under different lighting environments.
TreatmentEnergy Consumption
(KWh g−1 DW)
LUEEUE
P150-H120.230 ± 0.024 a0.076 ± 0.013 b0.022 ± 0.004 b
P200-H120.227 ± 0.018 a0.074 ± 0.011 b0.023 ± 0.006 b
P250-H120.180 ± 0.024 b0.091 ± 0.010 ab0.029 ± 0.004 ab
P300-H120.161 ± 0.028 b0.101 ± 0.016 a0.032 ± 0.004 a
P150-H140.228 ± 0.032 a0.076 ± 0.007 b0.023 ± 0.002 b
P200-H140.223 ± 0.018 a0.075 ± 0.012 b0.023 ± 0.004 b
P250-H140.182 ± 0.021 b0.090 ± 0.009 ab0.028 ± 0.003 ab
P300-H140.203 ± 0.026 ab0.080 ± 0.008 b0.025 ± 0.003 b
Note: The results are expressed by mean ± SD (n = 3), and treatments with different letters are significantly different at p ≤ 0.05.
Table 2. Effect of DLI and sowing density on the gas exchange parameters of tomato seedlings (n = 6).
TreatmentNet Photosynthetic Rate
(μmol·m−2·s−1)
Stomatal Conductivity
(mol·m−2·s−1)
Intercellular CO2 Concentration
(μmol·mol−1)
Transpiration Rate
(mmol·m−2·s−1)
D10.80-K5017.6 ± 1.4 b0.377 ± 0.056 ab696 ± 32 b3.42 ± 0.54 ab
D12.60-K5018.7 ± 1.2 ab0.421 ± 0.043 ab.684 ± 25 bc3.75 ± 0.47 ab
D12.96-K5020.3 ± 0.9 a0.446 ± 0.039 a645 ± 27 c3.96 ± 0.23 a
D10.80-K7515.3 ± 0.8 c0.364 ± 0.046 ab719 ± 31 ab3.19 ± 0.34 b
D12.60-K7516.2 ± 0.9 bc0.385 ± 0.049 ab710 ± 29 ab3.22 ± 0.21 b
D12.96-K7518.6 ± 1.1 ab0.398 ± 0.031 ab672 ± 19 bc3.87 ± 0.19 a
D10.80-K10512.2 ± 1.6 d0.335 ± 0.032 b739 ± 24 a2.63 ± 0.26 c
D12.60-K10514.3 ± 1.5 cd0.341 ± 0.037 b724 ± 19 ab2.64 ± 0.23 c
D12.96-K10514.7 ± 1.4 cd0.342 ± 0.042 b715 ± 27 ab2.86 ± 0.33 bc
Note: The results are expressed by mean ± SD (n = 6), and treatments with different letters are significantly different at p ≤ 0.05.
Table 3. Energy consumption for tomato seedlings under different DLI and sowing density (n = 3).
TreatmentEnergy Consumption
(KWh g−1 DW)
LUEEUE
D10.80-K500.34 ± 0.023 a0.048 ± 0.007 c0.015 ± 0.003 c
D12.60-K500.37 ± 0.019 a0.044 ± 0.009 c0.014 ± 0.002 c
D12.96-K500.34 ± 0.017 a0.047 ± 0.009 c0.015 ± 0.002 c
D10.80-K750.26 ± 0.022 bc0.063 ± 0.007 b0.020 ± 0.003 b
D12.60-K750.28 ± 0.016 b0.058 ± 0.006 bc0.018 ± 0.003 bc
D12.96-K750.26 ± 0.024 bc0.063 ± 0.005 b0.020 ± 0.002 b
D10.80-K1050.25 ± 0.021 c0.065 ± 0.004 b0.020 ± 0.003 b
D12.60-K1050.26 ± 0.017 bc0.063 ± 0.006 b0.020 ± 0.002 b
D12.96-K1050.20 ± 0.018 d0.081 ± 0.004 a0.026 ± 0.003 a
Note: The results are expressed by mean ± SD (n = 3), and treatments with different letters are significantly different at p ≤ 0.05.
Disclaimer/Publisher’s Note: The statements, opinions and data contained in all publications are solely those of the individual author(s) and contributor(s) and not of MDPI and/or the editor(s). MDPI and/or the editor(s) disclaim responsibility for any injury to people or property resulting from any ideas, methods, instructions or products referred to in the content.